

Abstract
Background
Poor quality of life, sleep problems, anhedonia, and negative metacognitions are common in anxiety and depression. To examine the nature of the relationship between these features and the role of metacognitions, anhedonia, and quality of life in anxiety and depression, we conducted a complex network analysis with items of self-report measures assessing quality of life, sleep, negative thinking styles, anxiety, and depression.
Methods
Participants were 226 treatment seeking individuals with a primary DSM-5 diagnosis of generalized anxiety disorder. Node centrality, strength, expected influence, community, and bridge estimation were calculated using partial correlation coefficients and glasso regularization.
Results
Results revealed that anhedonia was the most central node followed by quality of life nodes. Moreover, anhedonia exhibited the highest strength and expected influence, which were both stable, reliable metrics within the network. Metacognitions were not central nodes in the network, but were strong bridge symptoms between communities.
Limitations
The results are limited by the cross-sectional nature of the data and the administration of self-report scales at one time-point, despite different rating anchors.
Conclusion
These findings suggest that anhedonia is a crucial element for the association between quality of life, sleep problems, and negative cognitions.
Keywords: Network Analysis, Anhedonia, Metacognition, GAD
Introduction
Affective disorders, including anxiety disorders and depression, are associated with poor quality of life (QOL), longstanding functional impairment, and poor sleep quality (Mendlowicz & Stein, 2000; Olatunji, Cisler, & Tolin, 2007; Rapaport, Clary, Fayyad, & Endicott, 2005; Barrera & Norton, 2009; Fried & Nesse, 2014; Judd et al., 2000; Harvey, 2002; Jansson & Linton, 2006). Maladaptive cognitions are often considered important determinants for negative affect. According to Wells’ (1995) metacognitive model, clinically significant anxiety results from both positive and negative beliefs about worry, and beliefs about the uncontrollability of worry. Further, the model suggests that problematic worry in Generalized Anxiety Disorder (GAD) is due to negative beliefs about lack of control over worry and the dangers of worrying, which prompt worries about worrying (i.e., meta-worries; Wells, 1995; Wells & Carter, 2001). The metacognitive model also relates strongly to conceptualizations of depression and rumination (Papageorgiou & Wells, 2003). The connection between anxiety and depressive symptoms has also led to research exploring the transdiagnostic role of anhedonia and its connection to clinical outcomes such as quality of life and emotional style.
Current research on the role of metacognition in anxiety and depression is abundant and consistent with the original theory. A meta-analysis by Sun, Zhu, and So (2017) revealed large effect sizes for the subscales of the Metacognition Questionnaire in relation to psychiatric diagnoses of anxiety disorders (MCQ-30; Wells & Cartwright-Hatton, 2004), and more specifically, uncontrollability and danger of worry were most common in individuals with GAD. In addition, other correlational research suggests that metacognitive factors are associated with endorsement of symptoms of anxiety, depression, perceived stress, and sleep (Solem, Thunes, Hjemdal, Hagegn, & Wells, 2015; Yilmaz, Gencoz, & Wells, 2011; Spada, Nikcevic, Moneta, & Wells, 2008; Thielsch et al., 2015). For example, In a temporal cross- lagged analysis of metacognitions and sleep in GAD, Thielsh et al. (2015) reported that worrying frequently before bedtime predicted poorer sleep quality, and sleep quality the night before also predicted the frequency and amount of time spent worrying the next day. As such, extant literature corroborates the importance of connections between negative metacognitions and affective symptoms.
Extant research has also explored the role of anhedonia and worry in individuals with comorbid anxiety and depression (Fisher, Reeves, Lawyer, Medaglia, & Rubel, 2017; Winer, Bryant, Bartoszek, Rojas, Nadroff, & Kilgore, 2017; Berenbaum, Bredemeier, Thompson, & Boden, 2012). For example, Berenbaum and colleagues (2012) found individuals with comorbid anxiety and depressive symptoms exhibited “overwhelmed” emotional styles that correspond with avoidance. As such, the tendency to avoid problem-solving or emotional experiences may contribute to depressed mood and worry in a cyclical fashion (Berenbaum et al., 2012). The relationship between anxiety, anhedonia, and avoidance is further supported by Winer and colleagues (2017), who found that anxiety and depressive symptoms were related when enjoyment decreased due to avoidance, and that anhedonia played a key role in the emergence of these disorders over time. However, Fisher and colleagues (2017) used an idiographic, temporal network approach to study a comorbid depressed and anxious sample and found that anger and general positive and negative affect, not worry or depressed mood, were the most influential symptoms of patients’ individual networks. As such, it is important to clarify the relationship between anhedonia, worry, and metacognition within clinical samples.
There is a clear connection between affective symptoms, psychological disorders, and poor QOL, with these associations often accounting for a small to moderate portion of the variance in QOL outcomes (Rapaport et al., 2005). Further, QOL remains low in individuals with comorbid depression, compared to healthy controls, even after symptom remission post-treatment, perhaps due to this co-occurrence or other contextual factors (IsHak et al., 2011). The current literature to date has focused on measuring QOL as an outcome or correlate at the end of treatment (Mendlowicz & Stein, 2000; Olatunji et al., 2007; Rapaport et al., 2005; Barrera & Norton, 2009; Fried & Nesse, 2014; Judd et al., 2000). However, the relationship between anxiety, depression, QOL, and their connections to one another is likely more complex, for which network analysis is equipped to investigate (Borsboom, 2017) through interactions as opposed to pre/post designs.
The benefit of a network approach to studying psychopathology is that it does not rely on a latent disease model, which often assumes that anxiety and depressive symptoms are separate instead of interacting (Borsboom & Cramer, 2013; Hofmann, Curtiss, & McNally, 2016). The current study provides a unique opportunity to investigate syndromal factors, such as anhedonia and anxious symptoms, in the context of functional impairment (i.e., QOL) that may affect the relationships or symptom expression. An understanding of how functional impairment affects and interacts with the expression of current symptoms may further characterize the discrepant literature (Fisher et al., 2017; Berenbaum et al., 2012; Winer et al., 2017) and may elucidate the complex connection between QOL and comorbidity. As such, there is growing precedent for utilizing various network visualization tools, in cross-sectional and temporal networks, to draw conclusions about clinical data (for review, see Jones, Mair, & McNally, 2018). Although some research teams regard cross-sectional networks of psychopathology as unreliable (see Forbes, Wright, Markon, & Krueger, 2017; Steinley, Hoffman, Brusco, & Sher, 2017), Borsboom et al. (2017) and Epskamp, Borsboom, and Fried (2018) provide ample evidence to the contrary, while providing several analytic options for increasing reliability of cross-sectional results.
In accordance with these recommendations, the goal of the current study is to examine the network structure of negative metacognitions, affective symptoms, QOL, and sleep within a sample with primary GAD in order to better understand how these domains interact with one another. By including syndromal factors, such as sleep, affective symptoms, and metacognitions, and QOL in the network, we aim to investigate whether metacognitions or anhedonia are central to network in the context of broader life domains that may differentially activate the system (Borsboom, 2017). We are interested in whether metacognition plays a central role, or whether other syndromal factors such as anhedonia may exhibit greater connections. In addition, the present study will investigate whether QOL has an impact on the relationship between nodes.
Specifically, we will examine the connections between nodes (e.g., strength and expected influence), explore node centrality of key nodes (e.g., anhedonia), and identify symptoms that bridge node clusters together. The aims of this investigation are three-fold: 1) to understand the relationship between anxiety, depression, metacognition (i.e., a common component to both disorders), and functional impairment characterized by QOL, and sleep difficulties, 2) to use network analysis as a statistical tool to identify whether certain communities emerge within the overall network structure to reveal important relationships between attributes and domains, and 3) to examine the strength and impact of core symptoms in association with functional impairment and expression of syndromes using network stability and centrality estimations. Broader discussion of replication of results with extant literature will contribute to ongoing discussion of the utility of cross-sectional symptom networks.
Material and methods
The clinical trial was approved as Human Subject Research by the respective Institutional Review Boards of Boston University, Massachusetts General Hospital, and NYU Langone. All participants provided written informed consent.
Participants
The participants in this study were part of a larger NIH funded randomized control study comparing the effectiveness of cognitive behavioral therapy (CBT), yoga, and stress education (SE) for GAD (ClinicalTrials.gov: NCT01912287). In this study, 226 adults (M age 33; SD = 14; 70% female) with a primary diagnosis of GAD were randomized to 12 weeks of one of the three group treatment conditions (see Hofmann et al., 2015 for protocol details). The current study analyzed baseline data collected prior to treatment assignment.
Key eligibility criteria included a primary psychiatric diagnosis of DSM-5 GAD (Diagnostic and Statistical Manual of Mental Disorders; American Psychiatric Association, 2013) and a CGI-severity score of 4 or higher (Clinical Global Impression Scale; Berk et al., 2008). Exclusion criteria included a diagnosis of posttraumatic stress disorder, substance use disorder, eating disorder, or organic mental disorder in the past 6 months, lifetime diagnosis of psychotic disorder, bipolar disorder, or developmental disorder, as well as or notable experience with yoga, CBT, or mind-body techniques. Study recruitment took place across two separate sites from April, 2014 to December, 2018 in Massachusetts. For a comprehensive overview of inclusion/exclusion criteria and study procedures, please refer to Hofmann et al., 2015.
Measures
Structured Clinical Interviews.
To determine the presence of GAD and absence of exclusionary diagnoses, the Structured Clinical Interview for DSM-IV-TR (SCID; First, Spitzer, Gibbon, & Williams 2002) or Adult Diagnostic Interview Schedule for DSM-5 (ADIS-5; Brown & Barlow, 2014) was administered by trained independent evaluators.
Metacognitions Questionnaire (MCQ).
The Metacognitions Questionnaire (MCQ; Cartwright- Hatton & Wells, 1997) is a 65-item instrument comprised of 5 subscales used to assess meta-cognitive beliefs people have about their thinking styles. The subscales include positive and negative beliefs about worry, cognitive confidence, superstitions about worrying, and selective attention to worry thoughts. Higher scores indicate stronger negative metacognitions. Within this sample, the reliability was excellent (Cronbach’s α = 0.94).
Insomnia Severity Index (ISI).
The Insomnia Severity Index (ISI; Bastien, Vallieres, &Morin 2001) is a 7-item instrument that assesses symptoms of insomnia, including sleep maintenance, satisfaction with sleep patterns, distress as a result of sleep, and interference in daily functioning. A higher score indicates more severe insomnia. The ISI exhibited excellent reliability (Cronbach’s α = 0.88).
World Health Organization Quality of Life Instrument (WHOQOL-BREF).
The Quality of Life Scale (WHOQOL-BREF; Henman et al., 1998) is a 26 item scale that assesses quality of life and satisfaction across four domains: physical health, psychological health, social relationships, and environment. In this study, focus was placed on psychological and physical aspects of life. Higher scores indicate better quality of life. Scale reliability for this measure was good within this sample (Cronbach’s α = 0.76).
Beck Depression Inventory—Version II (BDI-II).
The BDI-II (Beck, Steer, & Brown, 1996) contains 21 items that assess severity of depression symptoms in psychiatric populations with historically high internal consistency and test-retest reliability. Higher scores indicate more severe depressive symptoms. Reliability was similarly high in our sample, with a Cronbach’s α of 0.92.
Beck Anxiety Inventory (BAI).
This 21-item self-report inventory (Beck, Epstein, Brown, & Steer, 1988) is designed to measure the severity of anxiety symptoms in psychiatric populations and has high internal consistency and test–retest reliability (Cronbach’s α in the current sample = 0.88). Higher scores indicate higher levels of anxiety. See Table 1 for scale and subscale means and standard deviations for all measures used in this study.
Table 1.
Scale and Subscale Means and Standard Deviations
| Questionnaire/Subscale | Mean(SD) |
|---|---|
| ISI | 12.68(6.57) |
| QOL Physical | 24.12(4.46) |
| QOL Psychological | 17.10(3.76) |
| BDI-II | 15.65(10.31) |
| BAI | 16.09(9.56) |
| MCQ Uncontrollability and Danger | 45.12(9.86) |
| MCQ Negative Beliefs | 27.23(8.10) |
Data Analytic Strategy
Network structure.
Items from the five self-report questionnaires are represented as nodes in our network. Because the total number of items was relatively large (140 items), measures were taken to address the concern that some items might assess the same construct, thus creating redundant nodes in the network. Redundant nodes can create estimation problems of partial correlation coefficients as a consequence of multicollinearity. To eliminate redundant nodes, we utilized the Goldbricker algorithm (Jones, 2017) to identify and remove redundant nodes. This novel function determines whether two nodes are redundant by comparing their correlation patterns with other nodes in the network. If the two nodes exhibit very similar correlation patterns with other nodes in the network, then they might be redundant. After applying this procedure, theoretical considerations were used to determine which items best represent their respective constructs. For the MCQ, items were selected from the negative beliefs and beliefs about uncontrollability of worry subscales based on prior literature that supports that these beliefs are most prevalent and highest in individuals with GAD (Sun et al., 2017; Wells & Carter, 2001; Solem et al., 2015; Yilmaz et al., 2011; Spada et al., 2008). From the ISI, the sleep node was chosen because the item it represents explicitly measures sleep quality and difficulties. BAI and BDI items were chosen based on prior network research that showed strong connections between these items within samples of clinically anxious and depressed individuals (Beard et al., 2016; Bringmann, Lemmens, Huibers, Borsboom, & Tuerlinckx, 2015). Items chosen to represent QOL were selected from the physical and psychological QOL subscales in order to focus on functional impairment that is associated with anxiety symptomology. Table 2 displays the final set of 21 nodes that were chosen and represented in the network. Table 3 contains item level means and standard deviations. We utilized the R package qgraph (Epskamp et al., 2012) to estimate the network structure of the resulting 21 nodes using partial correlations. Furthermore, in order to reduce edges that are most likely spurious correlations, we used the graphical lasso (glasso) regularization procedure (Tibshirani, 1996; Friedman, Hastie, & Tibshirani, 2008), which is an algorithm that reduces all network edges, effectively setting some to 0, reducing the network to as few edges as necessary, and thus leading to a more parsimonious network.
Table 2.
Final set of nodes chosen to represent the network.
| Node | Questionnaire | Item |
|---|---|---|
| Sleep | ISI | To what extent do you consider your sleep problem to INTERFERE with your daily functioning (e.g. daytime fatigue, ability to function at work/daily chores, concentration, memory, mood, etc.)? |
| Daily acts | QOL | How satisfied are you with your ability to perform your daily living activities? |
| Work | QOL | How satisfied are you with your capacity for work? |
| Self | QOL | How satisfied are you with yourself? |
| Sad | BDI-II | Sadness |
| Guilt | BDI-II | Guilt |
| Confidence | BDI-II | Confidence |
| Anhedonia | BDI-II | Anhedonia (i.e., loss of interest) |
| B | BDI-II | Concentration |
| Concentrate | ||
| Relax | BAI | Unable to relax |
| Fear worst | BAI | Fear the worst happening |
| Nervous | BAI | Nervous |
| Scared | BAI | Scared |
| Control me | MCQ Uncontrollability and Danger | If I let my worrying thoughts get out of control, they will end up controlling me |
| M Concentrate | MCQ Uncontrollability and Danger | My thoughts interfere with my concentration |
| Worry | MCQ Uncontrollability and Danger | I worry about my thoughts |
| Stronger | MCQ Uncontrollability and Danger | I would be a stronger person if I could worry less |
| Should control | MCQ Negative Beliefs | I should be in control of my thoughts all of the time |
| Return | MCQ Negative Beliefs | If I do not stop worrying thoughts, they could come back |
| Function | MCQ Negative Beliefs | If I could not control my thoughts, I would not be able to function |
| Responsible | MCQ Negative Beliefs | If a bad thing happens which I have not worried about, I feel responsible |
Table 3.
Means and Standard Deviations of Items Chosen to Represent Nodes
| Node | Questionnaire | Mean(SD) |
|---|---|---|
| Sleep | ISI | 2.21(1.18) |
| Daily Acts | QOL | 3.13(1.08) |
| Work | QOL | 3.06(1.12) |
| Self | QOL | 2.71(1.03) |
| Sad | BDI-II | 0.51(0.63) |
| Guilt | BDI-II | 0.84(0.79) |
| Confidence | BDI-II | 0.84(0.91) |
| Anhedonia | BDI-II | 0.67(0.77) |
| B Concentrate | BDI-II | 1.12(0.76) |
| Relax | BAI | 1.77(0.71) |
| Fear Worst | BAI | 1.53(0.95) |
| Nervous | BAI | 1.80(0.80) |
| Scared | BAI | 0.98(0.94) |
| Control me | MCQ Uncontrollability and Danger | 2.82(1.04) |
| M Concentrate | MCQ Uncontrollability and Danger | 3.12(0.87) |
| Worry | MCQ Uncontrollability and Danger | 2.45(1.02) |
| Stronger | MCQ Uncontrollability and Danger | 3.15(1.01) |
| Should control | MCQ Negative Beliefs | 2.63(1.01) |
| Return | MCQ Negative Beliefs | 2.27(1.03) |
| Function | MCQ Negative Beliefs | 2.04(0.99) |
| Responsible | MCQ Negative Beliefs | 1.87(1.07) |
Centrality measures.
Strength, closeness, betweenness, and expected influence were computed as centrality indices of the symptoms. Node strength is a common metric that refers to the sum of the absolute values of all edges corresponding to a node (Epskamp, Borsboom, & Fried, 2017). Closeness measures how close a node is to all other nodes and betweenness quantifies the number of times a node was situated on the shortest path between nodes. (Opsahl, Agneessens, & Skvoretz, 2010). Lastly, expected influence is a centrality measure that considers the sign of the partial correlations determining the strength of a node’s associations (Robinaugh, Millner, & McNally, 2016).
Community analysis.
Communities, or clusters, are groups of nodes that are more densely connected to each other than with nodes outside of their community. We used the spinglass algorithm in igraph to calculate the number of clusters in our network. To identify nodes that might be bridge nodes, or nodes that connect two communities, we computed bridge expected influence (BEI; Heeren, Jones, & McNally 2018), a parameter that assesses the expected influence of a node of one community on nodes of another community, using the bridge function in networktools (Jones, 2017). A high BEI suggests that node as a potential “bridge symptom,” which can transmit activation from one community to another (Cramer, Waldorp, van der Maas, & Borsboom, 2010; Fried and Cramer, 2017; Heeren, Jones, & McNally 2018). That is, bridge nodes are the nodes by which other clusters of symptoms connect to each other.
Network stability analysis.
To estimate network stability, the R package bootnet was utilized to assess three measures of stability. First, the accuracy of edge weights was assessed using non-parametric bootstrapping, where observations are resampled with replacement, resulting in bootstrapped 95% confidence intervals (CI) for each sample value. The stability of centrality indices was assessed by correlating each centrality index’s order with the order obtained after proportions of the data were dropped. Lastly, a difference test was run to determine whether there were significant differences between edge-weights in the network. See supplementary materials for methods and results.
Results
Network Structure
Figure 1 depicts the network containing 21 symptom nodes for the 226 participants and Figure 2 shows the centrality measures. The two strongest positive edges were between (1) QOL nodes “satisfaction with capacity for work” (Work) and “satisfaction with ability to perform daily activities” (Daily acts; 0.47), and (2) BDI symptoms “sadness” (Sad) and “anhedonia” (Anhed; 0.39). The strongest negative edge was between BDI node for “self-perception” (Confidence; e.g. the BDI item whose response choices range from “I am confident in myself” or “I dislike myself”) and “satisfaction with oneself” (Self; −.35). The BAI nodes exhibited stronger connections to each other than any other nodes in the network (edges range from 0.27-0.29, largest outward edge is −.1). The strongest connection involving sleep quality (Sleep) was a negative edge to QOL “satisfaction with ability to perform daily acts” (Daily acts; −.19).
Figure 1.
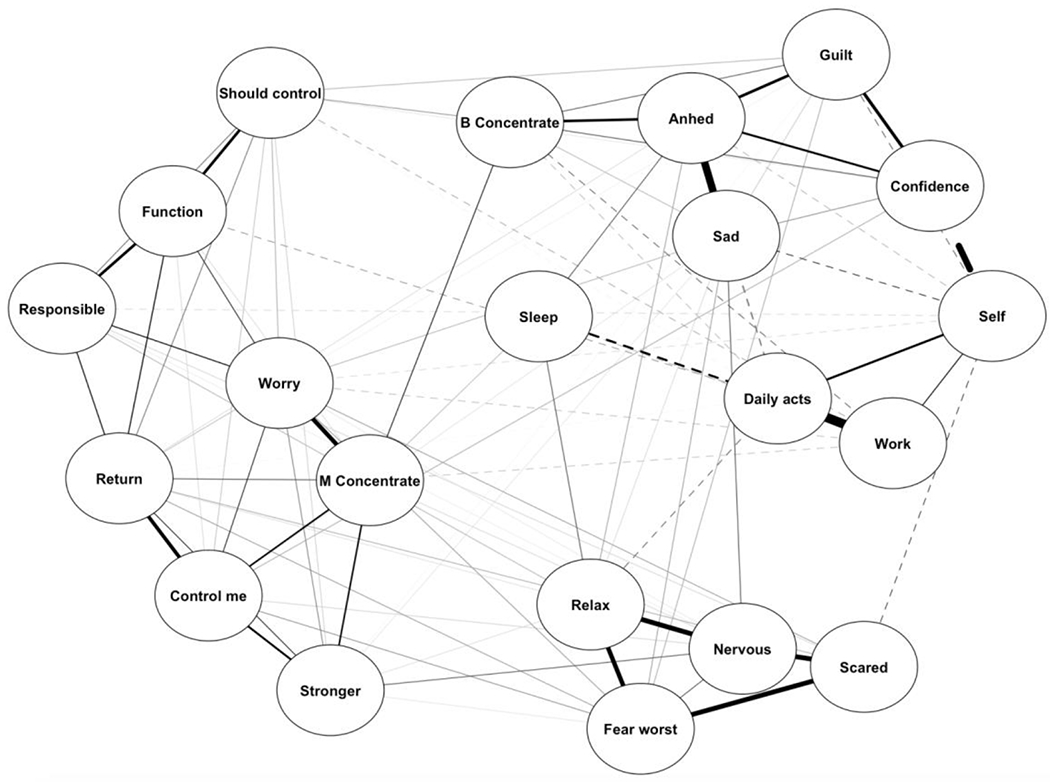
displays the network structure of metacognition, sleep, QOL, anxiety, and depression nodes, with dotted lines representing negative coefficients.
Figure 2.
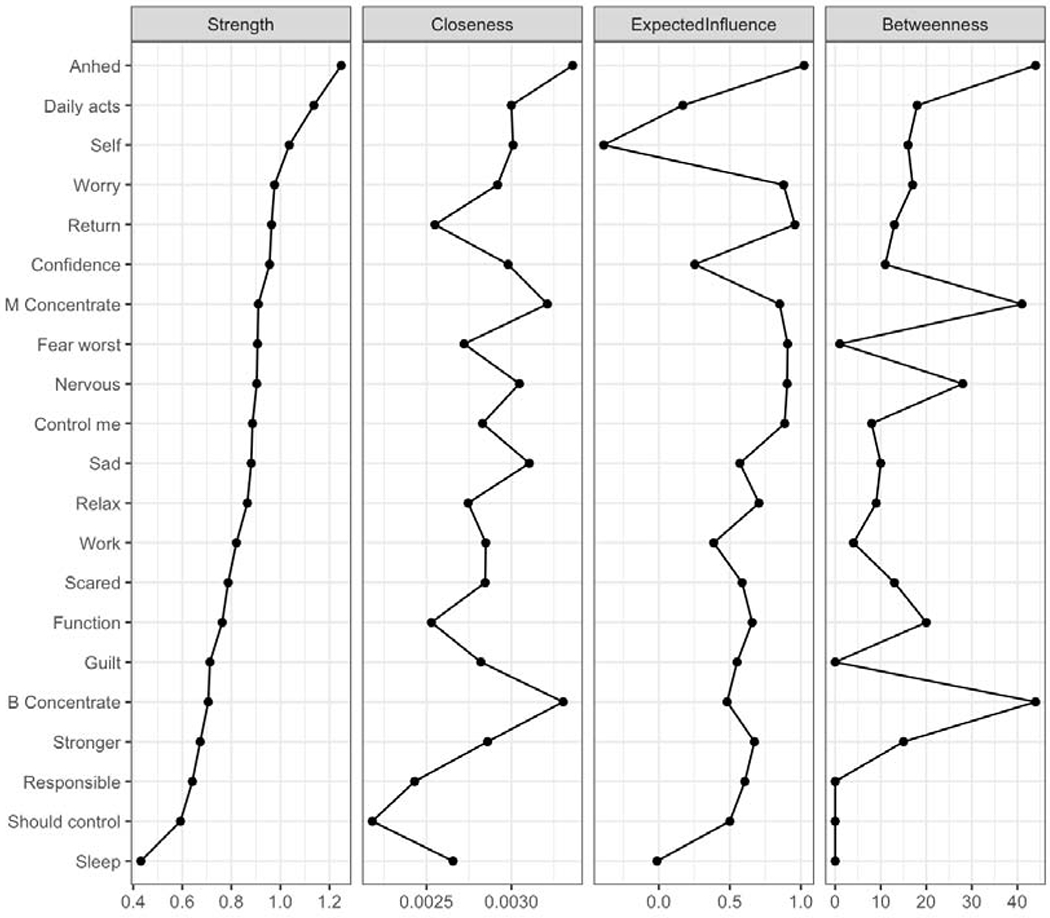
displays the raw data for the centrality metrics of each node in the network.
Centrality and network stability analysis
Centrality indices are shown in Figure 2. Overall, the most central symptom in the network was anhedonia (Anhed; strength=2.15), followed by one’s ability to perform daily living activities and one’s satisfaction with oneself (Daily acts; strength=1.55 and Self; strength=1.01). Sleep difficulties (Sleep) interfering with functioning was the least central node. The most central metacognition symptoms were “I worry about my thoughts” (Worry; strength=0.68) and “If I do not stop worrying thoughts, they could come back” (Return; strength=0.62).
Nodes with high expected influence in either the positive or negative direction display the highest connectivity with other nodes. Anhedonia (Anhed) exhibited the highest expected influence in the positive direction (EI=1.02) within our network. For network edges, the bootstrap confidence intervals showed fairly high stability. Centrality index stabilty tests showed that strength and expected influence can be interpreted as stable indices, suggesting that anhedonia and QOL are important, robust factors in the expression of GAD symptoms. While anhedonia and concentration (B concentrate) exhibited the highest betweenness and closeness (Figure 2), these centrality measures showed poor stability and should be interpreted with caution. The poor stability of these measures is consistent with previous literature (Beard et. al. 2016, Eskamp, Borsboom, & Fried 2018). Lastly, the difference test for the strength centrality index showed that the strength of anehdonia was significantly larger than most other nodes. (See Supplemental Material).
Community analysis
The examination of symptom clusters using the spinglass algorithm identified five core communities or clusters. One community consisted of the depression and sleep items (Sadness, Anhedonia, Guilt, Confidence, Concentration from the BDI-II and Sleep from the ISI). The QOL items formed a second community (Daily acts, Work, and Self), and BAI items formed a third community (Relax, Fear worst, Nervous, and Scared). The fourth and fifth communities were formed between two subsets of the chosen MCQ nodes (Control me, Should control, Return, M Concentrate, Function and Worry, Responsible, Stronger). Interestingly, the MCQ communities did not completely cluster according to their original subscales (i.e., negative beliefs and uncontrollability of worries). The first MCQ community contained the following items: “I worry about my thoughts” (Worry), “if I let my worrying thoughts get out of control, they will end up controlling me” (Control Me), “if I do not stop worrying thoughts, they could come back” (Return), “I would be a stronger person if I could worry less” (Stronger) and “my thoughts interfere with my concentration” (M Concentrate). The second MCQ cluster included 3 items: “if a bad thing happens which I have not worried about, I feel responsible” (Responsible), “I should be in control of my thoughts all the time” (Should Control), and “if I could not control my thoughts, I would not be able to function” (Function). The MCQ communities mostly clustered according to their original subscales (i.e., negative beliefs and uncontrollability of worries), with the exception of Return, which clustered with uncontrollability of worries items, rather than the other negative beliefs items. See Supplemental Materials for figure of network communities in color.
Bridge symptoms amongst five communities serve as nodes that connect one cluster to the others. Analyses from the bridge function identified the metacognitive belief “If I do not stop (or suppress) my worrying thoughts, they could come back” (Return) as the strongest bridge node (BEI=0.48) between communities. “I worry about my thoughts” (Worry) and “If a bad thing happens which I have not worried about, I feel responsible” (Responsible) were also strong bridge symptoms (BEI=0.39 and 0.32, respectively; Figure 3). Thus, in the present analyses, metacognitive beliefs represent nodes that connect other symptom communities together (i.e., depression, anxiety, QOL).
Figure 3.
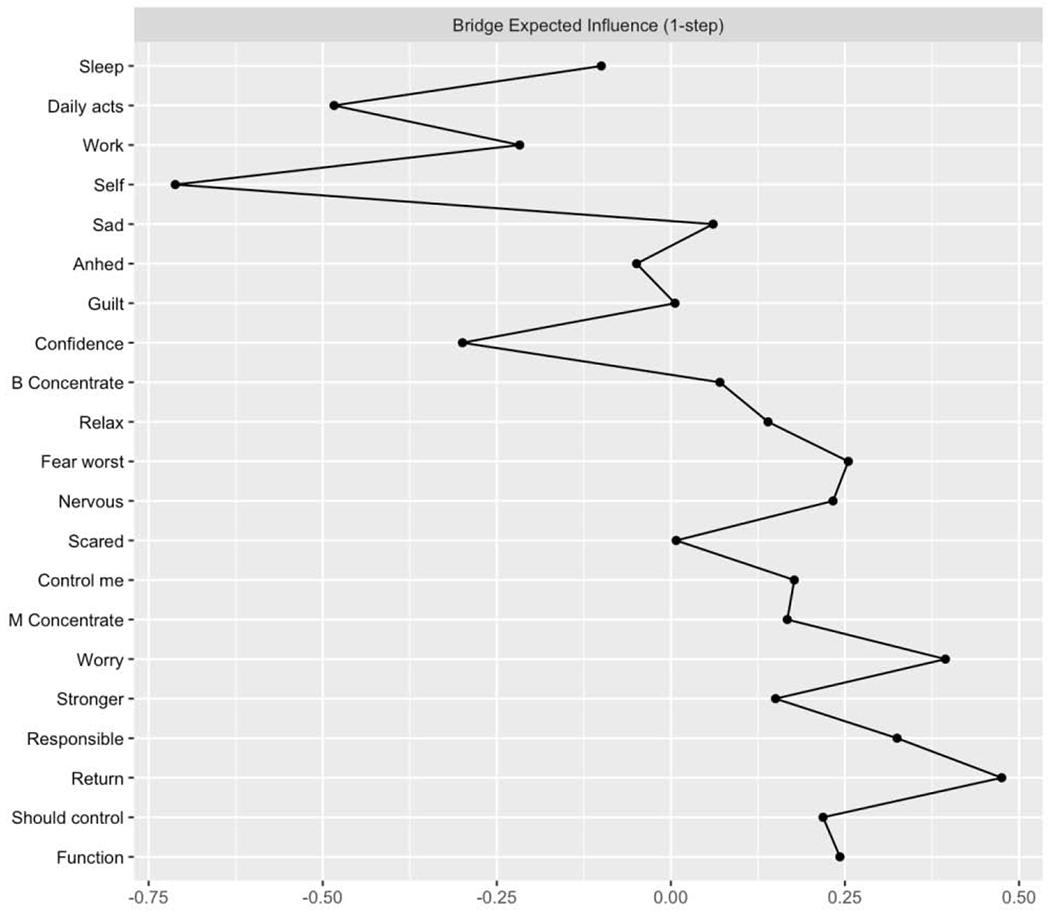
displays the raw data for bridge expected influence (BEI) of each node in the network.
Discussion
To examine the nature and role of QOL, sleep problems, affective symptoms and metacognition in anxiety and depression, we conducted a complex network analysis with specific self-reported symptom data from 226 individuals meeting DSM-5 criteria for primary GAD. Although the primary diagnosis of our sample was GAD, the node representing anhedonia (e.g., loss of interest) exhibited the highest strength and expected influence in the positive direction (e.g., most connected with strongest impact), relative to other nodes in the network, followed by QOL indices. Results pertaining to anhedonia and QOL are bolstered by bootstrapped results indicating the stability of this centrality index within the network, further supporting the consistent role of anhedonia across symptoms in adults with a primary diagnosis of GAD. Negative metacognitive beliefs were not highly central or related to other anxiety and depressive symptoms, relative to other nodes, as would be suggested by Metacognitive Theory (Wells, 1995; Papageorgiou & Wells, 2003; Wells & Carter, 2001; Sun et al., 2017).
The strength of anhedonia and QOL nodes is indicative of the importance of anhedonia as a central connection between various symptoms of anxiety, and supports research on incremental worsening of QOL, functioning, and the impairment associated with comorbidity (Fried & Nesse 2014; Judd et al., 2000; Barrera & Norton, 2009; Henning, Turk, Mennin, Fresco, & Heimberg, 2007; Rapaport et al., 2005; IsHak et al., 2011). These results also confer with recent recommendations to replicate cross-sectional network findings across different samples. Namely, it has been previously shown that sadness and anhedonia symptoms from the BDI-II exhibited the strongest edges within a network of depressed and anxious individuals (Beard et al., 2016), suggesting that these symptoms relate most strongly to other affective symptoms across disorders. Our findings replicate this finding using a different sample within a research outpatient setting as opposed to a partial hospitalization program, which increases the validity of the findings in relation to anhedonia. In addition, the finding that BAI symptoms connected more to each other than to other nodes in the current network is in line with findings by Beard and colleagues (2016) suggesting that GAD symptoms are highly connected. In consideration of the interconnectedness of GAD-related constructs across different studies using diverse measures of anxiety, one can be more certain that the results are consistent with the diagnostic construct of GAD symptoms.
Although the strength of metacognitive nodes was moderate to high, they were primarily clustered tighly together and did not exhibit strong connections to other affective symptom nodes. While it is plausible that clustering within scales may be due to construct similarity, our implementation of the Goldbricker analysis to eliminate redundant nodes increases the likelihood that this result is due to diagnostic or symptom-related relationships. However, it is also possible that the lack of notable connections between MCQ items and other nodes in the network may be a function of the items chosen to represent the construct. The negative beliefs and uncontrollability subscales of the MCQ (full version) relate most strongly to GAD and depression; however, the creation of the short form of the MCQ (30 items; Wells & Cartwright-Hatton, 2004) reveals that the negative belief and uncontrollability items were actually formed into one subscale. Interestingly, the items from this network analysis would actually fall into the “need to control thoughts” subscale on the MCQ-30. Therefore, if negative beliefs and perceptions of control are more connected to each other and within the construct of metacognition itself, these nodes may show a similar pattern to the current study, such that the nodes would cluster more together than connect with others.
Overall, metacognition within the network is clearly a key construct within which other clusters are connected, but results do not implicate metacognitive clusters as being the most central or influential at baseline. However, it is important to note that the MCQ item pertaining to fears of not being able to stop worries was the strongest bridge symptom between the other four symptom communities in the network. This points to worry and meta-worry as underlying mechanisms of depression and anxiety (Wells 1995; Papageorgiou & Wells, 2003; Wells & Carter, 2001).
Regarding QOL, the edges between satisfaction with working ability and ability to engage in daily activities were the strongest of the entire network over and above depressive and anxious symptom connections. If one considers QOL to operate as a factor that differentially impacts syndromes (Borsboom, 2017), it may be that a strong connection between two components of positive well-being may operate separate from, or buffer against negative affect, which could explain why it was the strongest connection within the network as opposed to symptom relationships. Not surprisingly, there was a moderate negative association between self-perception measured by the BDI-II and satisfaction with oneself on the WHOQOL-BREF. Both edges were shown to be significantly different from all other edges in the network (see Supplemental Materials), lending to the clinical significance of these findings. This link between depressive cognitions and subjective satisfaction with oneself supports the notion that depressive cognitions are not only generalized to situations or statements about others, but to negative beliefs about oneself as well. This is consistent with Beck’s Cognitive Triad (Beck, 1987) in the context of affective disorders, and with Fried and Nesse’s (2014) results, which showed that sadness was most related to QOL in depression.
Overall, the hypothesized connections between sleep difficulties, QOL, affective symptoms, and metacognition were largely unsupported given that the strongest edge pertaining to sleep and work satisfaction was small and that the sleep node was the least central in the network overall. These results replicate Beard et al.’s (2016) finding that sleep problems were not strong bridge symptoms between other symptom clusters. However, it is possible that analysis of items pertaining to difficulty intitiating sleep may provide different results, based on Blanken et al. (2019), who found this to be predictive of first-onset depression in their longitudinal research.
Although negative metacognitions are important contributors to GAD and affective disorders, overarching QOL impairments, loss of interest (anhedonia) and negative self-satisfaction emerge as key, stable features for further inquiry and treatment, based on this network. Anhedonia may be central in the network because it connects transdiagnostic experiences between anxiety and depression, such as “overwhelmed” emotional style, avoidance behaviors, and loss of interest (Winer et al., 2017; Berenbaum et al., 2012). Further interpretation of these findings may be that most of the metacognition nodes mention the self, but within the context of worry thoughts and general control. However, anhedonia, sadness, and life satisfaction more broadly focus on how the lack of control over worries or the other symptoms actually impact QOL and well-being. Thus, while it is important to discuss what symptoms and negative-thinking patterns are occurring, within this network of symptoms, it appears to be crucial to address how it is impacting life satisfaction and functioning as well. These results highlight the importance and complexity of the relationship between QOL and psychopathology.
Overall, the current study has numerous strengths which are worth addressing. To our knowledge, this study was the first to examine the potential relationships between negative metacognitions, QOL, sleep, and affective symptoms within one comprehensive study at the network and symptom level. Thus, although limited as cross sectional, the findings from this research suggest the potential importance of assessing and treating QOL and life satisfaction in addition to anhedonia, even in samples where depression is not primary. Secondly, these data more accurately represent the level of comorbidity seen across emotional disorders, and as a result, findings may be more generalizable across symptom presentations. Indeed, the current study’s results surrounding anhedonia and clustered anxiety nodes replicate Beard et al. (2016), despite distinct measurement instruments and clinical severity, which speaks to the validity of findings across samples. Finally, the utilization of a network approach to studying psychopathology is a strength given that it allows for symptom-level interpretations with less rigidity imposed by traditional statistical methodologies (Borsboom & Cramer, 2013; Hoftnann, Curtiss, & McNally, 2016).
Limitations
The results are limited by the cross-sectional nature of the data. Therefore, the connections between nodes and within the network as a whole cannot be interpreted as causal or directional. The cross-sectional nature of this network further disallows interpretations about the stability of nodes or connections over time as well as precludes interpretations about treatment effects on symptoms and QOL. Another limitation is that the questionnaires were administered at the same timepoint (i.e., treatment baseline). Each self-report instrument also measured symptoms based on different time anchors ranging from “past week” and “past four weeks”, to “in general”. As such, the connection between nodes within the network may also be due to differences in the measures used rather than due to symptom phenomena. Future studies should explore the temporal associations between anxiety and depressive symptoms and may benefit from using multimodal assessment tools or self-reports that better control for a specific timeframe to address these limitations. Future work may also explore the network dynamics from pre- to post-treatment on QOL domains within this sample as a function of CBT and may shed light on the ways in which metacognitive nodes and symptoms could be more influential over time.
Conclusion
Overall, the strength and expected influence of anhedonia and QOL metrics as opposed to metacognitive items suggests that treatment that incorporates interventions for increasing life satisfaction, functioning, and motivation may be helpful and should be further studied longitudinally with these network approaches. However, it is also possible, given that all data collection occurred at baseline, that the main impacts of metacognition as a mechanism of change are simply not present yet. In other words, a mechanism of treatment may not be captured at baseline but rather, may emerge at another point of assessment during treatment. Indeed, mediators that are analyzed with time as a covariate often fail to show significance, and the statistical requirement that a mediator must be assessed before a clinically significant outcome does not account for the fact that change is incremental (Kraemer, Wilson, Fairburn, & Agras, 2002; Su, Carpenter, Zandberg, Zimpson, & Foa, 2016). As such, if change has not occurred in the sample yet and the network inherently considers time (e.g., baseline), it is plausible that metacognitions may play a more substantial role in affecting other nodes given a different time period of assessment (e.g., mid- or post-treatment). Thus, it is important to interpret the results of this network analysis with the acknowledgement that the sample has not undergone treatment at the point of data collection, and that future research should examine the dynamic network structure and changes to these symptom domains during and after treatment.
Supplementary Material
Highlights.
Anhedonia was the most central node with high strength and expected influence
Edges between working ability and satisfaction with work exhibited high strength
Negative metacognitive beliefs were not highly central nodes in the network
Anhedonia and quality of life are important to study within comorbid GAD
Acknowledgements
We warmly thank all those who were involved in the creation, implementation, and disseminations of this research trial and its evolving results.
Role of Funding Source
This research is supported by NIH/NCCIH (R01AT007257) to Stefan G. Hofmann, Ph.D. and (1R01AT007258-01A1) to Naomi M. Simon, M.D., M.Sc.
DECLARATIONS OF INTEREST:
Dr. Hofmann receives financial support from the Alexander von Humboldt Foundation and compensation for his work as editor from SpringerNature and the Association for Psychological Science. He also receives compensation for this role as an advisor from the Palo Alto Health Sciences and for his work as a Subject Matter Expert from John Wiley & Sons, Inc. and SilverCloud Health, Inc.
Footnotes
Publisher's Disclaimer: This is a PDF file of an unedited manuscript that has been accepted for publication. As a service to our customers we are providing this early version of the manuscript. The manuscript will undergo copyediting, typesetting, and review of the resulting proof before it is published in its final form. Please note that during the production process errors may be discovered which could affect the content, and all legal disclaimers that apply to the journal pertain.
References
- Barrera TL, & Norton PJ (2009). Quality of life impairment in generalized anxiety disorder, social phobia, and panic disorder. Journal of Anxiety Disorders, 23, 1086–1090. 10.1016/j.janxdis.2009.07.011 [DOI] [PMC free article] [PubMed] [Google Scholar]
- Bastien CH, Vallières A, & Morin CM (2001). Validation of the Insomnia Severity Index as an outcome measure for insomnia research. Sleep Medicine, 2, 297–307. 10.1016/S1389-9457(00)00065-4 [DOI] [PubMed] [Google Scholar]
- Beard C, Millner AJ, Forgeard MJC, Fried EI, Hsu KJ, Treadway MT, … Björgvinsson T (2016). Network analysis of depression and anxiety symptom relationships in a psychiatric sample. Psychological Medicine, 46, 3359–3369. 10.1017/S0033291716002300 [DOI] [PMC free article] [PubMed] [Google Scholar]
- Beck AT (1987). Cognitive models of depression. Journal of Cognitive Psychotherapy: An International Quarterly, 1,5–37 [Google Scholar]
- Beck AT, Epstein N, Brown G, & Steer RA (1988). An inventory for measuring clinical anxiety: Psychometric properties. Journal of Consulting and Clinical Psychology, 56, 893–897. [DOI] [PubMed] [Google Scholar]
- Beck AT, Steer RA, & Brown GK (1996). Beck Depression Inventory-II. Psychological Corporation, San Antonio, TX. [Google Scholar]
- Berenbaum H, Bredemeier K, Thompson RJ, & Boden MT (2012). Worry, anhedonic depression, and emotional styles. Cognitive Therapy and Research, 36(1), 72–80. DOI 10.1007/sl0608-010-9329-8 [DOI] [Google Scholar]
- Berk M, Ng F, Dodd S, Callaly T, Campbell S, Bernardo M, & Trauer T (2008). The validity of the CGI severity and improvement scales as measures of clinical effectiveness suitable for routine clinical use. Journal of Evaluation in Clinical Practice, 14, 979–983. [DOI] [PubMed] [Google Scholar]
- Blanken TF, Borsboom D, Penninx BW, & Van Someren EJ (2019). Network outcome analysis identifies difficulty initiating sleep as a primary target for prevention of depression: a 6-year prospective study. Sleep, 10.1093/sleep/zsz288 [DOI] [PMC free article] [PubMed] [Google Scholar]
- Borsboom D (2017). A network theory of mental disorders. World psychiatry, 16(1), 5–13. 10.1002/wps.20375 [DOI] [PMC free article] [PubMed] [Google Scholar]
- Borsboom D, & Cramer AOJ (2013). Network analysis: An integrative approach to the structure of psychopathology. Annual Review of Clinical Psychology, 9, 91–121. 10.1146/annurev-clinpsy-050212-185608 [DOI] [PubMed] [Google Scholar]
- Bringmann LF, Lemmens LHJM, Huibers MJH, Borsboom D, & Tuerlinckx F (2015). Revealing the dynamic network structure of the Beck Depression Inventory-II. Psychological Medicine, 45, 747–757. [DOI] [PubMed] [Google Scholar]
- Brown TA, & Barlow DH (2014). Anxiety and Related Disorders Interview Schedule for DSM-5 (ADIS-5L).: Lifetime Version Client Interview Schedule. Oxford University Press. [Google Scholar]
- Cartwright-Hatton S & Wells A (1997). Beliefs about Worry and Intrusions: The Meta-Cognitions Questionnaire and its Correlates. Journal of Anxiety Disorders, 11(3), 279–296. 10.1016/S0887-6185(97)00011-X [DOI] [PubMed] [Google Scholar]
- Cohen J (1977). Statistical power analysis for the behavioral sciences. New York: Academic Press. [Google Scholar]
- Cramer AOJ, Waldorp L, van der Maas HLJ, & Borsboom D (2010). Comorbidity: A network perspective. Behavioral and Brain Sciences, 33, 137–193. [DOI] [PubMed] [Google Scholar]
- Epskamp S, Borsboom D, & Fried EI (2018). Estimating psychological networks and their accuracy: A tutorial paper. Behavior Research Methods, 50, 195–212. [DOI] [PMC free article] [PubMed] [Google Scholar]
- Epskamp S, Cramer AO, Waldorp LJ, Schmittmann VD, & Borsboom D (2012). qgraph: Network visual- izations of relationships in psychometric data. Journal of Statistical Software, 48(4), 1–18. [Google Scholar]
- First MB, Spitzer RL, Gibbon M, & Williams JBW (2002). Structured Clinical Interview for DSM-IV-TR Axis I Disorders, Reaserch Version, Patient Edition with Psychotic Screen (SCID-I/PW/PSY SCREEN) Biometrics Research. New York State Psychiatric Institute, New York. [Google Scholar]
- Fisher AJ, Reeves JW, Lawyer G, Medaglia JD, & Rubel JA (2017). Exploring the idiographic dynamics of mood and anxiety via network analysis. Journal of abnormal psychology, 126(8), 1044–1056. 10.1037/abn0000311 [DOI] [PubMed] [Google Scholar]
- Forbes MK, Wright AG, Markon KE, & Krueger RF (2017). Further evidence that psychopathology networks have limited replicability and utility: Response to Borsboom et al.(2017) and Steinley et al.(2017). Journal of Abnormal Psychology, 126, 1011–1016. doi: 10.1037/abn0000313 [DOI] [PMC free article] [PubMed] [Google Scholar]
- Fried EI, & Nesse RM (2014). The Impact of Individual Depressive Symptoms on Impairment of Psychosocial Functioning. PLoS ONE, 9, e90311 10.1371/journal.pone.0090311 [DOI] [PMC free article] [PubMed] [Google Scholar]
- Fried EI, & Cramer AO (2017). Moving forward: challenges and directions for psychopathological network theory and methodology. Perspectives on Psychological Science, 12, 999–1020. [DOI] [PubMed] [Google Scholar]
- Friedman J, Hastie T, & Tibshirani R (2008). Sparse inverse covariance estimation with the graphical lasso. Biostatisites, 9, 432–441. [DOI] [PMC free article] [PubMed] [Google Scholar]
- Harvey AG (2002). A cognitive model of insomnia. Behaviour Research and Therapy, 40, 869–893. 10.1016/s0005-7967(01)00061-4 [DOI] [PubMed] [Google Scholar]
- Heeren A, Jones PJ, & McNally RJ (2018). Mapping network connectivity among symptoms of social anxiety and comorbid depression in people with social anxiety disorder. Journal of Affective Disorders, 228, 75–82. [DOI] [PubMed] [Google Scholar]
- Henning ER, Turk CL, Mennin DS, Fresco DM, & Heimberg RG (2007). Impairment and quality of life in individuals with generalized anxiety disorder. Depression and Anxiety, 24, 342–349. 10.1002/da.20249 [DOI] [PubMed] [Google Scholar]
- Herrman H, Schofield H, Murphy Z, Metelko S, Szabo M, & Pibernik-Okanovic, et al. (1998). Development of the World Health Organization WHOQOL-BREF quality of life assessment. Psychological Medicine, 28, 551–558. [DOI] [PubMed] [Google Scholar]
- Hofmann SG, Curtiss J, Khalsa SBS, Hoge E, Rosenfield D, Bui E, … Simon N (2015). Yoga for Generalized Anxiety Disorder: Design of a Randomized Controlled Clinical Trial. Contemporary Clinical Trials, 44, 70–76. 10.1016/j.cct.2015.08.003 [DOI] [PMC free article] [PubMed] [Google Scholar]
- Hofmann SG, Curtiss J, & McNally RJ (2016). A complex network perspective on clinical science. Perspectives on Psychological Science, 11, 597–605. [DOI] [PMC free article] [PubMed] [Google Scholar]
- IsHak WW, Greenberg JM, Balayan K, Kapitanski N, Jeffrey J, Fathy H, … Rapaport MH (2011). Quality of life: The ultimate outcome measure of interventions in major depressive disorder: Harvard Review of Psychiatry, 19, 229–239. 10.3109/10673229.2011.614099 [DOI] [PubMed] [Google Scholar]
- Jansson M, & Linton SJ (2006). The development of insomnia within the first year: A focus on worry. British Journal of Health Psychology, 77,501–511. [DOI] [PubMed] [Google Scholar]
- Jones PJ (2017). networktools: Tools for identifying important nodes in networks. R package version, 1.
- Jones PJ, Mair P, & McNally R (2018). Visualizing psychological networks: A tutorial in R. Frontiers in Psychology, 9, 1742. [DOI] [PMC free article] [PubMed] [Google Scholar]
- Judd LL, Akiskal HS, Zeller PJ, Paulus M, Leon AC, Maser JD,… & Rice JP (2000). Psychosocial disability during the long-term course of unipolar major depressive disorder. Archives of General Psychiatry, 57, 375–380. 10.1001/archpsyc.57.4.375 [DOI] [PubMed] [Google Scholar]
- Kraemer HC, Wilson T, Fairbum CG, & Agras WS (2002). Mediators and moderators of treatment effects in randomized clinical trials. Archives of General Psychiatry, 59, 877–883. 10.1001/archpsyc.59.10.877. [DOI] [PubMed] [Google Scholar]
- Mendlowicz MV, & Stein MB (2000). Quality of life in individuals with anxiety disorders. American Journal of Psychiatry, 157, 669–682. 10.1176/appi.ajp.157.5.669 [DOI] [PubMed] [Google Scholar]
- Olatunji BO, Cisler JM, & Tolin DF (2007). Quality of life in the anxiety disorders: A meta- analytic review. Clinical Psychology Review, 27, 572–581. 10.1016/j.cpr.2007.01.015 [DOI] [PubMed] [Google Scholar]
- Opsahl T, Agneessens F, & Skvoretz J (2010) Node centrality in weighted networks: generalizing degree and shortest paths. Social Networks, 32, 245–251. [Google Scholar]
- Papageorgiou C, & Wells A (2003). An empirical test of a clinical metacognitive model of rumination and depression. Cognitive Therapy and Research, 13. [Google Scholar]
- Rapaport MH, Clary C, Fayyad R, & Endicott J (2005). Quality-of-life impairment in depressive and anxiety disorders. American Journal of Psychiatry, 162, 1171–1178. 10.1176/appi.ajp.162.6.1171 [DOI] [PubMed] [Google Scholar]
- Robinaugh DJ, Millner AJ, & McNally RJ (2016). Identifying highly influential nodes in the complicated grief network. Journal of Abnormal Psychology, 125, 747–757. DOI: 10.1037/abn0000181 [DOI] [PMC free article] [PubMed] [Google Scholar]
- Solem S, Thunes SS, Hjemdal O, Hagen R, & Wells A (2015). A metacognitive perspective on mindfulness: An empirical investigation. BMC Psychology, 3, 24 10.1186/s40359-015-0081-4 [DOI] [PMC free article] [PubMed] [Google Scholar]
- Spada MM, Nikčević AV, Moneta GB, & Wells A (2008). Metacognition, perceived stress, and negative emotion. Personality and Individual Differences, 44, 1172–1181. 10.1016/j.paid.2007.ll.010 [DOI] [Google Scholar]
- Steinley D, Hoffman M, Brusco MJ, & Sher KJ (2017). A method for making inferences in network analysis: Comment on Forbes, Wright, Markon, and Krueger (2017). Journal of Abnormal Psychology. 126, 1000–1010. 10.1037/abn0000308 [DOI] [PMC free article] [PubMed] [Google Scholar]
- Su Y, Carpenter JK, Zandberg LJ, Simpson HB, & Foa EB (2016). Cognitive mediation of exposure and ritual prevention outcome in obsessive compulsive disorder. Behavior Therapy, 47, 474–486. 10.1016/j.beth.2016.03.003. [DOI] [PMC free article] [PubMed] [Google Scholar]
- Sun X, Zhu C, & So SHW (2017). Dysfunctional metacognition across psychopathologies: A meta-analytic review. European Psychiatry, 45, 139–153. 10.1016/j.eurpsy.2017.05.029 [DOI] [PubMed] [Google Scholar]
- Thielsch C, Ehring T, Nestler S, Wolters J, Kopei I, Rist F, … Andor T (2015). Metacognitions, worry and sleep in everyday life: Studying bidirectional pathways using ecological momentary assessment in GAD patients. Journal of Anxiety Disorders, 33, 53–61. 10.1016/j.janxdis.2015.04.007 [DOI] [PubMed] [Google Scholar]
- Tibshirani R (1996). Regression shrinkage and selection via the lasso. Journal of the Royal Statistical Society. Series B Methodological), 58, 267–288. [Google Scholar]
- Wells A (1995). Meta-Cognition and Worry: A cognitive model of generalized anxiety disorder. Behavioural and Cognitive Psychotherapy, 23, 301–320. 10.1017/S1352465800015897 [DOI] [Google Scholar]
- Wells A, & Carter K (2001). Further tests of a cognitive model of generalized anxiety disorder: Metacognitions and worry in GAD, panic disorder, social phobia, depression, and nonpatients. Behavior Therapy, 32, 85–102. 10.1016/S0005-7894(01)80045-9 [DOI] [Google Scholar]
- Wells A, & Cartwright-Hatton S (2004). A short form of the metacognitions questionnaire: Properties of the MCQ-30. Behaviour Research and Therapy, 42, 385–396. 10.1016/S0005-7967(03)00147-5 [DOI] [PubMed] [Google Scholar]
- Winer ES, Bryant J, Bartoszek G, Rojas E, Nadorff MR, & Kilgore J (2017). Mapping the relationship between anxiety, anhedonia, and depression. Journal of affective disorders, 221, 289–296. 10.1016/j.jad.2017.06.006 [DOI] [PMC free article] [PubMed] [Google Scholar]
- Yilmaz AE, Gcncoz T, & Wells A (2011). The temporal precedence of metacognition in the development of anxiety and depression symptoms in the context of life-stress: A prospective study. Journal of Anxiety Disorders, 25, 389–396. 10.1016/j.janxdis.2010.11.001 [DOI] [PubMed] [Google Scholar]
Associated Data
This section collects any data citations, data availability statements, or supplementary materials included in this article.