Abstract
The paper provides a preliminary assessment of COVID-19’s impact on global poverty in the light of IMF’s growth forecasts. It shows that the pandemic will erode many of the gains recorded over the last decade in terms of poverty reduction. Our baseline case suggests that globally the number of people living below US$1.90 per day will increase by 68 million in 2020 alone; this rise could however approach 100 million, should the recession turn out to be more severe than initially expected, as many practitioners fear. Without effective international support, this setback will pose a critical threat to the achievement of the United Nations 2030 Agenda for Sustainable Development. The fallout from the pandemic will also exacerbate the geographic concentration of poverty, to the extent that the Least Developed Countries, with only 14% of the global population, are set to represent the main locus of extreme poverty worldwide.
Keywords: COVID-19, Crisis impact, Poverty, Africa, Least developed countries, SDGS
Résumé
Cet article fournit une évaluation préliminaire de l'impact de la COVID-19 sur la pauvreté dans le monde, à la lumière des prévisions de croissance du FMI. Il montre que la pandémie va éroder bon nombre des progrès réalisés au cours de la dernière décennie en termes de réduction de la pauvreté. Notre marqueur de référence suggère qu'à l'échelle mondiale, le nombre de personnes vivant avec moins de 1,90 USD par jour va augmenter, avec 68 millions de personnes supplémentaires rien qu'en 2020. Cependant, ce nombre pourrait atteindre les 100 millions, si la récession s'avérait plus sévère qu’on ne l’avait initialement prédit, comme le craignent de nombreux spécialistes. Sans un soutien international efficace, ce recul constituera une menace importante pour la réalisation du Programme de développement durable à l'horizon 2030 des Nations Unies. Les retombées de la pandémie aggraveront également la concentration géographique de la pauvreté, au point que les pays les moins avancés, qui ne représentent que 14% de la population mondiale, risquent de représenter le principal foyer d’extrême pauvreté dans le monde.
Introduction
As the number of COVID-19 cases continues its rise, the global economy braces itself for a shock of unprecedented severity and complexity that is expected to trigger ‘the worst recession since the Great Depression’ (IMF 2020a: v). In a global context already weakened by prolonged sluggishness, heightened inequalities, and policy uncertainties, the health emergency has quickly spread worldwide, triggering a simultaneous supply and demand shock, with direct ramifications into the financial sphere (Baldwin and Weder di Mauro 2020; Djankov and Panizza 2020; UNCTAD 2020d). On the one hand, sudden breaks in production, value chain disruptions, uncoordinated border closings, lower international trade flows, and travel bans have taken a toll on the level of activity. On the other, reduced working hours, layoffs, confinements, and heightened uncertainties have dampened aggregate demand. Meanwhile, the need to increase public spending to cushion the impact of the downturn is likely to put pressure on government budgets, and bankruptcies loom large on a highly leveraged financial sector. For developing countries, the situation is compounded by dropping commodity prices (fuels and to a lesser extent minerals), falling FDI flows, capital flow reversals, and—in many cases—looming debt vulnerabilities (IMF 2020a; UNCTAD 2019, 2020a, b, c).
Against this background, if it is too early to predict the depth and duration of the crisis, it is nonetheless clear that its socio-economic costs cannot be overemphasized. The International Labour Organization (ILO) has recently warned that working-hour losses in the first half of 2020 could be equivalent to over 400 million full-time jobs worldwide, and that 1.6 billion workers in the informal economy are at immediate risk of seeing their livelihoods reduced (ILO 2020a; b). Based on hybrid DSGE/CGE simulations, it has also estimated that in 2020 there could be between 9 and 35 million additional people in working poverty, most of them living in developing countries (ILO 2020c; McKibbin and Fernando 2020).1 Similarly, in a series of research blog posts, Vos, Laborde, and Martin have analysed the potential impact of the pandemic on poverty using the IFPRI’s MIRAGRODEP model (Laborde and Martin 2018; Laborde et al. 2020; Vos et al. 2020). In their latest analysis, the authors find that under a scenario corresponding to a 5% contraction in world output, and in the absence of any intervention, over 140 million people could fall into extreme poverty in 2020 (Laborde et al. 2020).2
Unlike the above-mentioned studies, which are based on computable general equilibrium simulations, other contributions utilize aggregate data from household surveys to assess the impact of COVID-19. Sumner and co-authors simulate the impact of arbitrary consumption shocks of − 5%, − 10%, and − 20%, and find that the pandemic could increase the number of people living in poverty by roughly 80–400 million, using the US$1.90/day poverty line, and up to 527 million using the US$5.50/day line (Sumner et al. 2020a, b). Using growth forecasts from various vintages of the World Bank’s Global Economic Prospects (and in some cases from the International Monetary Fund – IMF), other authors find that COVID-19 could trigger an increase in the number of people living below US$1.90/day by 40–100 million (Gerszon Mahler et al. 2020a, b).
Borrowing methodological elements from this last group of researches, this paper provides two main original contributions. First, it provides a preliminary assessment of the impact of COVID-19 in the light of IMF growth forecasts, for all commonly used international poverty lines, thus providing a broader and more nuanced picture than previous analyses. Second, it examines the impact of the crisis on the Least Developed Countries (LDCs), a subset of 47 developing countries characterized by heightened structural vulnerabilities and deemed worthy of special international support.3 The paper is structured as follows. The next two sections respectively discuss the methodology and results. The special case of LDCs is analyzed in the fourth section, while the fifth presents a sensitivity analysis and explores a more pessimistic scenario than the one forecasted by the IMF. Finally, the last section summarizes and concludes.
Data, Methodology, and Caveats
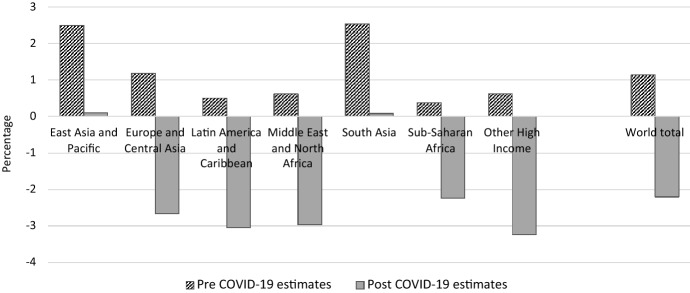
The methodological approach adopted here is the so-called “augmented poverty line”, composed of three steps and essentially a simplified version of the technique developed to nowcast poverty (Castaneda Aguilar et al. 2019). Keeping in mind that the first COVID-19 cases were reported in December 2019, the first step entails a comparison of growth forecasts for GDP per capita (in constant 2011 international dollars) from two successive vintages of the IMF’s World Economic Outlook, namely the October 2019 and April 2020 full datasets (IMF 2019, 2020a).4 The latter forecasts for the year 2020 portend a 3% contraction in world output, and a substantial downward revision of the global GDP per capita growth estimates from + 1.1 to − 2.2% (Fig. 1). Although the fallout from the pandemic is expected to affect all regions, its impact is somewhat differentiated. Despite a sharp slowdown, Asian economies appear able to avoid a decline in per capita income, whereas other regions, where growth was already much slower prior to the outbreak of COVID-19, are expected to face significant contractions of per capita income.
Fig. 1.
Annual growth rate of GDP per capita in constant PPP (2020).
In the second step, the above growth rates, pre- and post-COVID-19, are utilized to ‘line up’ the corresponding poverty estimates using PovcalNet, the World Bank’s computational tool, which draws on more than 1500 household surveys from 164 countries and contains the official estimates of poverty at country, regional, and global levels.5 The “augmented poverty line” procedure follows Sumner et al. (2020a, b). Denoting by z0 the poverty line in the reference year (typically 2018) and by xt the forecasted growth rate of GDP per capita in year t—in our case 2020—the new poverty estimate is obtained by revising the poverty line as follows:
| 1 |
Clearly, this corresponds to an increase in the poverty line (zt)—hence, ceteris paribus, larger poverty measures—if the assumed growth rates (xi) are negative, and a reduction in the value of the poverty line in the opposite case.
The third step obtains the impact of COVID-19 as the difference between the poverty measures obtained by applying the pre- and post-COVID-19 growth estimates.6 In other words, this approach ascribes to the fallout from the epidemic the difference in poverty estimates consistent with the IMF’s revision of growth forecasts for the year 2020, between the two vintages of the World Economic Outlook. Population data for 2020 (drawn from the latest World Population Prospects (UNDESA 2019)) are then utilized to translate changes in the headcount ratios into corresponding variations in the number of poor.
The above methodology warrants a few caveats. First, the rationale for using the standard international poverty lines and related estimates from PovcalNet database stems from the aim of adopting a global perspective, particularly one consistent with the ongoing international debate on COVID-19 responses, as well as with Agenda 2030 for sustainable development. While the reasonable degree of cross-country comparability of PovcalNet figures is fundamental in this respect, it should be noted that their methodological underpinnings are not free from criticism. In particular, the following issues have been highlighted in the literature: (i) discrepancies in the methodologies followed by the different surveys (in terms of sampling, equivalence scales, treatment of incomplete answers, etc.); (ii) potential inaccuracies introduced by the combination of surveys based on consumption with those based on income; (iii) challenges underpinning purchasing power parity adjustments and their impact on poverty estimates; and (iv) bias introduced by the extrapolation of estimates to missing countries and/or non-represented groups (Atkinson 2019; Deaton and Dupriez, 2011; United Nations 2020).7
Second, the approach adopted implicitly assumes that GDP per capita growth is mirrored in an equivalent rise in households’ welfare, as measured by surveys; that is, the consumption of all households is assumed to expand at the same rate as GDP per capita. While this is in line with the method used by the World Bank to ‘line up’ poverty estimates from various years, empirical evidence shows that only a fraction of the growth in national accounting variables trickles down to households; hence, the effect of growth on poverty reduction might be over-estimated (Deaton and Kozel 2005; Korinek et al. 2006; Newhouse and Vyas 2018).8,9
Third, the above methodology leaves unchanged the distribution of income. It is reasonable to expect, however, that some of the poorer segments of the population will be the hardest hit by the fallout from the epidemic, at least in urban areas. For example, strict social distancing is likely to exert a disproportionate effect on informal workers, daily labourers, own-account workers, and small businesses, which have meagre resources to weather the confinement without major disruptions. Similar distributional concerns are surely relevant in this phase, and critical in the longer term in shaping the path and speed of poverty reduction, as well as in addressing within-country inequality (Lakner et al. 2019). In line with similar studies (for instance Sumner et al. (2020a, b)), the working assumption of a distributionally-neutral shock is retained here mainly for practical reasons, since distributional aspects plausibly vary from country to country and do not easily lend themselves to generalizations.10
Fourth, the negative impact of the pandemic on households’ welfare may be felt through other transmission channels than the pure short-term income dimension analysed here, and adversely affect the attainment not just of the first Sustainable Development Goal (SDG 1) but also of other SDGs, notably those related to health and gender equality. What is more, some of the non-monetary channels may even trigger adverse long-term effects, and create path-dependency from ‘transient poverty’ into ‘chronic poverty’ (Jalan and Ravallion 2000). For example, health-related problems may permanently lower productivity, or poor households being forced to take their kids out of school to cope with a temporary crisis might have lower income prospects over the long term, with knock-on effects that are not accounted for in the above simulations.
Finally, the above exercise is admittedly fraught with uncertainties, stemming from the forecasting of economic growth in a very volatile phase, compounded by the degree of noise introduced through the ‘line-up’ of the corresponding poverty measures. The heightened degree of uncertainty is openly acknowledged by all commentators, including the IMF itself, in view of the unprecedented nature of the crisis and of the fact that future prospects are partly contingent on the policy responses adopted at national and international level (Baldwin and Weder di Mauro 2020; IMF 2020a). Moreover, some authors have also questioned IMF’s relatively optimistic forecasts in its April 2020 release, pointing to a seeming “discrepancy between the dire narrative and the less dire numbers, in particular for developing countries” (Sandefur and Subramanian 2020, p. 11).
Some of the above methodological qualifications are further discussed along with the sensitivity analysis; here it suffices to say that in view of the above qualifications there are good reasons to believe that the figures presented below are—if anything—conservative estimates. Given the heightened uncertainty, simulations are run only until the end of 2020 and hence do not incorporate any speculation on the potential impact of COVID-19 beyond 2020. Yet, risk factors in this respect are all on the downside and there are growing concerns that the downturn could derail the world economy, possibly triggering balance of payment tensions and/or debt crises with long-lasting effects in the developing world (Baldwin and Weder di Mauro 2020; Djankov and Panizza 2020; Sandefur and Subramanian 2020; UNCTAD 2020a). With such risks looming, the analysis presented in the next section cannot but be regarded as a preliminary conservative assessment of the immediate poverty impact of COVID-19.
Results: The Immediate Impact of COVID-19 on Global Poverty
Broadly speaking, the impact of COVID-19 on poverty is explained by the interplay of three context-specific factors:
the severity of the health crisis, which largely determines the human and social costs, as well as the type and duration of policy responses (such as social distancing, confinement, and border closures);
the nature and magnitude of the economic fallout, in turn partly linked to structural issues, such as dependence on primary commodities or key markets/value chains hit by the downturn, availability of fiscal space, and outstanding debt; and
the relative weight of people clustered in the vicinity of each poverty line, who may be pushed into poverty by the decline in their per capita income.
The scale of the economic fallout from COVID-19 deserves particular attention, and in many developing countries it might arguably have greater significance than the health emergency itself. The pandemic has simultaneously triggered a supply-side shock—propagated along value chains due to the disruption of business activities and rising frictions in international trade—as well as a demand shock, whereby growing unemployment and heightened uncertainty reduce consumption and investment expenditure (Baldwin and Weder di Mauro 2020). While it is too early to rigorously disentangle the various channels through which this situation is impacting households’ welfare, there is growing evidence that it is primarily taking its toll on employment, especially in sectors highly reliant on global value chains (such as garment manufacture, transport, and tourism), as well as on declining revenues from informal activities, notably in the trade and retail sectors (Aung et al. 2020; UNECA 2020). Equally, preliminary evidence also suggests that strict social distancing has adversely affected income prospects for informal workers, and lowered capacity utilization rates and survival time for affected firms, all of which may increase poverty (UNECA 2020; Djankov and Panizza 2020).
Moreover, international prices for primary commodities—especially oil and, to a lesser extent, other hard commodities—have suffered severe slumps in the first trimester of 2020, due partly to commodity-specific fundamentals and partly to the contraction in global demand. In many developing countries, the emergence of COVID-19 has thus been compounded by adverse terms of trade shocks, reductions in remittances and FDI flows, heightened debt vulnerability, and capital flight (Baldwin and Weder di Mauro 2020; UNCTAD 2000b, c). The additional pressure on government budgets and balance of payments has thus further exacerbated the situation, constraining the space for an active policy response.
Given this premise, the short-term impact of coronavirus on poverty at the global level is depicted in Figs. 2 and 3, and reported in the Appendix. In the case of the extreme poverty line, the global headcount ratio is estimated to increase by 0.9 percentage points (from 8.2 to 9.1%), thereby wiping out the poverty-reduction progress made in the last 2–3 years. This translates into 68 million additional people living below US$1.90 per day (in 2011 Purchasing Power Parity).11 The impact is even more conspicuous in relation to the higher poverty lines, namely US$3.20 and US$5.50 per day. The corresponding headcount ratios increase by nearly 2 percentage points (from 20.8 to 22.6% in the former case, and from 40 to 41.9% in the latter), reflecting in both cases an increase of over 140 million in the number of poor people worldwide.12
Fig. 2.
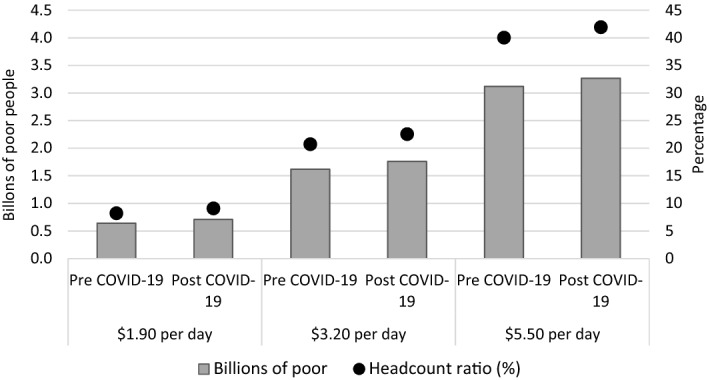
Global poverty estimates pre- and post-COVID-19 (2020).
Source author’s computation based on PovcalNet (April 2020) and IMF (2019, 2020a)
Fig. 3.
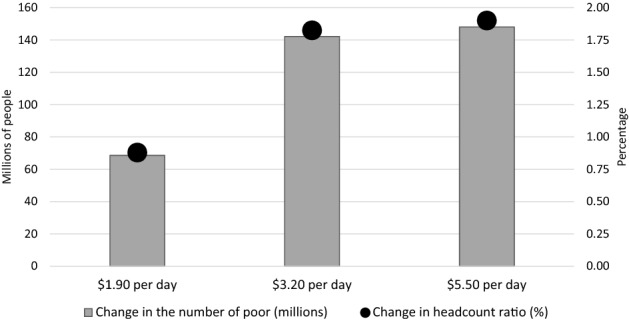
Worldwide changes in poverty due to COVID-19 (2020).
Source author’s computation based on PovcalNet (April 2020) and IMF (2019, 2020a)
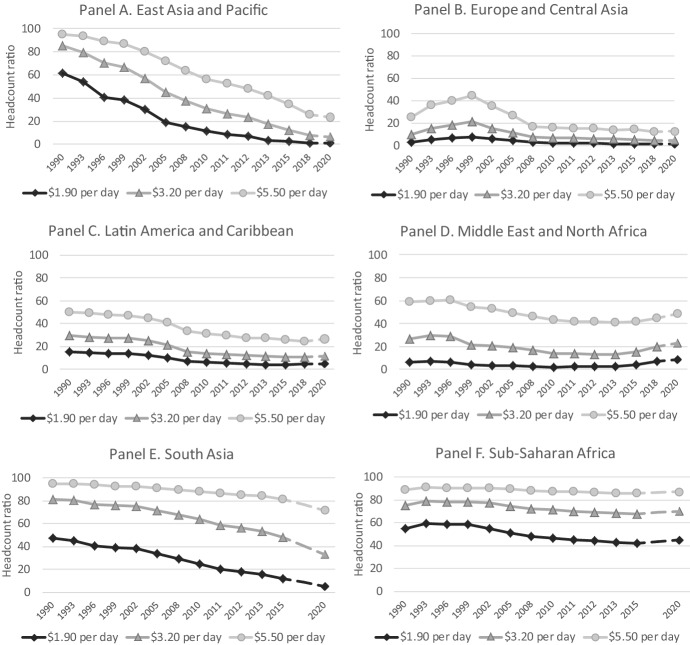
Further clarity on the differential impact of COVID-19 can be gauged from Figs. 4 and 5, depicting, respectively, the regional breakdown in the changes for each poverty measure and the long-term trends in headcount ratios up to 2020 (per post-COVID-19 forecasts).13 Critical to the understanding of these two graphs are the differentiated fallout from the pandemic (Fig. 1) and the relative positioning in the income distribution vis-à-vis any given poverty line. Indeed, the more people are clustered just above a given poverty line, the greater the potential effect of a decline in per capita income on the corresponding poverty incidence.
Fig. 4.
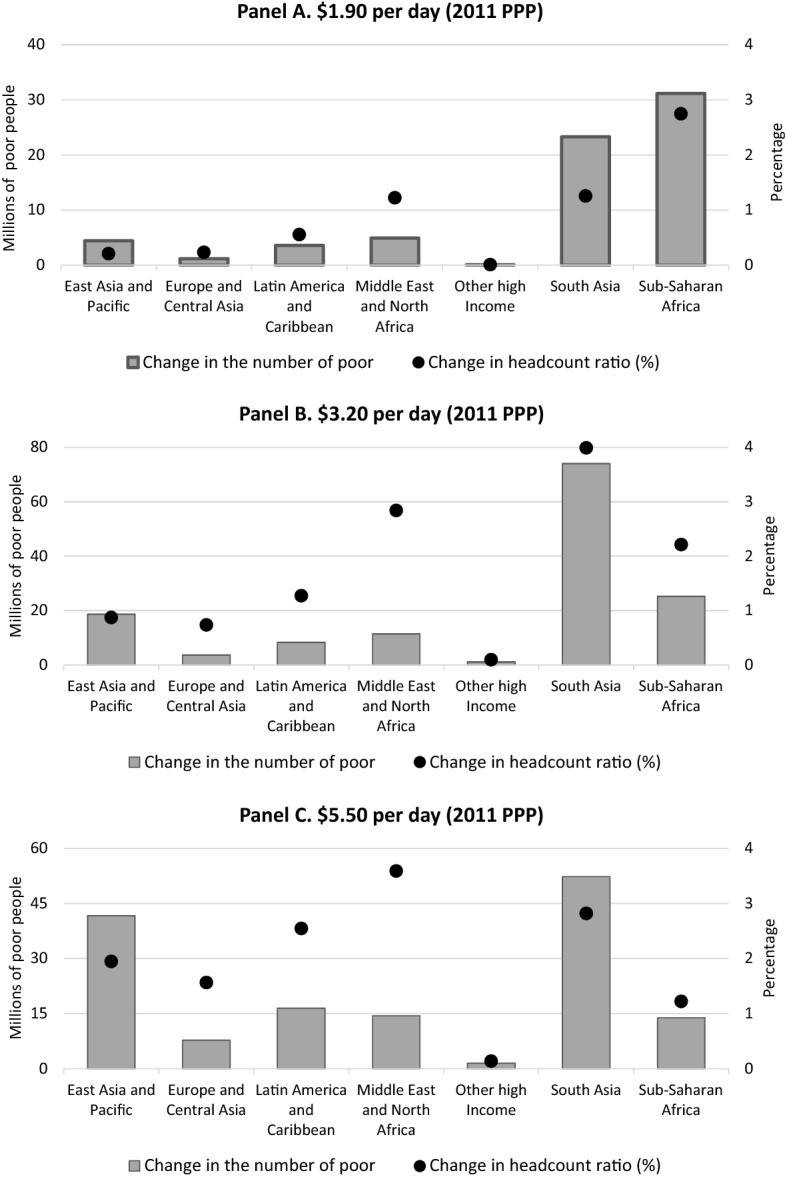
Changes in poverty estimates as a result of COVID-19, by region and poverty line (2020).
Source author’s computation based on PovcalNet (April 2020) and IMF (2019, 2020a)
Fig. 5.
Headcount ratios in the developing world, by region and poverty line (1990–2018 plus estimates for 2020).
Source author’s computation based on PovcalNet (April 2020) and IMF (2019, 2020a)
Broadly speaking, three sets of regions can be identified in relation to COVID-19s impact:
In countries in Europe and Central Asia, as well as in other high-income countries, the pandemic leads to large socio-economic costs, but since the overwhelming majority of the population enjoys living standards that are far higher than those implied by the international poverty lines, this translates into relatively small increases in poverty headcounts.
In South Asia and East Asia and Pacific—where poverty reduction was progressing at a fairly rapid pace prior to COVID-19, but growth is expected to remain positive—the shock is felt essentially through a sharp slowdown in poverty reduction.
In the remaining regions, the crisis provokes an upsurge in poverty rates, thereby reversing earlier downward trends (in Latin America and Sub-Saharan Africa) or accentuating an already deteriorating situation (in the Middle East and North Africa).
With reference to extreme poverty, Sub-Saharan Africa stands out as the worst-hit region: the 2020 headcount ratio is estimated to increase by 2.7 percentage points in the wake of the pandemic, corresponding to an additional 31 million people living in extreme poverty (Fig. 4). The impact is also large in South Asia, triggering a 1.3% increase in the headcount ratio, compared with the ratio that would have prevailed in the absence of COVID-19. The Middle East and North Africa is another area witnessing a particularly adverse fallout from the coronavirus, the incidence of extreme poverty augmenting by more than 1.2 percentage point. These figures entail substantial reversals in the poverty-reduction progress, the COVID-19 outbreak bringing the headcount ratio back to the levels of 2012 in the case of Latin America and the Caribbean, of 2011 in the case of Sub-Saharan Africa, and of the mid-1980s in the case of Middle East and North Africa.
The fallout from the pandemic has even more visible effects across developing regions when higher poverty lines are considered (in particular US$5.50 per day), in line with the presumption that US$5.50 per day is arguably more representative of minimum living standards in middle-income countries. Focusing on the US$3.20 per day poverty line, South Asia is likely to suffer by far the largest slump, entailing a rise of nearly 4 percentage points in the headcount ratio, equivalent to 74 million additional poor, compared with what would have occurred if the pre-COVID-19 growth forecasts had materialized (Fig. 4). The incidence of poverty is also expected to significantly worsen in other developing regions, such as Sub-Saharan Africa, Middle East and North Africa, and Latin America and the Caribbean, where headcount ratios increase, respectively, by 2.8, 2.2, and 1.3 percentage points.14 Deteriorations in the remaining regions are expected to remain fairly circumscribed, with headcount ratios increasing by less than 1%.
Finally, our estimates suggest that the pandemic will exert a more visible and widespread impact on global poverty measures according to the US$5.50 per day poverty line. In this case, the sharp deceleration in the pace of poverty reduction in Southern and Eastern Asia is such that they will both suffer setbacks in their headcount ratios of 2–3% compared with what they would have experienced had pre-COVID-19 forecasts materialized. Given their population size, this implies that they will account for the bulk of the impact in terms of changes in the absolute number of poor people (Fig. 4). The deterioration of the poverty headcount, however, will be conspicuous also in the Middle East and North Africa, Latin America and the Caribbean, and—albeit to a lesser extent—Sub-Saharan Africa, which will witness a rise in the number of poor by roughly 15 million each. Economies in Europe and Central Asia will also suffer some setbacks, with the headcount ratio expected to climb from 11.3 to 12.8, while poverty levels in other high-income economies will increase only marginally, even against the US$5.50 per day poverty line.
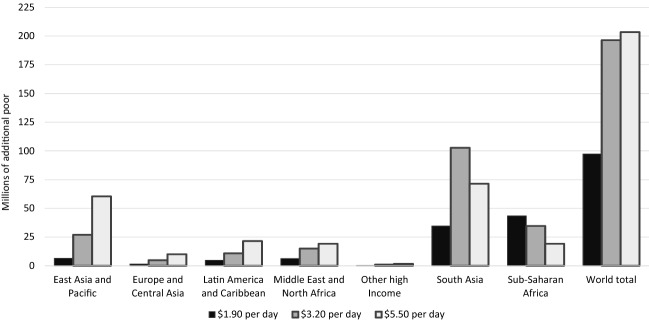
Overall, there is no doubt that COVID-19 will cause a troubling setback in efforts to eradicate extreme poverty (per SDG 1), triggering the erosion of the progress achieved in the last 2–3 years at a global level, and even more prominent rollback in many developing regions. It also seems clear that the fallout from the epidemic will reinforce the geographic polarization of poverty, with Sub-Saharan Africa and South Asia accounting for the lion’s share of the changes in the number of poor people, at least in relation to the two lowest poverty lines (Fig. 6).
Fig. 6.
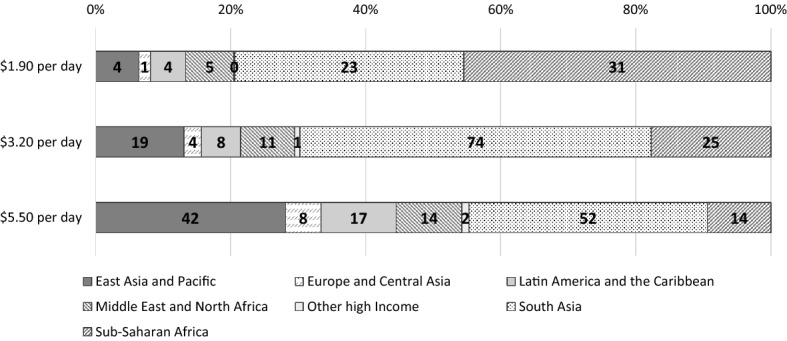
Changes in the number of poor people as a result of COVID-19, by region and poverty line.
Source author’s computation based on PovcalNet (April 2020) and IMF (2019, 2020a)
Moreover, given its intrinsic nature and related response policies, the crisis will likely impact on other SDGs, notably in the health and education spheres, as well as on gender equality. The gender dimension, in particular, intersects other axes of structural marginalization including economic status, membership to minority groups and the like, as women tend to be over-represented in vulnerable occupational categories (from health personnel to informal own-account workers) and in some of the value chains hardest hit by the crisis, such as tourism or textile and apparel. Moreover, they tend to disproportionately shoulder the burden of care-related tasks and be exposed to heightened risks of gender-based violence in the context of strict lockdown; all of which may likely widen gender gaps (World Bank 2020).
COVID-19 and ‘Leaving No One Behind’: The Case of the Least Developed Countries
The pattern of changes in global poverty since the outbreak of COVID-19 begs the question of how the latter will affect prospects for delivering on the Agenda 2030 for Sustainable Development commitment to ‘leave no one behind’. If admittedly it is too early to provide a definitive answer to this question, some disturbing hints can already be derived from the above analysis. As COVID-19 is disrupting the preparation for the fifth United Nations Conference on the Least Developed Countries (UNLDC V), it is also instructive to assess how LDCs have fared in relation to poverty over the last decade—under the so-called Istanbul Programme of Action—and how the ongoing pandemic is likely to impact them.15
Historically, as shown in Fig. 7, the incidence of poverty in the LDCs was stubbornly high even before the emergence of COVID-19. After a decade of stagnation in the Nineties, poverty rates—at least according to the US$1.90 and US$3.20 per day lines—dropped at a moderate pace during the first decade of the new millennium, but poverty reduction slowed down markedly in the aftermath of the 2008–2009 global financial and economic crisis.16
Fig. 7.
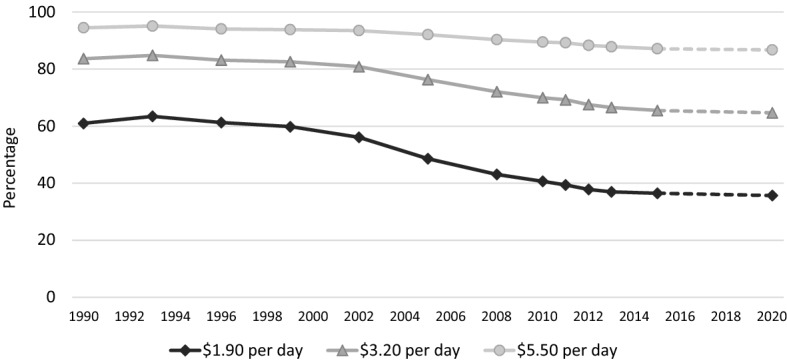
Trends in poverty headcount in the LDCs.
Source author’s computation based on PovcalNet (April 2020) and IMF (2019, 2020a)
In this sobering context, the fallout from COVID-19 is set to completely stall even this sluggish progress, essentially wiping out any advances in terms of poverty reduction made since 2015 (the last reference year available). This might seem remarkable considering that a number of LDCs—Cambodia, Ethiopia, Myanmar, Rwanda, and Tanzania—have in recent years featured among the world’s fastest-growing economies (Johnson 2019; UNCTAD 2019; World Bank 2017, 2018). Yet, it is precisely LDCs’ intrinsic vulnerabilities that make them disproportionately susceptible to exogenous shocks, especially through balance of payment tensions. Moreover, it is the very fact that a significant share of the LDC population was located just above the US$1.90 poverty line that determines the skewed geographical distribution of impacts depicted in Fig. 6.
Against this background, the risk that LDCs will lag further behind in terms of poverty eradication (SDG 1) is great indeed; all the more so if the downturn triggers further debt distress and balance of payment crises. This reading of the evidence is vindicated by Fig. 8, which shows the LDC share of world poor according to the three international poverty lines (as well as the LDC share of population for reference purposes). Even prior to the pandemic, LDCs were accounting for a rising proportion of the world’s poor, due to the combined effect of persistently widespread poverty and rapid demographic growth. This trend has only been exacerbated by COVID-19, with LDCs accounting for nearly half of its impact in relation to the number of people living in extreme poverty globally.
Fig. 8.
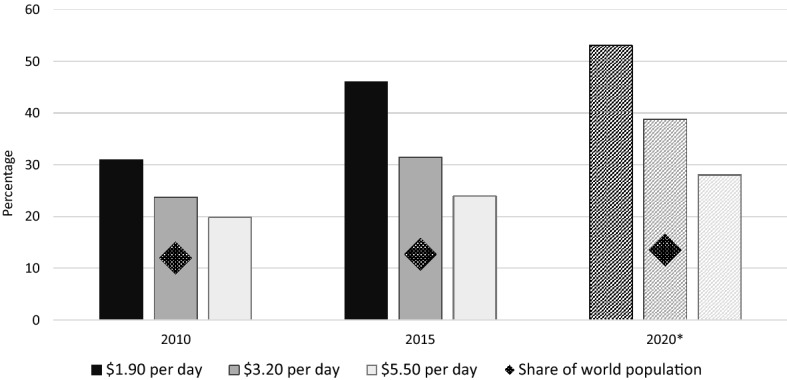
LDC share of world population and of world poor, by international poverty line.
Source author’s computation based on PovcalNet (April 2020) and IMF (2019, 2020a)
This situation is so pronounced that, on the eve of the UNLDC V Conference, LDCs represent the main locus of extreme poverty worldwide. With barely 14% of the world’s population, they account for 53% of the people living below US$1.90 per day and nearly 40% of those living on less than US$3.20 per day at global level. With the sharp reduction of FDI and remittances flows and the intensification of debt vulnerabilities, it is clear that a quick rebound of LDC economies from the COVID-19 shock cannot but hinge upon much stronger international support, with aid playing a pivotal role in this phase; hence the importance of meeting long-standing aid targets (UNCTAD 2019). In the longer term, the evidence presented here underscores how LDCs will represent the litmus test for the 2030 Agenda for Sustainable Development, specifically for the promises to leave no one behind and reduce global inequality (UNCTAD 2015).
Sensitivity Analysis and a More Pessimistic Scenario
The earlier discussion highlighted two crucial caveats applicable to the methodology followed here: the extent to which growth in GDP per capita translates into an expansion of households’ surveyed consumption, and the heightened degree of uncertainty surrounding the global economic outlook. In relation to the former caveat, the previous analysis implicitly assumed that the consumption of all households would expand at the same rate as GDP per capita (in constant international dollars). Empirical evidence, however, has questioned this assumption, and demonstrated that it would lead to an over-estimation of the pace of poverty reduction induced by economic growth. With reference to India, Newhouse and Vyas (2018) have recently estimated pass-through coefficients which, if applied to the growth of household final consumption expenditure, would replicate the poverty rates obtained from household surveys. Their estimated values are 55.9% for urban areas and 73.3% for rural ones.
In the light of this, to test the sensitivity of our findings, the adjustment to the poverty line is modified to explicitly add a pass-through coefficient α
| 2 |
The impact of COVID-19 on poverty rates is then quantified, assuming a degree of pass-through equal to 65% (i.e. the average of the above two values for rural and urban areas), and these results are compared with the previous ones, obtained for a unitary pass-through (α = 1). Before commenting on the sensitivity analysis, it is worth noting that, in this formalization, the pass-through acts symmetrically with respect to positive and negative GDP per capita growth. While in reality this may not necessarily be the case, this specification was retained to ensure full correspondence with the case of α = 1.
The changes in headcount ratios resulting from the epidemic in the two cases are reported in Table 1, by region and poverty line. As expected, the presence of a partial pass-through does somewhat reduce the size of the effects of COVID-19 on global poverty rates, but it does not alter the two key messages of the previous analysis, namely the significance of the setback and its geographic polarization for the two lowest poverty lines. The incidence of extreme poverty, for instance, increases worldwide by ‘only’ 0.58 percentage points with the partial pass-through (instead of 0.88 as before), with Sub-Saharan Africa, South Asia, and to a lesser extent the Middle East and North Africa still bearing the brunt of the shock.
Table 1.
Comparison of COVID-19 effects on headcount ratios with full and partial pass-through, by region and poverty line
| $1.90 per day | $3.20 per day | $5.50 per day | ||||
|---|---|---|---|---|---|---|
| α = 1 | α = 0.65 | α = 1 | α = 0.65 | α = 1 | α = 0.65 | |
| East Asia and Pacific | 0.21 | 0.15 | 0.87 | 0.60 | 1.95 | 1.33 |
| Europe and Central Asia | 0.23 | 0.16 | 0.74 | 0.47 | 1.56 | 0.98 |
| Latin America and Caribbean | 0.55 | 0.31 | 1.27 | 0.68 | 2.54 | 1.36 |
| Middle East and North Africa | 1.22 | 0.77 | 2.84 | 1.76 | 3.59 | 2.30 |
| Other high Income | 0.01 | 0.00 | 0.10 | 0.09 | 0.14 | 0.10 |
| South Asia | 1.25 | 0.81 | 3.99 | 2.06 | 2.82 | 1.43 |
| Sub-Saharan Africa | 2.74 | 1.84 | 2.21 | 1.51 | 1.22 | 0.80 |
| World total | 0.88 | 0.58 | 1.82 | 1.07 | 1.90 | 1.13 |
The second critical consideration in relation to the assessment carried out so far pertains to the degree of uncertainty surrounding the IMF’s growth estimates. The latter have a track record of being over-optimistic in times of country-specific, regional, and global recessions; moreover, some authors have questioned the consistency of the relatively optimistic forecasts with dire narrative around the COVID-19 outbreak (Genberg and Martinez 2014; Sandefur and Subramanian 2020). In the light of this, it is instructive to examine the sensitivity of the poverty estimates to changes in growth performance in the context of a more pessimistic scenario, whereby GDP per capita growth in 2020 is assumed to be 2 percentage points lower than the IMF’s April forecasts. Interestingly, this pessimistic scenario, originally developed as a hypothetical setting designed to shed more light on the consequences of a deeper-than-expected recession, is very close to IMF’s own June 2020 assessment, in which growth forecasts have been revised downward, presaging a global recession of − 4.9 percentage points for the year 2020 (IMF 2020b).17
The comparison of this pessimistic scenario with the one consistent with the IMF’s April 2020 growth forecasts is depicted in Fig. 9, which shows that a deeper-than-expected recession could have disastrous implications for much of the developing world. In Sub-Saharan Africa and South Asia, the extreme poverty outlook would considerably worsen, with headcount ratios increasing by a further 1.1 and 0.6 percentage points, respectively. The negative effects of a deeper recession appear more visibly in other regions (starting from the MENA) once the higher poverty lines are considered. In relation to the US$5.50 per day poverty line, virtually all developing and transition economies would suffer a further deterioration of headcount ratios.
Fig. 9.
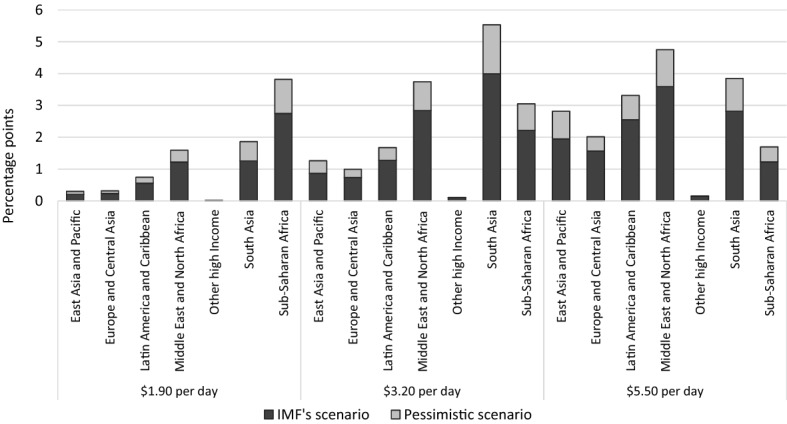
Post-COVID-19 change in headcount ratios in different scenarios, by region and poverty line.
Source author’s computation based on PovcalNet (April 2020) and IMF (2019, 2020a)
Translating the above figures into corresponding numbers of additional people falling into poverty gives a clearer idea of the devastating scale of the possible consequences (Fig. 10). Should the downturn prove to be deeper than initially expected, as more and more practitioners suggest, close to 100 million additional people would fall into extreme poverty worldwide, of which nearly half would be in Sub-Saharan Africa. This would be disastrous for the region, as the headcount ratio would then slide back to the levels of 2010 (entailing an even larger number of extreme poor than 10 years ago, in the light of demographic growth). When considering the higher poverty lines—namely US$3.20 and US$5.50 per day—the pessimistic scenario indicates that approximately 200 million additional people would fall into poverty, mainly in Asia. Again, the fact that even in the case of a pessimistic scenario, high-income countries do not appear to suffer visible setbacks in terms of poverty incidence speaks volumes in terms of the levels of global inequality. Such a negligible effect is indeed chiefly related to the limited relevance of standard international poverty lines in relation to developed countries’ standards of living, while the sizeable worsening of poverty and deprivation stemming from the COVID-19 outbreak would emerge starkly from an analysis of national poverty lines.
Fig. 10.
Changes in the number of poor people in the pessimistic scenario, by region and poverty line (2020).
Source author’s computation based on PovcalNet (April 2020) and IMF (2019, 2020a)
Overall, the magnitude of the potential socio-economic costs of this pessimistic scenario underscores the fundamental importance of revitalizing international cooperation and doing ‘whatever it takes’ to effectively prevent a deeper and longer-lasting downturn. This conclusion is corroborated by the findings of other studies, investigating the impact of even deeper recessions (Sumner et al. 2020b). Beyond the depth of the recession, its duration is also critical: a prolonged downturn would inevitably provoke broader socio-economic strains and risk turning transient forms of poverty into chronic ones, especially if it inflicts protracted damage on productive sectors and micro, small, and medium enterprises.
Conclusions
The analysis presented here provides a preliminary assessment of COVID-19’s immediate impact on global poverty, under the commonly used international poverty lines. More precise appraisals will require up to date “hard evidence”, both in terms of household surveys and national accounts; besides, they may entail a shift from a global perspective—with all its methodological caveats—to a national focus, more suitable to capture the differentiated impact of the crisis across distinct segments of the population. Promising directions for further research, in this respect, include the use of national poverty lines (lending themselves better to assessing the differential impact in urban and rural areas), as well as the adoption of a multidimensional approach to poverty, to disentangle the evolution in the patterns of deprivation across several dimensions.
As the crisis unfolds, however, the usefulness of an early assessment of COVID-19 impact on global poverty arguably justifies the set of simplifying assumptions discussed above. Given the heightened uncertainties and the speed at which the socio-economic crisis evolves, this approach results admittedly in estimates that provide conservative, ‘ball park’ figures, not least because many of the recently adopted policy responses are not necessarily accounted for in this framework. Even with these caveats, it is undisputable that the COVID-19 crisis will have dramatic consequences, eroding many of the gains recorded over the last decade in terms of poverty reduction. Our baseline case suggests that the number of people living in extreme poverty (below US$1.90 per day) could increase by 68 million in 2020 alone. More likely than not, this number will rise to 100 million, should the recession turn out to be deeper than the IMF forecasted in April 2020, as a growing number of projections suggest.
Even taking the IMF’s forecasts at face value, the ‘great lockdown’ will result in the first rise in worldwide headcount ratios since the late 1990s. This represents a significant setback, posing immediate challenges to the achievement of the UN 2030 Agenda for Sustainable Development, in particular SDG 1. As the downturn exacerbates structural vulnerabilities and erodes precarious gains in terms of poverty reduction, Sub-Saharan Africa and South Asia will be the hardest hit regions, along with the Middle East and North Africa. Nor will other regions be spared, even though adverse changes in poverty incidence there will be of a smaller magnitude, at least in relation to the two lowest poverty lines. The crisis can be expected to exacerbate the geographic concentration of poverty, particularly when compounded by the disparity in the financial and institutional means to roll out effective policy responses and social protection programmes. As further evidence that this polarization is jeopardizing the pledge to ‘leave no one behind’, we show that LDCs are among the worst hit by the COVID-19 fallout and today represent the main locus of poverty. With barely 14% of the world’s population, they account for 53% of the people living below US$1.90 per day at global level, and nearly 40% of those living on less than US$3.20 per day.
Mitigating the adverse effects of this dire global situation hinges on four policy priorities. First, the international community must support developing countries in mobilizing adequate resources to allow their health systems to cope with the emergency, while effectively assisting vulnerable segments of the population and small businesses. Second, containing the social costs of the pandemic requires averting further damage, be it as a result of balance of payment crises, of food price hikes in net-importing countries, or of debt vulnerabilities. This calls for concerted action to provide adequate international liquidity, adopt a comprehensive debts standstill arrangement, and, where appropriate, extend renewed debt relief. Third, it is crucial to avoid major disruptions to domestic and regional food and agricultural value chains, which would further strain vulnerable households. With the immediate socio-economic impact of the pandemic mainly affecting the urban population, the viability of agriculture is fundamental to preserve livelihoods in rural areas, contain price spikes for staple foods, and limit food import bills at a time when foreign exchange is scarce. Fourth, national and international efforts to revitalize the economy should be directed into viable investments to foster structural transformation and spur the transition towards a low-carbon economy, as a key avenue to build resilience, generate employment, and establish/strengthen social protection programmes.
Needless to say, domestic policies have an important role to play with respect to the roll out of countercyclical macroeconomic policies and assistance programmes, in developed and developing countries alike. Yet, the vast global disparity in financial and institutional means, and the lack thereof precisely in countries whose governments are facing more pronounced socio-economic risks, such as LDCs, inevitably call for bolstered international support to avoid an outcome whose socio-economic costs could be disastrous.
Acknowledgements
The study was originally published in UNU-WIDER’s working paper series. The author is gratefully indebted to Lisa Borgatti, Junior Davis, Adrian Gauci, Marco Missaglia, Andrew Mold, Ugo Panizza, Amelia Santos Paulino, Andy Sumner, Rolf Traeger, Gianni Vaggi, David Vanzetti, and one anonymous referee for their useful comments; the usual caveats apply. The opinions expressed here are exclusively those of the author and do not necessarily reflect the views of the UNCTAD secretariat or its member states.
Appendix
See Table 2.
Table 2.
Global poverty estimates pre- and post-COVID-19
| Pre-COVID-19 | Post-COVID-19 | Change | ||||
|---|---|---|---|---|---|---|
| Headcount | Million poor | Headcount | Million poor | Headcount | Million poor | |
| $1.90 per day | ||||||
| East Asia and Pacific | 0.9 | 18.5 | 1.1 | 22.9 | 0.2 | 4.4 |
| Europe and Central Asia | 1.1 | 5.3 | 1.3 | 6.5 | 0.2 | 1.2 |
| Latin America and Caribbean | 4.4 | 28.3 | 4.9 | 31.8 | 0.6 | 3.6 |
| Middle East and North Africa | 7.3 | 29.3 | 8.5 | 34.2 | 1.2 | 4.9 |
| Other high Income | 0.7 | 7.4 | 0.7 | 7.5 | 0.0 | 0.1 |
| South Asia | 4.0 | 74.0 | 5.2 | 97.2 | 1.3 | 23.3 |
| Sub-Saharan Africa | 42.2 | 479.5 | 45.0 | 510.7 | 2.7 | 31.2 |
| World total | 8.2 | 642.3 | 9.1 | 710.8 | 0.9 | 68.6 |
| $3.20 per day | ||||||
| East Asia and Pacific | 5.7 | 122.0 | 6.6 | 140.7 | 0.9 | 18.6 |
| Europe and Central Asia | 4.1 | 20.3 | 4.8 | 24.0 | 0.7 | 3.7 |
| Latin America and Caribbean | 10.3 | 66.9 | 11.6 | 75.1 | 1.3 | 8.2 |
| Middle East and North Africa | 20.1 | 80.8 | 22.9 | 92.2 | 2.8 | 11.4 |
| Other high Income | 0.8 | 9.0 | 0.9 | 10.1 | 0.1 | 1.1 |
| South Asia | 29.4 | 545.6 | 33.4 | 619.6 | 4.0 | 74.0 |
| Sub-Saharan Africa | 68.1 | 773.3 | 70.3 | 798.4 | 2.2 | 25.1 |
| World total | 20.8 | 1617.9 | 22.6 | 1760.1 | 1.8 | 142.2 |
| $5.50 per day | ||||||
| East Asia and Pacific | 21.3 | 456.6 | 23.3 | 498.3 | 1.9 | 41.7 |
| Europe and Central Asia | 11.3 | 56.1 | 12.8 | 63.9 | 1.6 | 7.8 |
| Latin America and Caribbean | 24.0 | 155.6 | 26.5 | 172.1 | 2.5 | 16.5 |
| Middle East and North Africa | 45.1 | 181.3 | 48.7 | 195.7 | 3.6 | 14.4 |
| Other high income | 1.3 | 13.9 | 1.4 | 15.4 | 0.1 | 1.5 |
| South Asia | 69.0 | 1,281.4 | 71.8 | 1,333.7 | 2.8 | 52.3 |
| Sub-Saharan Africa | 85.9 | 976.3 | 87.2 | 990.1 | 1.2 | 13.9 |
| World total | 40.0 | 3,121.1 | 41.9 | 3,269.2 | 1.9 | 148.1 |
Compliance with Ethical Standards
Conflict of interest
The corresponding author states that there is no conflict of interest.
Footnotes
ILO estimates rely on a hybrid Dynamic Stochastic General Equilibrium/Computable General Equilibrium (DSGE/CGE) model developed by McKibbin and Fernando (2020).
In earlier simulations the authors had emphasized that the impact on poverty is ‘quite sensitive’ to the channel of transmission of the shock to domestic producers, whether it is through trade, total factor productivity, or disruption of production due to confinement (Vos et al. 2020).
The LDC category was established by the United Nations in 1971. LDCs are a group of 47 developing countries characterized by heightened structural vulnerabilities and hence deemed worthy of various forms of international support measures over and beyond what is typically provided to developing countries. For further discussion refer to CDP and UNDESA (2018) and UNCTAD (2019).
Due to inconsistencies in the regional groupings across institutions, growth rates were retrieved at individual country level and aggregated at regional level, where appropriate, following the PovcalNet classification. The need to obtain data for individual countries explains why we could not utilize the January 2020 update of the World Economic Outlook. While ascribing the difference in growth forecasts between October 2019 and April 2020 only to COVID-19 represents a clear approximation, the pandemic is unquestionably the main shock involved. Indeed, the downward revisions between October 2019 and January 2020 were negligible (-0.1% worldwide) compared with what occurred between January and April 2020.
Data in PovcalNet are standardized to the extent possible, but differences remain in relation to the data collection method, and to whether the welfare aggregate is based on income or consumption. Roughly 51% of PovcalNet surveys refer to household income and 49% to consumption, the latter being far more common in developing countries.
In order to tease out the effect of the pandemic from that of routine revisions of growth rates during the year 2019, in the pre- and post-pandemic scenarios, we modify the forecasted growth only for the year 2020.
More broadly, it is worth noting that PovcalNet estimates do not reflect societal differences in the notion of a set of “basic needs” or “basic capabilities”, they are not suitable to capture within-household inequalities hence gender-differentiated impacts, and their pertinence to “ordinary conception” of poverty has been questioned (United Nations 2020).
Whenever possible, instead of using growth in GDP per capita, the line-up method adopted by the World Bank utilizes the rate of growth of household final consumption expenditure. Since no forecast is available for the latter, we resorted to the former.
Discrepancies between the growth of household final consumption expenditure (as reported in national accounting systems) and that of mean consumption in household surveys are probably linked to the fact that wealthier households are less likely to participate in surveys and are more prone to under-reporting their income (Korinek et al. 2006; Newhouse and Vyas 2018).
For example, in so far as it may trigger the layoff of employees in formal establishments but not a complete halt to the informal economy, the downturn may actually push formal employees into informality, with ambiguous distributional effects. Analogously, while the fallout from COVID-19 might have adverse distributional impacts in urban areas, this may not necessarily be the case at a national level, especially in countries where urbanization is limited. Rural areas, which tend to be characterized by more prevalent and deeper forms of poverty, have so far been largely spared from the direct fallout from the pandemic, and in several developing countries anecdotal evidence points to a large migration away from congested, locked-down cities (Le Nestour and Moscoviz 2020).
The mismatch between our results and those of Gerszon Mahler et al. (2020a, 2020b) is explained by three factors: the use of different vintages of growth forecasts, the regional focus adopted here (as opposed to their country-by-country approach), and above all the use of 2020 population data (with some of the poorest regions recording the fastest demographic growth, hence inflating the total).
Notice that, while at each point in time a higher poverty line implies a larger (or equal) headcount ratio, this relationship does not necessarily apply to the changes in the headcount ratio between the pre- and post-COVID-19 scenarios. This explains why poverty estimates increase monotonically with the poverty line in Fig. 2, but not in a discernible way in Fig. 3.
Due to insufficient availability of more recent surveys, the reference year for South Asia and Sub-Saharan Africa is 2015 instead of 2018, as is the case for other regions, in line with the PovcalNet online platform. The adjustment specified in Eq. 1 nonetheless ensures the comparability of all estimates.
Notice that at the US$1.90 per day poverty line, the impact of COVID-19 in Sub-Saharan Africa is larger than at the higher poverty lines, reflecting the relatively high number of people living barely above the former and likely to drop below it due to the fallout from the pandemic.
Forty-three LDCs are covered by at least one survey in PovcalNet; the number of poor people is extrapolated using the average headcount ratio of the group to also account for the missing countries (Afghanistan, Cambodia, Eritrea, and Somalia).
The headcount ratio at the US$5.50 per day poverty line barely moved throughout the period, going from 94 to 88% between 1990 and 2015 (the last reference year for the Sub-Saharan African and South Asian economies).
Notice that individual country data corresponding to IMF’s June 2020 update are publicly available only for the largest economies (IMF 2020b).
Publisher's Note
Springer Nature remains neutral with regard to jurisdictional claims in published maps and institutional affiliations.
References
- Atkinson AB. Measuring Poverty around the World. Princeton, NJ: Princeton University Press; 2019. [Google Scholar]
- Aung, T.T., P. Ruma, and P. McPherson. 2020. “All My Dreams Are Shattered”: Coronavirus Crushes Asia’s Garment Industry. Reuters, 19 May. https://www.reuters.com/article/us-health-coronavirus-garment-idUSKBN22U34V. Accessed 28 May 2020.
- Baldwin, R., and B. Weder di Mauro (eds). 2020. Economics in the Time of COVID-19: A New EBook. London: Centre for Economic Policy Research (CEPR). https://voxeu.org/article/economics-time-covid-19-new-ebook. Accessed 28 May 2020.
- Castaneda Aguilar A, Gerszon Mahler D, Newhouse D. Nowcasting Global Poverty. Washington, DC: In Data Blog; 2019. [Google Scholar]
- CDP and UNDESA. 2018. Handbook on the Least Developed Country Category: Inclusion, Graduation and Special Support Measures. Third Edition. New York: United Nations. https://www.un.org/development/desa/dpad/wp-content/uploads/sites/45/2018CDPhandbook.pdf. Accessed 28 May 2020.
- Deaton A, Dupriez O. Purchasing Power Parity Exchange Rates for the Global Poor. American Economic Journal: Applied Economics. 2011;3(2):137–166. doi: 10.1257/app.3.2.137. [DOI] [Google Scholar]
- Deaton A, Kozel V. Data and Dogma. World Bank Research Observer. 2005;20(2):177–200. doi: 10.1093/wbro/lki009. [DOI] [Google Scholar]
- Djankov, S., and U. Panizza (eds.). 2020. COVID in Developing Economies. London: Centre for Economic Policy Research (CEPR). https://voxeu.org/content/covid-19-developing-economies. Accessed 30 June 2020.
- Genberg, H., and A.M. Martinez. 2014. On the Accuracy and Efficiency of IMF Forecasts: A Survey and Some Extensions. Background Paper BP/14/04. Washington, DC: Independent Evaluation Office (IEO) of the International Monetary Fund. https://citeseerx.ist.psu.edu/viewdoc/download?doi=10.1.1.587.9776&rep=rep1&type=pdf. Accessed 1 June 2020.
- Gerszon Mahler, D., C. Lakner, A. Castaneda Aguilar, and H. Wu. 2020a. The Impact of COVID-19 (Coronavirus) on Global Poverty: Why Sub-Saharan Africa Might Be the Region Hardest Hit. Data Blog (blog). 20 April. https://blogs.worldbank.org/opendata/impact-covid-19-coronavirus-global-poverty-why-sub-saharan-africa-might-be-region-hardest. Accessed 28 May 2020.
- Gerszon Mahler, D., C. Lakner, A. Castaneda Aguilar, and H. Wu. 2020b. Updated Estimates of the Impact of COVID-19 on Global Poverty. Data Blog (blog). 08 June. https://blogs.worldbank.org/opendata/updated-estimates-impact-covid-19-global-poverty. Accessed 18 June 2020.
- ILO. 2020a. ILO Monitor: COVID-19 and the World of Work (3rd Edition). Geneva: International Labor Organization (ILO). https://www.ilo.org/wcmsp5/groups/public/@dgreports/@dcomm/documents/briefingnote/wcms_743146.pdf. Accessed 28 May 2020.
- ILO. 2020b. ILO Monitor: COVID-19 and the World of Work (5rd Edition). International Labor Organization (ILO). https://www.ilo.org/wcmsp5/groups/public/---dgreports/---dcomm/documents/briefingnote/wcms_749399.pdf. Accessed 30 June 2020.
- ILO. 2020c. COVID-19 and the World of Work: Impact and Policy Responses. Geneva: International Labor Organization (ILO). https://www.ilo.org/wcmsp5/groups/public/---dgreports/---dcomm/documents/briefingnote/wcms_738753.pdf. Accessed 28 May 2020.
- IMF. 2019. World Economic Outlook: Global Manufacturing Downturn, Rising Trade Barriers (Oct 2019). Washington, DC: International Monetary Fund (IMF). https://www.imf.org/en/Publications/WEO/Issues/2020/04/14/weo-april-2020. Accessed 28 May 2020.
- IMF. 2020a. World Economic Outlook: The Great Lockdown (Chapter 1). Washington, DC: International Monetary Fund (IMF). https://www.imf.org/en/Publications/WEO/Issues/2020/04/14/weo-april-2020. Accessed 28 May 2020.
- IMF. 2020b. World Economic Outlook Update: June 2020. Washington, DC: International Monetary Fund (IMF). https://www.imf.org/en/Publications/WEO/Issues/2020/06/24/WEOUpdateJune2020. Accessed 20 June 2020.
- Jalan J, Ravallion M. Is Transient Poverty Different? Evidence for Rural China. The Journal of Development Studies. 2000;36(6):82–99. doi: 10.1080/00220380008422655. [DOI] [Google Scholar]
- Johnson, S. 2019. Ethiopia Seizes Crown as Fastest-Growing Country in the 2010s. Financial Times (FT), December 23. https://www.ft.com/content/c71cd2e5-7e32-4675-9680-e94bfd7f055d. Accessed 28 May 2020.
- Korinek A, Mistiaen JA, Ravallion M. Survey Nonresponse and the Distribution of Income. The Journal of Economic Inequality. 2006;4(1):33–55. doi: 10.1007/s10888-005-1089-4. [DOI] [Google Scholar]
- Laborde D, Martin W. Implications of the Global Growth Slowdown for Rural Poverty. Agricultural Economics. 2018;49(3):325–338. doi: 10.1111/agec.12419. [DOI] [Google Scholar]
- Laborde, D., W. Martin, and R. Vos. 2020. Poverty and Food Insecurity Could Grow Dramatically as COVID-19 Spreads. Blog, 16 April. https://www.ifpri.org/blog/poverty-and-food-insecurity-could-grow-dramatically-covid-19-spreads . Accessed 28 May 2020.
- Lakner, C., D. Gerszon Mahler, M. Negre, and E. Beer Prydz. 2019. How Much Does Reducing Inequality Matter for Global Poverty? WPS8869. Washington, DC: The World Bank. https://documents.worldbank.org/curated/en/328651559243659214/How-Much-Does-Reducing-Inequality-Matter-for-Global-Poverty. Accessed 28 May 2020.
- Le Nestour, A., and L. Moscoviz. 2020. Five Findings from a New Phone Survey in Senegal. Center For Global Development (blog). 24 April. https://www.cgdev.org/blog/five-findings-new-phone-survey-senegal Accessed 28 May 2020.
- McKibbin, W.J., and R. Fernando. 2020. The Global Macroeconomic Impacts of COVID-19: Seven Scenarios. Washington, DC: Brookings Institution. https://www.brookings.edu/research/the-global-macroeconomic-impacts-of-covid-19-seven-scenarios/. Accessed 28 May 2020.
- Newhouse, D.L., and P. Vyas. 2018. Nowcasting Poverty in India for 2014–15: A Survey to Survey Imputation Approach. 6. Global Poverty Monitoring Technical Note Series. Washington, DC: The World Bank. https://ideas.repec.org/p/wbk/wbgpmt/6.html. Accessed 28 May 2020.
- Sandefur, J., and A. Subramanian. 2020. The IMF’s Growth Forecasts for Poor Countries Don’t Match Its COVID Narrative. Working Paper 533. Washington, DC: Center for Global Development (CGD). https://www.cgdev.org/publication/imfs-growth-forecasts-poor-countries-dont-match-its-covid-narrative. Accessed 28 May 2020.
- Sumner, A., C. Hoy, and E. Ortiz-Juarez. 2020. Estimates of the Impact of COVID-19 on Global Poverty. WIDER Working Paper 2020/43. Helsinki: UNU-WIDER. 10.35188/UNU-WIDER/2020/800-9
- Sumner, A., E. Ortiz-Juarez, and C. Hoy. 2020. Precarity and the Pandemic: COVID-19 and Poverty Incidence, Intensity, and Severity in Developing Countries. WIDER Working Paper Series 2020/77. Helsinki: UNU-WIDER. 10.35188/UNU-WIDER/2020/834-4.
- UNCTAD . The Least Developed Countries Report 2015: Transforming Rural Economies. New York: United Nations; 2015. [Google Scholar]
- UNCTAD. 2019. The Least Developed Countries Report 2019: The Present and Future of External Development Finance – Old Dependence, New Challenges. New York and Geneva: United Nations Conference on Trade and Development (UNCTAD). https://unctad.org/en/pages/PublicationWebflyer.aspx?publicationid=2571. Accessed 28 May 2020.
- UNCTAD. 2020a. From the Great Lockdown to the Great Meltdown: Developing Country Debt in the Time of COVID-19’. Geneva: United Nations Conference on Trade and Development (UNCTAD). https://unctad.org/en/PublicationsLibrary/gdsinf2020d3_en.pdf. Accessed 28 May 2020.
- UNCTAD. 2020b. Impact of the Coronavirus Outbreak on Global FDI and GVCs – Updated Analysis. UNCTAD/DIAE/IA/INF/2020/2. Global Investment Trend Monitor, 34 [Special Coronavirus Edition]. Geneva: United Nations Conference on Trade and Development (UNCTAD). https://unctad.org/en/PublicationsLibrary/diaeiainf2020d3_en.pdf. Accessed 28 May 2020.
- UNCTAD. 2020c. The COVID-19 Shock to Developing Countries: Towards a “Whatever It Takes” Programme for the Two-Thirds of the World’s Population Being Left behind. Geneva: United Nations Conference on Trade and Development (UNCTAD). https://unctad.org/en/PublicationsLibrary/gds_tdr2019_covid2_en.pdf. Accessed 28 May 2020.
- UNCTAD. 2020d. The Coronavirus Shock: A Story of Another Global Crisis Foretold. New York and Geneva: United Nations Conference on Trade and Development (UNCTAD). https://unctad.org/en/pages/PublicationWebflyer.aspx?publicationid=2571. Accessed 28 May 2020.
- UNDESA. 2019. World Population Prospects 2019, vol. 1. New York: United Nations Department of Economic and Social Affairs (UNDESA), Population Division. https://population.un.org/wpp/Publications/.
- UNECA. 2020. ‘COVID-19: Lockdown Exit Strategies for Africa’. Addis Ababa: United Nations Economic Commission for Africa (UNECA). https://www.uneca.org/publications/covid-19-lockdown-exit-strategies-africa. Accessed 28 May 2020.
- United Nations. 2020. ‘The Parlous State of Poverty Eradication.’ A/HRC/44/40. Report of the Special Rapporteur on Extreme Poverty and Human Rights. New York: United Nations. https://mronline.org/wp-content/uploads/2020/07/Alston-Poverty-Report-FINAL.pdf.
- Vos, R., W. Martin, and D. Laborde. 2020. How Much Will Global Poverty Increase Because of COVID-19? 20 March. Available at: https://www.ifpri.org/blog/how-much-will-global-poverty-increase-because-covid-19. Accessed 28 May 2020.
- World Bank. 2017. Global Economic Prospects: A Fragile Recovery. Global Economic Prospects 2017. Washington, DC: World Bank.
- World Bank . Global Economic Prospects, January 2018: Broad-Based Upturn, but for How Long? Global Economic Prospects: The World Bank; 2018. [Google Scholar]
- World Bank. 2020. Supporting Women Throughout the Coronavirus (COVID-19) Emergency Response and Economic Recovery. Africa Gender Policy Briefs. Washington, DC: The World Bank. . https://openknowledge.worldbank.org/handle/10986/33612. Accessed 28 May 2020.


