Abstract
Background
Pseudomonas aeruginosa (P. aeruginosa) is a common pathogenic bacterium which causes pleural empyema, and infection of P. aeruginosa is often associated with biofilm. The aim of this study was to establish a model of rabbit empyema infected by P. aeruginosa to determine whether it causes the formation of biofilm in the pleural cavity. Furthermore, we investigated the effect of cyclic diguanosine monophosphate (c-di-GMP) on biofilm formation in this P. aeruginosa empyema model.
Methods
Twenty rabbits were used and randomly divided into five groups: PAO1, PAO1ΔwspF, and PAO1/plac-yhjH infection groups, and Luria-Bertani (LB) broth and turpentine control groups. A drainage catheter was implanted into the pleural cavity through thoracentesis. The three infection groups were respectively infected with PAO1, PAO1ΔwspF, and PAO1/plac-yhjH strains, which caused empyema. The two control groups were injected with LB or turpentine. After 4 days of infection, we sacrificed the rabbits. We evaluated the pathology of pleura through hematoxylin-eosin staining. Colony count and crystal violet assay were used to analyze the biofilm formation on the surface of catheters. Scanning electron was used to observe the biofilm on the surface of the pleura. Peptide nucleic acids-fluorescence in situ hybridization (PNA-FISH) was used to observe the biofilm in the fibrinous deposition.
Results
By the PNA-FISH assay, biofilms were observed in the fibrinous deposition of the three infection groups. The red fluorescence area of the PAO1ΔwspF infection group was larger than that of the PAO1 and PAO1/plac-yhjH infection groups. Through electron microscopy, we observed that PAO1 strains were embedded in an electron-dense extracellular matrix on the surface of pleural tissue, and appeared to be biofilm-like structures. For the crystal violet assay, the optical density values of different groups were significantly different: PAO1ΔwspF > PAO1 > PAO1/plac-yhjH > control groups (P<0.05).
Conclusions
To the best knowledge of the authors, this is the first study to report P. aeruginosa forming biofilm in a novel animal model of pleural empyema. In addition, c-di-GMP signaling molecules played an important role in biofilm formation in the pleural cavity.
Keywords: Pseudomonas aeruginosa (P. aeruginosa), pleural empyema, biofilm, cyclic diguanosine monophosphate (c-di-GMP)
Introduction
Pleural empyema is a purulent infection caused by bacteria invading the patient's pleural cavity, resulting in accumulation of purulent exudate in the pleural cavity. Despite the progress in the medical care of pleural empyema in the past decades, pleural empyema is still associated with high morbidity and mortality (1-3). The key factor leading to the lack of treatment progress may be that the pathogenesis that we do not fully understand, such as the role of biofilm formation (3).
The main pathogenic bacteria in pleural empyema are Streptococcus pneumoniae, Staphylococcus aureus, and Pseudomonas spp., of which Pseudomonas spp. accounts for 17.6% of the pathogens causing pleural empyema (1). Pseudomonas aeruginosa (P. aeruginosa) is one of the most common G- bacilli causing pleural empyema, accounting for 12% to 30% of all G- bacilli (4-6). The results of drug susceptibility tests suggest that the P. aeruginosa derived from pus is multi-drug resistant (7), resulting in poor treatment of pleural empyema. Since more than 80% of P. aeruginosa infections are related to biofilm (8), we speculate that P. aeruginosa can form biofilm in pleural empyema.
The biofilm is a structural union of microorganisms surrounded by a self-produced polymer matrix (9). Besides the matrix secreted by the microorganism itself, components from the host, such as fibrin, platelets, or immunoglobulins, can also be integrated into the biofilm (8,10,11). P. aeruginosa can form biofilm on non-biological surfaces, such as on catheters, test tubes, surgical implants, and other inorganic materials. Biofilm can also attach to biological surfaces, such as on tracheal and wound surfaces (8,10). Once P. aeruginosa forms a biofilm, its resistance to antibiotics and phagocytic immune cells will increase, resulting in clinically refractory infection (12,13).
In recent years, studies have shown that the second messenger cyclic diguanosine monophosphate (c-di-GMP) of P. aeruginosa plays a key role in biofilm formation (14). It has been proven that c-di-GMP is involved in the regulation of biofilm-related genes at the level of transcription, translation, and post-translation (12). In addition, P. aeruginosa may use c-di-GMP as a detectable signal to regulate the distinct stages of biofilm development (15). High levels of intracellular c-di-GMP can increase the production of extracellular matrix and promote a biofilm lifestyle (16). In contrast, low levels of intracellular c-di-GMP promote activation and a plankton lifestyle. Therefore, research on the second messenger c-di-GMP of P. aeruginosa is considered an important direction in treating biofilm infection.
In this study, a rabbit model for pleural empyema infected by P. aeruginosa was established to verify whether P. aeruginosa can form biofilm in the pleural space. We further investigated the pathogenicity and biofilm formation of P. aeruginosa PAO1, its high intracellular c-di-GMP containing derivative and its intracellular c-di-GMP-depleted derivative mutants. We present the following article in accordance with the ARRIVE reporting checklist (available at http://dx.doi.org/10.21037/atm-20-6022).
Methods
Animals
The rabbit experiment program has been approved by the Medical Ethics Committee of the First Affiliated Hospital of Guangxi Medical University (no. 20171228). Twenty male healthy New Zealand rabbits, weighing 2.5±0.5 kg (Table 1), were used in the experiment. Under standardized environmental conditions, rabbits were housed in separate cages, with free access to water and food. Room temperature was 25±2 °C (Rabbit Experiment Center of Guangxi Medical University).
Table 1. Body weight of the control and experimental groups before operation.
| Baseline parameter | Turpentine group (n=4) | LB group (n=4) | PAO1 group (n=4) | PAO1ΔwspF group (n=4) | PAO1/plac-yhjH group (n=4) |
|---|---|---|---|---|---|
| Body weight (kg) | 2.55 (±0.1) | 2.4 (±0.15) | 2.6 (±0.16) | 2.58 (±0.21) | 2.51 (±0.25) |
All data are given as mean ± SEM.
Bacterial strains
P. aeruginosa PAO1 wild-type strain, its high intracellular c-di-GMP containing derivative ΔwspF mutant and its intracellular c-di-GMP-depleted derivative PAO1/plac-yhjH mutant were obtained from Singapore Centre on Environmental Life Sciences Engineering, Nanyang Technological University, Singapore. The strains were maintained in Luria-Bertani (LB, Landbridge Technology Co., Ltd., Beijing, China) broth containing 25% glycerol at −80 °C. PAO1 and PAO1ΔwspF strains were grown in LB. PAO1/plac-yhjH strain was grown in LB with 60 µg/mL tetracycline to maintain the plasmid. Before each experiment, the bacterial stock was recovered and streaked onto LB agar plates. A single colony was picked and subcultured in LB or LB with 60 µg/mL tetracycline for 14–16 h at 37 °C at 200 rpm. Cells were centrifuged at 3,000 rpm for 15 min, the supernatant was removed, and cells were washed with phosphate-buffered saline (PBS) for three times. Then cells were resuspended in LB. Concentration of the bacteria in LB was determined in a spectrophotometer (General Analysis General T6, Guangzhou, China). We administered 2 mL LB with 108 CFU/mL bacteria [optical density (OD) =0.1]. The inoculum was serially diluted to 106 CFU/mL with LB (17-19). Before application, the bacterial concentration was determined by serial dilution.
Pleural empyema induction
Twenty rabbits were randomly divided into five groups: PAO1, PAO1ΔwspF, and PAO1/plac-yhjH infection groups, and control groups with LB and turpentine. Each group consisted of four rabbits.
All rabbits were anesthetized with 30 mg/kg of pentobarbital sodium. The rabbits were placed in the left lying position on the operating table. The right chest wall area was shaved from the sternal to scapular line. We used a scalpel to make a 1 cm long incision in the sixth intercostal space of the right hemithoracic cavity (2–3 cm from the spine), and then performed thoracentesis with a catheter. We excluded the air in the pleural cavity and observed whether the catheter moved with breathing to determine if the catheter was in the pleural cavity. Then, we injected 2 mL/kg of LB with the above-mentioned bacteria concentration into the right pleural cavity through the catheter. The two control groups were injected with 2 mL/kg LB or 1 mL turpentine, respectively. The catheter was rinsed with 3 mL of saline solution. After the above steps were completed, the wound was sutured. The rabbits were gently rotated manually to evenly distribute the bacterial solution in the pleural space to evenly distribute the bacterial solution in the pleural space. All experiments were repeated three times.
The end of the experiment
On the fourth day, all rabbits were sacrificed with a lethal dose of pentobarbital sodium. We then performed autopsy on the rabbits and collected the samples.
Pleural empyema score
The points of pleural empyema score 0 to 4 were used to evaluate the severity of pleural empyema. The pleural empyema score was mainly evaluated by the amount of pleural effusion, pleural adhesion, and purulent exudate according to the modified scoring system (18): 0= normal pleural space; 1= adhesions to the visceral and parietal pleura with thin fluid; 2= minimal pleural peel with only small amount of purulent exudate; 3= moderate pleural peel with purulent exudate; 4= large amount of purulent exudate. A single-blinded slide assessment was performed by two non-experimental researchers.
Indwelling catheter analysis
The indwelling catheters in the chest cavity were removed adhesive floc and rinsed before collection. We cut off the 3 cm length of the indwelling catheter at the end, and divided it into two halves. One half of the indwelling catheter was collected in 2 mL of sterile saline for colony-forming unit (CFU) counts. The catheter was vortexed for 10 min and sonicated for 1 min to ensure full removal of the biofilm from the catheters. This solution was then plated in various dilutions onto agar plates. The value was recorded as l g (CFU/mL).
The other half of catheter was collected for crystal violet staining. The catheter was washed three times and half-sheared into the hole of the 24-well plate. Then, the catheter was stained with 0.1% crystal violet for 15 min, and washed three times after staining. After the catheter drying, 33% glacial acetic acid was used for decolorization for 20 min. The OD value was determined at 570 nm by microplate reader.
Peptide nucleic acids fluorescence in situ hybridization (PNA-FISH)
All fibrinous depositions in the purulent exudate were collected in a tube with 10 mL PBS. After fibrinous depositions were washed three times, we homogenized them for 3 min. The homogenate and the last washing liquid were used for colony counting. The value was recorded as l g (CFU/mL).
The PNA-FISH kit (AdvanDx, MA, USA) was used in our research. The homogenate was placed on the slide and fixed with a flame. After the slides were dried, the homogenate on the slides was hybridized with the Texas red-labeled P. aeruginosa-specific PNA probe, and placed in a dark wet box at 57 °C for 30 min. In the dark environment, the slides were immersed in the washing solution provided by the kit, which had been preheated to 55 °C for 30 min. After the slides were washed and dried naturally, DAPI was added to redy for 15 min. Then slides were observed by fluorescence microscope. Three visual fields from each PNA-FISH slide were randomly selected for viewing under a 20× microscope to measure the area of the red fluorescent part, and the average value was recorded for future statistics.
Scanning electron microscope
The right wall parietal pleurae of New Zealand rabbits were fixed in 3% glutaraldehyde fixative solution at 4 °C for 2 h. The samples were washed three times in phosphate-buffered saline (PBS) buffer solution for 10 min each time. Subsequently, the PBS buffer solution was removed, and osmium tetroxide was fixed for 1 h. Next, the osmium tetroxide was removed, and the samples were washed three times with PBS buffer solution for 10 min. Finally, the sample tissue was dried through ethanol gradient dehydration, 100% hexamethyldisilazane immersion, and vacuum drying. After the vacuum drying was completed, the sample was sprayed with an IB3 (IB5) ion-sputtering instrument and observed under an electron microscope. The above process was completed at 4 °C.
Histopathological examination
The pleura tissues of all rabbits were taken for histopathological examination. The pleural tissues were fixed in 10% formaldehyde solution for 24 h. After the sections were paraffinized, the pleura tissues were stained with hematoxylin and eosin (HE). For each HE slide, three visual fields were randomly selected for viewing under a 10× microscope to measure the thickness of the pleura, and the average value was recorded.
Statistics
Statistical analysis was performed using the SPSS 23.0 statistical software package. Comparisons between multiple groups were conducted using one-way analysis of variance (ANOVA). A P value <0.05 was considered statistically significant.
Results
Rabbit model
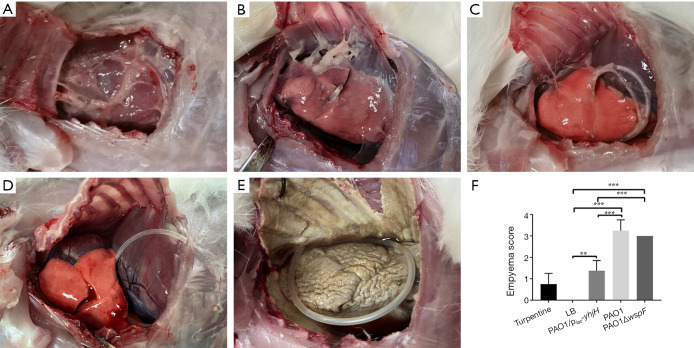
A total of 60 rabbits were used in the experiment. After rabbits were infected by P. aeruginosa for 4 days, there were varying degrees of pleural adhesions and fibrin depositions between the visceral pleura and parietal pleura (Figure 1A,B,C,D,E). Neutrophils could be observed in the purulent exudation, and Gram staining showed positive for bacteria. Among the three infection groups, the pleural empyema scores of the PAO1 and the PAO1ΔwspF infection groups were significantly higher than those of the PAO1/plac-yhjH infection group (P<0.05, Figure 1F).
Figure 1.
The gross pathology specimens of rabbit pleural cavities 96 h after injection. For PAO1 group (A), PAO1ΔwspF group (B), and PAO1/plac-yhjH group (C), there were varying degrees of pleural adhesions and fibrin depositions between the visceral pleura and parietal pleura. (D) In the LB control group, there were no significant changes in the right pleural cavity. (E) In the turpentine control group, there was severe aseptic inflammation. (F) The empyema score of each group. Results displaying the mean ± SD. An asterisk indicates significant difference, **, P<0.01; ***, P<0.001. The ANOVA tested. (300×300 DPI). LB, Luria-Bertani.
Pleural histopathology
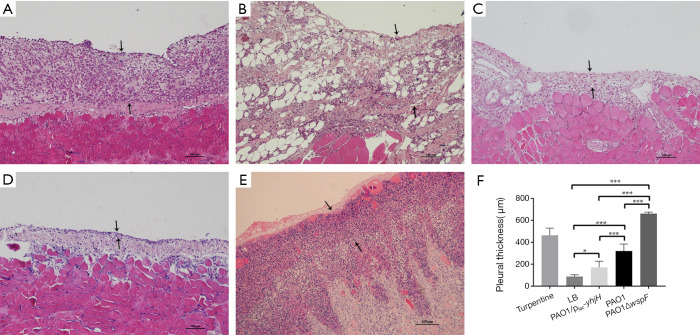
Compared with LB control group, the pleural tissues of three infection groups were significantly thickened (P<0.05), with more inflammatory cell infiltration (Figure 2A,B,C,D). The pleural thickness of each group was as follows: PAO1ΔwspF > PAO1 > PAO1/plac-yhjH > control group with LB (P<0.05) (Figure 2F).
Figure 2.
The morphological changes of the parietal pleura (HE staining, 10×). The area between the two black arrows is the pleura. (A) In the PAO1 infection group, there was thickening of parietal pleura, accompanied by many inflammatory cells infiltration. (B) In the PAO1ΔwspF infection group, the thickening of the parietal pleura was more significant than that in the PAO1 group, accompanied by a large number of inflammatory cell infiltration. (C) In the PAO1/plac-yhjH infection group, the parietal pleura was slightly thickened with only mild inflammation. (D) In the LB control group, few inflammatory cells infiltrated into the pleura. (E) In the turpentine control group, there was severe aseptic inflammation. (F) Pleural thickness. Results displaying the mean ± SD. An asterisk indicates significant difference, *, P<0.05; ***, P<0.001. The ANOVA tested. (300×300 DPI). LB, Luria-Bertani.
Catheter bacteriology
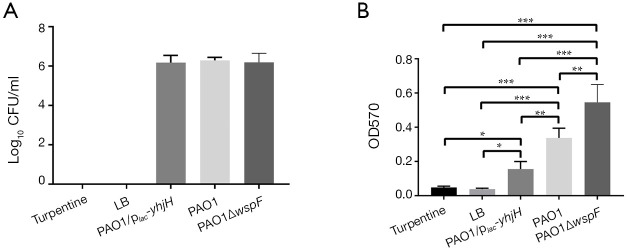
The colony counts of LB or turpentine control group was zero. The colony counts in the PAO1, PAO1ΔwspF, and PAO1/plac-yhjH infection groups were shown in Figure 3A. There was no significant difference in colony counts of catheters among three infection groups (P>0.05).
Figure 3.
The results of colony counts and crystal violet staining of the indwelling catheters. (A) Colony counts of P. aeruginosa on the surface of indwelling catheters showed no significant difference (P>0.05). (B) The optical density values of crystal violet staining of indwelling catheters in five groups. Results displaying the mean ± SD. An asterisk indicates a significant difference, *, P<0.05; **, P<0.01; ***, P<0.001. The ANOVA tested. (1,800 px minimum). LB, Luria-Bertani.
Catheter crystal violet staining
The OD values of crystal violet staining of three infection groups were higher than those of LB or turpentine control group (P<0.05). There was a significant difference in the OD values among the three infection groups: PAO1ΔwspF > PAO1 > PAO1/plac-yhjH (P<0.05) (Figure 3B).
The biofilms in fibrinous deposition of purulent exudate
By counting the colonies of the washing liquid and homogenate liquid of the fibrinous deposition, we found that the number of bacteria in the washing liquid was significantly less than that in the homogenate liquid (P<0.05). The CFU of homogenate among the three infection groups were not significantly different (P>0.05). The colony counts of homogenate in the control groups (LB or turpentine) was zero (Figure 4).
Figure 4.
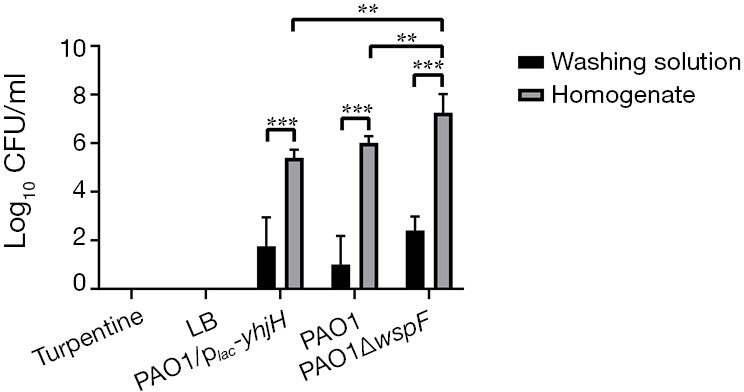
The colony counts of fibrinous deposition in the purulent exudate. Results displaying the mean ± SD. An asterisk indicates a significant difference, **, P<0.01; ***, P<0.001. (1,800 px minimum). LB, Luria-Bertani.
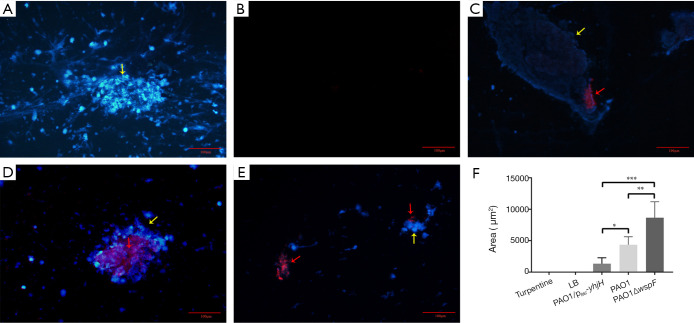
The PNA-FISH method was established to detect the ribosomal RNA of P. aeruginosa in fibrinous deposition of purulent exudate, further verify the aggregation in fibrinous depositions of purulent exudate. For the turpentine control group, there was only blue fluorescence, without red fluorescence (Figure 5A). For the LB control group, there was hardly purulent exudate (Figure 5B). However, in the three infection groups, a large number of bacteria (red) were surrounded by host cells (blue), showing a bright PNA-FISH signal (Figure 5C,D,E). These structures were the aggregations. The area of red fluorescence in each group was compared. The area of the PAO1ΔwspF infection group was significantly larger than that of the PAO1 and PAO1/plac-yhjH infection groups (Figure 5F; P<0.05).
Figure 5.
The PNA-FISH of fibrinous deposition in the purulent exudate (20×). The PNA-FISH kit used a P. aeruginosa-specific probe (red) and unspecific nucleic acid stain DAPI (blue) to show biofilms. The figure showed that the bacteria were surrounded by host cells in C, D and E. The red part pointed by the red arrow is the aggregate, and the yellow arrow points to the blue part is the polymorphonuclear leukocytes around the aggregate. (A) Turpentine control group. (B) LB control group. (C) PAO1 infection group. (D) PAO1ΔwspF infection group. (E) PAO1/plac-yhjH infection group. (F) Biofilm size determined by PNA-FISH. Results display the mean ± SD. An asterisk indicates a significant difference, *, P<0.05; **, P<0.01; ***, P<0.001. The ANOVA tested (300×300 DPI). LB, Luria-Bertani.
Scanning electron microscopy of pleural tissue
The clustering of cells on the surface of pleural tissue was confirmed by scanning electron microscopy. We observed that PAO1 strains were embedded in an electron-dense extracellular matrix on the surface of pleural tissue, which appeared as biofilm-like structures (Figure 6). However, the phenomenon was only observed on a few pleural tissues infected by PAO1 strain.
Figure 6.
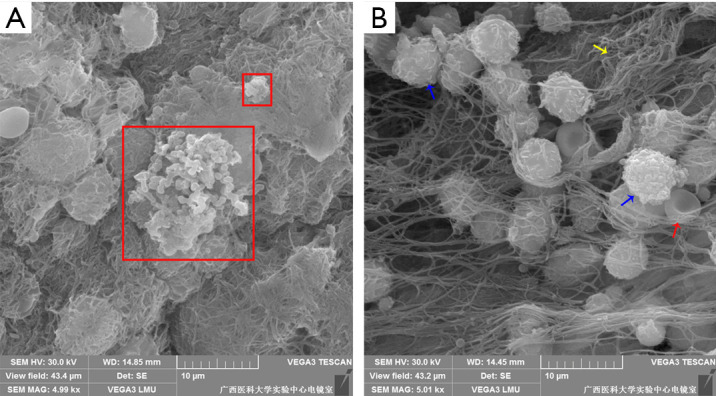
Observation of the pleural surface by scanning electron microscopy. (A) Biofilm-like structures on the pleural surface (5,000×). (B) Pleural surface host cells (5,000×). PAO1 wild-type strains were embedded in electron-dense extracellular matrix (red box), which appeared to be biofilm-like structures. The blue arrow indicates the polymorphonuclear leukocytes, the yellow arrow indicates the fibrin and the red arrow indicates erythrocyte (300×300 DPI).
Discussion
Pleural empyema is a debilitating disease. Despite receiving appropriate medical treatment, approximately 10–20% of patients with pleural empyema die (3). In recent years, the treatment of pleural empyema has continued to develop, but progress has been limited. This is perhaps because a lack of understanding concerning the mechanism in pleural infection, including how biofilm forms in the pleural cavity. P. aeruginosa is a common pathogenic bacterium that causes pleural empyema (20). However, it has not been confirmed whether P. aeruginosa can form biofilm in the pleural cavity. Therefore, the mechanism and treatment of pleural empyema associated with biofilm is still unclear. To the best knowledge of the authors, this is the first study to report P. aeruginosa forming biofilm in a novel rabbit model of pleural empyema for biofilm.
The formation of biofilm on catheter was verified in pleural empyema by colony count and crystal violet staining. These results indicated that biofilm-associated foreign body infection can also occur in the pleural empyema. Compared with the control group, catheters with biofilm formation by P. aeruginosa were surrounded by a large amount of purulent exudate, resulting in the formation of abscess around the catheter.
Bacteria, in addition to attaching to the surface of foreign bodies, can also form self-aggregating flocs during static cultivation (21). In clinic, the patients with pleural empyema often have fibrinous deposition in the pleural cavity. However, there is a lack of research concerning whether the fibrinous deposition contains aggregation. Through observing the fibrinous deposition by PNA-FISH, we observed aggregations had formed in all samples from infection groups. The aggregations were predominantly surrounded by host cells, while this phenomenon was not observed in the turpentine control group. Our finding is different with a previous description of purulent exudate and the traditional view which holds that the purulent exudate is composed of fibers and host cells (22),likely requiring a very different treatment strategy in pleural empyema.
We further observed biofilm-like structures on the pleural tissue via electron microscopy. However, the biofilm-like structure (a structure in which a large number of rod-shaped bacteria were embedded in an electron-dense extracellular matrix) was only observed on a few pleural tissues. Based on the PNA-FISH results of the fibrinous depositions, we speculated that it may be biofilm on the surface of the pleura. The reason why biofilm is difficult to observe on the surface of pleura may be that the bacteria are surrounded by a large number of host leukocytes and exuded fibrin. We also observed the pleural slice by PNA-FISH, but it was still difficult to observe the biofilm.
C-di-GMP is an important secondary messenger in P. aeruginosa cells. For the formation of biofilm, high concentrations of intracellular c-di-GMP are generally associated with biofilm formation, while low concentrations of intracellular c-di-GMP are associated with biofilm dispersion and the plankton lifestyle (23). Therefore, in order to explore the effect of c-di-GMP on the biofilm formation in pleural empyema, we used PAO1, PAO1ΔwspF and PAO1/plac-yhjH strains to establish different pleural empyema rabbit models, respectively. We found that the PAO1ΔwspF strain had the most powerful biofilm formation ability on the surface of thoracic catheter, followed by PAO1 strain, and PAO1/plac-yhjH strain had the weakest ability. Similar results were obtained in the PNA-FISH analysis of the fibrinous depositions. This indicated that high levels of intracellular c-di-GMP contributed to the biofilm formation during the process of P. aeruginosa invading the pleural cavity.
Cole and Lee established a catheter-related urinary tract infection model (24), and compared the pathogenicity of P. aeruginosa with different levels of intracellular c-di-GMP in vivo. The study showed that P. aeruginosa with higher intracellular c-di-GMP levels increased the bacterial load of the bladder and kidneys, and promoted bacterial colonization and biofilm formation in the bladder. This is consistent with our experimental results. However, the three infection groups did not show a significant difference in the colony counts. The possible reason for this was that the complex environment of chest cavity. Under the influence of confounding factors such as oxygen concentration, nutrition and PH value in the pleural cavity, the three P. aeruginosa strains might not be in the same growth period.
In addition, we also observed that pleural lesions caused by PAO1ΔwspF or PAO1 strain were significantly heavier than those caused by PAO1/plac-yhjH strain. We therefore speculated that intracellular c-di-GMP levels may be related to the pathogenicity of P. aeruginosa infections in vivo. Malone et al. studied the PAO1ΔyfiR strain with high level of intracellular c-di-GMP and wild-type PAO1 strain. They found that PAO1ΔyfiR strain could be easier induced to transform into the small-colony variant, which has been proven to be effective in persistent infection of the subcutaneous catheter. In addition, compared with PAO1 strain, PAO1ΔyfiR strain was found to be more resistant to macrophage phagocytosis, indicating that high levels of intracellular c-di-GMP may enhance the cytotoxicity of P. aeruginosa (25).
Of the previous studies on pleural empyema, none has examined biofilm in the pleural cavity (3). Therefore, the understanding of the mechanism and treatment of pleural empyema for biofilm is insufficient. In the treatment of pleural empyema, drainage combined with antibiotics has been the standard treatment (26). However, biofilm has stronger resistance to antibiotics, and the antibiotics we generally choose cannot penetrate biofilm to kill bacteria (27-29). Therefore, when we ignore the role of biofilm on the treatment of pleural empyema, it may lead to long-term recurrence of infection in the pleural empyema, which greatly increases the medical burden. Moreover, the biofilm formation on the indwelling catheter can make the management of drainage tubes on clinical pleural empyema even more difficult, provoking a number of dilemmas: Should we use a pleural drainage tube that prevents biofilm formation? Do we need to re-determine the retention time and replacement time of the drainage tube? How can we control the formation of biofilm on the drainage tube?
There are three limitations in this study. First, the growth and biofilm formation of P. aeruginosa are affected by many factors, such as oxygen concentration, temperature, and culture time (30-32). The formation of P. aeruginosa biofilm is an endless cycle. P. aeruginosa cells gradually form an early biofilm from adhesion within 24 h, and further form a mature biofilm within 24 to 96 h, and then disperse from the biofilm and enter a planktonic state (30). In harsh environments, whether it is low oxygen concentration or low temperature, it will inhibit the growth of P. aeruginosa and promote the formation of biofilms (31,32). Although we did not compare or observe these factors in our experiment, we will compare these factors in future studies. Second, our study only described the mechanism that c-di-GMP regulates P. aeruginosa biofilm formation, but did not go into how c-di-GMP regulates P. aeruginosa biofilm formation in pleural empyema. Third, the regulation of biofilm formation is also related to the quorum sensing (QS) signaling system, and there is an internal connection between QS and c-di-GMP signaling pathways (33). Due to the impact of the Coronavirus Disease 2019, we only studied the c-di-GMP signaling pathway, and failed to explore the impact of QS on biofilm formation and the intrinsic relationship between QS and c-di-GMP signaling system.
In conclusion, our study was the first experiment to investigate P. aeruginosa biofilm formation in pleural empyema. It was also a novel biofilm model, which provided a platform for information on the pathogenesis and treatment of pleural empyema. The novel rabbit model for biofilm further supplied evidence for the critical role of c-di-GMP signaling in the establishment of biofilm and the pathogenicity for P. aeruginosa in vivo.
Supplementary
The article’s supplementary files as
Acknowledgments
The report has been selected for oral presentation at the ERS 2020 Virtual International Congress.
Funding: The National Natural Science Foundation (no. 81760024 and 81460003).
Ethical Statement: The authors are accountable for all aspects of the work in ensuring that questions related to the accuracy or integrity of any part of the work are appropriately investigated and resolved. The rabbit experiment program has been approved by the Medical Ethics Committee of the First Affiliated Hospital of Guangxi Medical University (no. 20171228). This study complied with the ethical standards for animal care formulated by the Experimental Animal Ethics Committee of The First Affiliated Hospital of Guangxi Medical University.
Footnotes
Reporting Checklist: The authors have completed the ARRIVE reporting checklist. Available at http://dx.doi.org/10.21037/atm-20-6022
Data Sharing Statement: Available at http://dx.doi.org/10.21037/atm-20-6022
Conflicts of Interest: All authors have completed the ICMJE uniform disclosure form (available at http://dx.doi.org/10.21037/atm-20-6022). Dr. JL, Dr. KW and Dr. ZZ report a patent A method of P. aeruginosa pleural empyema rabbit model for biofilm in fibrinous deposition of purulent exudate pending, and a patent A method of P. aeruginosa pleural empyema rabbit model for biofilm in catheters pending. The other authors have no conflicts of interest to declare.
References
- 1.Hassan M, Cargill T, Harriss E, et al. The microbiology of pleural infection in adults: a systematic review. Eur Respir J 2019;54:1900542. 10.1183/13993003.00542-2019 [DOI] [PubMed] [Google Scholar]
- 2.Cargill TN, Hassan M, Corcoran JP, et al. A systematic review of comorbidities and outcomes of adult patients with pleural infection. Eur Respir J 2019;54:1900541. 10.1183/13993003.00541-2019 [DOI] [PMC free article] [PubMed] [Google Scholar]
- 3.Bedawi EO, Hassan M, McCracken D, et al. Pleural infection: a closer look at the etiopathogenesis, microbiology and role of antibiotics. Expert Rev Respir Med 2019;13:337-47. 10.1080/17476348.2019.1578212 [DOI] [PubMed] [Google Scholar]
- 4.Mohanty S, Kapil A, Das BK. Bacteriology of parapneumonic pleural effusions in an Indian hospital. Trop Doct 2007;37:228-9. 10.1258/004947507782333152 [DOI] [PubMed] [Google Scholar]
- 5.Ramage G, Robertson SN, Williams C. Strength in numbers: antifungal strategies against fungal biofilms. Int J Antimicrob Agents 2014;43:114-20. 10.1016/j.ijantimicag.2013.10.023 [DOI] [PubMed] [Google Scholar]
- 6.Malhotra P, Aggarwal AN, Agarwal R, et al. Clinical characteristics and outcomes of empyema thoracis in 117 patients: a comparative analysis of tuberculous vs. non-tuberculous aetiologies. Respir Med 2007;101:423-30. 10.1016/j.rmed.2006.07.016 [DOI] [PubMed] [Google Scholar]
- 7.Asai N, Suematsu H, Hagihara M, et al. The etiology and bacteriology of healthcare-associated empyema are quite different from those of community-acquired empyema. J Infect Chemother 2017;23:661-7. 10.1016/j.jiac.2017.04.011 [DOI] [PubMed] [Google Scholar]
- 8.Lebeaux D, Chauhan A, Rendueles O, et al. From in vitro to in vivo Models of Bacterial Biofilm-Related Infections. Pathogens 2013;2:288-356. 10.3390/pathogens2020288 [DOI] [PMC free article] [PubMed] [Google Scholar]
- 9.Rybtke M, Hultqvist LD, Givskov M, et al. Pseudomonas aeruginosa Biofilm Infections: Community Structure, Antimicrobial Tolerance and Immune Response. J Mol Biol 2015;427:3628-45. 10.1016/j.jmb.2015.08.016 [DOI] [PubMed] [Google Scholar]
- 10.Bjarnsholt T, Ciofu O, Molin S, et al. Applying insights from biofilm biology to drug development - can a new approach be developed? Nat Rev Drug Discov 2013;12:791-808. 10.1038/nrd4000 [DOI] [PubMed] [Google Scholar]
- 11.Hall-Stoodley L, Stoodley P, Kathju S, et al. Towards diagnostic guidelines for biofilm-associated infections. FEMS Immunol Med Microbiol 2012;65:127-45. 10.1111/j.1574-695X.2012.00968.x [DOI] [PubMed] [Google Scholar]
- 12.Skariyachan S, Sridhar VS, Packirisamy S, et al. Recent perspectives on the molecular basis of biofilm formation by Pseudomonas aeruginosa and approaches for treatment and biofilm dispersal. Folia Microbiol (Praha) 2018;63:413-32. 10.1007/s12223-018-0585-4 [DOI] [PubMed] [Google Scholar]
- 13.Wang K, Chen YQ, Salido MM, et al. The rapid in vivo evolution of Pseudomonas aeruginosa in ventilator-associated pneumonia patients leads to attenuated virulence. Open Biol 2017;7:170029. 10.1098/rsob.170029 [DOI] [PMC free article] [PubMed] [Google Scholar]
- 14.Wei Q, Zhang Z, Luo J, et al. Insulin treatment enhances pseudomonas aeruginosa biofilm formation by increasing intracellular cyclic di-GMP levels, leading to chronic wound infection and delayed wound healing. Am J Transl Res. 2019;11:3261-79. [PMC free article] [PubMed] [Google Scholar]
- 15.Valentini M, Filloux A. Biofilms and Cyclic di-GMP (c-di-GMP) Signaling: Lessons from Pseudomonas aeruginosa and Other Bacteria. J Biol Chem 2016;291:12547-55. 10.1074/jbc.R115.711507 [DOI] [PMC free article] [PubMed] [Google Scholar]
- 16.Ha DG, O'Toole GA. c-di-GMP and its Effects on Biofilm Formation and Dispersion: a Pseudomonas Aeruginosa Review. Microbiol Spectr 2015;3:MB-0003-2014. 10.1128/microbiolspec.MB-0003-2014 [DOI] [PMC free article] [PubMed] [Google Scholar]
- 17.Kerget B, Araz O, Kerget F, et al. Evaluation of the Roflumilast Effect Supplemented with Linezolid in Pleural Empyema in Rats Caused by Intrapleural Staphylococcus aureus Inoculation. Jpn J Infect Dis 2020;73:1-7. 10.7883/yoken.JJID.2019.164 [DOI] [PubMed] [Google Scholar]
- 18.Zhu Z, Hawthorne ML, Guo Y, et al. Tissue plasminogen activator combined with human recombinant deoxyribonuclease is effective therapy for empyema in a rabbit model. Chest 2006;129:1577-83. 10.1378/chest.129.6.1577 [DOI] [PubMed] [Google Scholar]
- 19.Sasse SA, Causing LA, Mulligan ME, et al. Serial pleural fluid analysis in a new experimental model of empyema. Chest 1996;109:1043-8. 10.1378/chest.109.4.1043 [DOI] [PubMed] [Google Scholar]
- 20.Koma Y, Inoue S, Oda N, et al. Clinical characteristics and outcomes of patients with community-acquired, health-care-associated and hospital-acquired empyema. Clin Respir J 2017;11:781-8. 10.1111/crj.12416 [DOI] [PubMed] [Google Scholar]
- 21.Trunk T, Khalil HS, Leo JC. Bacterial autoaggregation. AIMS Microbiol 2018;4:140-64. 10.3934/microbiol.2018.1.140 [DOI] [PMC free article] [PubMed] [Google Scholar]
- 22.Shen KR, Bribriesco A, Crabtree T, et al. The American Association for Thoracic Surgery consensus guidelines for the management of empyema. J Thorac Cardiovasc Surg 2017;153:e129-46. 10.1016/j.jtcvs.2017.01.030 [DOI] [PubMed] [Google Scholar]
- 23.Jenal U, Reinders A, Lori C. Cyclic di-GMP: second messenger extraordinaire. Nat Rev Microbiol 2017;15:271-84. 10.1038/nrmicro.2016.190 [DOI] [PubMed] [Google Scholar]
- 24.Cole SJ, Lee VT. Cyclic Di-GMP Signaling Contributes to Pseudomonas aeruginosa-Mediated Catheter-Associated Urinary Tract Infection. J Bacteriol 2015;198:91-7. 10.1128/JB.00410-15 [DOI] [PMC free article] [PubMed] [Google Scholar]
- 25.Malone JG, Jaeger T, Spangler C, et al. YfiBNR mediates cyclic di-GMP dependent small colony variant formation and persistence in Pseudomonas aeruginosa. PLoS Pathog 2010;6:e1000804. 10.1371/journal.ppat.1000804 [DOI] [PMC free article] [PubMed] [Google Scholar]
- 26.Høiby N, Bjarnsholt T, Moser C, et al. ESCMID guideline for the diagnosis and treatment of biofilm infections 2014. Clin Microbiol Infect 2015;21 Suppl 1:S1-25. 10.1016/j.cmi.2014.10.024 [DOI] [PubMed] [Google Scholar]
- 27.Wei Q, Ma LZ. Biofilm matrix and its regulation in Pseudomonas aeruginosa. Int J Mol Sci 2013;14:20983-1005. 10.3390/ijms141020983 [DOI] [PMC free article] [PubMed] [Google Scholar]
- 28.Ciofu O, Tolker-Nielsen T. Tolerance and Resistance of Pseudomonas aeruginosa Biofilms to Antimicrobial Agents-How P. aeruginosa Can Escape Antibiotics. Front Microbiol 2019;10:913. 10.3389/fmicb.2019.00913 [DOI] [PMC free article] [PubMed] [Google Scholar]
- 29.Pang Z, Raudonis R, Glick BR, et al. Antibiotic resistance in Pseudomonas aeruginosa: mechanisms and alternative therapeutic strategies. Biotechnology Advances 2019;37:177-92. 10.1016/j.biotechadv.2018.11.013 [DOI] [PubMed] [Google Scholar]
- 30.Rasamiravaka T, Labtani Q, Duez P, et al. The formation of biofilms by Pseudomonas aeruginosa: a review of the natural and synthetic compounds interfering with control mechanisms. Biomed Res Int 2015;2015:759348. 10.1155/2015/759348 [DOI] [PMC free article] [PubMed] [Google Scholar]
- 31.Sønderholm M, Kragh KN, Koren K, et al. Pseudomonas aeruginosa Aggregate Formation in an Alginate Bead Model System Exhibits In Vivo-Like Characteristics. Appl Environ Microbiol 2017;83:e00113-17. 10.1128/AEM.00113-17 [DOI] [PMC free article] [PubMed] [Google Scholar]
- 32.Høyland-Kroghsbo NM, Munoz KA, Bassler BL. Temperature, by Controlling Growth Rate, Regulates CRISPR-Cas Activity in Pseudomonas aeruginosa. mBio 2018;9:e02184-18. 10.1128/mBio.02184-18 [DOI] [PMC free article] [PubMed] [Google Scholar]
- 33.Guła G, Dorotkiewicz-Jach A, Korzekwa K, et al. Complex Signaling Networks Controlling Dynamic Molecular Changes in Pseudomonas aeruginosa Biofilm. Curr Med Chem 2019;26:1979-93. 10.2174/0929867325666180912110151 [DOI] [PubMed] [Google Scholar]
Associated Data
This section collects any data citations, data availability statements, or supplementary materials included in this article.
Supplementary Materials
The article’s supplementary files as


