Abstract
To curb the spread of the coronavirus, China implemented lockdown policies on January 23, 2020. The resulting extreme changes in human behavior may have influenced the air pollutants concentration. However, despite these changes, hazy weather persisted in Shanghai and became a public issue. This study aims to investigate air pollutant mass concentration changes during the lockdown in Shanghai. Air pollutant mass concentration data and meteorological data during the pre-lockdown period and the level I response lockdown period were analyzed by statistical analysis and a Lagrangian particle diffusion model. The data was classified in three periods: P1 (pre-lockdown: 10 days before the Spring Festival), P2 (the first 10 days after lockdown: during the Spring Festival celebration), and P3 (the second 10 days after lockdown: after the Spring Festival). Data for the same period in 2019 were used as a reference. The results indicate that the Spring Festival holiday in 2019 resulted in a reduction in energy consumption, which led to a decrease in PM2.5 (26.4%) and NO2 (43.41%) mass concentration, but an increase in ozone mass concentration (31.39%) in P2 compared with P1. The integrated effect of the Spring Festival holiday and lockdown in 2020 resulted in a decrease in PM2.5 (36.5%) and NO2 (51.9%) mass concentrations, but an increase in ozone mass concentration (43.8%) in P2 compared with P1. After the Spring Festival, the mass concentrations of PM2.5, SO2, and NO2 increased by 74.41%, 5.52%, and 53.28%, respectively in P3 compared with P2 in 2019. However, PM2.5 and SO2 concentrations in 2020 continued to decrease, by 14.74% and 4.61%, respectively, while NO2 mass concentration increased by 7.82% in P3 compared with P2. We also found that PM2.5 mass concentration is susceptible to regional transmission from the surrounding cities. PM2.5 and other gaseous pollutants show different correlations in different periods, while NO2 and O3 always show a strong negative correlation. The principal components before the Spring Festival in 2019 were O3 and NO2, and after the Spring Festival, they were PM2.5 and CO, while the principal components before the lockdown in 2020 were PM2.5 and CO, and during lockdown they were O3 and NO2.
Electronic supplementary material
The online version of this article (10.1007/s11869-020-00956-x) contains supplementary material, which is available to authorized users.
Keywords: COVID-19, Air-pollutant mass concentration, Lagrangian particle dispersion model, Spring festival, Shanghai
Introduction
Urban air quality can be improved by controlling anthropogenic emissions. China has a lot of successful examples, such as during the 2008 Beijing Olympic Games, the 2010 Shanghai world expo, the 2014 Asia-Pacific Economic Cooperation (APEC) meeting, and other major events and exhibitions. The Chinese government has adopted a series of controls (to temporarily reduce anthropogenic emissions from factories, industrial plants, construction sites, vehicles, and gas stations) to ensure a good atmospheric environment in the host cities (Ma et al. 2010; Huang et al. 2013, 2015).
As an extreme event, to mitigate the possible impacts due to the outbreak of COVID-19, a series of lockdown activities have been implemented in many countries. The impact of these policies on the atmospheric environment has attracted the attention of scholars worldwide and provided special opportunities for atmospheric researches (Nakada and Urban 2020; Bashir et al. 2020; Kraemer et al. 2020; Tobías et al. 2020). Several studies have shown that these counter-COVID-19 measures have played a significant role in improving air quality (Chauhan and Singh 2020; Collivignarelli et al. 2020; Fuwape et al. 2020; Isaifan 2020; Kerimray et al. 2020; Li et al. 2020; Otmani et al. 2020; Shakoor et al. 2020).
China was the first country to carry out national lockdown policies to restrict travel, shut down commercial activities, and require its people to stay at home, beginning in late January 2020 (Tian et al. 2020; Wang et al. 2020a). Satellite imageries from the European Space Agency (ESA 2020) and the National Aeronautics and Space Administration (NASA 2020) have shown that the volume of NO2 over China decreased significantly due to a decline in economic activity and energy consumption resulting from the COVID-19 lockdown. However, Wang et al. (2020b) point out the fact that a severe haze still occurred in the North China Plain during the lockdown. The significant reductions in traffic emissions and small reductions in industrial emissions could not help to reduce the severe air pollution in China, especially in unfavorable meteorological conditions. In addition, the secondary aerosols were the main cause of severe haze pollution in winter in eastern China (Wang et al. 2020c). Wang et al. (2020b) find the background and residual pollutions are still high during lockdown over the Yangtze River Delta Region.
Since the start time of lockdown overlaps with the Spring Festival in China this year, so the air pollutant changes during lockdown are actually influenced by the combination of the Spring Festival and the epidemic prevention and control. However, most of these existing studies mainly focus on the changes of air pollutants before and after lockdown, and few compared the differences of air pollutants before and after the Spring Festival in previous years and 2020. Therefore, in order to better illustrate the changes of air pollutants during these periods, Shanghai which is the most populous urban area in China and the second-most populous city proper in the world is chosen as the target area. It suffered from PM2.5 concentration during the lockdown period, which became a public issue.
First, we divided the research time into three periods according to the start time of lockdown and the Spring Festival (see “The Research Period Determination” chapter for details). Secondly, statistical and a Lagrangian particle diffusion model (LPDM) are conducted to comprehensively analyze the characteristics of air pollutant concentration, meteorological conditions, and influencing factors in 2019 and 2020. The results can provide basic data for the prevention and control of urban air pollution.
Background
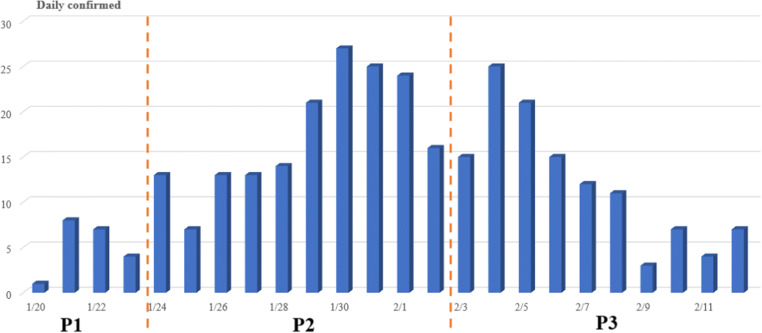
The daily confirmed cases of COVID-19 from January 20 to February 12 in 2020 in Shanghai were summarized in Fig. 1. The number of confirmed cases per day increased rapidly from January 20 to 30. The number of reported COVID-19 cases in Shanghai reached its maximum, with about 27 new cases on January 30. This may be related to the Chinese Spring Festival. The spread of COVID-19 is accelerated to a certain extent by the mass migration due to the celebration of the Spring Festival. Quarantine measures were effective in curbing the spread of the virus, and the number of confirmed cases per day dropped significantly from January 31 to February 12.
Fig. 1.
Daily Changes in new confirmed cases of COVID-19 in Shanghai. Source: (Shanghai Municipal Health Commission,2020)
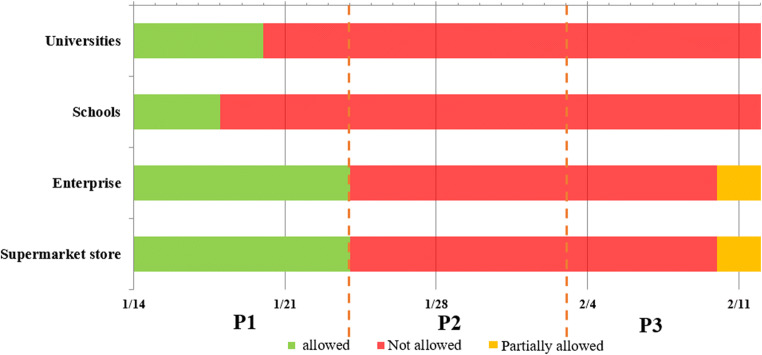
As shown in Fig. 2, before the Spring Festival holiday, some enterprise and supermarket stores remained open until January 23 while universities and school activities continued until January 20 and 18 in 2020. With the rapid spread of infections, the government adopted strong containment measures in Shanghai: only factories producing essential supplies (e.g., food, epidemic prevention materials) were authorized to remain operative. The Spring Festival in 2020 has was extended from the original 7 days (January 24–January 30) to 10 days (January 24–February 2) when the partial lockdown was declared. Even on February 2, many cities still strictly controlled population movement and resumption of work and production. The Spring Festival holiday in 2020 was extended resulting in a much lower population flow than during the Spring Festival in 2019. It was not until March 24 that the epidemic prevention and control was adjusted to the second-level response, and social activities gradually resumed.
Fig. 2.
Scheme of activities allowed and prohibited from January 14 to February 12, 2020 in Shanghai
This has had a negative impact on the economy. As illustrated in Fig. 3, Shanghai’s GDP in the first quarter was 7856.62 billion yuan: a year-on-year decrease of 5.44%.
Fig. 3.
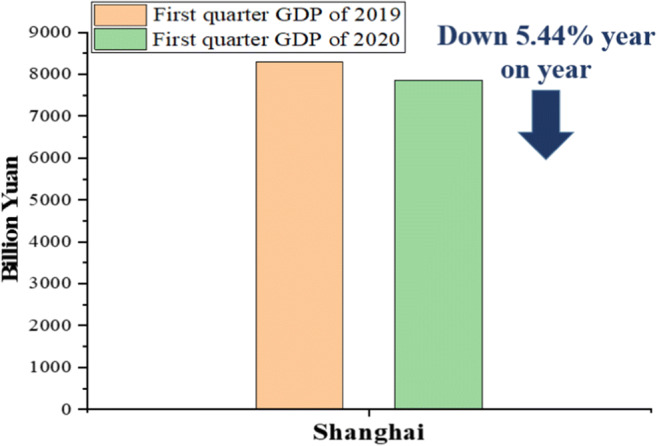
Statistics of Shanghai GDP in first quarters of 2019 and 2020
Materials and methods
Data collection
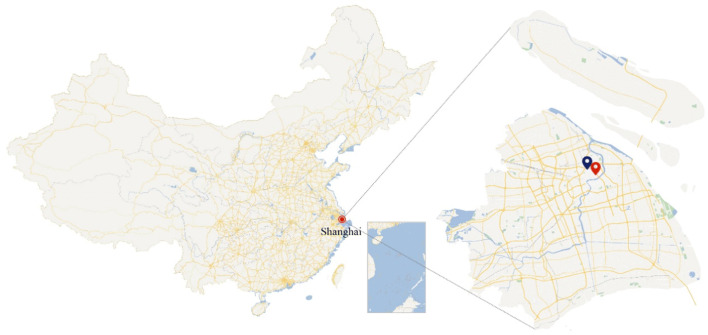
This study uses the real-time air pollutant (SO2, NO2, CO, O3, PM2.5) hourly mass concentration of the Yangpu sipiao monitoring station released by the Shanghai Municipal Ecological Environment Bureau (https://sthj.sh.gov.cn/) data. The air monitoring location is indicated by the red point in Fig. 4. The meteorological parameters, including atmospheric pressure, wind direction, wind speed, air temperature, relative humidity, and rainfall, were measured by the AG1000 automatic weather station at the point shown in blue in Fig. 4. The instruments were set up on tall-building roofs, approximately 90 m above ground level. The distance between the air quality monitoring stations and meteorological stations is 3 km.
Fig. 4.
Map of Metropolitan area of Shanghai and location of sampling sites
Data processing
Research period determination
On January 24, 2020 (Spring Festival’s Eve), Shanghai carried out lockdown policies. The lockdown coincided with the Spring Festival holiday, when normal production activities usually decline. In order to understand the details of the air pollutant mass concentration changes, we considered the integrated effect of the lockdown policy and the Spring Festival. The data was classified in three periods in 2020: P1, January 14–23 (pre-lockdown: before the Spring Festival), P2, January 24–February 2 (the first 10 days after lockdown: during the Spring Festival celebration) and P3, February 3–12 (the second 10 days after lockdown: after the Spring Festival holiday), and data for the same period in 2019 were used for comparative analysis.
Statistical analysis
A Spearman correlation test (Hauke and Kossowski 2011) between the air pollutant mass concentration and meteorological elements and principal component analysis (PCA) (Abdi and Williams 2010) of the air pollutant mass concentration during the observation period were carried out using SPSS 19.0 software.
Lagrangian particle dispersion modeling
The backward Lagrangian particle dispersion model (LPDM) based on HYSPLIT (Stein et al. 2015) was adopted to analyze the transport and dispersion processes of tracer gases. Ten thousand particles were released at a selected location of 100 m and traced backward each hour for 72 h during the study period. After the particles were released from the receptor point, their positions were calculated by considering the mean wind field and turbulent transport in the planetary boundary layer (Ding et al. 2013). The contribution from potential source regions is explained by the footprint retro-plume which expresses the residence time of particles below the 100 m level. (Wang et al. 2020c).
Results and discussion
Meteorological data
Meteorological elements of 2019 and 2020
Figs. S1 and S2 show the time series of meteorological elements in 2019 and 2020, respectively. The temperature suddenly decreased during the Spring Festival in 2019, while there was more rainfall and greater relative humidity in the 2 days before and after the 2020 Spring Festival. Atmospheric pressures were lower during both P2 periods of 2019 and 2020. We compare the meteorological data over different periods in 2019 and 2020. The results are depicted in Table 1.
Table 1.
Statistical analysis of temperature (T), relative humidity (RH), wind speed (WS), atmospheric pressure (AP), and rainfall (RF) over different periods in 2019 and 2020
| 2019 | 2020 | |||||
|---|---|---|---|---|---|---|
| P1 | P2 | P3 | P1 | P2 | P3 | |
| T/(°C) | 6.4 ± 3.3 | 5.3 ± 3.6 | 4.6 ± 1.4 | 6.3 ± 2.1 | 6.2 ± 2.0 | 7.7 ± 2.6 |
| RH/(%) | 72.7 ± 11.6 | 77.4 ± 10.8 | 82.8 ± 12.3 | 78.9 ± 14.2 | 76.1 ± 19.9 | 78.1 ± 14.9 |
| AP/(hPa) | 1024.1 ± 5.5 | 1024.9 ± 6.0 | 1024.3 ± 3.5 | 1025.5 ± 2.3 | 1024.7 ± 3.2 | 1027.5 ± 4.2 |
| WS/(m/s) | 3.8 ± 2.0 | 3.7 ± 1.7 | 3.6 ± 1.5 | 3.3 ± 1.5 | 4.3 ± 2.1 | 3 ± 1.4 |
| RF/(mm) | 6.7 | 27.7 | 35.6 | 65.7 | 27.1 | 25.4 |
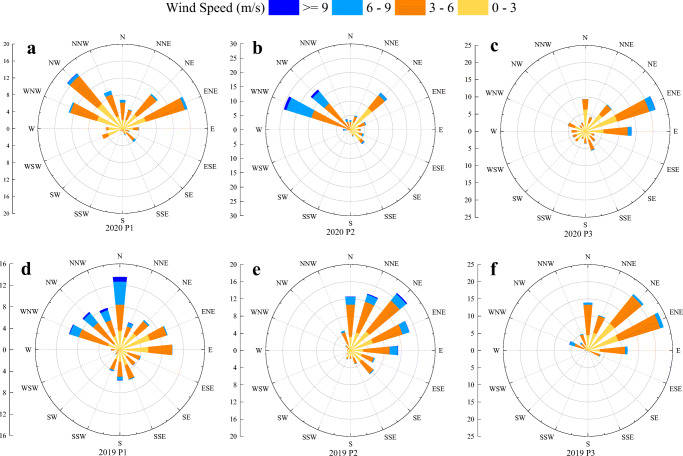
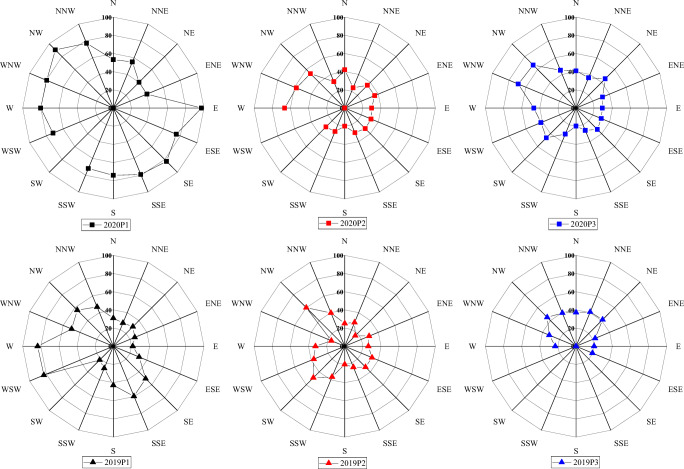
Figure 5 shows wind rose plots for three periods in 2019 and 2020 in Shanghai. In 2019, during P1 (Fig. 5d), north and west-northwest were the predominant wind directions with average wind speeds of 5 m s−1 and 4.3 m s−1. During P2 (Fig. 5e) and P3 (Fig. 5f) of 2019, the wind pattern was similar. Predominant wind directions were northeast and north-northeast during P2 and P3, and the average wind speeds were 4.1 m s−1, 3.7 m s−1 and 3.0 m s−1, 3.4 m s−1, respectively. However, in 2020, during P1 (Fig. 5a), the predominant wind directions were northwest and east-northeast, and the average wind speeds were 3.3 m s−1 and 3.6 m s−1, respectively. During P2 (Fig. 5b), the predominant wind directions were northwest and west-northwest, and the average wind speeds were 5.8 m s−1 and 5.5 m s−1, respectively. During P3 (Fig. 5c), the predominant wind directions were east-northeast and east, and the average wind speeds were 3.4 m s−1 and 3.6 m s−1, respectively.
Fig. 5.
Rose chart of wind speed and direction at different periods of 2019 and 2020
Air-pollutant mass concentration data
Comparative analysis of 2019 and 2020
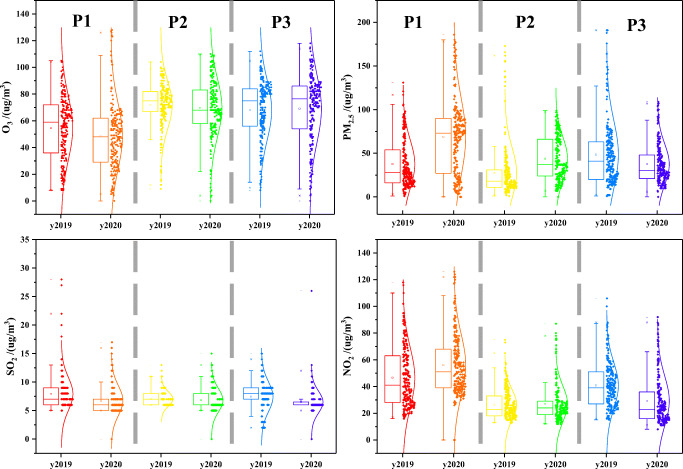
Hourly average mass concentrations of O3, PM2.5, SO2, and NO2 during P1, P2, and P3 of 2019 and 2020 are plotted in Fig. 6. The boxplots show the distance between the first and third quartiles. The whiskers are set as the extreme data points (lower and upper) not exceeding 1.5 times the quartile range from the median. Different colored curves represent the normal distributions of the data. The average mass concentrations of criteria pollutants and the variations during P1, P2, and P3 of 2019 and 2020 are shown in Table 2. In most cases, the Chinese Spring Festival holiday results in a brief reduction in energy consumption (Ghosh 2020). During the Spring Festival holiday (P2), the mass concentrations of PM2.5, CO, SO2, and NO2 in 2019 decreased by 26.40%, 4.23%, 11.09%, and 43.41%, while O3 increased by 31.39%. The mass concentrations of PM2.5, CO, and NO2 in 2020 decreased by 36.5%, 8.6%, and 51.9%, while those of O3 and SO2 increased by 43.8% and 0.9%.
Fig. 6.
Hourly average concentration of O3, PM2.5, SO2, and NO2 during P1, P2, and P3 periods of 2019 and 2020
Table 2.
Average concentrations of air pollutants during different periods in 2019 and 2020 μg/m3 (except for CO:mg/m3)
| PM2.5 | O3 | CO | SO2 | NO2 | ||
|---|---|---|---|---|---|---|
| 2019 | P1 | 37.56 | 54.63 | 1.09 | 7.92 | 46.61 |
| P2 | 27.65 | 71.77 | 1.04 | 7.05 | 26.38 | |
| P3 | 48.22 | 68.06 | 1.03 | 7.44 | 40.43 | |
| P2-variation/% | − 26.40 | 31.39 | − 4.23 | − 11.09 | − 43.41 | |
| P3-variation/% | 28.37 | 24.59 | − 5.00 | − 6.18 | − 13.25 | |
| 2020 | P1 | 68.8 | 48.4 | 1.1 | 6.7 | 56.1 |
| P2 | 43.7 | 69.6 | 1.0 | 6.8 | 27.0 | |
| P3 | 37.3 | 69.3 | 1.0 | 6.5 | 29.1 | |
| P2-variation/% | − 36.5 | 43.8 | − 8.6 | 0.9 | − 51.9 | |
| P3-variation/% | − 45.8 | 43.1 | − 9.0 | − 3.7 | − 48.1 |
Energy consumption will rise again with the resumption of production after the holiday, and the air quality improvement discussed above will not continue (Wang and Su 2020). After the Spring Festival holiday (P3) of 2019, the mass concentrations of PM2.5, SO2, and NO2 in 2019 increased by 74.41%, 5.52%, and 53.28%, respectively, while those of O3 and CO decreased by 5.18% and 0.80%, respectively. This seems to be an exception because of the large-scale outbreak of COVID-19 in 2020. The Chinese government adopted strict restrictions and extended the Spring Festival holiday, leading to a suspension of some production and human activities. As shown in Fig. 3, Shanghai’s GDP fell by 5.44% year-on-year in the first quarter.
As can be seen from Figure S3, during P3 of 2020, the mass concentrations of PM2.5, O3, CO, and SO2 in 2020 continued to decrease by 14.74%, 0.50%, 0.41%, and 4.61%, respectively, while that of NO2 increased by 7.82%. NO2 mass concentration suddenly increased on February 8 (the penultimate day of the Spring Festival holiday), which is related to combustion of oil, coal, natural gas, and other fuels and exhausts of urban vehicles (Wang and Su 2020).
PM2.5 mass concentration during different winds during three periods in 2019 and 2020 are compared in Fig. 7. During most periods, the PM2.5 mass concentration was higher during west and northwest winds and lower during east winds. Combined with the conclusions obtained in Fig. 5, during P1, P2 of 2019 and P3 in 2020, the PM2.5 mass concentration during the dominant wind was higher than those during other winds. During P3 of 2019 and P2 and P3 in 2020, the PM2.5 mass concentration during the dominant wind was lower than those during other winds.
Fig. 7.
Distribution map of PM2.5 mass concentration under different wind directions in different periods of 2019 and 2020
Lagrangian particle dispersion model
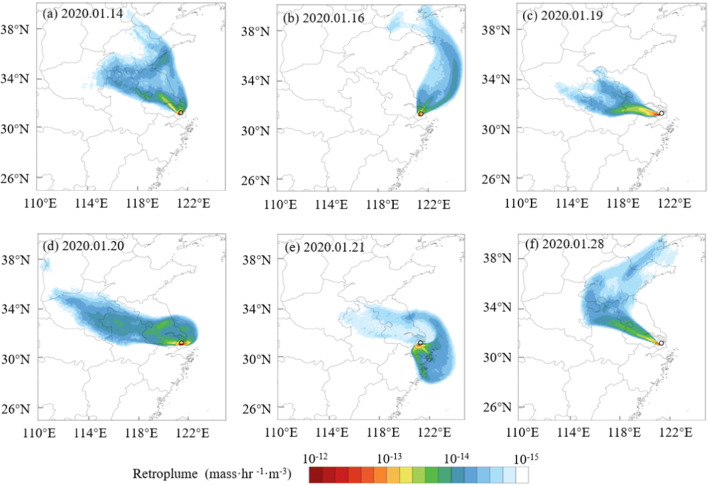
With reduced activities, hazy weather still occurred in Shanghai, becoming a public issue. The LPDM model was carried out to determine the source of pollutant particles and investigate their transport routes. During the observation period, we calculated the retro-plumes based on 3-day (72 h) backward Lagrangian particle dispersion modeling of every hour, and then took the daily average of the trajectory obtained during the 24 h.
According to Chinese ambient air quality standards (GB 3095-2012), the 24-h average secondary concentration limit for PM2.5 is 75 μg/m3, beyond which it is considered excessive. Therefore, the simulation results of 5 days exceeding 75 μg/m3 were selected in Fig. 8, and the day with the lowest PM2.5 mass concentration (8.0 g/m3) was also selected as the representative of the clean day as the reference. During the observation periods, the pollution air masses reaching Shanghai mainly came from the urban agglomeration around Shanghai, in which the Yangtze River Delta region made a significant contribution. Air pollutants from Shandong, Henan, and other regions over a long-range transport and secondary pollutants produced by further oxidation during transmission will also be transported to Shanghai. Figure 8a suggests that the air masses arriving at Shanghai were mainly from central and northern Jiangsu Province and were short-term air masses, reflecting that the source emission and accumulation of local pollutants contributed to the mass concentration of particles in Shanghai. On January 20 (Fig. 8d), the daily average mass particle concentration in Shanghai reached the highest peak value over all the observation periods, the PM2.5 mass concentration being 132.7 μg/m3. During this time, the particles in the surface layer of the cities around the Yangtze River Delta were transported to Shanghai and accumulated over the Shanghai area. On January 16 (Fig. 8b), PM2.5 mass concentration was the lowest, being mainly affected by the dilution of clean air masses from the ocean. Cloud maps of PM2.5 monitoring data across the country (taking January 20 and 28 as examples) also confirm the Lagrangian simulation results.
Fig. 8.
Results of Lagrangian particle dispersion model
Correlation analysis of air pollutants mass concentration in 2020
Table 3 presents the Spearman correlation coefficients between air pollutants mass concentration and meteorological elements. Air pollutants mass concentration show significant correlations with each other, meteorological elements show a negative correlation with PM2.5 except for air pressure, and all of them show correlation with O3, while they show no correlation with CO, and relative humidity shows a negative correlation with SO2 and wind speed shows negative correlation with NO2.
Table 3.
Spearman correlation coefficients between air pollutants and meteorological elements of 2020
| PM2.5 | O3 | CO | SO2 | NO2 | RH | T | WS | AP | |
|---|---|---|---|---|---|---|---|---|---|
| PM2.5 | 1 | ||||||||
| O3 | − 0.254** | 1 | |||||||
| CO | 0.412** | − 0.110** | 1 | ||||||
| SO2 | 0.458** | 0.168** | 0.260** | 1 | |||||
| NO2 | 0.441** | − 0.708** | 0.258** | 0.115** | 1 | ||||
| RH | − 0.276** | − 0.215** | − 0.055 | − 0.684** | − 0.028 | 1 | |||
| T | − 0.164** | 0.357** | 0.070 | 0.061 | − 0.024 | 0.143** | 1 | ||
| WS | − 0.129** | 0.349** | − 0.057 | − 0.058 | − 0.475** | 0.01 | − 0.197** | 1 | |
| AP | − 0.039 | 0.120** | − 0.057 | 0.049 | − 0.071 | − 0.184** | − 0.199** | − 0.243** | 1 |
**Signifies shows significance at 1%
Table S1 presents the Spearman correlation coefficients between mass concentrations during P1 of 2020. PM2.5 shows a strong positive correlation with SO2 and NO2: 0.661 and 0.666, respectively. This indicates that on the one hand, SO2, NO2, and PM2.5 have certain homology; on the other hand, SO2 and NO2 can generate secondary particles after complex chemical reactions occur in the atmosphere. SO2 in the atmosphere mainly results from combustion of fossil fuels contaminated with sulfur compounds. Industry, power, and transportation emissions are the main sources of NOx. Therefore, during P1, it is mainly related to energy consumption. At the same time, O3 and NO2 are significantly negatively correlated, with a value of − 0.616. Tables S2-3 show that PM2.5 shows weak positive correlation with CO, SO2, and NO2, because the Spring Festival holiday and lockdown resulted in short-term reduction in energy consumption. O3 and NO2 showed negative correlation during these periods.
Principal component analysis of air pollutant mass concentration
Tables 4, 5, and 6 show the main results of the PCA application for air pollutants concentration during P1, P2, and P3 of 2020, respectively. For each period, two PCs were selected, which explained 81.26%, 61.62%, and 69.43% of the original data variance, respectively. The rotated factor loadings represent the impact of each variable on the PCs (Pires et al. 2009). According to the absolute load value > 0.75, 0.75–0.5, and 0.5–0.3, Liu et al. (2003) divided the influence of the original variable on each PC into three grades: strong, medium, and weak. During P1, the first PC (PC1) described in Table 4 made important contributions to PM2.5, NO2, SO2, and CO. PC2 was heavily loaded by the contributions of O3. It indicates that the pollution in the P1 period mainly comes from vehicle emissions and industrial emissions. Table 5 shows the main results for P2 of 2020. PC1 made important contributions to O3 and NO2; PC2 was loaded by the contributions of PM2.5 and CO, which indicate that the industrial emissions are no longer the main source of air pollutants due to controls. Table 6 shows that, during P3 of 2020, PC1 made important contributions to O3 and NO2 while PC2 was heavily loaded by the contributions of CO and SO2. This is because Shanghai gradually started resumption of work and production of its enterprises after the Spring Festival.
Table 4.
Pollutants rotation component matrix (2020P1)
| PC1 | PC2 | |
|---|---|---|
| PM2.5 | 0.931 | 0.095 |
| CO | 0.770 | 0.175 |
| NO2 | 0.734 | − 0.559 |
| SO2 | 0.718 | 0.546 |
| O3 | − 0.223 | 0.922 |
| Eigenvalue | 2.403 | 1.660 |
| The proportion of variance explained/% | 48.06 | 33.20 |
Table 5.
Pollutants rotation component matrix (2020P2)
| PC1 | PC2 | |
|---|---|---|
| O3 | 0.913 | − 0.051 |
| NO2 | − 0.851 | 0.017 |
| PM2.5 | 0.001 | 0.785 |
| CO | − 0.138 | 0.685 |
| SO2 | 0.402 | 0.505 |
| Eigenvalue | 1.739 | 1.343 |
| The proportion of variance explained/% | 34.77 | 26.85 |
Table 6.
Pollutants rotation component matrix (2020P3)
| PC1 | PC2 | |
|---|---|---|
| O3 | − 0.950 | 0.103 |
| NO2 | 0.912 | 0.200 |
| CO | 0.117 | 0.769 |
| SO2 | − 0.230 | 0.735 |
| PM2.5 | 0.359 | 0.599 |
| Eigenvalue | 1.931 | 1.540 |
| The proportion of variance explained/% | 38.62 | 30.81 |
Tables S4-S6 show the main results of the analysis of the principal components of air pollution during P1, P2, and P3 in 2019 respectively. The principal components during P1 in 2019 were O3 and NO2, and during P3 were PM2.5 and CO. The temperature was relatively high and more conducive to the formation of secondary pollutants in photochemical reactions during P1. Thus, the primary pollutant was Ozone. After the Spring Festival, the temperature drops and industrial emissions increase in P3.
Conclusions
This study investigated the air pollutant concentration changes during the Spring Festival and COVID-19 lockdown in Shanghai using both air-pollutant concentration, meteorological monitoring data statistical analysis, and Lagrangian particle diffusion model simulation. We found that P2 (during the Spring Festival) showed a similar trend of atmospheric pollutant concentration in 2019 and 2020 compared with P1 (before the Spring Festival): decrease in PM2.5 and NO2 mass concentrations, but an increase in O3 mass concentration. However, compared with P3 (after the Spring Festival) and P2, the variation trend of atmospheric pollutant mass concentrations in 2 years are different: the mass concentrations of PM2.5, SO2, and NO2 increased in 2019 while PM2.5, O3, CO, and SO2 in 2020 continued to decrease. The difference is mainly due to lockdown measures in 2020. We also found that the haze weather in Shanghai during the whole observation period was mainly due to the influence of external transmission, especially the northern areas. The results of correlation and principal component analysis show the changes of atmospheric pollutant concentration characteristics before and after the Spring Festival and epidemic prevention and control. As a conclusion, we think in spite of the dual influence of the Spring Festival and lockdown of COVID-19, the haze also appeared, PM2.5 decreases but O3 rises, posing a challenge to the prevention and control of air pollution in the future: the adjustment of energy structure, the coordinated reduction of air pollutants, and the joint prevention and control among regions.
Electronic supplementary material
(DOCX 2287 kb)
Acknowledgments
We also sincerely appreciate the help of the staff of the Shanghai Environmental Monitoring Center and the target dormitory building.
Funding
We sincerely appreciated the financial support of the National Natural Science Foundation of China (51508395).
Footnotes
Publisher’s note
Springer Nature remains neutral with regard to jurisdictional claims in published maps and institutional affiliations.
References
- Abdi H, Williams LJ. Principal component analysis. Wiley Interdiscip Rev Comput Stat. 2010;2(4):433–459. doi: 10.1002/wics.101. [DOI] [Google Scholar]
- Bashir MF, Ma BJ, Bilal KB, Bashir AB, Tan DJ, Bashir M. Correlation between climate indicators and COVID-19 pandemic in New York, USA. Sci Total Environ. 2020;728:138835. doi: 10.1016/j.scitotenv.2020.138835. [DOI] [PMC free article] [PubMed] [Google Scholar]
- Chauhan A, Singh RP. Decline in PM2.5 concentrations over major cities around the world associated with COVID-19. Environ Res. 2020;187:109634. doi: 10.1016/j.envres.2020.109634. [DOI] [PMC free article] [PubMed] [Google Scholar]
- Collivignarelli MC, Abbà A, Bertanza G, Pedrazzani R, Ricciardi P, Carnevale Miino M. Lockdown for CoViD-2019 in Milan: what are the effects on air quality? Sci Total Environ. 2020;732:139280. doi: 10.1016/j.scitotenv.2020.139280. [DOI] [PMC free article] [PubMed] [Google Scholar]
- Ding AJ, Fu CB, Yang XQ, Sun JN, Zheng LF, Xie YN, Herrmann E, Petäjä T, Kerminen VM, Kulmala M. Ozone and fine particle in the western Yangtze River Delta: an overview of 1-yr data at the SORPES station. Atmos Chem Phys Discuss. 2013;13(1):2835–2876. [Google Scholar]
- European Space Agency (2020) COVID-19: nitrogen dioxide over China. https://www.esa.int/Applications/Observing_the_Earth/Copernicus/Sentinel-5P/COVID-19_nitrogen_dioxide_over_China
- Fuwape A, Okpalaonwuka CT, Ogunjo ST (2020) Impact of COVID -19 pandemic lockdown on distribution of inorganic pollutants in selected cities of Nigeria. Air Qual Atmos Health. 10.1007/s11869-020-00921-8 [DOI] [PMC free article] [PubMed]
- Ghosh I (2020) These satellite photos show how COVID-19 lockdowns have impacted global emissions. https://www.weforum.org/agenda/2020/03/emissions-impact-coronavirus-lockdowns-satellites/
- Hauke J, Kossowski T. Comparison of values of Pearson’s and Spearman’s correlation coefficients on the same sets of data. Quaestiones Geographicae. 2011;30:87–93. doi: 10.2478/v10117-011-0021-1. [DOI] [Google Scholar]
- Huang YM, Wei HP, Duan YS, et al. Ambient air quality status and reason analysis of Shanghai World Expo. Environ Monit China. 2013;29(5):58–63. [Google Scholar]
- Huang K, Zhang X, Lin Y. The “APEC Blue” phenomenon: regional emission control effects observed from space. Atmos Res. 2015;164-165:65–75. doi: 10.1016/j.atmosres.2015.04.018. [DOI] [Google Scholar]
- Isaifan RJ. The dramatic impact of coronavirus outbreak on air quality: has it saved as much as it has killed so far? Glob J Environ Sci Manag. 2020;6(3):275–288. [Google Scholar]
- Kerimray A, Baimatova N, Ibragimova OP, Bukenov B, Kenessov B, Plotitsyn P, Karaca F. Assessing air quality changes in large cities during COVID-19 lockdowns: the impacts of traffic-free urban conditions in Almaty, Kazakhstan. Sci Total Environ. 2020;730:139179. doi: 10.1016/j.scitotenv.2020.139179. [DOI] [PMC free article] [PubMed] [Google Scholar]
- Kraemer MUG, Yang CH, Gutierrez B, Wu CH, Scarpino SV. The effect of human mobility and control measures on the COVID-19 epidemic in China. Science. 2020;368:493–497. doi: 10.1126/science.abb4218. [DOI] [PMC free article] [PubMed] [Google Scholar]
- Li L, Li Q, Huang L, Wang Q, Zhu A, Xu J, Liu Z, Li H, Shi L, Li R, Azari M, Wang Y, Zhang X, Liu Z, Zhu Y, Zhang K, Xue S, Ooi MCG, Zhang D, Chan A. Air quality changes during the COVID-19 lockdown over the Yangtze River Delta Region: an insight into the impact of human activity pattern changes on air pollution variation. Sci Total Environ. 2020;732:139282. doi: 10.1016/j.scitotenv.2020.139282. [DOI] [PMC free article] [PubMed] [Google Scholar]
- Liu CW, Lin KH, Kuo YM. Application of factor analysis in the assessment of groundwater quality in a blackfoot disease area in Taiwan. Sci Total Environ. 2003;313(1–3):77–89. doi: 10.1016/S0048-9697(02)00683-6. [DOI] [PubMed] [Google Scholar]
- Ma N, Liu M, Liang WN. Impact of Beijing 2008 Olympic Games on its air quality. Cap J Public Health. 2010;4(3):103–110. [Google Scholar]
- Nakada LYK, Urban RC. COVID-19 pandemic: impacts on the air quality during the partial lockdown in São Paulo state, Brazil. Sci Total Environ. 2020;730:139087. doi: 10.1016/j.scitotenv.2020.139087. [DOI] [PMC free article] [PubMed] [Google Scholar]
- NASA (2020) Airborne nitrogen dioxide plummets over China. https://earthobservatory.nasa.gov/images/146362/airborne-nitrogen-dioxideplummets-over-china
- Otmani A, Benchrif A, Tahri M, Bounakhla M, Chakir EM, El Bouch M, Krombi M. Impact of Covid-19 lockdown on PM10, SO2 and NO2 concentrations in Sale City (Morocco) Sci Total Environ. 2020;735:139541. doi: 10.1016/j.scitotenv.2020.139541. [DOI] [PMC free article] [PubMed] [Google Scholar]
- Pires JCM, Pereira MC, Alvim-Ferraz MCM, Martins FG. Identification of redundant air quality measurements through the use of principal component analysis. Atmos Environ. 2009;43:3837–3842. doi: 10.1016/j.atmosenv.2009.05.013. [DOI] [Google Scholar]
- Shakoor A, Chen XY, Farooq TH, Shahzad U, Ashraf F, Rehman A, Sahar NE, Yan WD (2020) Fluctuations in environmental pollutants and air quality during the lockdown in the USA and China: two sides of COVID-19 pandemic. Air Qual Atmos Health. 10.1007/s11869-020-00888-6 [DOI] [PMC free article] [PubMed]
- Stein AF, Draxler RR, Rolph GD, Stunder BJ, Cohen MD, Ngan F. NOAA’s HYSPLIT atmospheric transport and dispersion modeling system. Bull Am Meteorol Soc. 2015;96(12):2059–2077. doi: 10.1175/BAMS-D-14-00110.1. [DOI] [Google Scholar]
- Tian H, Liu Y, Li Y, Wu CH, Chen B, Kraemer MUG, Li B, Cai J, Xu B, Yang Q, Wang B, Yang P, Cui Y, Song Y, Zheng P, Wang Q, Bjornstad ON, Yang R, Grenfell BT, Pybus OG, Dye C. An investigation of transmission control measures during the first 50 days of the COVID-19 epidemic in China. Science. 2020;368(6491):638–642. doi: 10.1126/science.abb6105. [DOI] [PMC free article] [PubMed] [Google Scholar]
- Tobías A, Carnerero C, Reche C, Massagué J, Via M, Minguillón MC, Alastuey A, Querol X. Changes in air quality during the lockdown in Barcelona (Spain) one month into the SARS-CoV-2 epidemic. Sci Total Environ. 2020;726:138540. doi: 10.1016/j.scitotenv.2020.138540. [DOI] [PMC free article] [PubMed] [Google Scholar]
- Wang Q, Su M (2020) A preliminary assessment of the impact of COVID-19 on environment – A case study of China. Sci Total Environ 728:138915 [DOI] [PMC free article] [PubMed]
- Wang C, Horby PW, Hayden FG, Gao GF. A novel coronavirus outbreak of global health concern. Lancet. 2020;395:470–473. doi: 10.1016/S0140-6736(20)30185-9. [DOI] [PMC free article] [PubMed] [Google Scholar]
- Wang P, Chen K, Zhu S, Wang P, Zhang H. Severe air pollution events not avoided by reduced anthropogenic activities during COVID-19 outbreak. Resour Conserv Recycl. 2020;158:104814. doi: 10.1016/j.resconrec.2020.104814. [DOI] [PMC free article] [PubMed] [Google Scholar]
- Wang T, Huang X, Wang Z, Liu Y, Zhou D, Ding K, Wang H, Qi X, Ding A. Secondary aerosol formation and its linkage with synoptic conditions during winter haze pollution over eastern China. Sci Total Environ. 2020;730:138888. doi: 10.1016/j.scitotenv.2020.138888. [DOI] [PubMed] [Google Scholar]
Associated Data
This section collects any data citations, data availability statements, or supplementary materials included in this article.
Supplementary Materials
(DOCX 2287 kb)


