Abstract
The world is going through an unprecedented crisis due to COVID-19 breakout, and people all over the world are forced to stay indoors for safety. In such a situation, the rise and fall of the number of affected cases or deaths has turned into a constant headline in most news channels. Consequently, there is a lack of positivity in the world-wide news published in different forms of media. Texts based on news articles, movie reviews, tweets, etc. are often analyzed by researchers, and mined for determining opinion or sentiment, using supervised and unsupervised methods. The proposed work takes up the challenge of mining a comprehensive set of online news texts, for determining the prevailing sentiment in the context of the ongoing pandemic, along with a statistical analysis of the relation between actual effect of COVID-19 and online news sentiment. The amount and observed delay of impact of the ground truth situation on online news is determined on a global scale, as well as at country level. The authors conclude that at a global level, the news sentiment has a good amount of dependence on the number of new cases or deaths, while the effect varies for different countries, and is also dependent on regional socio-political factors.
Keywords: COVID-19, News sentiment analysis, Unsupervised opinion mining, News negativity, Correlation, News agenda
Introduction
We are in the midst of a global crisis, owing to the outbreak and spread of the COVID-19 virus, and the substantially damaging influence of this viral infection has forced the World Health Organization (WHO) to declare the ongoing situation as a pandemic. As per the official statement of WHO, “COVID-19 is the infectious disease caused by the most recently discovered coronavirus. This new virus and disease were unknown before the outbreak began in Wuhan, China, in December 2019. COVID-19 is now a pandemic affecting many countries globally” [1]. As a precautionary or preventive response to this declared pandemic, countries all over the world have introduced restrictions on mobility and transportation, referred to as lockdowns. Consequently, citizens are being asked to stay indoors as a measure of safety from the infection. In this age of a multitude of news channels and popular virtual social frameworks aimed at better connectivity, a massive share of the time spent indoors is undoubtedly invested in engaging with such media. This is corroborated by the recent study [2] which has revealed that there has been about 57% increase in news consumption by watching television or on smartphones, due to constant indoor presence.
A primary obsession of people during this pandemic is about the changing statistics of affected or deceased people world-wide, and needless to say, such articles form the crux of news that the different media channels publish. This virus outbreak has also raised a plethora of other controversial issues, leading to continuing debates and discussions with consequences at both local and global levels. As a whole, it is apparent that there is only a limited number of news delivered with a positive note. The impact of negativity in the news is a long-standing concern, and has been addressed from time to time [3, 4], but the prevailing situation is predicted to leave a long-lasting and damaging impact on mental health and human psychology as a whole [5]. Meanwhile, the day-to-day statistics of deaths or count of affected patients due to the pandemic is expected to influence the news sentiment too. The authors have taken up this challenge of determining the news sentiment during a fixed period of study, as well as analyzing the influence of world-wide and country-wide statistics on the news sentiment during the selected duration.
The organization of the paper is as follows: "Literature review" section gives a brief description of the studied related works and motivations drawn for the current work; the details of each data corpus used in the work are provided in "Data description" section; "Data processing" section lists the techniques used for processing the comprehensive data corpora; the experiments and observations are discussed in "Experiment 1: sentiment analysis" section, "Experiment 2: statistical analysis" section, "Experiment 3: n-gram analysis" section, "Experiment 4: case studies" section; finally, the concluding remarks are offered in "Conclusion" section.
Literature review
The challenge of opinion mining as an application field of data mining is well addressed, and there have been multiple works in this domain with a variety of solutions based on the increasing availability of growing datasets. A vast majority of these works are dedicated to the challenge of sentiment analysis in text collections of different types. Similar to challenges in other domains, the task of sentiment analysis can also be approached as either as a supervised classification problem, or an unsupervised approach for sentiment identification [6].
The number of works that have addressed the problem of sentiment analysis with a supervised approach is more than the ones that have used unsupervised, exploratory techniques. For a supervised sentiment classification problem, the primary requirement is that the text corpus needs to be labeled, i.e., each text string in the whole data set needs to be annotated as belonging to a particular class—positive, negative, or neutral in this case. A study of the state-of-the-art works reveals that for previously annotated texts mostly based on twitter data, blog posts, web logs, movie reviews etc., the researchers have used some common machine learning techniques, namely Support Vector Machine, Naive Bayes [6–11], or even Deep Convolutional Neural Networks [12, 13], etc. It is a general observation that such techniques are more efficient in sentiment analysis tasks than the other unsupervised approaches. Also, the overall performance of supervised algorithms in challenges of opinion mining is generally lower than that in other domains [10].
On the other hand, the task of analyzing sentiments is more challenging with the use of unsupervised learning techniques. Also, such techniques are often more suited for mining the sentiment from bulky sources of data. Identification of semantic orientation [14], comparative study and low performance of the SentiWordNet lexicon in sentiment analysis [9], development of novel emoji and linguistic content-based lexicons using unsupervised approach [15, 16], sentiment polarity detection system using unsupervised approach on Turkish movie reviews [17], etc. are all different interesting research works that use unsupervised approach. The application of standard lexicons such as SentiWordNet [18], AFINN [19], etc. in unsupervised sentiment classification is widely studied and evaluated in different works [20–22]. These lexicon based techniques are employed in solving interesting problems, such as analyzing the sentiment of the characters in Shakespeare’s plays [23], opinion mining from clinical discharge summaries [24], development of bias-aware systems [25], etc. Other popular methods for sentiment identification include k-means [11, 26, 27], Latent Dirichlet Allocation (LDA) [28, 29], etc. In all such cases, it is seen that the inherent simplicity, lack of training, and lower computation requirement involved in unsupervised approaches make it easier to use on and learn from data corpus of substantially large size [30].
During a survey of state-of-the-art research using unsupervised lexicon based approach on text data, it is seen that most of these works are based on exploratory sentiment analysis and evaluation of classification techniques, used on different types of data. However, there is a relatively small amount of research that has worked with news data, and almost all such works are based on financial news and stock price prediction [31–35], etc. Similarly, there are only a few works regarding the statistical effect of real-world events on the overall sentiment of global news, mostly related to the financial sector [36–38], etc.
In this technologically developed era, people are engrossed in the news media, and agenda setting [39] has a crucial role to play in times of a crisis. Researchers have often determined the role played by mass media in determining or setting the agenda in response to a particular incident or event, and this is rapidly propagated among the audience [40]. Obviously, it entails a number of problems as well as ludicrous opportunities for the media agencies, as explored in [41]. In a related context, the work by Kirk et al. [42] analyzes the agenda setting and media policies in response to a disaster. While the proposed work does not focus on these issues, the authors wish to highlight the underlying role of media in maintaining global public sentiment and mental health given the ongoing COVID-19-related crisis. The news media need to be responsible as well as alert to ensure the proper propagation of awareness and shaping of public sentiment particularly involving second-level agenda setting [43, 44].
Given these observations and the ongoing pandemic, the authors were motivated to make the following research contributions:
The current work determines the general sentiment of news articles during the ongoing pandemic with unsupervised and transfer learning-based approaches,
This is the only work, as per the authors’ knowledge, that determines the implications of temporal statistics in a pandemic situation, on news sentiment throughout the world during a fixed period of study. The current work statistically determines how and after what amount of delay, the number of affected patients, and number of deaths due to COVID-19, impacts the news sentiment in regional and world-wide news,
The authors also analyze other relevant factors that contribute to rise or fall of global news sentiment related to particular countries.
Data description
The proposed work uses data regarding the daily news articles published online globally, as well as the statistical details of day-to-day cases and deaths due to COVID-19 throughout the world. Accordingly, two comprehensive data sets have been used in this work, as described below:
COVID-19 data: This set consists of daily statistical data about the numbers of confirmed cases and deaths, gathered for all the COVID-19 affected countries in the world, provided in different file formats. Found in the portal Our World In Data [45], each day’s data corpus consists of 25 attributes, such as country_ISO, location, date, total_cases, new_cases, total_deaths, new_deaths, etc.. The repository contains data from the beginning of the year 2020 till date, and is being regularly updated.
News data: This data corpora is provided by The GDELT Project [46], where daily news articles from all over the world are aggregated together in CSV files. The news articles are fetched based on their mention of COVID-19, and are group together based on certain keywords such as masks, tests, cases, panic, quarantine, etc. in separate files every day. Each data file contains the news article text, its URL, page title, and date. This repository contains the news-related data from 26th March, 2020 only.
Thus, the aforementioned data corpora are used to extract data for the duration—26th of March to 31st of May, 2020—i.e., a total of 66 days, spanning more than 2 months. Out of these 66 days, the regular data about number of COVID-19-affected patients and deaths are considered only for the first 60 days, whereas the news sentiment-based experiments have made use of the other days to experiment with sliding window for determining maximum correlation. The effective period of study is thus 60 days.
Data processing
The unlabeled news data described in the previous section have been processed in this part of the work. All of the steps discussed below are performed for each day’s data, to generate usable corpora for the experiments.
Data merging: There are 11 files containing news snippets from each day, and these are initially merged to generate a single data repository per day. Thereafter, some steps are followed for processing, as described below.
Removing numbers: Initially, the news text contained in the merged corpus for each day of the study is processed using regular expression-based operations. The articles contain different statistics or other details expressed as digits which are removed to generate an intermediate form of cleaned text.
Removing special symbols: The news articles consist of different special symbols such as -, ?, &, % etc. which are removed from the output of the previous step, to build the next intermediate form of cleaned news text.
Removing URLs: The hyperlinks or web addresses or URLs are also removed from the intermediate forms of the clean text, as these are not useful in determining the sentiment of a particular piece of text.
Removing stop words: A common approach is followed to remove the words that are not useful in sentiment analysis process, but which make up a significant part of any text. Examples of such words are: and, for, is, the, to, at, in, etc.
Stemming: As a last step of processing the news articles, stemming is applied to derive the root form of the inflected or derived words in each cleaned string. Such derived words are used to propagate different grammatical concepts such as mood, tense, voice, etc. As a simple example, the words working, works, and worked all have the same stemmed form work.
Once all the above steps have been performed, the processed texts for the total duration of the current study in 60 processed files are merged as a single file containing over 6.34 million distinct news articles.
Experiment 1: sentiment analysis
The merged news data corpus consisting of comprehensive, cleaned strings from the previous step is unlabeled in nature, i.e., the news articles are not originally assigned any particular sentiment label. For this purpose, any machine learning and classification-based sentiment analysis are not directly possible on this data set.
Sentiment scoring
For sentiment prediction, the cleaned text articles for each day are now scored using two different approaches, namely the AFINN lexicon [19] in an unsupervised learning approach, and by the Naive Bayes [47]-based transfer learning approach which has been trained on a popular movie reviews dataset [48].
A lexicon is a comprehensive collection of words, and AFINN is one such widely used lexicon consisting of over 3300 words where each word contains a corresponding sentiment score value. This polarity score lies between + 5 to − 5, and every string in our cleaned news text is now analyzed by applying the AFINN lexicon, to generate corresponding sentiment scores. As an example, the string It was a good memory is analyzed and scored word by word using AFINN, where the scores are 0, 0, 0, 3, and 0, respectively, to give a total score of +3. Evidently, the stop words have no role to play in such analysis, and thus, they have been removed during text processing in the previous section. The determined scores (using AFINN lexicon), are now converted to sentiment category. For this purpose, all texts with score less than 0 are labeled negative, those with score equal to 0 are neutral, and all remaining texts are annotated as positive. A notable observation is that such approaches consider only single-word construct or unigrams for sentiment scoring. This is a prime weakness of such approach, as it fails to capture the inherent essence of different multi-word constructs in English, and fails to recognize emotions and complexities of the language.
In contrast, the trained Naive Bayes classifier uses its knowledge about sentiment polarity from the aforementioned movie reviews corpus, and correspondingly applies it to assign a sentiment category to each news article per day. Unlike AFINN, this supervised classification approach considers the complete text at a time and is more sensitive to emotions, inherent figures of speech and multi-word constructs in the language used. Also, this approach gives a different view of the studied corpus of news texts, and returns the sentiment category for each news article.
In this manner, for every piece of cleaned news text, we now have an overall sentiment score (for AFINN) and sentiment category (for Naive Bayes classifier) which is either positive, 0 or negative, for that string.
Sentiment index
The news data corpus for different days do not consist of the same number of text articles, and also each news article has a different sentiment category predicted by AFINN and the trained Naive Bayes classifier. Therefore, there is a need for normalization, before any comparative study of news sentiment on different days is conducted. For this purpose, a negativity index for each day is calculated and is used as an indicator of the overall negative sentiment in news on that day. The index for the ith day is calculated as:
| 1 |
Similarly, indices for positive sentiment and neutral type of news articles are determined using equations:
| 2 |
| 3 |
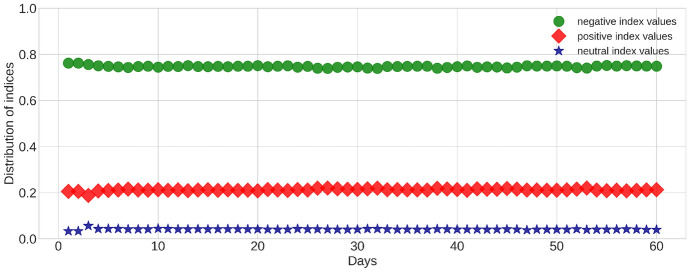
These index values are calculated for the comprehensive data on news articles for the duration of study. The overall spread of these sentiment indices, as determined by the analysis using unigram-based AFINN, are shown in Fig. 1, while Fig. 2 illustrates the same as analyzed by Naive Bayes-based classifier. Notably, with the use of the latter, substantially large negativity (about 75%) and low positivity (about 21%) values are detected, whereas the neutrality decreases by more than 50% and is deemed almost irrelevant to the study at hand. Also, in both cases, it is obvious that any fall in negativity, results in an increase in positive sentiment, and vice versa. Therefore, news of neutral sentiment plays a negligible role. Consequently, a statistical study of the sentiment indices determined in both approaches reveals that negative sentiment has the highest mean, followed by the mean number of positive news articles. Also, these two sentiments show almost similar deviation during the studied duration, using both the scoring techniques. Finally, it is evident from both pairs of Figs. 1, 3 and 2 and 4 that the overall variation in sentiment patterns is more profound in the detection by AFINN lexicon, in spite of its poor sentiment detection performance, and is selected for the experiments in the next section.
Fig. 1.
Illustration of the significance of the three sentiments in global news during the period of study, determined using AFINN lexicon. News with neutral sentiment has minimum presence, and positive news sentiment seems to be slowly catching up with the negativity
Fig. 2.
Illustration of the significance of the three sentiments on global news during the period of study, determined using Naive Bayes. News with neutral sentiment has minimum presence, and there is a substantial gap between the positivity and negativity in news sentiment
Fig. 3.
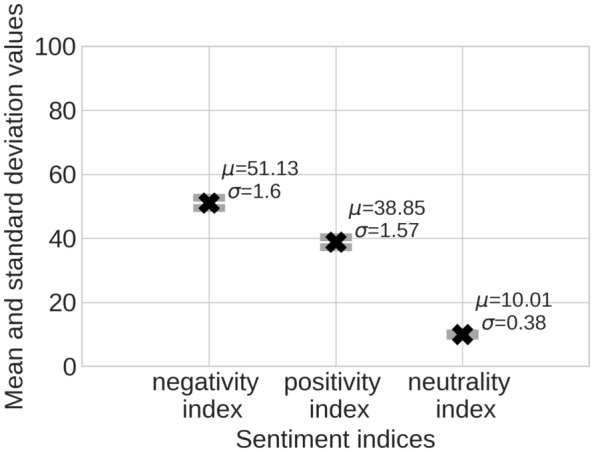
Statistical distribution of three sentiment polarities during the 60 days of study (using AFINN—unsupervised approach)
Fig. 4.

Statistical distribution of three sentiment polarities during the 60 days of study (using Naive Bayes—transfer learning approach)
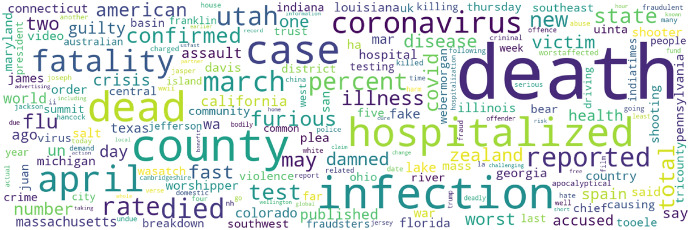
The most commonly occurring words in the news articles with negative sentiment, for the complete duration of study, are illustrated in Fig. 5.
Fig. 5.
This word-cloud highlights the specific words which are present in each day’s most negative news articles. The relatively large size of words, such as death, fatality, case, coronavirus, died, infection, and hospitalized are representative of their frequencies of occurrence during the 60-day period of study
Experiment 2: statistical analysis
This is the next set of experiments where two separate sets of data are utilized, namely:
the world-wide news-based negativity index values from the previous experiment determined using AFINN lexicon based approach, as the variation of sentiment polarity is found to be more in that case, and,
the number of new cases and number of deaths per million of the population,
These corpora are analyzed to determine the underlying relation between the variation of news sentiment and ground reality of cases and deaths due to COVID-19 pandemic.
Distribution of data
To statistically determine the link between the news negativity and number of cases or number of deaths due to the pandemic, it is essential to determine the distribution of each of these variables. Figure 6 shows the respective distributions.
Fig. 6.
Distribution of data in the three variables used for the study. a shows the distribution of data on negative indices in global news, b illustrates the characteristics of data on the number of deaths. and c gives the data distribution for the number of cases during the 60-day period of study. d illustrates a sample normal distribution
From the figures, it is noticed that all the three variables used in this work follow a near-normal or near-Gaussian [49] distribution. Therefore, it is feasible to directly determine the statistical relation between these variables.
Trends of news sentiment vs. number of cases
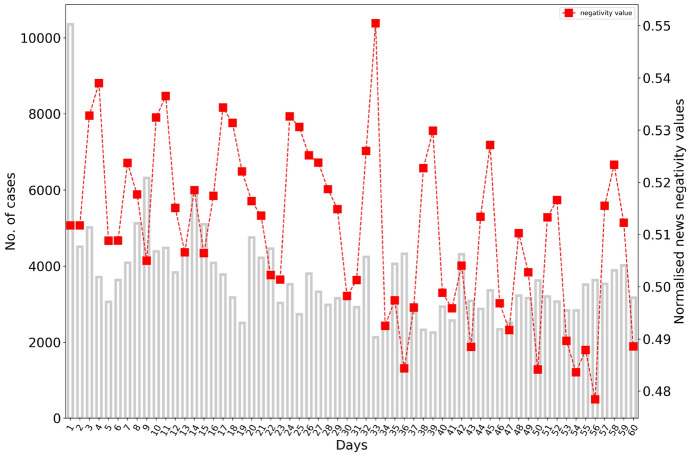
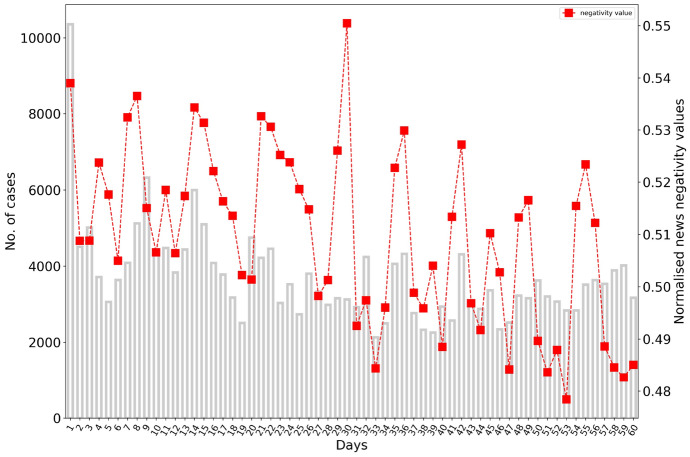
Initially, an attempt has been made to visually determine the relation between distribution of features from two different data corpora. In Fig. 7, the number of confirmed COVID-19 cases during the span of the study has been represented as bar plots. The negativity index values in global news have been plotted for the same duration as a line plot. It is seen that peaks in news negativity are quite often related to the rise in number of cases, as seen in the variations of both variables for different set of days. Also, the decreasing step pattern in number of cases during days 14–19 and 21–26 is distinctively reflected in the news negativity plot too.
Fig. 7.
Illustration of the number of cases vs the characteristics of negative news sentiment for 60 days. Both the variables are kept to scale in the illustration
Trends of news sentiment vs. number of deaths
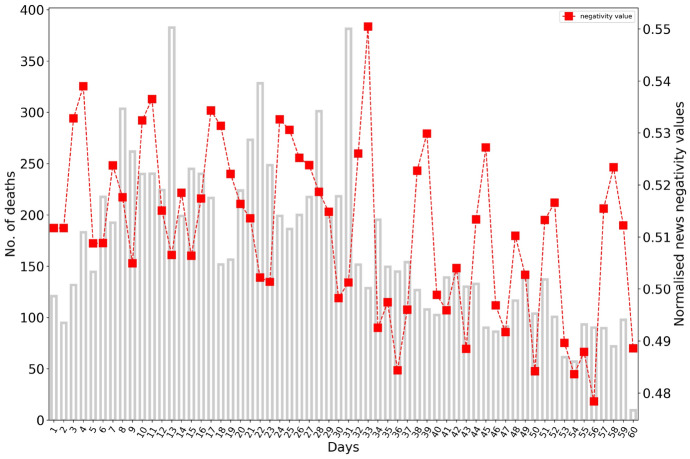
Similar to the previous case, Fig. 8 gives the number of daily deaths in bar stacks, while the line plot is the same as the previous figure. It is seen that there is not much similarity in trends between the two data during the first 20 days. In contrast, some similarity in the data patterns is evident in the duration of days 22–32, after which there is no visible similarity.
Fig. 8.
Illustration of the number of deaths due to COVID-19 vs the characteristics of negative news sentiment for 60 days. Both the variables are kept to scale in the illustration
However, in both the above cases, it is observed that similar patterns in news occur at a delay of a few days. This can be attributed to the fact that day-to-day statistics do not get immediately reported on the same day, and generally takes at least a day or two, to appear and make impact on the global news sentiment. This observation leads to the need for determining the optimal time window, at which the trends in the corpora are most similar.
Determining correlation
From the previous section, it is observed that the trends in news negativity are more or less affected by the variations in the number of cases and the number of deaths. Also, the impact of the trends in number of cases or deaths is visible at a delay of a few days. Therefore, it is necessary to statistically determine the exact delay at which the news sentiment reflects the reality of the situation.
The statistical measure of similarity in data for two variables can be determined by calculating their correlation coefficient. In this part of the experiment, the authors have experimentally determined the correlation coefficient , between the news sentiment and number of cases or number of deaths, using a set of sliding windows on the news sentiment index values, where each such window is shifted n days ahead of the actual duration of the conducted study, for values of n = (0, 1, 2, 3, 4). This means, to re-create the most visibly aligned variations, a statistical study is done using a same set of values for the number of cases or deaths, along with values of news negativity index considered during temporally shifted sets of 60 days each. In all cases, the correlation is calculated using the Pearson correlation coefficient [50] between two variables x and y, given by the formula:
| 4 |
This coefficient value for any two variables remains between − 1 and + 1, where a positive value close to 1 indicates that both variables change simultaneously in same direction, a negative correlation stands for two variables changing in opposite direction, and zero correlation denotes no similarity in the variables. In practice, any correlation value above 0.5 is treated as a moderately strong positive correlation. Using these concepts, along with the previous observations about delay in impact of actual change in parameters on the news sentiments, the optimal maximum positive correlation value is determined to derive the actual delay. A similar use of correlation is seen in the works by Fu et al. and Zhang et al. [36, 38].
From Table 1, it is obvious that in general, there exists more correlation between the daily negative sentiment in news and number of COVID-19-related deaths, considering data world-wide, and that the positive correlation is maximum between these variables when the news negativity indices are considered using a 2-day shifted sliding window, i.e., it takes 2 days for the trends in the number of deaths, to have impact on the global news sentiment. Similarly, this shift is confirmed for the global number of cases at a delay of 3 days. This experiment validates the observation about a delay in the impact of number of confirmed patients and number of deaths, on the news sentiment, and also determines the delay in said impact on a global scale.
Table 1.
Distribution of Pearson correlation coefficient values for global news sentiment polarity and COVID-19-related variables
| Variables | r0 (No shift) 26/03 onwards | r1(1-day shift) 27/03 onwards | r2 (2-day shift) 28/03 onwards | r3 (3-day shift) 29/03 onwards | r4(4-day shift) 30/03 onwards | r5 (5-day shift) 31/03 onwards |
|---|---|---|---|---|---|---|
| Negativity, no. of cases | 0.08 | 0.18 | 0.36 | 0.50 | 0.17 | 0.06 |
| Negativity, no. of deaths | 0.22 | 0.37 | 0.50 | 0.42 | 0.38 | 0.20 |
Maximum values of correlation corresponding to each row is indicated in bold
Aligning the curves
In the final part of this experiment, the correlation values and optimal time-windows determined in the previous section are used for plotting time-shifted news sentiment curves along with the daily number of cases and number of deaths. Accordingly, the news sentiment about daily number of cases is considered at a shift of 3 days, while that concerned with daily death count is plotted at a shift of 2 days to get the ideally aligned plots. These are shown in Figs. 9 and 10, respectively.
Fig. 9.
Illustration of the number of deaths due to COVID-19 vs the characteristics of negative news sentiment values shifted by a window of 3 days. Both the variables are kept to scale in the illustration
Fig. 10.
Illustration of the number of deaths due to COVID-19 vs the characteristics of negative news sentiment values shifted by a window of 2 days. Both the variables are kept to scale in the illustration
It can be seen from Fig. 9 that there are almost perfect matches in pattern in the duration of days 1, 12–19, 20–27, and 31 onwards, though due to differences in scale, the variations are not equally spaced. The visible resemblance in variations is also noted in Fig. 10, especially in days 14–19, 22–26, the abrupt spikes in 30–31, 36–37. However, it is a general observation that the negativity in news prevails even when the global statistics in both cases and deaths are declining which can be attributed to other factors as determined in succeeding experiments. Therefore, it can be said that the negativity index, considering global news, is quite indicative of the changes in the number of new cases and deaths during the ongoing pandemic, while the declining statistics do not seem to have much effect on the overall negativity.
Experiment 3: n-gram analysis
A n-gram can be defined as a continuous sequence of n words from a given sentence or text. In this part of the experiments, the authors have determined the 60 most common tri-grams that occur in the news during the period of study. This analysis highlights the several events, topics, or persons that have been most widely publicized by the online global news in relation with the pandemic scenario. The tri-grams have been listed along with their corresponding weighted frequency (calculated using tri-gram frequency and total occurrence of most common 60 tri-grams), as shown in Table 2.
Table 2.
A set of 60 most common tri-grams
| Tri-gram | Weighted frequency |
|---|---|
| Tested positive COVID | 0.069332 |
| Tested positive coronavirus | 0.045802 |
| President Donald Trump | 0.044983 |
| Personal protective equipment | 0.039804 |
| Confirmed case COVID | 0.03488 |
| New York city | 0.03191 |
| World Health Organization | 0.028425 |
| Center disease control | 0.028324 |
| Social distancing measure | 0.026897 |
| Due coronavirus pandemic | 0.026391 |
| Confirmed COVID case | 0.024802 |
| Coronavirus disease COVID | 0.024442 |
| Disease control prevention | 0.023252 |
| Health care worker | 0.023102 |
| Amid coronavirus pandemic | 0.021448 |
| People tested positive | 0.021336 |
| Due to COVID pandemic | 0.020209 |
| John Hopkins University | 0.019181 |
| Confirmed coronavirus case | 0.019104 |
| Number confirmed case | 0.018606 |
| Number COVID case | 0.01772 |
| Number coronavirus case | 0.017468 |
| Confirmed case coronavirus | 0.017438 |
| Tested positive virus | 0.017265 |
| Social distancing guideline | 0.016958 |
| Intensive-care unit | 0.015946 |
| Spread novel coronavirus | 0.013718 |
| County health department | 0.013658 |
| Practice social distancing | 0.013599 |
| Department public health | 0.012858 |
| Coronavirus task force | 0.0126 |
| Prevent spread COVID | 0.012448 |
| Public health official | 0.011636 |
| Bringing total number | 0.011597 |
| New coronavirus case | 0.011139 |
| Prevent spread coronavirus | 0.010432 |
| Novel coronavirus COVID | 0.010243 |
| Prime Minister Boris | 0.009862 |
| Protective equipment ppe | 0.009651 |
| Slow spread coronavirus | 0.009387 |
| Long-term care facility | 0.008477 |
| Social distancing rule | 0.008442 |
| Minister Boris Johnson | 0.008237 |
| New COVID case | 0.007513 |
| Prime Minister Narendra | 0.007379 |
| Total number case | 0.007077 |
| New case COVID | 0.006727 |
| Chief medical officer | 0.006686 |
| Amid COVID pandemic | 0.004926 |
| Minister Narendra Modi | 0.004636 |
| Slow spread COVID | 0.004222 |
| Due coronavirus outbreak | 0.004134 |
| Wearing face mask | 0.004061 |
| Health human service | 0.00215 |
| Health care system | 0.002131 |
| People stay home | 0.001947 |
| Positive case COVID or Positive COVID case | 0.001921 |
| Novel coronavirus pandemic | 0.001721 |
| Wear face mask | 0.001662 |
It is obvious from the table that most of the tri-grams are regarding the pandemic, with massive usage of phrases such as tested positive coronavirus, tested positive COVID, confirmed case COVID, etc. in the global news. The news agenda during the studied period of time revolves around this central theme, and involves daily COVID-19-related updates and awareness programs being broadcast as deduced from the usage of phrases like personal protective equipment, confirmed case COVID, people tested positive, number COVID case/number coronavirus case, social distancing guideline, practice social distancing, etc. The crucial and commendable role played by World Health Organization, Centers for Disease Control and Prevention (CDC), John Hopkins University, and health care workers all over the globe in shaping the different challenges and aspects of this pandemic is also prominently noted from the table. A remarkable observation is that only three state leaders have made it to this list, namely the President of the United States of America (whose name is incidentally in the third most common tri-gram), and the Prime Ministers of United Kingdom and India, which emphasizes the prominence they enjoy as world leaders in global news, even in these times of distress.
Experiment 4: case studies
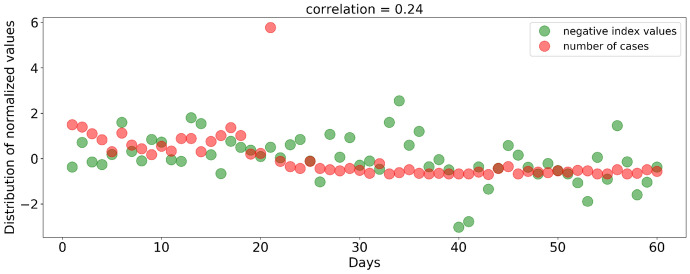
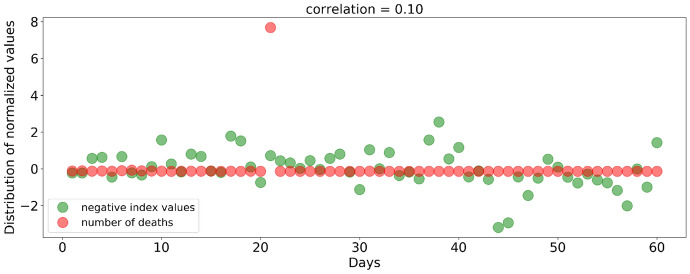
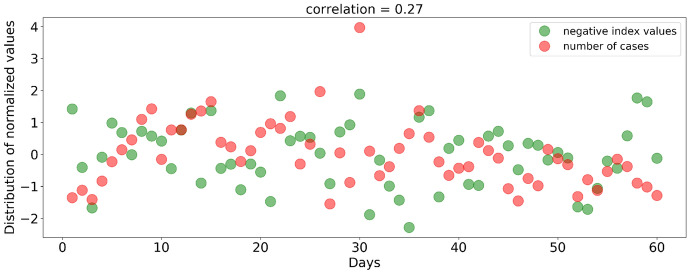
In this last part of the experiments, the observations about the delayed impact of globally changing count of affected patients and deaths on the news sentiment as seen in the previous section have been used to identify similar trends for some specific countries using the respective correlation values. The study is conducted for four countries ordered chronologically, based on when the first virus outbreak occurred in that area, and all articles mentioning country X have been extracted from online global news to perform the corresponding case study on country X. For this purpose, the authors have extracted all news articles corresponding to the countries in question, from the comprehensive global news corpus, for the whole period of the study. Also, in this experiment, z-score [51] technique has been used on both the variables, to normalize the values prior to visualization. The z-score is used to bring values of different variables on the same scale, and is calculated as:
| 5 |
where, denotes the current data element, denotes the mean of the variables, and is standard deviation. Using this method, the data for each variable are converted to have a mean of 0, so in the following graphical representations, all values below the mean will denote a decreasing trend and vice versa.
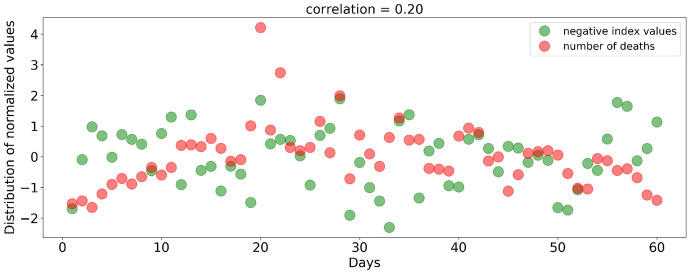
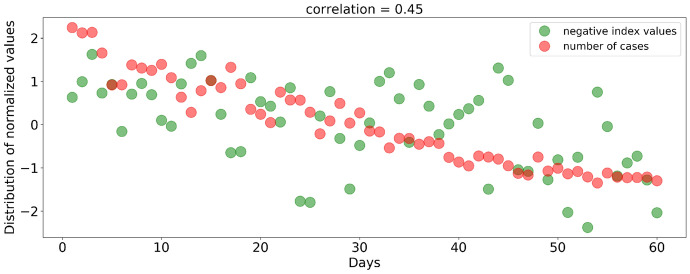
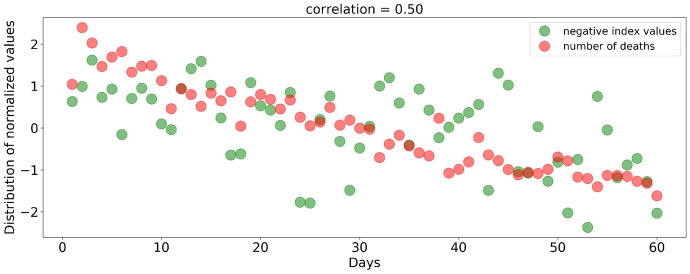
A visual analysis of these images reveals how the observations are generally applicable throughout the data from different countries; that is, whether the global news sentiment about a country is actually affected by the daily trends in number of new cases or deaths. This is determined by the individual correlation of country-wise statistics with appropriately time-shifted global online news about that country.
The scatter plots are generated for the four countries in question. In every set of two plots for each country, perfect or partial overlaps signify only discrete, temporal alignment of the variables, and cannot be treated as a measure of continued similarity in trend, which can be better determined from a set of parallelly distributed data values.
China
The current virus outbreak is believed to have originated in China much early, in the month of December 2019, and so, the current duration of study has witnessed a sharply flattening curve in the number of cases, and complete prevention of deaths successfully. Among the 6.34 million news texts, only those that feature ’China’ have been extracted along with the corresponding sentiment index values per day. The correlation coefficients determined by sliding window approach are quite low and insignificant from a statistical point of view, as calculated and shown in Table 3. However, in the current context, such values are indicative of loosely positive similarity in trends. Remarkably, there seems to be an immediate impact of the number of daily deaths per million in China on the global news, whereas the number of cases per million takes quite some time. Along with this, the highly minimized and flattened death or infection rate is evident from Figs. 11 and 12.
Table 3.
Distribution of Pearson correlation coefficient values for sliding window-based global news sentiment regarding China and COVID-19-related statistics in that country
| Variables | (No shift) 26/03 onwards | (1-day shift) 27/03 onwards | (2-day shift) 28/03 onwards | (3-day shift) 29/03 onwards | (4-day shift) 30/03 onwards | (5-day shift) 31/03 onwards |
|---|---|---|---|---|---|---|
| Negativity, no. of cases | 0.22 | 0.22 | 0.21 | 0.17 | 0.24 | 0.22 |
| Negativity, no. of deaths | 0.10 | 0.06 | 0.05 | 0.01 | 0.07 | 0.01 |
Maximum values of correlation corresponding to each row is indicated in bold
Fig. 11.
Visualization of the distribution of normalized number of cases in China with the normalized global negative news sentiment about China, for the duration of maximum correlation
Fig. 12.
Visualization of the distribution of normalized number of deaths in China with the normalized global negative news sentiment about China, for the duration of maximum correlation
Also, it is seen that in spite of the flattened curves for cases and deaths, the negativity index values are distinctly high, and show a decreasing trend only after the 40th day of our study. The corresponding correlation coefficient values indicate more parallelly aligned set of points as seen in the first figure for the number of cases, while the points are more dispersed around the flattened death curve in the second figure, in spite of multiple overlaps, shown as deep red.
Observations: The observed negativity, though generally aligned, could be due to different other issues as evident from the global news related to China (shown in Table 4). For instance, the rise in negativity during days 14–15 of the study relate with news articles 1 and 3, while articles 3, 7, and 8 attest to the decline in negativity that follows. On a similar note, the high negativity around days 34–35 of the study can be attributed to articles 4 to 6, while the succeeding positivity is enforced by articles like 9–11. Therefore, it is evident that the global news agenda related to China is mostly motivated in driving an overall negative image of the country and its actions during the ongoing pandemic.
Table 4.
A set of online news articles that may have contributed to global news sentiment regarding China during the period of study
| Article # | News text |
|---|---|
| 1 | The World Health Organization is facing a mounting backlash over its handling of China’s cover-up of the novel coronavirus. WHO leaders, including Director-General Tedros Adhanom Ghebreyesus, have run interference for China’s propaganda war meant to absolve the communist nation of responsibility for the global spread of COVID-19. The WHO is now under increasing pressure from experts and Republican senators. “A reevaluation of World Health Organization (WHO) leadership is urgently called for” |
| 2 | “When you have intentional, cold-blooded, premeditated action as you have with China, this would be considered first-degree murder.” Executives at large U.S. companies such as 3M and Honeywell reported to authorities that China was disallowing exports of face masks, shields, and gloves |
| 3 | All-around cooperation between China, Japan, and South Korea is essential in view of a new trend of regionalization and localization of supply chains emerging in the wake of the COVID-19 pandemic. To ensure such cooperation, the three countries should push for new mechanisms of cooperation in the manufacturing sector |
| 4 | President Donald Trump has threatened to put a “very powerful” hold on US funding to the World Health Organization, accusing the UN agency of being “very China centric” and criticising it for having “missed the call” in its response to the coronavirus pandemic. Trump slammed the global health agency for its early guidance aimed at countering the international spread of the coronavirus |
| 5 | Among those who have spoken out against the Chinese government’s role in the spread of the COVID-19 pandemic, are the US secretary of state Mike Pompeo and French Nobel Laureate Luc Montagnier, the co-discoverer of HIV. It came from the scientific labs in Wuhan – that host China’s only and the highest rated Level 4 microbiology lab—and not from the Chinese ’wet’ animal markets, claim those in the know. Given China’s public relations drive, countries that are either financially weak or dependent on Chinese handouts, are not willing to speak up, choosing to play safe |
| 6 | Missouri’s lawsuit was immediately praised by supporters of the president and many Republican congressional counterparts Tuesday: “Huge news. Given the lies and disinformation from China throughout this process a very appropriate move. Therefore, many lives and jobs lost that could have been avoided!” tweeted Donald Trump Jr., praising the legal action Tuesday. Republican lawmakers made Missouri the first state to file a lawsuit against the Chinese government over the country’s handling of the coronavirus pandemic |
| 7 | The Wuhan-originated novel coronavirus that globally killed around 180,000 people so far have mutated into at least 30 different genetic variations, according to a new study in China. The study conducted by professor Li Lanjuan and others from Zhejiang University in Hangzhou was published in a non-peer-reviewed paper released on Sunday |
| 8 | A 103-year-old Chinese grandmother has made a full recovery from COVID-19 after being treated for 6 days in Wuhan, China |
| 9 | While China shut down the last of its several makeshift hospitals in Wuhan following a decline in domestically transmitted COVID-19 cases, its recent attempt to ease lockdown restrictions resulted in thousands of people crowding one of its popular tourist spots in the country, throwing social distancing caution to the winds |
| 10 | In the battle against the novel coronavirus outbreak, many of the country’s top epidemiologists and physicians, who are also members of the Chinese Academy of Engineering, worked in Wuhan, Hubei Province, the city hardest hit by the epidemic in China. On the front line of the battle, along with 40,000 medical workers from all over China, they helped the city gradually return to normal |
| 11 | Cars queued up at expressway toll gates and passengers prepared to board trains and planes to leave Wuhan, Hubei province at midnight. The city, the hardest-hit area by the COVID-19 outbreak on the Chinese mainland, reopened on Wednesday after a 76-day lockdown |
United States of America
The outbreak spread to USA in late January, and a substantial part of the pandemic’s effect on news is observable in this case. Similar to the previous case, the news articles and sentiment index values regarding ’USA’ are extracted and used for the experiment. Table 5 shows that the number of confirmed cases has more impact on negative sentiment in the news based on USA, at a delay of 2 days, and a lower impact of the number of deaths at an overall delay of 4 days. The overall correlation is weakly positive for both the pair of variables.
Table 5.
Distribution of Pearson correlation coefficient values for sliding window-based global news sentiment regarding the United States of America and COVID-19-related statistics in that country
| Variables | (No shift) 26/03 onwards | (1-day shift) 27/03 onwards | (2-day shift) 28/03 onwards | (3-day shift) 29/03 onwards | (4-day shift) 30/03 onwards | (5-day shift) 31/03 onwards |
|---|---|---|---|---|---|---|
| Negativity, no. of cases | − 0.05 | 0.05 | 0.27 | − 0.02 | 0.10 | − 0.16 |
| Negativity, no. of deaths | − 0.24 | − 0.25 | 0.01 | − 0.10 | 0.20 | − 0.02 |
Maximum values of correlation corresponding to each row is indicated in bold
The spread of both the number of cases and deaths, in the case of the USA, resembles bell curve for the current duration of study, with gradually increasing values up to day 30, and an opposite trend thereafter. Figures 13 and 14 show that towards the later half of the studied duration, the overall number of confirmed cases and deaths follows a decreasing trend (more data points below mean), whereas negative sentiment thrives and even increases.
Fig. 13.
Visualization of the distribution of normalized number of cases in USA with the normalized global negative news sentiment about USA, for the duration of maximum correlation
Fig. 14.
Visualization of the distribution of normalized number of deaths in USA with the normalized global negative news sentiment about USA, for the duration of maximum correlation
Observations: Apart from the effect of COVID-19-related statistics, different media reports citing the anti-China sentiment of the President of the country and governmental decisions appear to have influenced the news sentiment, as well. A set of such news articles has been provided in Table 6, while the prominence of the US President in global news is already established in Table 2. The high amount of negativity during the initial 10 days of the study, may be an effect of the articles 1–5, while the decreasing negativity since day 10 may be due to the event that article 6 and 7 correspond to. Similarly, the positive sentiment at about day 50 is aligned with the article 8, whereas the succeeding rapid rise in negativity (in spite of a drop in COVID-19 cases and deaths) could be attributed to events highlighted by articles 8–13. Similar to the observations regarding China, the agenda of global online news is driven more by different socio-political activities concerning the country.
Table 6.
A set of online news articles that may have contributed to global news sentiment regarding USA during the period of study
| Article # | News text |
|---|---|
| 1 | Across America, some leaders are responding swiftly and sagely. New York Gov. Andrew Cuomo and California Gov. Gavin Newsom quickly ramped up state efforts, requiring social distancing and ordering many establishments to close. In Washington, D.C., President Donald Trump refuses to take basic steps using federal power to supply local and state governments with what they need for looming coronavirus demands |
| 2 | “I’m frightened, for my patients, my colleagues, my family and my own health, both mental and physical.” by Dr. Tom Inglesby. “We shouldn’t be considering the relaxing of strong social distancing measures until we have drastically slowed the rate of spread, dealt with our dire shortages of supplies and diagnostic capacity and prepared our health care system to deal with surges in patients.” Dr. Tom Frieden spoke with USA TODAY’s Editorial Board on Tuesday as New York Gov. Andrew Cuomo warned that the new coronavirus is ’spiking’ in his state and President Donald Trump said he wants ’the country opened up and just raring to go by Easter.’ Frieden is a former director of the Centers for Disease Control and Prevention and former New York City health commissioner |
| 3 | More than 1100 people with COVID-19 have now died in the US. However, President Donald Trump still wishes to relax social distancing guidelines for some parts of the states. As the USA overtook China President Trump simply cast doubt on the numbers coming out of Beijing |
| 4 | More than 800,000 physicians across the country signed a letter urging President Donald Trump to keep social distancing practices in place after he said he wants to reopen businesses by Easter. “Significant COVID-19 transmission continues across the United States, and we need your leadership in supporting science-based recommendations on social distancing that can slow the virus,” the letter, released by the Council of Medical Specialty Societies, said. “Our societies have closely adhered to these measures by moving our staff to fulltime telework and canceling in-person meetings (including annual meetings). These actions have helped to keep physicians and other health professionals in health care facilities, including hospitals, and reduce the risk of spreading COVID-19” |
| 5 | Health care workers say that they are being asked to reuse and ration disposable masks and gloves. A shortage of ventilators, crucial for treating serious COVID-19 cases, has also become critical, as has a lack of test kits to comply with the World Health Organization’s exhortations to test as many people as possible. In the United States, a fierce political battle over ventilators has emerged, especially after President Donald Trump told state governors that they should find their own medical equipment if they think they can get it faster than the U.S. government |
| 6 | President Donald Trump signed into law the unprecedented $2 trillion economic stimulus package Friday, capping a week that saw markets yo-yo as recession concerns grew world-wide. Now that the package has been signed into action, attention turns to how quickly the U.S. Treasury and other departments can distribute checks to individual Americans and businesses grappling with the ongoing effects of COVID-19. It could prove to be a Herculean effort to flood the money into the economy quick enough to prevent more job losses and businesses going under |
| 7 | President Donald Trump signed an unprecedented $2.2 trillion economic rescue package into law after swift and near-unanimous action by Congress to support businesses, rush resources to overburdened health care providers, and help struggling families during the deepening coronavirus epidemic. Acting with unity and resolve unseen since the 9/11 attacks, Washington moved urgently to stem an economic free fall caused by widespread restrictions meant to slow the spread of the virus that have shuttered schools, closed businesses and brought American life in many places to a virtual standstill. “This will deliver urgently needed relief,” Trump said as he signed the bill Friday in the Oval Office, flanked only by Republican lawmakers |
| 8 | China and the United States should “unite to fight” the deadly coronavirus pandemic, President Xi Jinping said in a call with Donald Trump on Friday, as he called for the US to improve relations. China’s Xi, speaking with Trump, calls on U.S. to improve relations. Chinese President Xi Jinping told U.S. President Donald Trump during a phone call on Friday that he hopes the United States will take substantive action to improve bilateral ties |
| 9 | Trump was responding to a question on the virtual commencement address by Obama a day earlier. US President Donald Trump on Sunday called his predecessor Barak Obama a ’grossly incompetent president’. The Trump’s reaction came after Obama on Saturday criticised the US authorities’ response to the coronavirus outbreak |
| 10 | US President Donald Trump has said that he does not want to talk to his Chinese counterpart Xi Jinping right now, indicating his displeasure at the Chinese leadership’s handling of the coronavirus outbreak which has now spread across the world, killing over 4.5 million people. “Just don’t want to talk to him right now. We will see what happens over the next little while,” |
| 11 | Advocacy group Public Citizen encouraged the House of Representatives to pass the Heroes Act, a new piece of coronavirus relief legislation that would include $75 billion for expanding testing capacity. Public Citizen and the school health officials called on the Senate and the White House to address the allegedly inadequate testing capacity throughout the country. “Until an enormous national program of testing and contact tracing is fully funded and implemented, the ongoing varying attempts by states to reopen American businesses—even partially—are fatally flawed and pure folly,” said the director of Public Citizen’s Health Research Group Dr. Michael Carome |
| 12 | US President Donald Trump has confirmed that his administration has asked for the withdrawal of billions of dollars in American pension fund investments in China and that other similar actions are under consideration. The US and China relations have deteriorated after the coronavirus outbreak |
| 13 | President Donald Trump attacked the United Nations health body as a Chinese “puppet” on Monday and confirmed he is considering slashing or cancelling US support. “They’re a puppet of China, they’re China-centric to put it nicer,” he said at the White House. Trump said the United States pays around $450 million annually to the World Health Organization, the largest contribution of any country. Plans are being crafted to slash this because “we’re not treated right. They gave us a lot of bad advice,” he said of the WHO |
Italy
Italy is one of the most badly affected countries due to the COVID-19 virus outbreak. During our period of study, both the death count as well as number of confirmed cases are seen to be gradually declining. The global news articles which feature ’Italy’ have been extracted along with the corresponding sentiment category of each article for this experiment. Similar to the previous experiments, for assessing the impact of death or infection-based statistics on news sentiment, a study of correlation has been undertaken. This helps to determine the measure by which the news sentiment reflects the ground reality, by considering days shifted one at a time upto 5 days. The results of the study for Italy, as shown in Table 7.
Table 7.
Distribution of Pearson correlation coefficient values for sliding window-based global news sentiment regarding Italy and COVID-19-related statistics in that country
| Variables | (No shift) 26/03 onwards | (1-day shift) 27/03 onwards | (2-day shift) 28/03 onwards | (3-day shift) 29/03 onwards | (4-day shift) 30/03 onwards | (5-day shift) 31/03 onwards |
|---|---|---|---|---|---|---|
| Negativity, no. of cases | 0.39 | 0.42 | 0.44 | 0.43 | 0.42 | 0.45 |
| Negativity, no. of deaths | 0.38 | 0.40 | 0.40 | 0.41 | 0.48 | 0.50 |
It is seen that there is maximum impact of the COVID-19 situation in Italy, on global news, on the 5th day, though there is a high continuing correlation. Accordingly, the aligned scatter plots are generated using the z-scored, normalized values, as shown in Figs. 15 and 16. Evidently from the table and figures, there exists a higher correlation between the deaths in Italy and negativity index in global news, than that due to number of infected cases, although both these variables show a comparatively strong correlation with the negative news sentiment. This can also be observed by the higher number of complete and partial overlaps, as well as the gradually decreasing dispersion of the negativity proportional to the parametric values of confirmed cases or deaths in 15 and 16.
Fig. 15.
Visualization of the distribution of normalized number of cases in Italy with the normalized global negative news sentiment about Italy, for the duration of maximum correlation
Fig. 16.
Visualization of the distribution of normalized number of deaths in Italy with the normalized global negative news sentiment about Italy, for the duration of maximum correlation
Observations: Due to the determined strong correlation, it can be determined that COVID-19 statistics are most effective on global news sentiment regarding Italy. However, a small set of relevant news articles has been put up in Table 8.
Table 8.
A representative set of online news articles that may have contributed to global news sentiment regarding Italy during the period of study
| Article # | News text |
|---|---|
| 1 | Italy’s death toll continues falling, lockdown to be lifted evenly Italy’s overall fight to contain the spread of the coronavirus continued to show results, with the number of deaths, intensive-care cases, and new infections all trending downward, based on information from the Ministry of Health and the country’s Civil Protection Department on Sunday. Italy’s daily death toll continued to fall as a further 433 people had died of COVID-19 in the past 24 hours, raising the country’s death toll to 23,660, official data showed |
| 2 | President of the Chamber of Deputies of the Parliament of the Italian Republic, Roberto Fico thanked his Greek colleagues for the symbolic gesture of solidarity for Italy who is suffering a major coronavirus emergency. The Italian flag will be illuminated on Greek Parliament until Monday’s sunrise. “Thanks to the Greek friends,” Fico wrote when he retweeted the post by the Italian Embassy in Athens, which read: “From tonight and throughout the weekend the #Parlamento Greco will be illuminated by the #tricolor” |
| 3 | The French lockdown, in place since March 17, has been particularly tough for families jammed together in small apartments in the poorer Paris suburbs. Paris police are facing a modest uptick of unrest in the oft-troubled suburbs of the locked-down French capital, making a small number of arrests after fires were set and fireworks lobbed to shatter the calm imposed by stay-home measures to counter the coronavirus |
India
Though the first confirmed COVID-19 case in India was noted at almost the same time as Italy, the rising effect of outbreak is quite clear in our studied time period. The study reveals interesting results, where both the number of affected cases, and number of deaths, is steadily increasing during the time period considered. The correlation coefficients determined by shifted negativity index windows is shown in Table 9. Surprisingly, the correlations are all negative in nature, indicating that the overall impact of rising deaths and spread of COVID-19 in India has a very weak effect on global news sentiment about India.
Table 9.
Distribution of Pearson correlation coefficient values for sliding window-based global news sentiment regarding India and COVID-19-related statistics in that country
| Variables | (No shift) 26/03 onwards | (1-day shift) 27/03 onwards | (2-day shift) 28/03 onwards | (3-day shift) 29/03 onwards | (4-day shift) 30/03 onwards | (5-day shift) 31/03 onwards |
|---|---|---|---|---|---|---|
| Negativity, no. of cases | − 0.24 | − 0.25 | − 0.19 | − 0.15 | − 0.12 | − 0.12 |
| Negativity, no. of deaths | − 0.19 | − 0.23 | − 0.23 | − 0.14 | − 0.10 | − 0.12 |
Maximum values of correlation corresponding to each row is indicated in bold
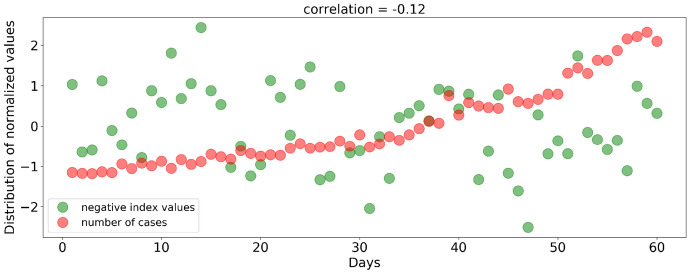
Given that the study intends to determine the similarity in trends of news sentiment and death or infection statistics, the least negative correlation coefficient values are selected for visualizing the trends, which are noted at a delay of 4 days in each case. A notable fact is that, statistically, this minimum negativity indicates almost no correlation. The same is depicted in the scatter plots in Figs. 17 and 18, where the negativity index values are highly dispersed, and even show a decreasing trend in the later half of the study in spite of the steep climb of actual statistics. As noted in "Experiment 1: sentiment analysis" section, the neutral news has minimal role in the global scenario, and that should be significantly minimized at a country-wide level. A possible inference may be that the negative sentiment in global news based on ’India’ is minimized so as to prevent panic among the huge population, or that the global news is not really representative of only the COVID-19 statistics in Indian context.
Fig. 17.
Visualization of the distribution of normalized number of cases in India with the normalized global negative news sentiment about India, for the duration of maximum correlation
Fig. 18.
Visualization of the distribution of normalized number of deaths in India with the normalized global negative news sentiment about India, for the duration of maximum correlation
Observations: The lack of proper correlation suggests that the news agenda is influenced by many factors other that COVID-19, during our period of study. Table 10 highlights some of the problems that were initially a cause of the massive negativity in news sentiment in spite of the minimum rate of COVID-19 affection. This covers several socio-economic aspects of Indian life during this crisis, and the analysis and discussion of such observations in itself, can be articulated as a full-fledged study of the agenda setting policies of online news media.
Table 10.
A representative set of online news articles that may have contributed initially to global news sentiment regarding India
| Article # | News text |
|---|---|
| 1 | Mumbai Police Friday arrested three men for allegedly storing 5000 bottles of hand sanitiser, worth an estimated Rs 2.5 lakh, at a flat in Mahim and illegally selling them above their maximum retail prices. The crime branch raided the flat after it received information that 100 ml bottles of hand sanitiser were being sold for Rs 65, which was Rs 15 more than the MRP |
| 2 | The National Commission of Women NCW has received over 250 complaints, since the country-wide lockdown was imposed to control the spread of coronavirus out of which 69 were cases of domestic violence which it said has been increasing since then. Since the lockdown was imposed, a total of 257 complaints related to various offences against women were received out of which 69 complaints are related to domestic violence the data released by the NCW showed. NCW chairperson Rekha Sharma said the number of cases of domestic violence must be much higher, but the women are scared to complain due to constant presence of their abuser at home |
| 3 | For hours on March 29, family and friends of a 45-year-old man from Ludhiana’s Chakki village refused to touch his body fearing that he had succumbed to the deadly coronavirus. Villagers refused to allow a cremation without a medical test into the reasons behind the cough and fever that took his life. The final rites could only be performed after the state’s Health Department intervened and allayed fears |
| 4 | Kumar said, his union is in touch with nearly 1000 families who need the rations urgently, having lost incomes for over a week now. For lakhs of migrant workers in Maharashtra, lack of clear information has continued to cause anxiety, especially after the Centre and state governments issued instructions Sunday to prevent them from attempting to return to their native places. Their biggest concern being accessible accommodation and food for the remainder of the 21-day lockdown period. “What’s going to happen will be reminiscent of the Bengal famine” |
| 5 | “While no definite conclusion can be drawn, this is probably due to the circumspection on the part of victims in reporting such incidents due to the presence of the perpetrators in the house and the fear of further violence if such attempt to report were made known to the perpetrator”, the commission had said. It had also said that the cases of molestation, sexual assault, rape, kidnapping, and stalking have decreased manifold presumably, since a large number of these incidents take place outside the domestic setting and by third parties. AICHLS in its plea has contended that incidents of domestic violence and child abuse have gripped not only India, but countries such as Australia UK and USA, and the reports suggest that countries are witnessing a horrific surge in domestic violence cases |
| 6 | The video showed around 40 migrant workers sitting on the roadside in full clothes, including women, while water jets were showered on them through fire tenders by men in white protective kit. In the video, one of the officials is heard asking the migrants to keep their eyes shut |
| 7 | After the lockdown announcement, the badli workers in West Bengal’s jute mills are the worst affected out of the lot |
| 8 | “We may survive from corona but not hunger”: Bengal’s daily wage workers struggle for survival. In India, thousands of workers are lining up twice a day for bread and fried vegetables to keep hunger at bay |
| 9 | Job loss pay cuts worry Indians the most during lockdown: Survey. Every 1 in 5 Indians is now worried about losing his or her job as the coronavirus pandemic has shut industries and businesses in India, a new survey warned on Wednesday. According to the survey conducted by YouGov, an Internet-based market research and data analytics firm, some Indians worry about the economic impact of the virus such as losing their jobs (20%), getting a pay cut (16%), or not getting a bonus or increment this year (8%) |
Conclusion
The proposed work addresses the challenge of identifying the general sentiment in globally published news articles as an effect of the ongoing pandemic, in both unsupervised and transfer learning-based approaches, on comprehensive data gathered for a fixed period of time. A statistical study is also undertaken to determine the impact of variations in the number of affected patients and deaths due to the COVID-19 virus, on the news sentiment at a global scale. The same study is also repeated for some countries and the sentiment of global news which pertain to the effect of COVID-19 in those countries, by considering normalized values of all variables. The observations are substantiated by n-gram analysis that highlights the most prominent tri-grams or three-word phrases that have been used in online news globally. The strongest correlation between news sentiment and COVID-19 statistics exists for Italy, which is almost similar to the observation considering news and statistics on a global scale. The authors have also utilized a set of relevant news articles to substantiate the observations during the case studies. The authors have determined that negativity is a pre-dominant sentiment in global news, and that the COVID-19-related real-world statistics, agenda setting by news agencies as well as different social (such as job loss, migrant worker problems) and political factors (such as the continued tussle between the Presidents of the USA and China), drive the negativity in online news quite strongly, which could lead to long-standing effects on mental heath of the news audience. The results lead to relevant questions and consequently a plethora of computational and social study-based research challenges. Such studies will be useful in determining the long-standing, psychological effects of news sentiment on mental health in a pandemic situation, representation of regional challenges in online global news, news media agenda setting, etc. In future, the authors wish to extend this work by utilizing country-specific news data in their respective national official languages, which will aid in further fine-grained analysis.
Compliance with ethical standards
Conflict of interest
On behalf of all authors, the corresponding author states that there is no conflict of interest.
Footnotes
Publisher's Note
Springer Nature remains neutral with regard to jurisdictional claims in published maps and institutional affiliations.
Contributor Information
Amartya Chakraborty, Email: amartya3@gmail.com.
Sunanda Bose, Email: sunanda.bose@msn.com.
References
- 1.WHO (2020). Q and A on coronaviruses (COVID-19). Accessed Sept 2020.
- 2.The Economic Times (2020). Time spent on watching TV, with smartphone rises as people stay indoors: BARC data. Accessed June 2020.
- 3.Graham, C.L. (2020).The psychological effects of TV news. Accessed June 2012.
- 4.Gregoire, C. (2020). What constant exposure to negative news is doing to our mental health. Accessed June 2015.
- 5.O’Hagan, S. (2020). Health experts on the psychological cost of Covid-19. Accessed June 2020.
- 6.Al-Hadhrami, S., Al-Fassam, N., Benhidour, H. (2019). Sentiment analysis of english tweets: A comparative study of supervised and unsupervised approaches. In 2019 2nd International Conference on Computer Applications & Information Security (ICCAIS) (pp. 1–5). IEEE.
- 7.Kathleen, T.D., & Michael, D.S. (2006). Mining sentiment classification from political web logs. In Proceedings of Workshop on Web Mining and Web Usage Analysis of the 12th ACM SIGKDD International Conference on Knowledge Discovery and Data Mining (WebKDD-2006), Philadelphia
- 8.Hackeling G. Mastering Machine Learning with scikit-learn. Birmingham: Packt Publishing Ltd.; 2017. [Google Scholar]
- 9.Singh, VK., Piryani, R., Uddin, A., Waila, P., et al. (2013) Sentiment analysis of textual reviews; evaluating machine learning, unsupervised and sentiwordnet approaches. In 2013 5th International Conference on Knowledge and Smart Technology (KST) (pp. 122–127). IEEE.
- 10.Pang, B., Lee, L., Vaithyanathan, S. (2002). Thumbs up?: sentiment classification using machine learning techniques. In Proceedings of the ACL-02 conference on Empirical methods in natural language processing, vol. 10 (pp. 79–86). Association for Computational Linguistics.
- 11.Yessenov K, Misailovic S. Sentiment analysis of movie review comments. Methodology. 2009;17:1–7. [Google Scholar]
- 12.Jianqiang Z, Xiaolin G, Xuejun Z. Deep convolution neural networks for twitter sentiment analysis. IEEE Access. 2018;6:23253–23260. doi: 10.1109/ACCESS.2017.2776930. [DOI] [Google Scholar]
- 13.Severyn, A., Moschitti, A. (2015). Unitn: Training deep convolutional neural network for twitter sentiment classification. In Proceedings of the 9th international workshop on semantic evaluation (SemEval 2015) (pp. 464–469).
- 14.Turney, P.D., Littman, M.L. (2002). Unsupervised learning of semantic orientation from a hundred-billion-word corpus. arXiv preprint cs/0212012.
- 15.Fernández-Gavilanes M, Álvarez-López T, Juncal-Martínez J, Costa-Montenegro E, González-Castaño FJ. Unsupervised method for sentiment analysis in online texts. Expert Systems with Applications. 2016;58:57–75. doi: 10.1016/j.eswa.2016.03.031. [DOI] [Google Scholar]
- 16.Fernández-Gavilanes M, Juncal-Martínez J, García-Méndez S, Costa-Montenegro E, González-Castaño FJ. Creating emoji lexica from unsupervised sentiment analysis of their descriptions. Expert Systems with Applications. 2018;103:74–91. doi: 10.1016/j.eswa.2018.02.043. [DOI] [Google Scholar]
- 17.Vural, A.G., Cambazoglu, B.B., Senkul, P., Tokgoz, Z.O. (2013). A framework for sentiment analysis in turkish: Application to polarity detection of movie reviews in turkish. In Computer and Information Sciences III (pp. 437–445). Springer.
- 18.Baccianella S, Esuli A, Sebastiani F. Sentiwordnet 3.0: an enhanced lexical resource for sentiment analysis and opinion mining. Lrec. 2010;10:2200–2204. [Google Scholar]
- 19.Nielsen, F.Å. (2011). Afinn. Richard Petersens Plads, Building, 321.
- 20.Paltoglou G, Thelwall M. Twitter, myspace, digg: Unsupervised sentiment analysis in social media. ACM Transactions on Intelligent Systems and Technology (TIST) 2012;3(4):1–19. doi: 10.1145/2337542.2337551. [DOI] [Google Scholar]
- 21.Koto, F., Adriani, M. (2015). A comparative study on twitter sentiment analysis: Which features are good? In International Conference on Applications of Natural Language to Information Systems (pp. 453–457). Springer.
- 22.Farías, H., Irazú, D., Sulis, E., Patti, V., Ruffo, G.F., Bosco, C., et al. (2015). Valento: Sentiment analysis of figurative language tweets with irony and sarcasm. In 9th International Workshop on Semantic Evaluation (SemEval 2015) (pp. 694–698). Association for Computational Linguistics .
- 23.Nalisnick, E.T., Baird, H.S. (2013). Character-to-character sentiment analysis in shakespeare’s plays. In Proceedings of the 51st Annual Meeting of the Association for Computational Linguistics (Volume 2: Short Papers) (pp. 479–483).
- 24.Chen, Q., Sokolova, M. (2018). Word2vec and doc2vec in unsupervised sentiment analysis of clinical discharge summaries. arXiv preprintarXiv:1805.00352.
- 25.Iqbal, M., Karim, A., Kamiran, F. (2015). Bias-aware lexicon-based sentiment analysis. In Proceedings of the 30th Annual ACM Symposium on Applied Computing (pp. 845–850).
- 26.LI N, Wu DD, Nan Li and Desheng Dash Wu Using text mining and sentiment analysis for online forums hotspot detection and forecast. Decision Support Systems. 2010;48(2):354–368. doi: 10.1016/j.dss.2009.09.003. [DOI] [Google Scholar]
- 27.Riaz S, Fatima M, Kamran M, Nisar WM. Opinion mining on large scale data using sentiment analysis and k-means clustering. Cluster Computing. 2019;22(3):7149–7164. doi: 10.1007/s10586-017-1077-z. [DOI] [Google Scholar]
- 28.Li, F., Huang, M., Zhu, X. (2010). Sentiment analysis with global topics and local dependency. In Twenty-Fourth AAAI Conference on Artificial Intelligence.
- 29.Luo L. Network text sentiment analysis method combining lda text representation and gru-cnn. Personal and Ubiquitous Computing. 2019;23(3–4):405–412. doi: 10.1007/s00779-018-1183-9. [DOI] [Google Scholar]
- 30.Khan MT, Durrani M, Ali A, Inayat I, Khalid S, Khan KH. Sentiment analysis and the complex natural language. Complex Adaptive Systems Modeling. 2016;4(1):1–19. doi: 10.1186/s40294-015-0013-4. [DOI] [Google Scholar]
- 31.Mohan, S., Mullapudi, S., Sammeta, S., Vijayvergia, P., Anastasiu, D.C. (2019). Stock price prediction using news sentiment analysis. In 2019 IEEE Fifth International Conference on Big Data Computing Service and Applications (BigDataService) (pp. 205–208). IEEE.
- 32.Rinatovna Eremeeva G, Vladimirovna Martynova E, Aidarovna Khakimova A, Ernstovna Ilikova L. Sentiment analysis on english financial news. Journal of Research in Applied Linguistics. 2019;10:574–582. [Google Scholar]
- 33.Dridi A, Atzeni M, Recupero DR. Finenews fine-grained semantic sentiment analysis on financial microblogs and news. International Journal of Machine Learning and Cybernetics. 2019;10(8):2199–2207. doi: 10.1007/s13042-018-0805-x. [DOI] [Google Scholar]
- 34.Mudinas, A., Zhang, D., Levene, M. (2019). Market trend prediction using sentiment analysis: lessons learned and paths forward. arXiv preprintarXiv:1903.05440.
- 35.Souma W, Vodenska I, Aoyama H. Enhanced news sentiment analysis using deep learning methods. Journal of Computational Social Science. 2019;2(1):33–46. doi: 10.1007/s42001-019-00035-x. [DOI] [Google Scholar]
- 36.Fu, T.-C., Lee, K., Sze, D., Chung, F., Ng, C. (2008). Discovering the correlation between stock time series and financial news. In 2008 IEEE/WIC/ACM International Conference on Web Intelligence and Intelligent Agent Technology, vol. 1 (pp. 880–883). IEEE.
- 37.Seker, S.E., Mert, C., Al-Naami, K., Ozalp, N., Ayan, U. (2014). Time series analysis on stock market for text mining correlation of economy news. arXiv preprintarXiv:1403.2002.
- 38.Zhang, W., Skiena, S. (2010). Trading strategies to exploit blog and news sentiment. In Fourth international aAAI conference on weblogs and social media.
- 39.Dearing, J.W., Rogers, E.M., Rogers, E. (1996). Agenda-setting, vol. 6. Sage.
- 40.McCombs ME, Shaw DL. The agenda-setting function of mass media. Public Opinion Quarterly. 1972;36(2):176–187. doi: 10.1086/267990. [DOI] [Google Scholar]
- 41.Kosicki GM. Problems and opportunities in agenda-setting research. Journal of Communication. 1993;43(2):100–127. doi: 10.1111/j.1460-2466.1993.tb01265.x. [DOI] [Google Scholar]
- 42.Birkland, T.A. (1997) After disaster: Agenda setting, public policy, and focusing events. Georgetown University Press.
- 43.Russell Neuman W, Guggenheim L, Mo Jang S, Bae SY. The dynamics of public attention: Agenda-setting theory meets big data. Journal of Communication. 2014;64(2):193–214. doi: 10.1111/jcom.12088. [DOI] [Google Scholar]
- 44.Carroll CE, McCombs M. Agenda-setting effects of business news on the public’s images and opinions about major corporations. Corporate Reputation Review. 2003;6(1):36–46. doi: 10.1057/palgrave.crr.1540188. [DOI] [Google Scholar]
- 45.Ritchie, H. (2020). Coronavirus Source Data. Accessed June 2020.
- 46.The GDELT Project. (2020). Now Live Updating & Expanded: A New Dataset For Exploring The Coronavirus Narrative In Global Online News. Accessed June 2020.
- 47.Hand DJ, Yu K. Idiot’s bayes—not so stupid after all? International Statistical Review. 2001;69(3):385–398. [Google Scholar]
- 48.Maas, A.L., Daly, R.E., Pham, P.T., Huang, D., Ng, A.Y., Potts, C. (2011). Learning word vectors for sentiment analysis. In Proceedings of the 49th Annual Meeting of the Association for Computational Linguistics: Human Language Technologies. (pp. 142–150). Portland, Oregon, June. Association for Computational Linguistics.
- 49.Zhang, X. (2010). Gaussian Distribution (pp. 425–428). Springer US, Boston.
- 50.Royal Society (Great Britain) (1895). Proceedings of the Royal Society of London. Number v. 58. Taylor & Francis.
- 51.Kreyszig, E. (2009). Advanced Engineering Mathematics, 10th Edn. Wiley.


