

Key Points
SARS-CoV-2–specific Ab-secreting cells expand in acute COVID-19.
SARS-CoV-2–specific Ab levels correlate with neutralizing Ab titers.
Abstract
Coronavirus disease 2019 (COVID-19), caused by severe acute respiratory syndrome coronavirus 2 (SARS-CoV-2), emerged in late 2019 and has since become a global pandemic. Pathogen-specific Abs are typically a major predictor of protective immunity, yet human B cell and Ab responses during COVID-19 are not fully understood. In this study, we analyzed Ab-secreting cell and Ab responses in 20 hospitalized COVID-19 patients. The patients exhibited typical symptoms of COVID-19 and presented with reduced lymphocyte numbers and increased T cell and B cell activation. Importantly, we detected an expansion of SARS-CoV-2 nucleocapsid protein–specific Ab-secreting cells in all 20 COVID-19 patients using a multicolor FluoroSpot Assay. Out of the 20 patients, 16 had developed SARS-CoV-2–neutralizing Abs by the time of inclusion in the study. SARS-CoV-2–specific IgA, IgG, and IgM Ab levels positively correlated with SARS-CoV-2–neutralizing Ab titers, suggesting that SARS-CoV-2–specific Ab levels may reflect the titers of neutralizing Abs in COVID-19 patients during the acute phase of infection. Last, we showed that IL-6 and C-reactive protein serum concentrations were higher in patients who were hospitalized for longer, supporting the recent observations that IL-6 and C-reactive protein could be used as markers for COVID-19 severity. Altogether, this study constitutes a detailed description of clinical and immunological parameters in 20 COVID-19 patients, with a focus on B cell and Ab responses, and describes tools to study immune responses to SARS-CoV-2 infection and vaccination.
Introduction
Coronavirus disease 2019 (COVID-19), caused by severe acute respiratory syndrome coronavirus 2 (SARS-CoV-2), emerged in late 2019 and has since become a global pandemic (1). SARS-CoV-2 primarily affects the respiratory tract and can cause severe respiratory illness, which sometimes requires mechanical ventilation (2). The world is racing to understand the immune responses to SARS-CoV-2 to identify correlates of protection and to aid treatment and vaccine development. In the majority of infections, pathogen-specific Abs are one of the main contributors to protective immunity, yet B cell and Ab responses during COVID-19 are currently not fully understood.
B cells are one of the key players of the adaptive immune system and can provide sterilizing immunity against pathogens through the secretion of pathogen-specific Abs. B cells carry Ig surface receptors with a high range of specificity that can directly recognize different Ags. Early during acute infections upon the encounter with the Ag, B cells differentiate into Ab-secreting cells (ASCs), including plasmablasts and plasma cells, which produce large quantities of pathogen-specific Abs (3).
ASCs can expand to very high levels during some acute human infections (4–7). For example, during human dengue virus infection, ASCs expand to constitute an average of 47% of all circulating B cells (5). Meanwhile, at steady-state conditions in healthy individuals, ASCs comprise only up to around 1% of all circulating B cells (5). The ASC response is typically transient, peaking at around day 7 of the febrile stage of infection (8). However, during acute human respiratory syncytial virus (RSV) infection, ASC response could be detected for as long as 22–45 d after the onset of symptoms, which was found to be associated with prolonged shedding of RSV in the airways (9). Thus, the kinetics of ASC response may be dependent on pathogen persistence.
In humans, ASCs can be identified using flow cytometry as CD19+CD20low/− B cells with high cell surface expression of CD38 and CD27 molecules as well as intracellular expression of proliferation marker Ki-67 (10, 11). Although flow cytometry is a valuable tool to measure the frequencies of total ASCs in peripheral blood, it only allows phenotypic characterization. Functional Ab secretion capacity and Ag specificity of ASCs are typically described using the gold standard ELISPOT assay (12). ELISPOT is a highly sensitive method allowing for detection of ASCs producing different Ab isotypes at single-cell level, including IgA, IgG, and IgM, against different Ags. Flow cytometry and ELISPOT can therefore be used in combination to comprehensively describe the magnitude and specificity of B cell responses to infectious agents.
Ag-specific Abs can contribute to pathogen control either by 1) directly interfering with the entry of a pathogen into the target cells (referred to as neutralization) or by 2) assisting the effector cells in recognizing and eliminating infected target cells (known as Ab-dependent cellular cytotoxicity) (13). Neutralizing Abs are typically considered to be the strongest predictor of protective immunity following natural infection or vaccination. Therefore, it is of great importance to evaluate the neutralizing capacity and persistence of specific Abs in acute viral infections such as SARS-CoV-2.
In this study, we provide a detailed description of early B cell and Ab responses to SARS-CoV-2 infection in a cohort of 20 hospitalized patients with severe COVID-19. We found a substantial level of ASCs expansion in all patients and that not all patients developed detectable levels of SARS-CoV-2–specific and neutralizing Abs at the time of sampling. We also show increased levels of adaptive immune system activation and increased serum concentrations of inflammatory markers IL-6 and C-reactive protein (CRP), the latter two correlating with the duration of hospitalization in the present COVID-19 patient cohort. This study constitutes a detailed description of clinical and immunological B cell–related parameters in COVID-19 patients and describes tools to study immune responses to SARS-CoV-2 infection and vaccination.
Materials and Methods
Ethics statement
The study was approved by the Regional Ethical Review Board in Stockholm, Sweden and by the Swedish Ethical Review Authority. All COVID-19 patients and healthy controls included in this study provided written informed consent.
Study subjects and sampling of peripheral blood
Peripheral blood samples were collected from 20 adult COVID-19 patients hospitalized in April 2020 at the Karolinska University Hospital in Stockholm, Sweden (five females and 15 males; age range between 34 and 67 y; median age, 53 y) (Table I). Patients were diagnosed with COVID-19 by RT-PCR for SARS-CoV-2 in either nasopharyngeal swabs (18/20 patients) or sputum (2/20 patients). Diagnostics were performed at the diagnostic laboratory at the Karolinska University Hospital. Peripheral blood samples from patients were taken at a median of 15 d after self-reported onset of symptoms (range 7–19 d). Peripheral blood samples of seven healthy controls were collected in parallel (two females and five males; age range between 26 and 53 y; median age 31 y).
Table I. Clinical characteristics of 20 hospitalized COVID-19 patients.
| Cohort characteristics | |
| Age, y, median (range) | 53 (34–67) |
| Male | 15 (75) |
| Symptom onset to sampling, d, median (range) | 15 (7–19) |
| Hospitalization to sampling, d, median (range) | 3 (2–10) |
| Symptom onset to discharge, d, median (range) | 19.5 (9–30) |
| Duration of hospitalization, d, median (range) | 7.5 (3–25) |
| ICU treatmenta | 3 (15) |
| Fatal outcome | 1 (5) |
| Comorbidities | |
| BMI >25, n/N (%) | 14/14 (100)b |
| Diabetes mellitus type II | 4 (20) |
| Hypertension | 3 (15) |
| Asthma | 2 (10) |
| Cardiovascular disease | 1 (5) |
| Symptoms | |
| Fever (>38°C) | 20 (100) |
| Cough | 20 (100) |
| Respiratory difficulties (SpO2 ≤93% on room air) | 20 (100) |
| Myalgia | 9 (45) |
| Chest pain | 6 (30) |
| Diarrhea | 4 (20) |
| Treatment | |
| Supplemental oxygenc | 20 (100) |
| High flow nasal oxygen | 4 (20) |
| Inhaled bronchodilators | 2 (10) |
| Low m.w. heparin | 17 (85) |
| Antibiotics | 14 (70) |
| Immunomodulatory drugsd (given before sampling) | 3 (15) |
Data are n (%) unless noted otherwise.
ICU treatment before study sampling (n = 2), ICU treatment after study sampling (n = 1).
n/N (%), where N is the total number of patients with available data.
Oxygen flow rate, minimum 2.5 l/min. One patient on mechanical ventilation.
Chloroquine phosphate (n = 2) or anakinra (n = 1).
BMI, body mass index; SpO2, percutaneous oxygen saturation.
PBMCs were isolated from heparinized anticoagulated blood using density gradient Lymphoprep medium (STEMCELL Technologies) following the manufacturer’s instructions and immediately used for flow cytometry and FluoroSpot Assays. Serum was collected from COVID-19 patients and healthy controls in BD Vacutainer serum tubes with spray-coated silica (BD Biosciences). After coagulation for up to 2 h at room temperature (RT), serum was isolated by centrifugation at 2000 × g for 10 min and immediately stored at −80°C for later analysis.
Absolute counts of lymphocytes in peripheral blood
Absolute numbers of CD45+, CD3+, CD4+, CD8+, and CD19+ cells in peripheral blood were measured using BD Trucount Tubes (BD Biosciences). Fifty microliters of anticoagulated whole blood were added into Trucount Tubes within 3 h after blood extraction and stained with either anti–CD45-PerCP (2D1), anti–CD3-FITC (SK7), anti–CD4-allophycocyanin (SK3), and anti–CD8-PE (SK1) or anti–CD45-PerCP (2D1) and anti–CD19-Alexa Fluor (AF) 488 (HIB19) (all from BioLegend). After 15 min of incubation at RT, stained whole blood was fixed, and RBCs were lysed with 2× BD FACS Lysing Solution (BD Biosciences). Samples were acquired on a BD Accuri C6 Plus Flow Cytometer. Bead number recorded was used to quantify absolute CD45+, CD3+, CD4+, CD8+, and CD19+ cell counts per microliter of blood. ASC numbers per microliter of blood were calculated based on CD19+ B cell numbers measured by absolute cell counting and on frequencies of ASCs within CD19+ cells measured by flow cytometry.
Flow cytometry
Staining with fluorescently labeled Abs was performed on freshly isolated PBMCs. Briefly, cells were incubated with surface staining Abs diluted in PBS for 30 min at 4°C in the dark, followed by three washes with flow cytometry buffer (2% FCS and 2 mM EDTA in PBS). Cells were then fixed and permeabilized using eBioscience Foxp3/Transcription Factor Staining Buffer Set (Thermo Fisher Scientific) and later incubated with Abs diluted in PBS for intracellular staining for 30 min at 4°C in the dark. Finally, samples were incubated in a 2% formaldehyde solution (Polysciences) for 2 h, washed and resuspended in flow cytometry buffer, and data subsequently acquired on a BD LSRFortessa Flow Cytometer equipped with 355, 405, 488, 561, and 639 nm lasers and BD FACSDiva Software (BD Biosciences). For a detailed gating strategy, see Supplemental Fig. 1.
The following mAb conjugates were used for cell surface staining: anti–CD8-Qdot605 (3B5) (Thermo Fisher Scientific), anti–CD19-BUV395 (SJ25C1), anti–CD14-V500 (MφP9), anti–CD4-BUV737 (RPA-T4) (all from BD Biosciences), anti–CD123-Brilliant Violet (BV) 510 (6H6), anti–CD27-BV650 (O323), anti–CD20-FITC (2H7), anti–CD38-BV421 (HB-7), anti–IgD-PE-Cy7 (IA6-2), anti–IgM-BV785 (MHM-88) (all from BioLegend), anti–CD3-PE-Cy5 (UCHT1), anti–CD56-ECD (N901) (all from Beckman Coulter), and anti–IgA-allophycocyanin (REA1014) (Miltenyi Biotec). LIVE/DEAD Fixable Near-IR Dead Cell Stain Kit (Thermo Fisher Scientific) was used as a viability marker. The following mAb conjugates were used for intracellular staining: anti–IgG-PE (HP6017) (BioLegend) and anti–Ki-67-AF700 (B56) (BD Biosciences).
FluoroSpot Assay for ASCs
The number of SARS-CoV-2 nucleocapsid (N) protein–specific IgA, IgG, and IgM ASCs, as well as the total number of IgA–, IgG–, and IgM–ASCs in freshly isolated PBMCs, were measured using a multicolor B cell FluoroSpot kit with modifications (Mabtech). Briefly, ethanol-activated low autofluorescent polyvinylidene difluoride membrane plates were coated overnight with either 1) anti-IgG, anti-IgA, and anti-IgM capture Abs (15 μg/ml of each) for the detection of all ASCs or 2) SARS-CoV-2 N protein (10 μg/ml) for the detection of SARS-CoV-2–specific ASCs. The plates were washed with PBS and blocked with R10 media (RPMI 1640 with 10% FCS, 1% penicillin/streptomycin, and 2 mM l-glutamine [all from Thermo Fisher Scientific]) for 30 min at RT before the addition of freshly isolated PBMCs. Plates were then incubated at 37°C in 5% CO2 for 20 h and then developed with anti-human IgG-550 (yellow fluorescence), anti-human IgA-490 (green fluorescence), and anti-human IgM-640 (red fluorescence) secondary detection Abs (diluted 1:500 each) (all Abs from Mabtech). Fluorescent spots indicating a single ASC were detected with an IRIS FluoroSpot Reader and counted with Apex software (Mabtech).
rSARS-CoV-2 N protein
A full-length N phosphoprotein nucleotide sequence (1293 bp) of the SARS-CoV-2 virus was optimized and synthesized (GenScript). The synthesized sequence was cloned into a PET-30a(+) vector with a C-terminal His tag for detection of protein expression in Escherichia coli. The E. coli strain BL21 Star (DE3) was transformed with the recombinant plasmid, and a single colony was inoculated into Terrific Broth medium containing antibiotic and cultured at 37°C at 200 rpm and then induced with IPTG. Protein purity and m.w. were determined by SDS-PAGE and Western blot, according to standard procedures (GenScript).
SARS-CoV-2 isolation from serum
Fifty microliters of serum were mixed with 150 μl of Eagle’s MEM (Life Technologies) and added to confluent Vero E6 cells seeded in 24-well plates. Cells were incubated with diluted serum for 1 h, and 1 ml of Vero E6 medium was added after the incubation. Cells were subsequently incubated further for 10 d at 37°C and 5% CO2 and monitored for cytopathic effect (CPE) by optical microscopy.
Immunofluorescence assay for IgG against SARS-CoV-2
Vero E6 cells were infected with SARS-CoV-2 (isolate SARS-CoV-2/human/SWE/01/2020, https://www.ncbi.nlm.nih.gov/nuccore/MT093571) for 24 h, trypsinized and mixed with uninfected Vero E6 cells, and then seeded on microscope slides. Twelve hours later, slides were fixed in acetone and stored at −80°C until further use. Serum samples were heat inactivated at 56°C for 30 min prior to analysis. For analysis of total SARS-CoV-2–specific IgG Ab titers, serum samples were serially diluted from 1:20 to 1:5120. Twenty-five microliters of diluted serum was then added to fixed cells and incubated at 37°C for 30 min, after which the slides were washed in NaCl for 30 min. Bound SARS-CoV-2 IgG Abs were then detected by incubating for 30 min at 37°C with a secondary AF488-conjugated AffiniPure Goat Anti-Human IgG Ab (Jackson ImmunoResearch Laboratories), diluted 1:200 in 0.1% Evans Blue. SARS-CoV-2 IgG-positive cells were visualized using a Nikon Eclipse Ni fluorescence microscope (×40 magnification). The titer of IgG in each serum sample was determined by the inverted dilution factor value for the highest dilution with positive staining.
ELISAs
SARS-CoV-2–specific IgG and IgA Abs in serum were detected using anti–SARS-CoV-2 ELISA kits (both from EUROIMMUN), according to the manufacturer’s instructions. SARS-CoV-2–specific IgM Abs were detected using EDI Novel Coronavirus COVID-19 IgM ELISA kit (Epitope Diagnostics), according to the manufacturer’s instructions. Serum samples were heat inactivated at 56°C for 30 min prior to analysis.
IL-6 levels in serum from patients and healthy controls were measured in freshly thawed serum using Human IL-6 ELISA Development Kit (Mabtech), according to the manufacturer’s instructions. Serum samples were diluted 1:2 in ready-to-use ELISA diluent (Mabtech) prior to performing the IL-6 ELISA.
Microneutralization assay
The 2-fold dilution series from 1:10 to 1:10,240 in Eagle’s MEM (Life Technologies) plus 5% FCS (Thermo Fisher Scientific) were performed on the serum samples, which were previously heat inactivated at 56°C for 30 min. Each dilution was subsequently mixed with an equal volume of 4000 50% tissue culture infective dose/ml SARS-CoV-2 (50 μl serum plus 50 μl virus) and incubated for 1 h at 37°C and 5% CO2. Each sample was prepared in duplicates. After incubation, the mixtures were added on confluent Vero E6 cells seeded on 96-well plates and incubated at 37°C 5% CO2. Four days later, the cells were inspected for signs of CPE by optical microscopy. Each well was scored as either neutralizing (if <50% of the cell layer showed signs of CPE) or nonneutralizing (if ≥50% CPE was observed). Results are shown as the arithmetic mean of the reciprocals of the highest neutralizing dilutions from the two duplicates for each sample.
Real-time RT-PCR
RNA was extracted from freshly thawed serum samples using the MagDEA Dx SV reagent kit and the magLEAD instrument (Precision System Science). The assay used to detect SARS-CoV-2 RNA was modified from (14): forward primer 5′-CATGTGTGGCGGTTCACTATATGT-3′, reverse primer 5′-TGTTAAARACACTATTAGCATAWGCAGT-3′, and RdRp_SARSr-P2 probe. The assay was carried out in 25 μl reaction mixtures containing 5 μl RNA template, TaqMan Fast Virus 1-Step Master Mix, 0.6 μM forward primer, 0.8 μM reverse primer, and 0.2 μM probe (Applied Biosystems). Thermal cycling was performed at 50°C for 5 min, 95°C for 20 s, followed by 40 cycles of 95°C for 3 s, and 60°C for 30 s in a StepOne Plus Real-Time PCR (Applied Biosystems).
Statistics and data analysis
Statistical analyses were performed using GraphPad Prism software 7.0 for macOS X (GraphPad Software). Correlation analyses were performed using Spearman correlation. Spearman correlation matrix was generated with R (version 4.0.2) using package corrplot (v0.84). Statistical significance for differences between COVID-19 patients and healthy controls was determined by two-sided Mann–Whitney U test. The p values <0.05 were considered statistically significant. FlowJo software version 10.5.3 (Tree Star) was used to analyze all flow cytometry data. FluoroSpot data were analyzed with Apex software (Mabtech).
Results
Twenty COVID-19 patients were enrolled in this study during hospitalization at Karolinska University Hospital. All 20 patients exhibited typical COVID-19 symptoms of fever, cough, and breathing difficulties, and a few also experienced chest pain, myalgia, and diarrhea (Table I). Some of the patients presented with common comorbidities, such as overweight, hypertension, asthma, cardiovascular disease, and diabetes mellitus type II. According to the guidelines for diagnosis and treatment of COVID-19 (version 7) released by the National Health Commission and State Administration of Traditional Chinese Medicine, 19 out of the 20 patients were classified as severe, and 1 out of the 20 as critically ill (15). Although all patients enrolled in this study were hospitalized at the infectious diseases wards at the time of sampling, two patients were treated at the intensive care unit (ICU) before inclusion in this study, whereas one patient required ICU treatment after the inclusion. Peripheral blood samples from the 20 COVID-19 patients were collected at a median of 15 d after the self-reported onset of symptoms and at a median of 3 d after hospitalization (Fig. 1A, 1B, Table I). In parallel, seven donors without an ongoing respiratory disease or signs of inflammation were included in the study as healthy controls.
FIGURE 1.

Clinical chemistry parameters in peripheral blood of COVID-19 patients. (A) Number of days between COVID-19 symptom debut and peripheral blood sampling. (B) Number of days between hospitalization and peripheral blood sampling. (C) Blood cell counts and clinical chemistry parameters in peripheral blood of COVID-19 patients measured on the day of the inclusion in this study (±24 h). Gray boxes indicate the range for reference values. (D) Absolute numbers of CD45+, CD3+, CD4+, CD8+, CD19+ cells, and CD4:CD8 T cell ratio in peripheral blood of COVID-19 patients (n = 20) and healthy controls (HC) (n = 7) measured by flow cytometry. Graphs display median and IQR. Statistical significance was determined using Mann–Whitney U test (D). *p < 0.05. ALT, alanine transaminase; AST, aspartate transaminase; DL, detection limit; LDH, lactate dehydrogenase; ns, not significant; PCT, procalcitonin.
Clinical chemistry parameters in COVID-19 patients
Blood cell counts and clinical chemistry parameters in peripheral blood of COVID-19 patients were measured at the Diagnostics Laboratory of the Karolinska University Hospital on the same day as the inclusion in this study (±24 h). Clinical chemistry tests showed increased levels of inflammatory markers, including CRP, lactate dehydrogenase, and ferritin (Fig. 1C). Some patients also presented with increased levels of aspartate transaminase, alanine transaminase, and d-dimer, whereas hemoglobin, procalcitonin, and troponin T levels fell within the range of reference values in the majority of patients (Fig. 1C). Numbers of total leukocytes, neutrophils, monocytes, and platelets in peripheral blood were within the normal range in the majority of COVID-19 patients at the time of sampling (Fig. 1C). In contrast, we observed reduced lymphocyte numbers, with the median lymphocyte numbers falling below or within the lower range of reference values (Fig. 1C). Reduced lymphocyte numbers in peripheral blood of COVID-19 patients were confirmed by flow cytometry analysis of absolute cell counts. We found significantly lower CD45+ lymphocyte numbers in the patients compared with healthy controls (Fig. 1D). CD3+ T cell and CD3+CD8+ T cell numbers were also significantly lower in patients compared with the controls, whereas no significant difference in the numbers of CD3+CD4+ T cells and CD19+ B cells was observed between COVID-19 patients and healthy controls (Fig. 1D).
T cells and B cells are activated in COVID-19 patients
We next assessed the overall activation level of the adaptive immune system in COVID-19 patients. T cell and B cell activation levels were measured based on the expression of the activation marker CD38 and the proliferation marker Ki-67 using multicolor flow cytometry on freshly isolated PBMCs (Fig. 2A). We observed significantly higher frequencies of activated CD4+ T cells, CD8+ T cells, and CD19+ B cells in COVID-19 patients compared with healthy controls (Fig. 2B). Additionally, there was a strong positive correlation between the frequencies of activated CD8+ T cells and CD4+ T cells in COVID-19 patients but not between activated CD19+ B cells and CD4+ or CD8+ T cells (Fig. 2C–E).
FIGURE 2.

T cells and B cells are activated in the peripheral blood of COVID-19 patients. (A) Representative flow cytometry plots of CD38 and Ki-67 coexpression in CD4+ and CD8+ T cells as well as CD19+ B cells in one representative COVID-19 patient (16 d after symptom onset) and one healthy control (HC). (B) Frequencies of CD38 and Ki-67 coexpressing CD4+ T cells, CD8+ T cells, and CD19+ B cells in COVID-19 patients (n = 20) and healthy donors (n = 7). (C–E) Spearman correlation between the frequencies of CD38 and Ki-67 coexpressing CD4+ T cells, CD8+ T cells, and CD19+ B cells in COVID-19 patients. Bar graphs display median and IQR. Statistical significance was determined using Mann–Whitney U test. p < 0.05 was considered statistically significant. *p < 0.05, ***p < 0.001.
Significant expansion of ASCs in COVID-19 patients
Flow cytometric analyses revealed increased frequencies of activated CD38+Ki-67+ B cells in the COVID-19 patients (Fig. 2A, 2B). Therefore, we further analyzed if ASC frequencies were also increased in peripheral blood. ASCs were identified as B cells expressing high levels of surface CD38 and CD27 (CD19+CD20low/−IgD−CD38highCD27high) (Fig. 3A). As expected, low frequencies and numbers of ASCs were detected in peripheral blood of healthy controls (Fig. 3B, 3C). However, significantly higher ASC frequencies and numbers were observed in COVID-19 patients compared with healthy controls, constituting up to 31% of all circulating B cells (Fig. 3B, 3C). Noteworthy, a substantial ASC expansion was detected as early as 7 d and as late as 19 d after the onset of symptoms (Fig. 3D).
FIGURE 3.
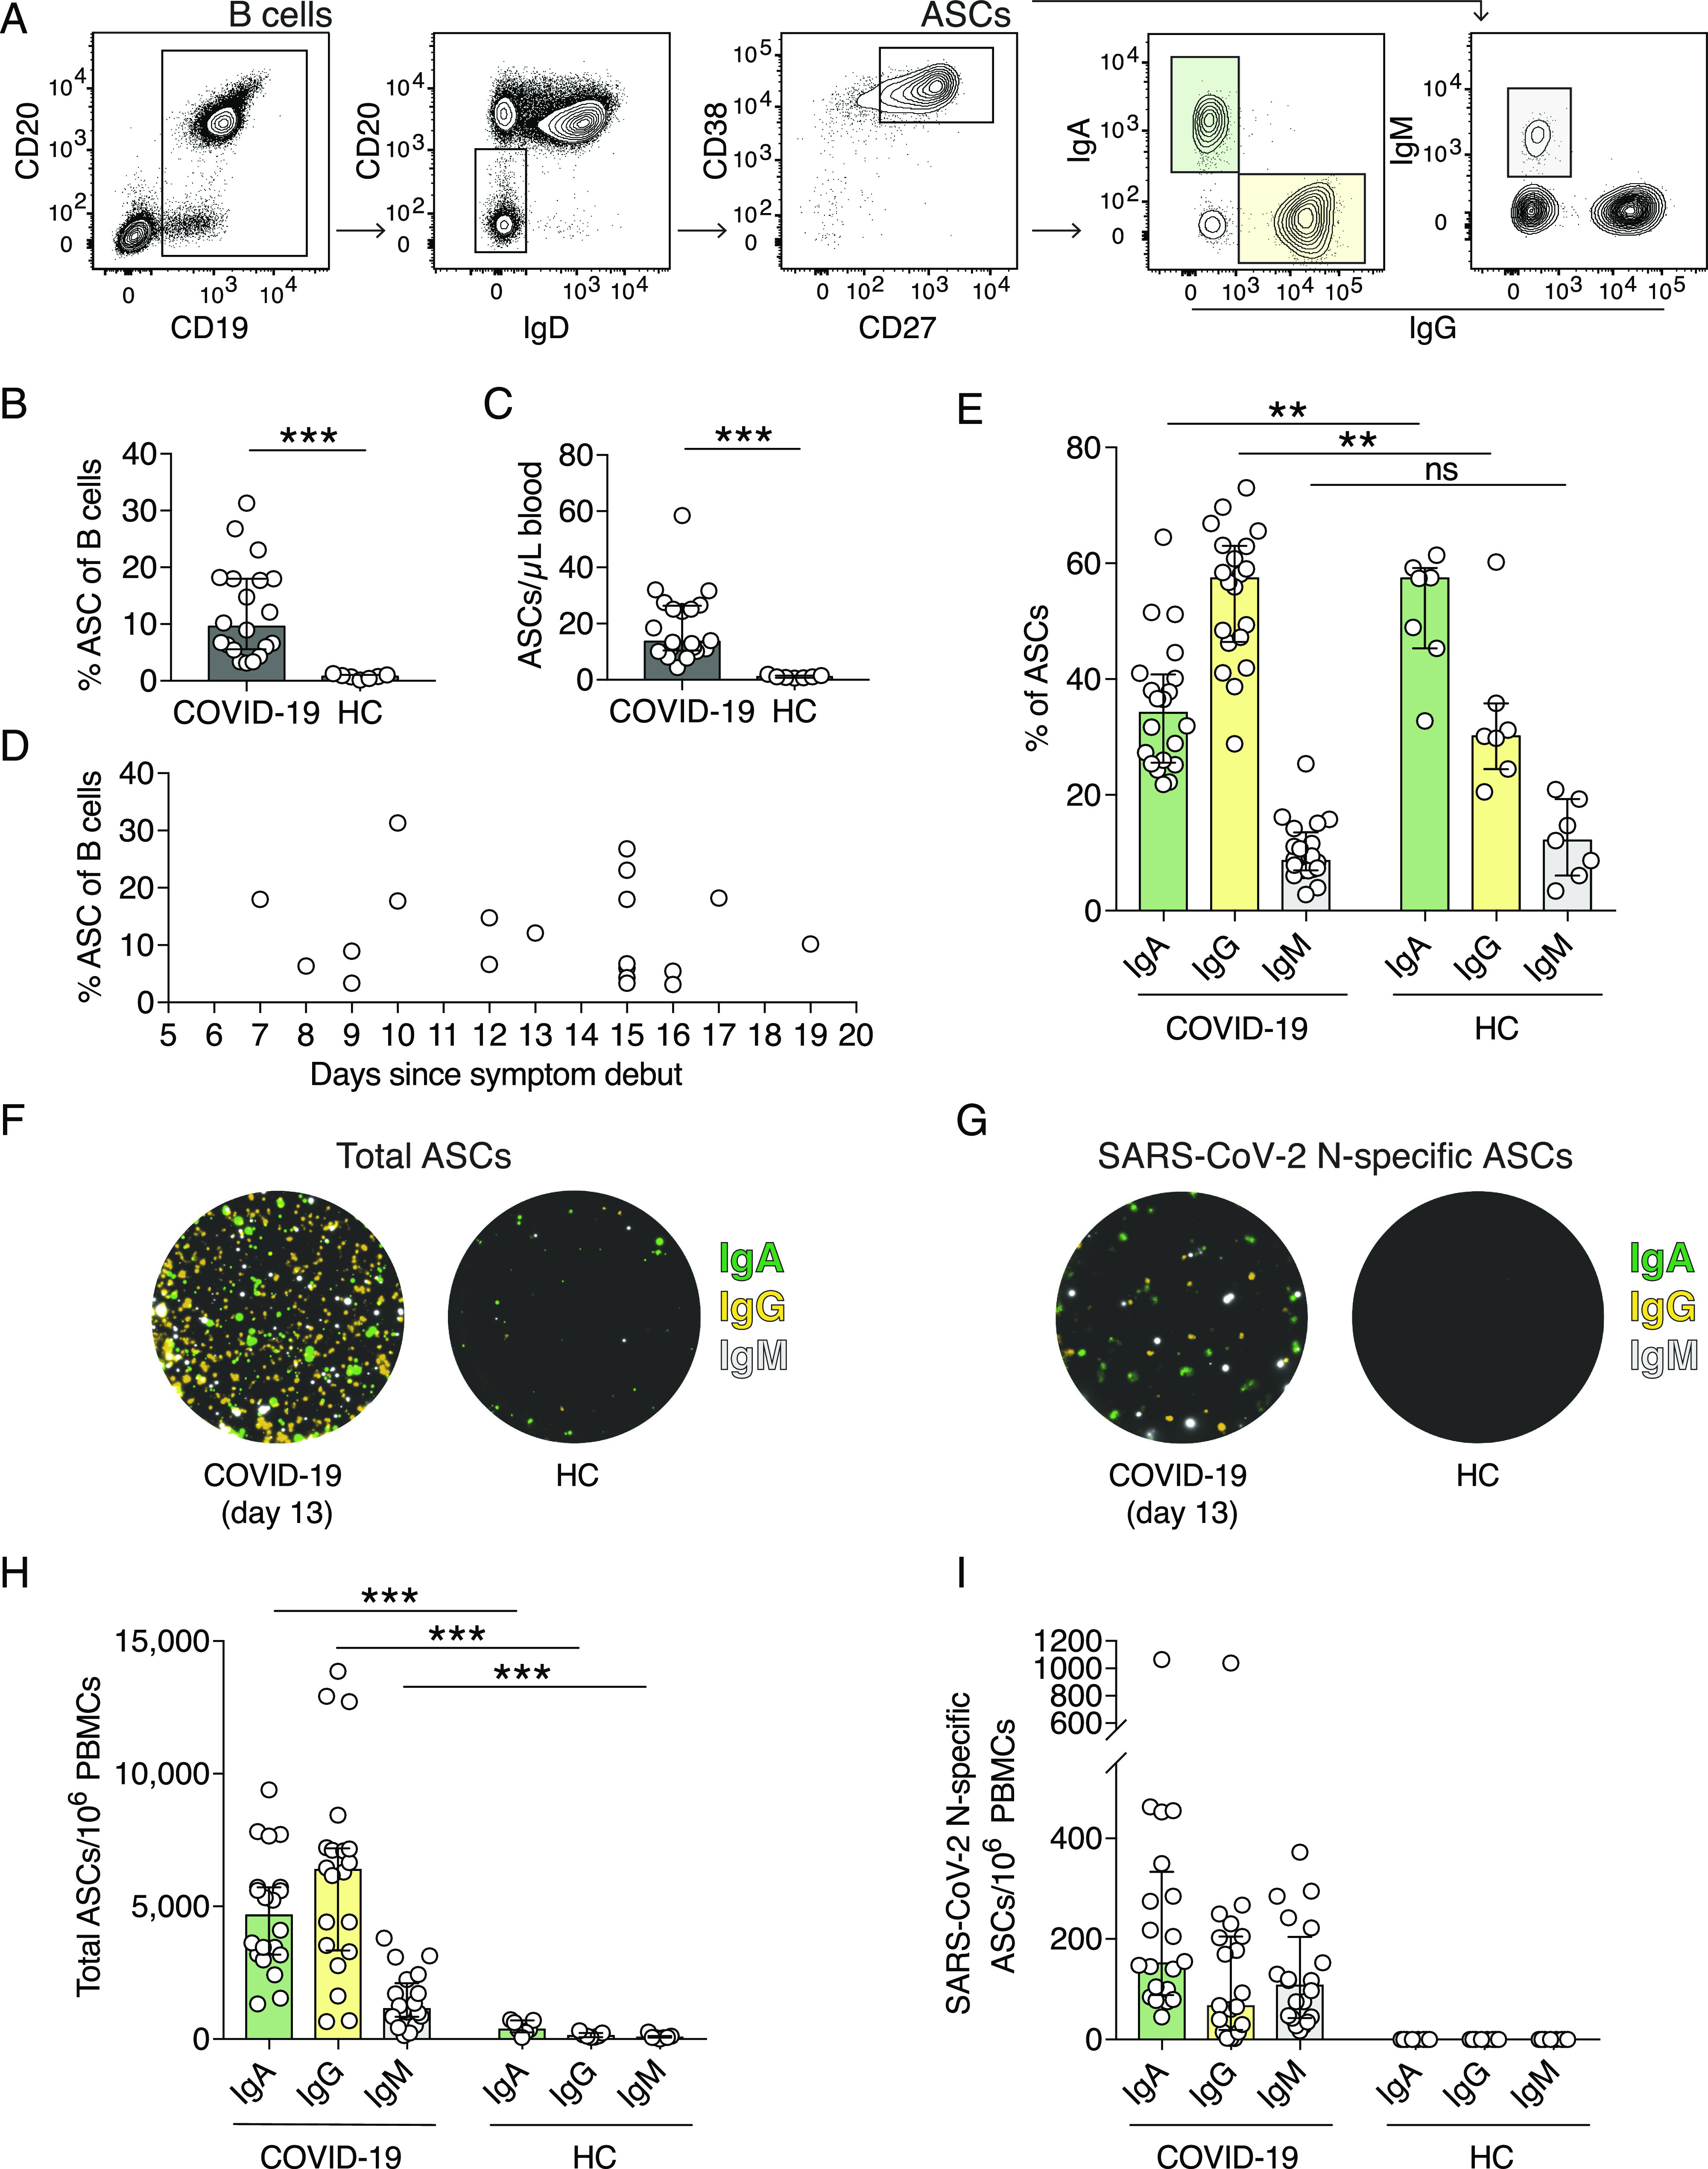
SARS-CoV-2 N protein–specific ASCs expand in COVID-19 patients. (A) Flow cytometry gating strategy used to identify ASCs and the IgA–, IgG–, and IgM–ASC subsets. B cells are gated on live CD14−CD123−CD3−CD4− cells. (B) Frequencies of ASCs within all B cells in COVID-19 patients and in healthy controls (HCs). ASCs were defined as CD19+CD20low/−IgD−CD38highCD27high. (C) Numbers of ASCs per microliter of whole blood calculated using absolute CD19+ B cell numbers and frequencies of ASCs measured by flow cytometry. (D) ASC frequencies within all B cells in regards to the number of days since COVID-19 symptom debut. (E) Frequencies of IgA–, IgG–, and IgM–ASCs within the total ASC population measured by flow cytometry. (F and G) Representative images of wells from a FluoroSpot Assay showing total IgA–, IgG–, and IgM–ASCs (F) and SARS-CoV-2 N protein–specific ASCs (G) from one COVID-19 patient (13 d after symptom onset) and one healthy control. IgM fluorescence is originally red but replaced with white in this figure for visualization purposes. (H) Numbers of total IgA–, IgG–, and IgM–ASCs per million PBMCs as measured by FluoroSpot Assay. (I) Numbers of SARS-CoV-2 N protein–specific IgA–, IgG–, and IgM–ASCs per million PBMCs. Experiments were performed on all COVID-19 patients (n = 20) and healthy controls (n = 7). Bar graphs display median and IQR. Statistical significance was determined using Mann–Whitney U test (B, C, E, and H). **p < 0.01, ***p < 0.001. ns, not significant.
Next, we assessed the expression of Igs by the ASCs in COVID-19 patients and healthy controls (Fig. 3A). IgA has previously been shown to be expressed by 80% of all ASCs at steady state (16). In agreement with this, the largest proportion within the ASC compartment in healthy controls was IgA+ ASCs, whereas the majority of ASCs in COVID-19 patients expressed IgG (Fig. 3E). IgM+ ASCs were present at comparable frequencies in both COVID-19 patients and healthy controls (Fig. 3E).
Detection of SARS-CoV-2–specific ASCs in COVID-19 patients
The expansion of ASCs is usually a result of an ongoing infection and is characterized by high specificity toward the infectious agent (17). To investigate if the ASCs identified by flow cytometry were SARS-CoV-2 specific, we used a FluoroSpot Assay, a fluorescence-based variant of the ELISPOT assay, which allows for detection of total and Ag-specific IgA–, IgG–, and IgM–ASCs. To detect SARS-CoV-2–specific IgA–, IgG–, and IgM–ASCs, we generated rSARS-CoV-2 N protein.
The FluoroSpot assay confirmed the ASC expansion detected by flow cytometry as the total numbers of IgA–, IgG–, and IgM–ASCs in COVID-19 patients were significantly higher than in healthy controls (Fig. 3F, 3H). Moreover, the total ASC frequencies and numbers detected by flow cytometry positively correlated with total numbers of ASCs measured by FluoroSpot (Spearman correlation coefficient [rs] = 0.537, p = 0.01; and rs = 0.636, p = 0.003, respectively). Consistent with flow cytometry data, IgG–ASCs constituted the predominant subset of all ASCs in COVID-19 patients followed by IgA–ASCs (Fig. 3E, 3H).
Importantly, we detected SARS-CoV-2 N protein–specific ASCs in all 20 COVID-19 patients but not in controls, suggesting an active SARS-CoV-2–specific B cell response in acute COVID-19 (Fig. 3G, 3I). We detected IgA–, IgG–, and IgM–ASCs that are specific for SARS-CoV-2 N protein yet at highly variable numbers among the patients. Overall, N protein–specific ASCs constituted a small fraction of total ASCs (median and interquartile range [IQR] = 3.47% [2.5–4.9]). Nonetheless, total ASC frequencies determined by flow cytometry positively correlated with N protein–specific ASC numbers (rs = 0.574, p = 0.008), suggesting that the ASC expansion detected by flow cytometry may reflect the magnitude of SARS-CoV-2 N protein–specific ASC response.
Generation of SARS-CoV-2–specific and neutralizing Abs in COVID-19 patients
The expansion of SARS-CoV-2–specific ASCs in all of the patients in our cohort suggested that the patients had developed SARS-CoV-2–specific Abs in response to the infection. To investigate this in detail, we next analyzed SARS-CoV-2–specific Ab levels.
First, we measured SARS-CoV-2 spike S1-specific IgA and IgG as well as N protein–specific IgM Ab levels by ELISAs. We found detectable SARS-CoV-2–specific IgA (15/20 patients), IgG (15/20 patients), and IgM (16/20 patients) Ab levels in most of the COVID-19 patients (Fig. 4A, 4B). Next, we determined total anti–SARS-CoV-2–specific IgG Ab levels measured toward SARS-CoV-2–infected cells using an immunofluorescence assay (IFA) (Fig. 4C). We found that 16 out of the 20 patients were positive in this assay, with titers ranging from 40 to 5120 (Fig. 4C). As expected, none of the healthy controls were positive in any of the Ab assays (Fig. 4A).
FIGURE 4.
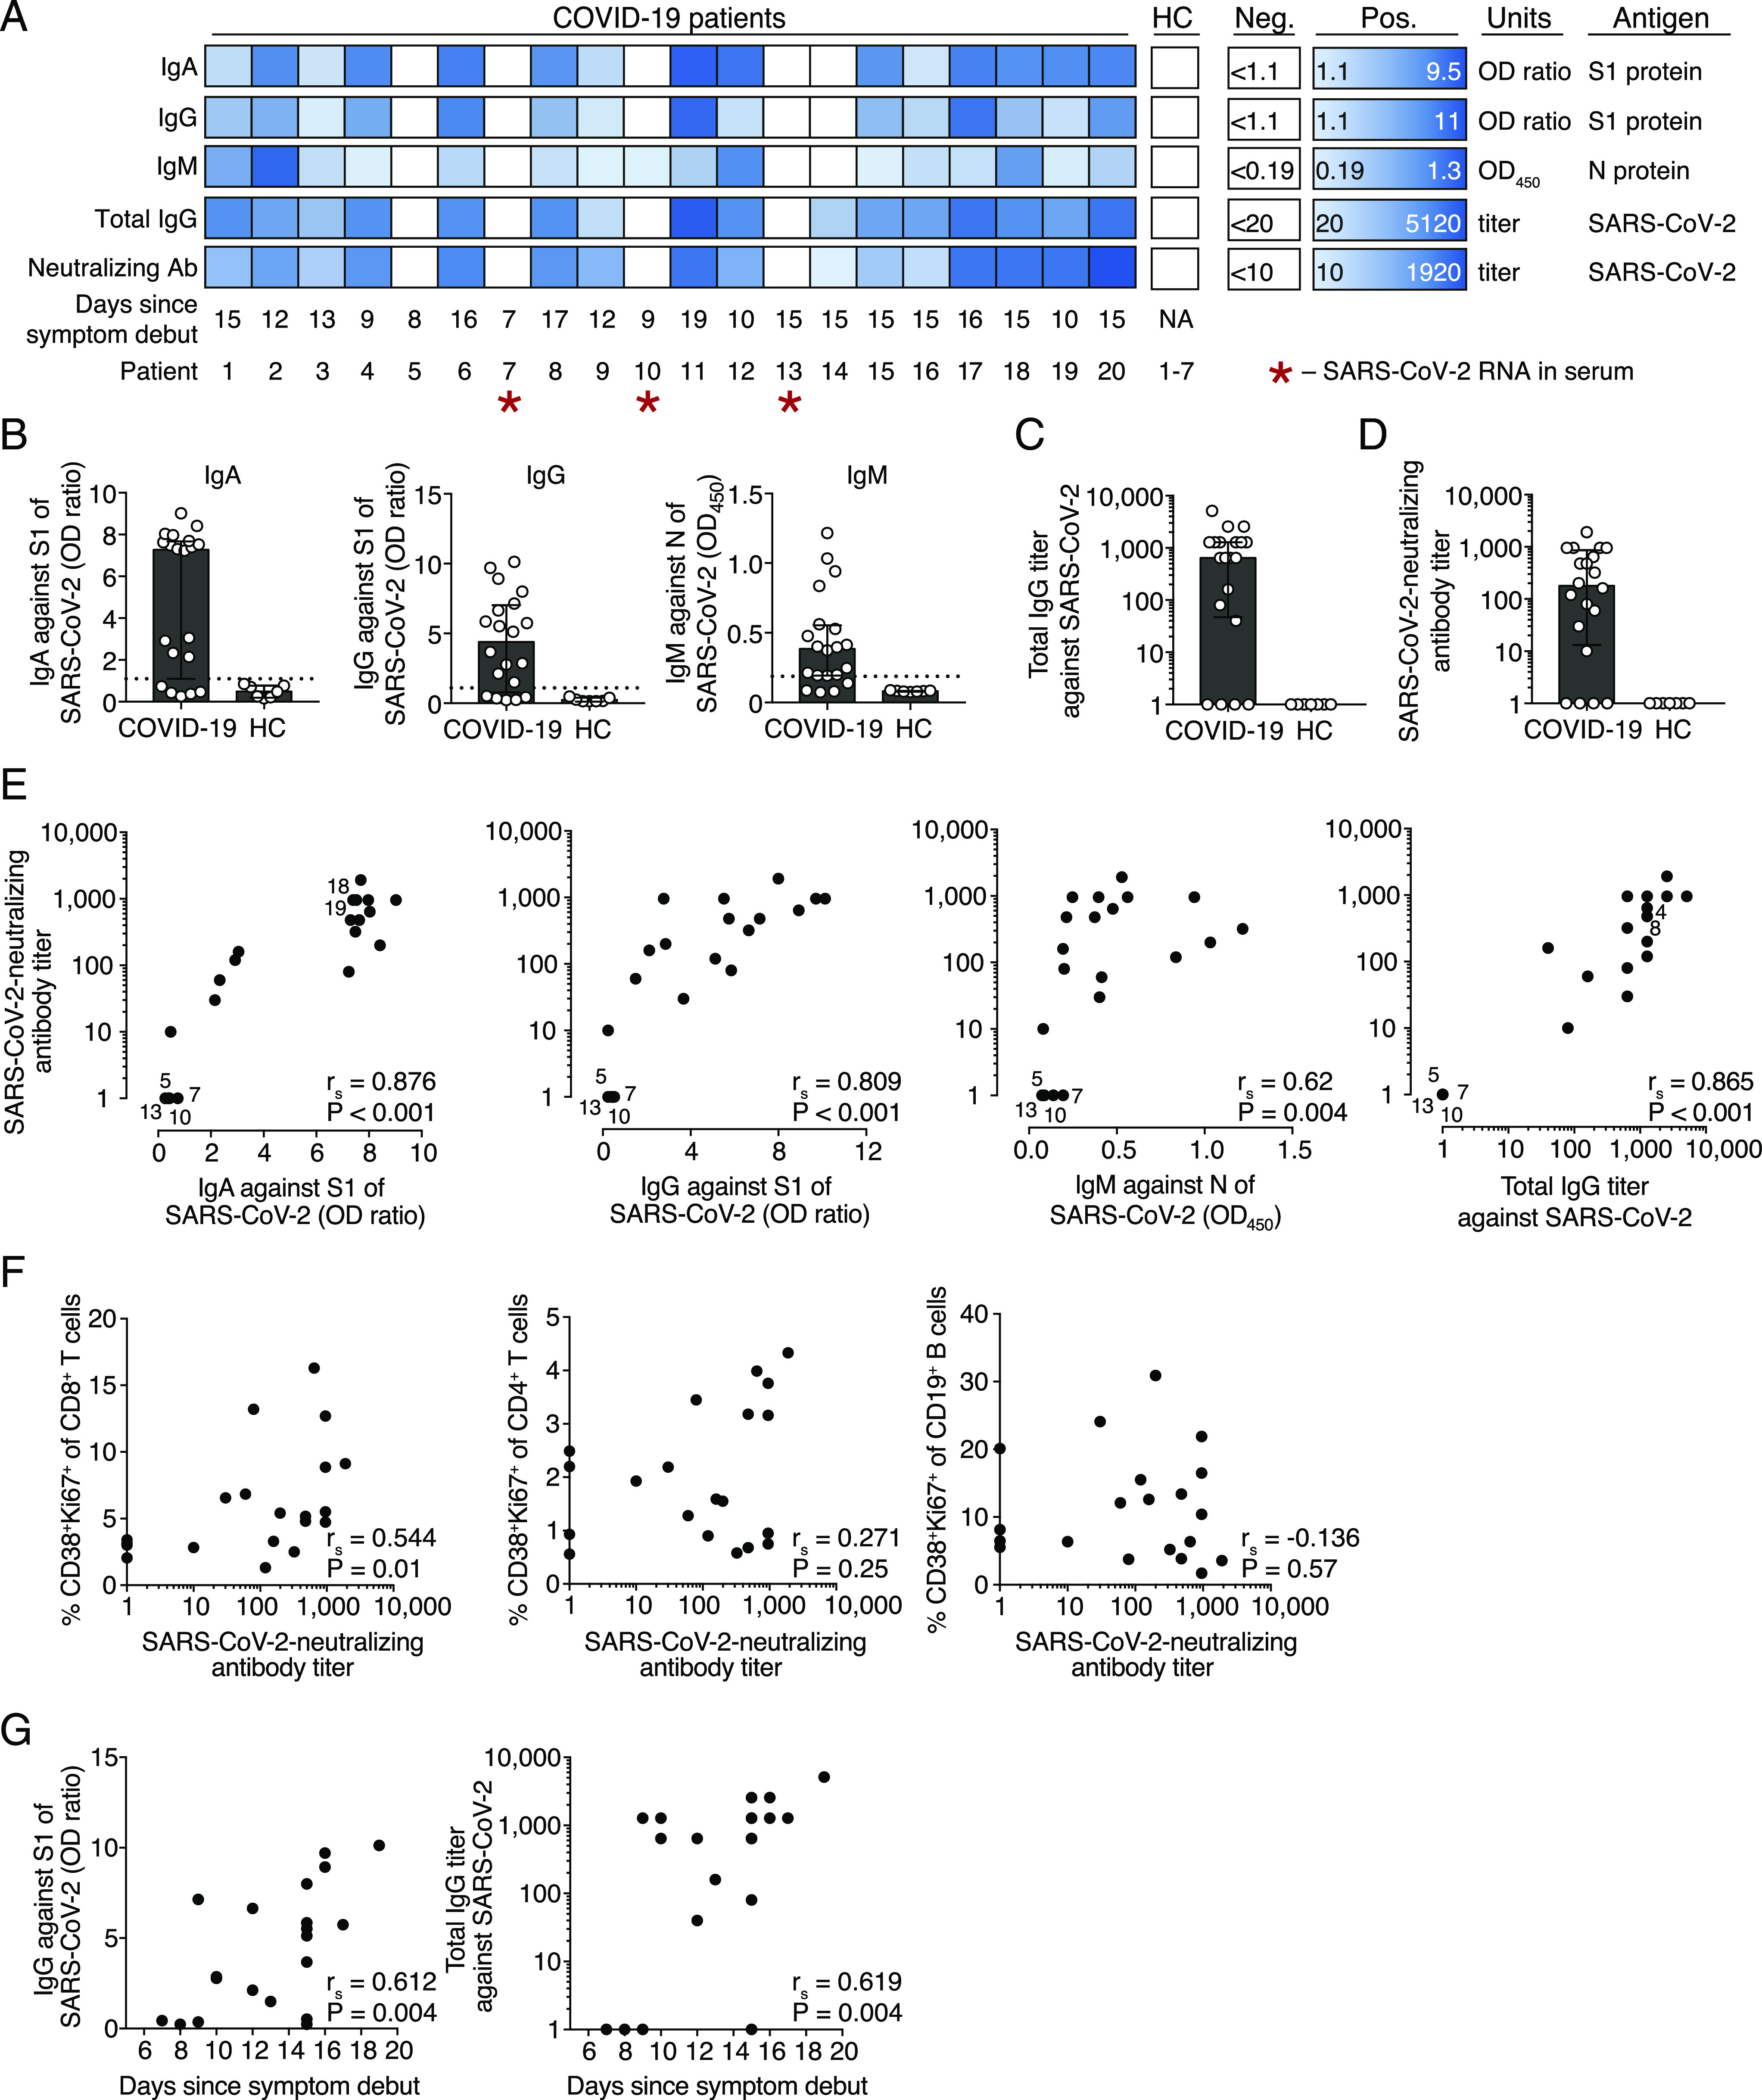
SARS-CoV-2–specific and neutralizing Ab levels in COVID-19 patients. (A) Individual Ab responses to SARS-CoV-2 in COVID-19 patients (n = 20) and healthy controls (HC) (n = 7). Positivity for IgA against S1 protein, IgG against S1 protein, IgM against N protein, total IgG Abs against whole SARS-CoV-2, and SARS-CoV-2–neutralizing Ab titers are presented in the heatmap. The color scale is adjusted for the smallest and the highest positive value recorded in the patient cohort within each assay (Pos.). White boxes indicate values below positive threshold or below detection level for each assay (Neg.). (B) IgA, IgG, and IgM Ab levels in COVID-19 patients and controls, analyzed by ELISAs. Dotted horizontal line indicates the threshold for positive result. OD ratio is the OD of the sample divided by the OD of the calibrator. (C) Total SARS-CoV-2–specific IgG Ab titers determined by IFA. Patients with titers <20 were assigned a value of 1. (D) SARS-CoV-2–neutralizing Ab titers determined by microneutralization assay. Patients with titers <10 were assigned a value of 1. (E) Spearman correlation between SARS-CoV-2–specific IgA, IgG, and IgM Ab titers and SARS-CoV-2–neutralizing Ab titers. Overlapping data points are highlighted with patient numbers. (F) Spearman correlation between activated CD8+ T cells, CD4+ T cells, CD19+ B cells, and SARS-CoV-2–neutralizing Ab titers. (G) Spearman correlation between S1-specific IgG levels, total IgG titers against SARS-CoV-2 (measured by IFA), and the number of days between COVID-19 symptom debut and sampling. Bar graphs display median and IQR. p < 0.05 was considered statistically significant.
Next, using a microneutralization assay, we assessed if the COVID-19 patients had generated SARS-CoV-2–neutralizing Abs (18). This assay measures the ability of COVID-19 patient serum to reduce the CPE caused by SARS-CoV-2 infection of susceptible cells in vitro. Neutralizing Abs were detected in most of the patients (16/20) but at heterogeneous titers ranging from 10 to 1920 (Fig. 4D). Three of the four patients with undetectable levels of SARS-CoV-2–neutralizing Abs were also below the level of detection for SARS-CoV-2–specific Abs in IFA and all ELISAs (Fig. 4A). The four patients with undetectable levels of SARS-CoV-2–neutralizing Abs (patients 5, 7, 10, and 13) were not immunocompromised nor under treatment with immunomodulatory drugs before inclusion in this study and were sampled at 8, 7, 9, and 15 d after symptom debut, respectively.
Importantly, we observed a strong positive correlation between total SARS-CoV-2–specific IgG Ab levels and neutralizing Ab titers in COVID-19 patients (Fig. 4E). Both S1-specific IgA and IgG as well as N-specific IgM levels also correlated with SARS-CoV-2–neutralizing Ab titers, suggesting that SARS-CoV-2–specific Ab levels may reflect the titers of neutralizing Abs during the acute phase of COVID-19 (Fig. 4E).
Next, we assessed if the frequencies of activated T cells and B cells correlate with SARS-CoV-2–neutralizing Ab responses. The activation level of CD8+ T cells positively correlated with neutralizing Ab titers (Fig. 4F). We found that four out of the six patients with highest neutralizing Ab titers (i.e., from 1:640 to 1:1920) also had high frequencies of both activated CD4+ and CD8+ T cells (Fig. 2C–E). However, CD4+ T cell and CD19+ B cell activation levels did not correlate with neutralizing Ab titers (Fig. 4F).
Higher SARS-CoV-2–specific IgG Ab levels were detected in patients who were sampled late compared with early after the onset of symptoms as S1-specific IgG and total SARS-CoV-2–specific IgG Ab titers positively correlated with the number of days between symptom debut to sampling (Fig. 4G).
Detection of SARS-CoV-2 RNA in serum of COVID-19 patients
An important role of neutralizing Abs is to limit the spread of the virus. We screened all serum samples by real-time RT-PCR for SARS-CoV-2 RNA (14). Three COVID-19 patients were positive for SARS-CoV-2 RNA in serum (Fig. 4A). Notably, two out of the three SARS-CoV-2 RT-PCR–positive patients lacked detectable levels of neutralizing Abs, which might allow for a more efficient spread of SARS-CoV-2 in those patients (Fig. 4A). However, our attempts to isolate live SARS-CoV-2 from patient serum on Vero E6 cells were unsuccessful (data not shown), suggesting the absence or low levels of live SARS-CoV-2 in serum of COVID-19 patients.
Inflammatory makers, neutralizing Abs, and disease duration in COVID-19
The proinflammatory cytokine IL-6 and CRP serum levels have been shown to correlate with disease severity in COVID-19 patients (19, 20). Therefore, we assessed the relationship between serum levels of IL-6, CRP, total SARS-CoV-2–specific IgG, and neutralizing Abs and the duration of hospitalization in COVID-19 patients (Fig. 5A). We measured IL-6 serum concentration in all COVID-19 patients at the time of inclusion in this study using ELISA. We found heterogenous yet significantly higher median concentration of IL-6 in COVID-19 patients compared with the controls (Fig. 5B).
FIGURE 5.

Correlations between the levels of IL-6, CRP, SARS-CoV-2–specific Abs, and the duration of COVID-19. (A) Spearman correlation matrix for serum concentration of IL-6, CRP, total SARS-CoV-2–specific IgG titers, SARS-CoV-2–neutralizing Ab titers, and the duration of hospitalization of COVID-19 patients. The color scale, circle sizes, and numbers represent the degree of correlation between the variables (i.e., rs). (B) Serum concentrations of IL-6 in COVID-19 patients and healthy controls. (C–I) Spearman correlation between serum concentrations of IL-6, CRP, the number of days of hospitalization, total SARS-CoV-2–specific IgG, and SARS-CoV-2–neutralizing Ab titers for COVID-19 patients. Bar graph displays median and IQR. Statistical significance was determined using Mann–Whitney U test. Correlations were examined by Spearman correlation. *p < 0.05, **p < 0.01, ***p < 0.001. ns, not significant.
There was a strong positive correlation between the IL-6 and CRP levels at the time of inclusion in this study (Fig. 5C). Higher serum concentrations of both IL-6 and CRP were higher in patients with a longer duration of hospitalization (Fig. 5D, 5E). Notably, IL-6 and CRP serum concentrations negatively correlated with total specific IgG and neutralizing Ab titers in COVID-19 patients, indicating a possible link between inflammation and humoral responses in COVID-19 (Fig. 5F–I).
Discussion
In this study, we demonstrated that COVID-19 patients elicit a SARS-CoV-2–specific B cell response, indicated by the expansion of SARS-CoV-2–specific ASCs. Although not all patients in the present cohort had detectable levels of SARS-CoV-2–specific Abs at the time of sampling, SARS-CoV-2 N protein–specific ASCs could be detected in all patients using the FluoroSpot Assay. In addition, we showed a clear relationship between the levels of SARS-CoV-2–specific Abs and total SARS-CoV-2–neutralizing Abs. This suggests that standard serological assays may inform about the levels of SARS-CoV-2–neutralizing Abs, which may offer protection from a reinfection. Additionally, tools employed in this study may be of relevance in the assessment of long-lasting immunity after SARS-CoV-2 infection and vaccination.
The expansion of ASCs in the present cohort of COVID-19 patients highlights an active B cell response to SARS-CoV-2 infection. The frequencies of ASCs within the total circulating B cell population were highly variable between COVID-19 patients, ranging from 3 to 31%. Although the patients in this cohort were sampled at different timepoints following the onset of symptoms, a high variability in ASC frequencies has also been observed among patients infected with influenza or dengue virus sampled at normalized timepoints (e.g., 7 d after febrile illness) (4, 5). Although ASCs have been shown to expand to very high levels in some viral infections, constituting up to 50–80% of all peripheral B cells, the highest ASCs frequency in this cohort of COVID-19 patients was 31% (5, 7, 21). Healthy controls in this study had very low frequencies of ASCs in the circulation, a finding consistent with previous observations (5, 6, 16).
The ASC response in peripheral blood is usually transient and peaks at around 7 d after the onset of febrile illness, dropping to steady-state levels 2–3 wk later (8). Interestingly, we observed a substantial ASC expansion as late as 19 d following symptom debut. This finding highlights the similarity between COVID-19 and RSV infection, in which a significant ASC expansion could be detected as late as 22–45 d after the onset of symptoms (9). The prolonged ASC expansion in RSV infection was associated with longer RSV shedding in the airways. Thus, the kinetics of ASC response may be dependent on pathogen persistence. In support of our findings, a recent report on longitudinal immune responses in a single COVID-19 patient with mild disease showed the peak of ASC expansion at day 8 after symptom onset, but a substantial ASCs response could still be detected by day 20 (22). Thus, it remains to be investigated whether SARS-CoV-2 persistence in the airways may lead to a prolonged ASC response in circulation.
The expansion of ASCs is usually characterized by high specificity toward the infectious agent (17). In this study, we successfully demonstrated that COVID-19 patients generate SARS-CoV-2–specific ASC responses using a FluoroSpot Assay. We were able to identify SARS-CoV-2–specific IgA–, IgG–, and IgM–ASCs in all COVID-19 patients. The frequency of SARS-CoV-2–specific ASCs within the total ASC population in this patient cohort was relatively low. However, because only the SARS-CoV-2 N protein was used to detect specific ASCs in this study, the numbers of N protein–specific ASCs do not reflect the overall magnitude of the specific ASC response. The use of SARS-CoV-2 viral lysate or rSARS-CoV-2 proteins in combination would allow for the evaluation of the overall ASC response. Furthermore, the FluoroSpot Assay described in this study could be adapted to evaluate memory B cell responses to various SARS-CoV-2 proteins in convalescent COVID-19 patient samples.
The protective level of SARS-CoV-2–neutralizing Abs in COVID-19 has not yet been determined. mAbs isolated from convalescent COVID-19 patients showed a strong SARS-CoV-2–neutralizing capacity in vitro and in vivo in transgenic mice expressing human SARS-CoV-2 receptor ACE2 (23). However, extensive longitudinal studies in humans are required to investigate if recovered COVID-19 patients are protected from reinfection with SARS-CoV-2. Seroconversion in COVID-19 patients, measured by detectable SARS-CoV-2–specific IgG levels, has been recently shown to take place within 19 d after the onset of symptoms (24). The four patients in the present COVID-19 cohort without detectable neutralizing Ab titers were sampled at days 7, 8, 9, and 15 after symptom debut. Although these four patients did not have detectable neutralizing Ab titers, SARS-CoV-2–specific ASCs were detected. This indicates that the FluoroSpot Assay may be a more sensitive method to detect early B cell responses to SARS-CoV-2 compared with standard serological assays.
In this cohort of patients, two out of the four patients with undetectable neutralizing Ab levels had SARS-CoV-2 RNA in serum. Currently, the extent to which neutralizing Abs contribute to the control of viremia in COVID-19 is unclear. Our results seem to suggest that neutralizing Abs may not be the only player in SARS-CoV-2 control in circulation as one patient with substantial levels of SARS-CoV-2–neutralizing Abs in this cohort had detectable serum levels of SARS-CoV-2 RNA. A pilot study assessing the effectiveness of COVID-19 patient treatment with convalescent plasma containing SARS-CoV-2–neutralizing Abs found that the treatment reduced viral load in patients within a few days after administration, suggesting that neutralizing Abs have a role in the management of viremia in COVID-19 (25).
Rapid serology tests are essential for COVID-19 diagnostics and for national serosurveillance programs. Neutralizing Ab tests, however, are usually laborious and time-consuming. Therefore, diagnostic tests often rely on other methods such as ELISA. Ab levels detected by ELISA, however, do not necessarily reflect the neutralization capacity of patient serum. In this study, we demonstrated a strong correlation between SARS-CoV-2–specific and SARS-CoV-2–neutralizing Ab titers. These data suggest that the levels of SARS-CoV-2–specific Abs measured with ELISA may reflect the capacity of serum from COVID-19 patients to neutralize SARS-CoV-2.
COVID-19 patients generally present with decreased lymphocyte numbers in peripheral blood, which is particularly pronounced in severe cases (19, 26, 27). T cells appear to be the most affected lymphocyte subset. In agreement with these observations, we found decreased numbers of lymphocytes and significantly lower T cell numbers in the present cohort of COVID-19 patients.
In addition to lymphopenia, COVID-19 patients typically display increased concentrations of inflammatory cytokines in serum, especially in severe cases (19, 27). The levels of inflammatory markers IL-6 and CRP, in particular, have been shown to correlate with disease severity in COVID-19 patients (19, 20). In this cohort of COVID-19 patients, we also observed increased levels of IL-6 and CRP, with comparable median values to those measured by Liu et al. (20) in severe COVID-19 patients. We show that higher IL-6 and CRP levels were observed in patients who were hospitalized for longer, suggesting that these markers may be of use in predicting the duration of COVID-19.
Last, we observed an inverse correlation between IL-6 levels and SARS-CoV-2–neutralizing Ab titers in COVID-19 patients. This relationship may indicate that the lack of SARS-CoV-2–neutralizing Abs leads to higher inflammation or that high levels of inflammation impair or delay Ab responses. Further studies in which a longitudinal patient sampling at controlled timepoints is performed are required to describe the relationship between inflammation and humoral responses in COVID-19.
Taken together, we provide a detailed description of clinical and immunological parameters in 20 COVID-19 patients, with a focus on B cell and Ab responses. We demonstrate that COVID-19 patients elicit a SARS-CoV-2–specific B cell response, indicated by the expansion of SARS-CoV-2–specific ASCs. In addition, we show a clear relationship between the levels of SARS-CoV-2–specific Abs and SARS-CoV-2–neutralizing Abs. The tools employed in this study may be of relevance in the assessment of long-lasting immunity after SARS-CoV-2 infection and vaccination.
Supplementary Material
Acknowledgments
We thank the patients and healthy controls for participating in the study. We thank the nurses at the Karolinska University Hospital in Stockholm, Sweden for blood sampling of patients, T. Aktas and M. Olausson at the Public Health Agency of Sweden for technical assistance, and P. Schierloh at Instituto de Investigación y Desarrollo en Bioingeniería y Bioinformática - Universidad Nacional de Entre Ríos - Consejo Nacional de Investigaciones Científicas y Técnicas (Oro Verde, Argentina) for providing input on statistical analysis.
This work was supported by the Marianne and Marcus Wallenberg Foundation (to S.G.-R.), grants provided by the Region Stockholm (ALF Project) (to S.G.-R.), doctoral education funding from the Karolinska Institutet (to S.G.-R.), the Swedish Research Council (2018-02646 and 2020-05782) (to J.K.), and the SciLifeLab National COVID-19 Research Program (to J.K.).
The online version of this article contains supplemental material.
- AF
- Alexa Fluor
- ASC
- Ab-secreting cell
- BV
- Brilliant Violet
- COVID-19
- coronavirus disease 2019
- CPE
- cytopathic effect
- CRP
- C-reactive protein
- ICU
- intensive care unit
- IFA
- immunofluorescence assay
- IQR
- interquartile range
- N
- nucleocapsid
- rs
- Spearman correlation coefficient
- RSV
- respiratory syncytial virus
- RT
- room temperature
- SARS-CoV-2
- severe acute respiratory syndrome coronavirus 2.
Disclosures
The authors have no financial conflicts of interest.
References
- 1.Zhou P., Yang X.-L., Wang X.-G., Hu B., Zhang L., Zhang W., Si H. R., Zhu Y., Li B., Huang C. L., et al. 2020. A pneumonia outbreak associated with a new coronavirus of probable bat origin. Nature 579: 270–273. [DOI] [PMC free article] [PubMed] [Google Scholar]
- 2.Huang C., Wang Y., Li X., Ren L., Zhao J., Hu Y., Zhang L., Fan G., Xu J., Gu X., et al. 2020. Clinical features of patients infected with 2019 novel coronavirus in Wuhan, China. [Published erratum appears in 2020 Lancet 395: 496.] Lancet 395: 497–506. [DOI] [PMC free article] [PubMed] [Google Scholar]
- 3.Nutt S. L., Hodgkin P. D., Tarlinton D. M., Corcoran L. M. 2015. The generation of antibody-secreting plasma cells. Nat. Rev. Immunol. 15: 160–171. [DOI] [PubMed] [Google Scholar]
- 4.Huang K.-Y. A., Li C. K.-F., Clutterbuck E., Chui C., Wilkinson T., Gilbert A., Oxford J., Lambkin-Williams R., Lin T.-Y., McMichael A. J., Xu X.-N. 2014. Virus-specific antibody secreting cell, memory B-cell, and sero-antibody responses in the human influenza challenge model. J. Infect. Dis. 209: 1354–1361. [DOI] [PubMed] [Google Scholar]
- 5.Wrammert J., Onlamoon N., Akondy R. S., Perng G. C., Polsrila K., Chandele A., Kwissa M., Pulendran B., Wilson P. C., Wittawatmongkol O., et al. 2012. Rapid and massive virus-specific plasmablast responses during acute dengue virus infection in humans. J. Virol. 86: 2911–2918. [DOI] [PMC free article] [PubMed] [Google Scholar]
- 6.García M., Iglesias A., Landoni V. I., Bellomo C., Bruno A., Córdoba M. T., Balboa L., Fernández G. C., Sasiain M. D. C., Martínez V. P., Schierloh P. 2017. Massive plasmablast response elicited in the acute phase of hantavirus pulmonary syndrome. Immunology 151: 122–135. [DOI] [PMC free article] [PubMed] [Google Scholar]
- 7.McElroy A. K., Akondy R. S., Davis C. W., Ellebedy A. H., Mehta A. K., Kraft C. S., Lyon G. M., Ribner B. S., Varkey J., Sidney J., et al. 2015. Human Ebola virus infection results in substantial immune activation. Proc. Natl. Acad. Sci. USA 112: 4719–4724. [DOI] [PMC free article] [PubMed] [Google Scholar]
- 8.Fink K. 2012. Origin and function of circulating plasmablasts during acute viral infections. Front. Immunol. 3: 78. [DOI] [PMC free article] [PubMed] [Google Scholar]
- 9.Lee F. E.-H., Falsey A. R., Halliley J. L., Sanz I., Walsh E. E. 2010. Circulating antibody-secreting cells during acute respiratory syncytial virus infection in adults. J. Infect. Dis. 202: 1659–1666. [DOI] [PMC free article] [PubMed] [Google Scholar]
- 10.Wrammert J., Smith K., Miller J., Langley W. A., Kokko K., Larsen C., Zheng N.-Y., Mays I., Garman L., Helms C., et al. 2008. Rapid cloning of high-affinity human monoclonal antibodies against influenza virus. Nature 453: 667–671. [DOI] [PMC free article] [PubMed] [Google Scholar]
- 11.Qian Y., Wei C., Lee F. E.-H., Campbell J., Halliley J., Lee J. A., Cai J., Kong Y. M., Sadat E., Thomson E., et al. 2010. Elucidation of seventeen human peripheral blood B-cell subsets and quantification of the tetanus response using a density-based method for the automated identification of cell populations in multidimensional flow cytometry data. Cytometry B Clin. Cytom. 78(Suppl. 1): S69–S82. [DOI] [PMC free article] [PubMed] [Google Scholar]
- 12.Crotty S., Aubert R. D., Glidewell J., Ahmed R. 2004. Tracking human antigen-specific memory B cells: a sensitive and generalized ELISPOT system. J. Immunol. Methods 286: 111–122. [DOI] [PubMed] [Google Scholar]
- 13.Murin C. D., Wilson I. A., Ward A. B. 2019. Antibody responses to viral infections: a structural perspective across three different enveloped viruses. Nat. Microbiol. 4: 734–747. [DOI] [PMC free article] [PubMed] [Google Scholar]
- 14.Corman V. M., Landt O., Kaiser M., Molenkamp R., Meijer A., Chu D. K., Bleicker T., Brünink S., Schneider J., Schmidt M. L., et al. 2020. Detection of 2019 novel coronavirus (2019-nCoV) by real-time RT-PCR. Euro Surveill. 25: 2000045. [DOI] [PMC free article] [PubMed] [Google Scholar]
- 15.(Released by National Health Commission & National Administration of Traditional Chinese Medicine on March 3, 2020) 2020. Diagnosis and treatment protocol for novel coronavirus pneumonia (trial version 7). Chin. Med. J. (Engl.) 133: 1087–1095. [DOI] [PMC free article] [PubMed] [Google Scholar]
- 16.Mei H. E., Yoshida T., Sime W., Hiepe F., Thiele K., Manz R. A., Radbruch A., Dörner T. 2009. Blood-borne human plasma cells in steady state are derived from mucosal immune responses. Blood 113: 2461–2469. [DOI] [PubMed] [Google Scholar]
- 17.Lee F. E. H., Halliley J. L., Walsh E. E., Moscatiello A. P., Kmush B. L., Falsey A. R., Randall T. D., Kaminiski D. A., Miller R. K., Sanz I. 2011. Circulating human antibody-secreting cells during vaccinations and respiratory viral infections are characterized by high specificity and lack of bystander effect. J. Immunol. 186: 5514–5521. [DOI] [PMC free article] [PubMed] [Google Scholar]
- 18.Manenti A., Maggetti M., Casa E., Martinuzzi D., Torelli A., Trombetta C. M., Marchi S., Montomoli E. 2020. Evaluation of SARS-CoV-2 neutralizing antibodies using a CPE-based colorimetric live virus micro-neutralization assay in human serum samples. J. Med. Virol. DOI: 10.1002/jmv.25986. [DOI] [PMC free article] [PubMed]
- 19.Zhang X., Tan Y., Ling Y., Lu G., Liu F., Yi Z., Jia X., Wu M., Shi B., Xu S., et al. 2020. Viral and host factors related to the clinical outcome of COVID-19. Nature 583: 437–440. [DOI] [PubMed] [Google Scholar]
- 20.Liu F., Li L., Xu M., Wu J., Luo D., Zhu Y., Li B., Song X., Zhou X. 2020. Prognostic value of interleukin-6, C-reactive protein, and procalcitonin in patients with COVID-19. J. Clin. Virol. 127: 104370. [DOI] [PMC free article] [PubMed] [Google Scholar]
- 21.Garcia-Bates T. M., Cordeiro M. T., Nascimento E. J. M., Smith A. P., Soares de Melo K. M., McBurney S. P., Evans J. D., Marques E. T. A., Jr., Barratt-Boyes S. M. 2013. Association between magnitude of the virus-specific plasmablast response and disease severity in dengue patients. J. Immunol. 190: 80–87. [DOI] [PMC free article] [PubMed] [Google Scholar]
- 22.Thevarajan I., Nguyen T. H. O., Koutsakos M., Druce J., Caly L., van de Sandt C. E., Jia X., Nicholson S., Catton M., Cowie B., et al. 2020. Breadth of concomitant immune responses prior to patient recovery: a case report of non-severe COVID-19. Nat. Med. 26: 453–455. [DOI] [PMC free article] [PubMed] [Google Scholar]
- 23.Cao Y., Su B., Guo X., Sun W., Deng Y., Bao L., Zhu Q., Zhang X., Zheng Y., Geng C., et al. 2020. Potent neutralizing antibodies against SARS-CoV-2 identified by high-throughput single-cell sequencing of convalescent patients’ B cells. Cell 182: 73–84.e16. [DOI] [PMC free article] [PubMed] [Google Scholar]
- 24.Long Q.-X., Liu B.-Z., Deng H.-J., Wu G.-C., Deng K., Chen Y.-K., Liao P., Qiu J.-F., Lin Y., Cai X.-F., et al. 2020. Antibody responses to SARS-CoV-2 in patients with COVID-19. Nat. Med. 26: 845–848. [DOI] [PubMed] [Google Scholar]
- 25.Duan K., Liu B., Li C., Zhang H., Yu T., Qu J., Zhou M., Chen L., Meng S., Hu Y., et al. 2020. Effectiveness of convalescent plasma therapy in severe COVID-19 patients. Proc. Natl. Acad. Sci. USA 117: 9490–9496. [DOI] [PMC free article] [PubMed] [Google Scholar]
- 26.Wang F., Nie J., Wang H., Zhao Q., Xiong Y., Deng L., Song S., Ma Z., Mo P., Zhang Y. 2020. Characteristics of peripheral lymphocyte subset alteration in COVID-19 pneumonia. J. Infect. Dis. 221: 1762–1769. [DOI] [PMC free article] [PubMed] [Google Scholar]
- 27.Qin C., Zhou L., Hu Z., Zhang S., Yang S., Tao Y., Xie C., Ma K., Shang K., Wang W., Tian D.-S. 2020. Dysregulation of immune response in patients with coronavirus 2019 (COVID-19) in Wuhan, China. Clin. Infect. Dis. 71: 762–768. [DOI] [PMC free article] [PubMed] [Google Scholar]
Associated Data
This section collects any data citations, data availability statements, or supplementary materials included in this article.