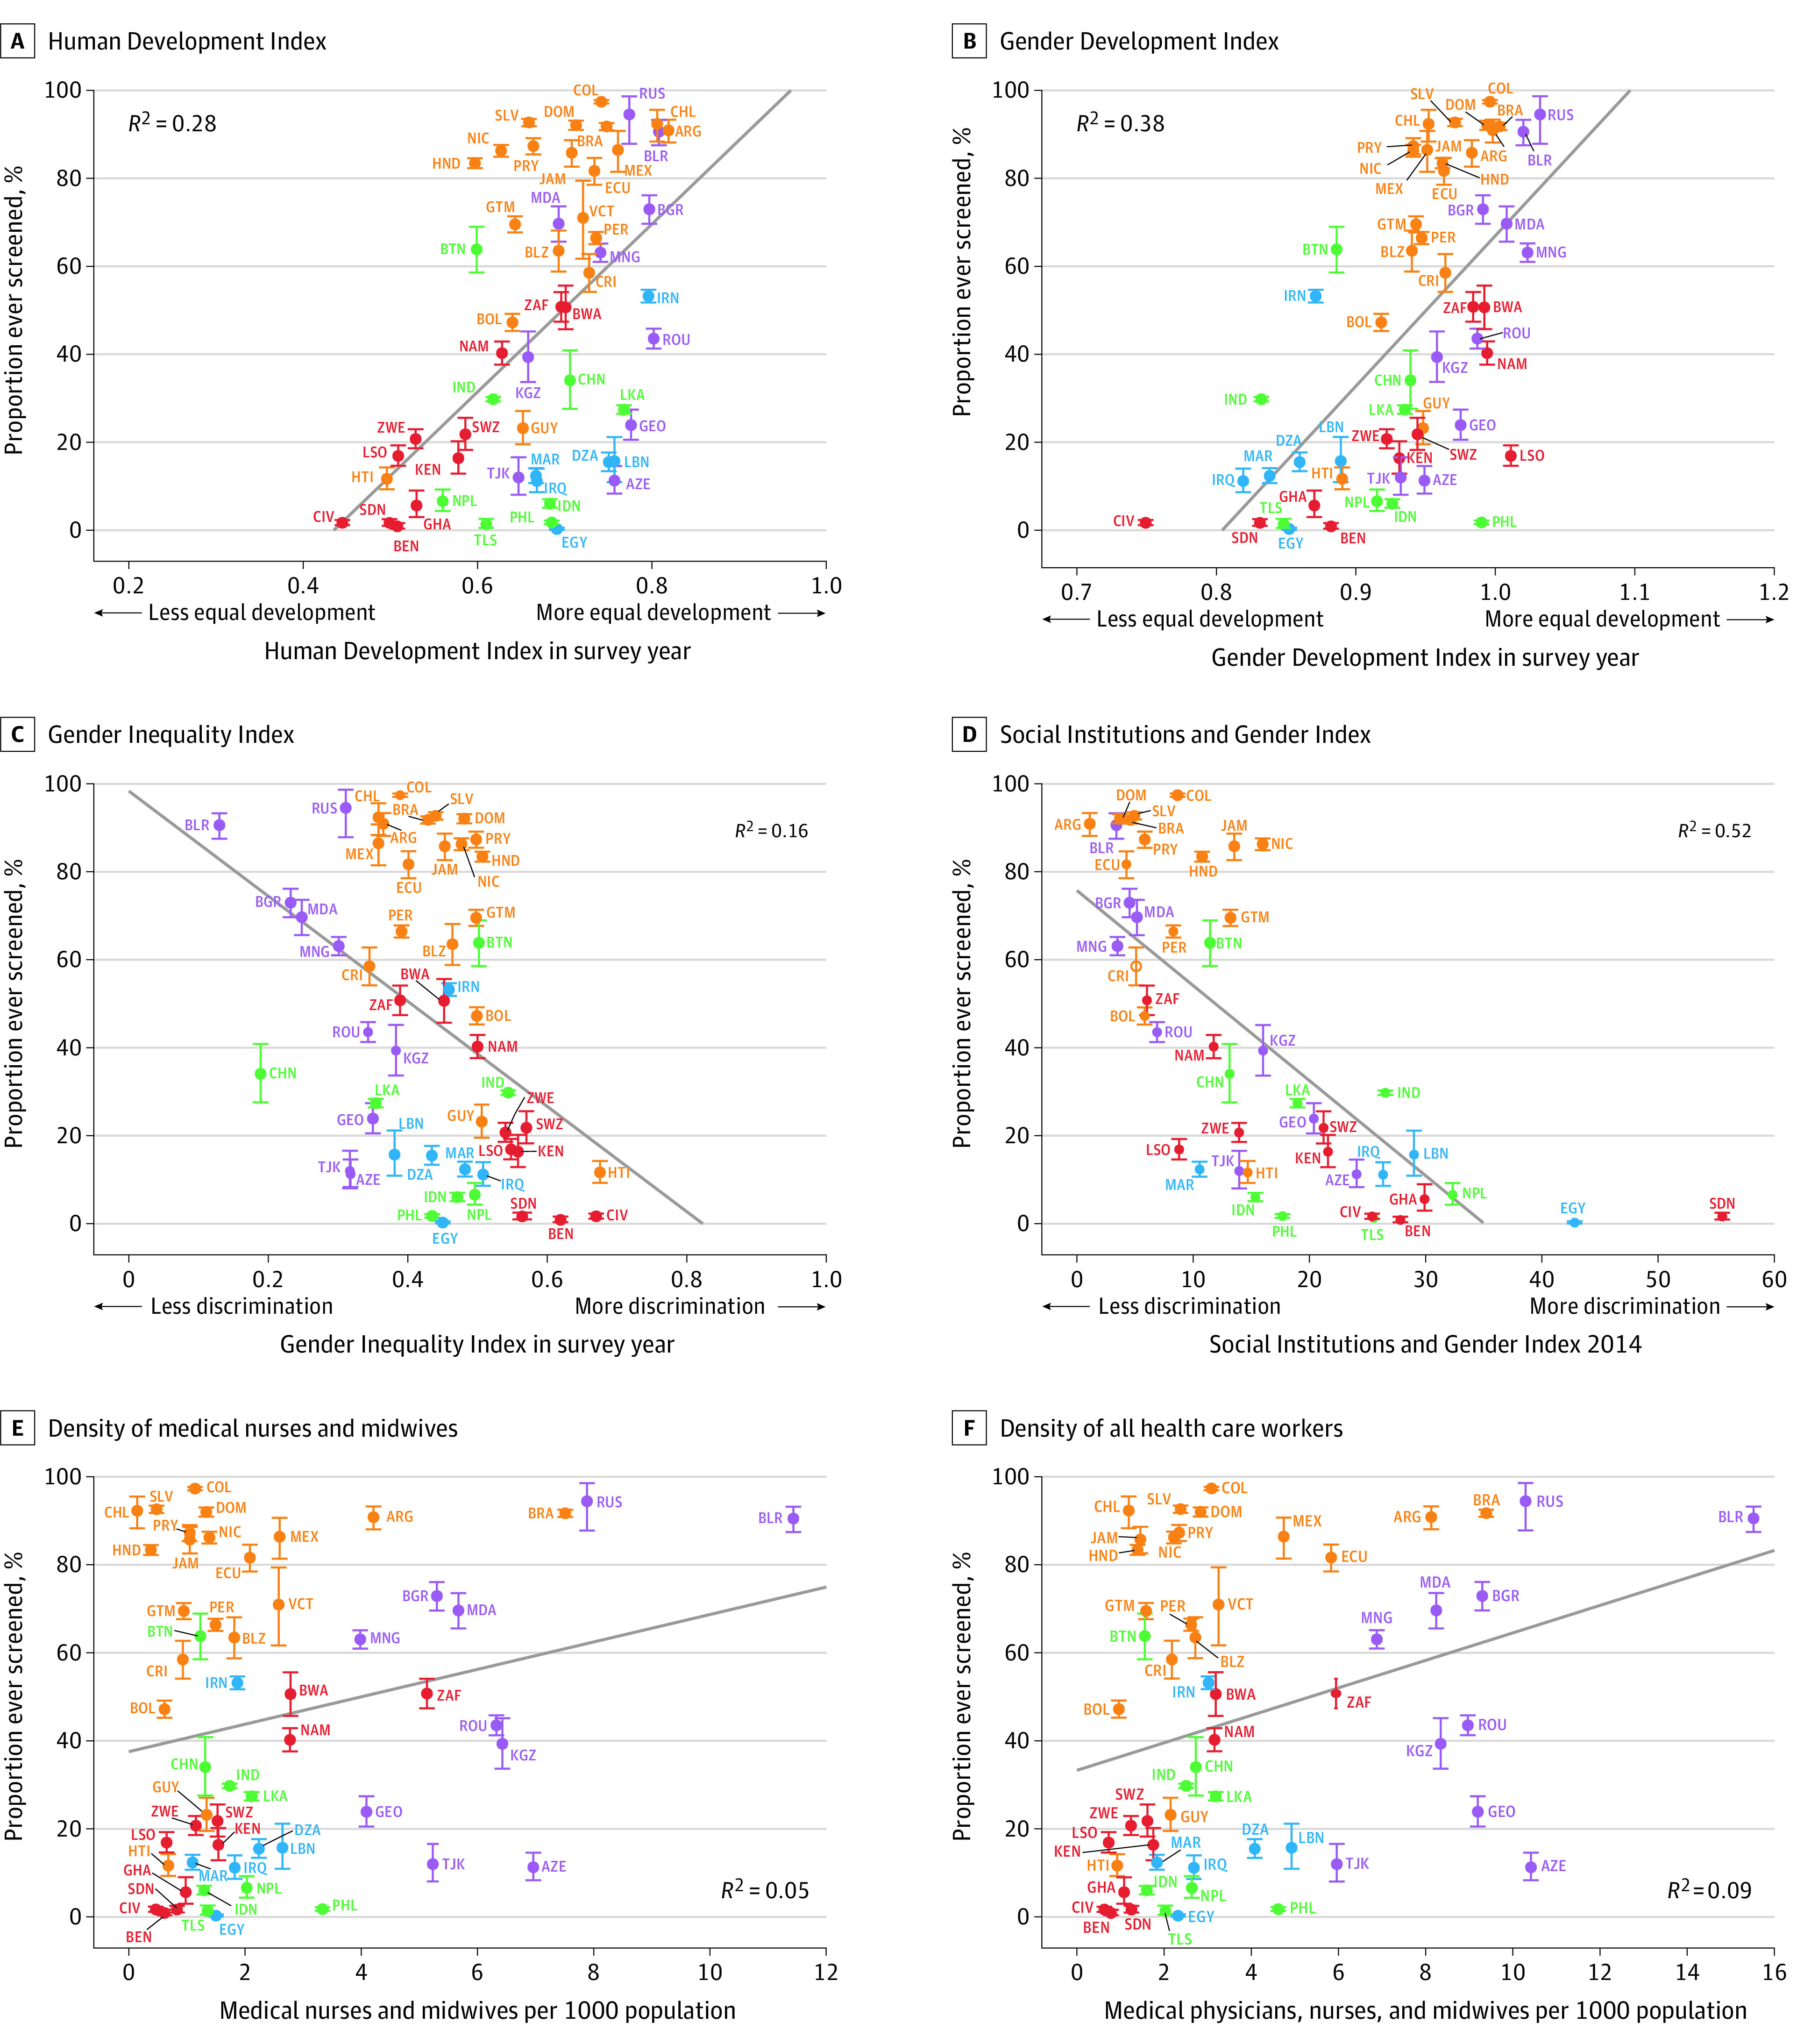
Figure 3. Self-reported Lifetime Prevalence of Cervical Cancer Screening by Human Development Index, Gender Equality Indices, and Health Worker Density.

The sample included only women aged 30 through 49 years. ISO codes are defined in the Table. A Gender Development Index value was not available for St Vincent and the Grenadines; a Gender Inequality Index value was not available for Ghana, St Vincent and the Grenadines, and Timor-Leste. Error bars indicate 95% CIs. The diagonal lines depict ordinary least-squares regressions (with each country having the same weight) of lifetime cervical cancer screening prevalence in a country onto the country-level variables of the Human Development Index (0.53; 95% CI, 0.30 to 0.76), Gender Development Index (0.62; 95% CI, 0.41 to 0.83), Gender Inequality Index (−0.40; 95% CI, −0.66 to −0.15), Social Institutions and Gender Index (−0.72; 95% CI, −0.92 to −0.52), density of medical nurses and midwives (0.22; 95% CI, 0.04 to 0.48), and health worker density (0.30; 95% CI, 0.04 to 0.56 ). Estimates among all women and estimates that were adjusted for differences in individual-level characteristics between countries are shown in eFigures 7, 9, and 11 in the Supplement.
