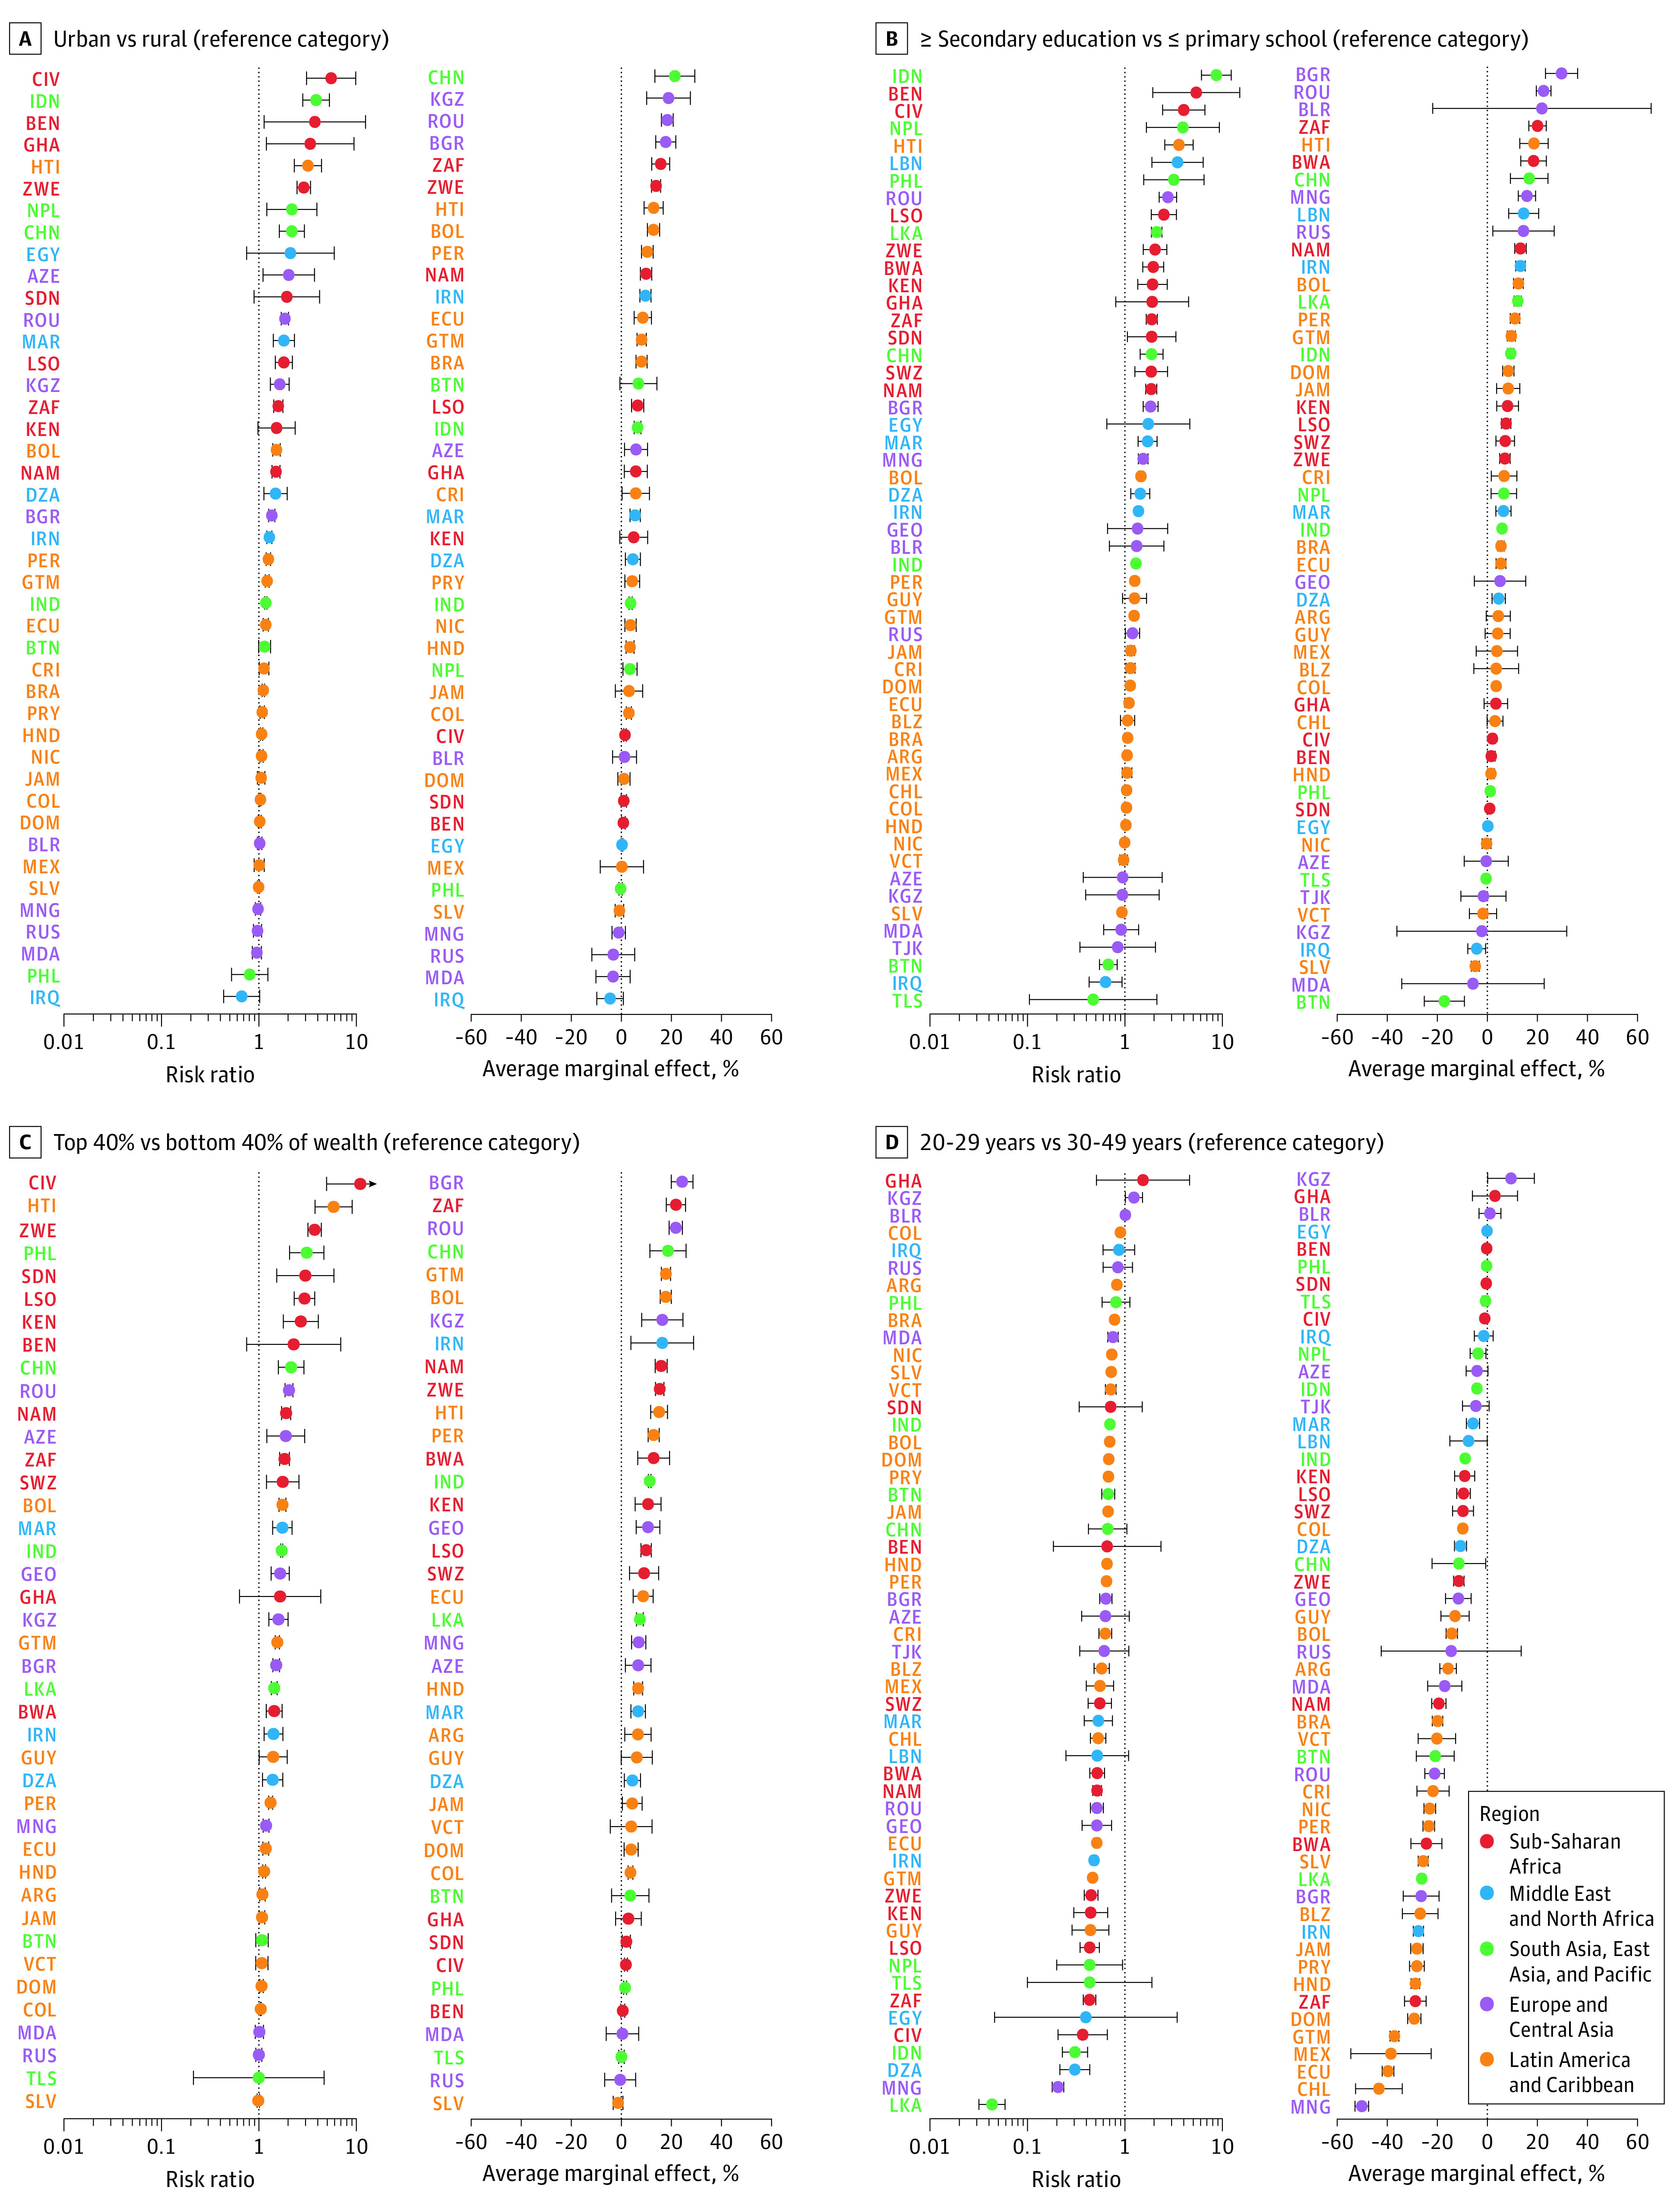
Figure 4. Relative and Absolute Differences in the Probability of Having Ever Been Screened for Cervical Cancer by Sociodemographics .

ISO codes are defined in the Table. All regressions were adjusted for age (except D) only, using restricted splines placed at the 5th, 27.5th, 50th, 72.5th, and 95th percentiles. All regressions used sampling weights and adjusted SEs for clustering at the primary sampling unit. Error bars depict 95% CIs. Estimates are in the Supplement.
