

Abstract
OBJECTIVE
The aim of this trial was to compare the efficacy of real-time and intermittently scanned continuous glucose monitoring (rtCGM and isCGM, respectively) in maintaining optimal glycemic control.
RESEARCH DESIGN AND METHODS
In this randomized study, adults with type 1 diabetes (T1D) and normal hypoglycemia awareness (Gold score <4) used rtCGM (Guardian Connect Mobile) or isCGM (FreeStyle Libre) during 4 days of physical activity (exercise phase) and in the subsequent 4 weeks at home (home phase). Primary end points were time in hypoglycemia (<3.9 mmol/L [<70 mg/dL]) and time in range (3.9–10.0 mmol/L [70–180 mg/dL]). The isCGM group wore an additional masked Enlite sensor (iPro2) for 6 days to check for bias between the different sensors used by the rtCGM and isCGM systems.
RESULTS
Sixty adults with T1D (mean age 38 ± 13 years; A1C 62 ± 12 mmol/mol [7.8 ± 1.1%]) were randomized to rtCGM (n = 30) or isCGM (n = 30). All participants completed the study. Percentage of time in hypoglycemia (<3.9 mmol/L [<70 mg/dL]) was lower among rtCGM versus isCGM participants in the exercise phase (6.8 ± 5.5% vs. 11.4 ± 8.6%, respectively; P = 0.018) and during the home phase (5.3 ± 2.5% vs. 7.3 ± 4.4%, respectively; P = 0.035). Hypoglycemia differences were significant and most notable during the night. rtCGM participants spent more time in range (3.9–10 mmol/L [70–180 mg/dL]) than isCGM participants throughout both the exercise (78.5 ± 10.2% vs. 69.7 ± 16%, respectively; P = 0.0149) and home (75.6 ± 9.7% vs. 67.4 ± 17.8%, respectively; P = 0.0339) phases. The results were robust to the insignificant bias between rtCGM and isCGM sensors that masked CGM found in the isCGM arm.
CONCLUSIONS
rtCGM was superior to isCGM in reducing hypoglycemia and improving time in range in adults with T1D with normal hypoglycemia awareness, demonstrating the value of rtCGM alarms during exercise and in daily diabetes self-management.
Introduction
Hypoglycemia is a common and significant acute complication of type 1 diabetes (T1D) and remains the primary obstacle to achieving optimal glycemic control in T1D (1). The risk of severe hypoglycemia is increased during and up to 24 h after extended periods of physical activity due to increased glucose uptake and insulin sensitivity (2–4). Recent advances in continuous glucose monitoring (CGM) technologies have prompted their increased adoption by individuals with insulin-treated diabetes to minimize or avoid severe hypoglycemia as they achieve desired glycemic control.
Two types of CGM systems are currently available: real-time CGM (rtCGM) and intermittently scanned CGM (isCGM). rtCGM systems, such as the Guardian Connect Mobile (Medtronic, Inc., Northridge, CA), automatically transmit a continuous stream of real-time numerical and graphical information about the current glucose level and direction/velocity of change to the user’s receiver or smartphone. These systems also feature active alerts/alarms that warn users of immediate and/or impending hypoglycemia or hyperglycemia. The FreeStyle Libre Flash Glucose Monitoring 14 day and FreeStyle Libre 2 systems (Abbott Diabetes Care, Alameda, CA) are currently the only isCGM systems available. These systems provide the same glycemic information as rtCGM devices but require users to consciously scan the sensor to obtain glucose data. Only the FreeStyle Libre 2 system provides optional alarms/alerts.
Large clinical trials have demonstrated that use of either rtCGM or isCGM decreases the occurrence of severe hypoglycemia and reduces time spent in the hypoglycemic ranges (<70 mg/dL [<3.9 mmol/L], <54 mg/dL [<3.0 mmol/L]) in T1D (5–10). However, to our knowledge, there is only one head-to-head pilot study (Impact on Hypoglycaemia Awareness of Real Time CGM and Intermittent Continuous Glucose Data [IHART-CGM]) comparing rtCGM and isCGM in individuals with T1D at high risk for hypoglycemia (11). The study showed that use of rtCGM more effectively reduces time spent in hypoglycemia in T1D adults with impaired hypoglycemia awareness compared with isCGM use. An extension of the IHART-CGM trial showed similar findings (12). However, there are no comparative studies regarding use of these devices during periods of physical activity or within unselected patient populations.
In the current Comparison of CGM in Randomized Study of Real-time and Intermittently Scanned Systems in T1D With Normal Awareness of Hypoglycemia (CORRIDA) study, we compared the effects of rtCGM and isCGM use on glycemic control in adults with T1D during supervised physical exercise activities and in a following home-use study phase.
Research Design and Methods
Study Design and Participants
In this randomized, controlled trial, glycemic control was assessed in adults with T1D using either rtCGM (Guardian Connect Mobile; Medtronic, Inc.) or isCGM (FreeStyle Libre Flash Glucose Monitoring System) during a 4-day training program focused on physical activity and over 4 weeks of follow-up home use. Subjects were recruited from the population with diabetes treated at the 3rd Department of Internal Medicine, 1st Faculty of Medicine, Charles University. The study was approved by an independent ethics review board and conducted in accordance with the Declaration of Helsinki (13). The trial was registered with ClinicalTrials.gov (NCT04358263). All subjects provided written informed consent prior to enrollment.
Inclusion criteria were age ≥18 years; >2 years’ duration of diabetes; Gold score <4; no history of severe hypoglycemia within last 6 months prior to the study initiation; and no previous experience with rtCGM and/or isCGM. Prerequisite for participation in this trial was willingness to participate in a 4-day exercise phase and use of rtCGM or isCGM technology. Exclusion criteria were previous rtCGM or isCGM use; hypoglycemia unawareness; known severe diabetic retinopathy and/or macular edema; lactation, pregnancy, or intending to become pregnant during the study; having a condition likely to require MRI; use of acetaminophen-containing medication; or unwillingness to use the study device.
Procedures
Participants were scheduled for a total of three clinic visits and a 4-day exercise phase (Fig. 1). At visit 1, investigators obtained a medication history, performed a physical examination, obtained blood samples for laboratory analysis (A1C, plasma glucose, and C-peptide), and administered validated instruments, Gold score (14) and an abbreviated version of the World Health Organization Quality of Life-BREF assessment (WHOQOL-BREF) (15). The Gold method poses the question “do you know when your hypos are commencing?” The respondent then completes a 7-point Likert scale (1, “always aware” to 7, “never aware”). A score of ≥4 implies impaired awareness of hypoglycemia (14). The WHOQOL-BREF instrument comprises 26 items, which measure the following broad domains: physical health, psychological health, social relationships, and environment (15).
Figure 1.

Study flow. V1, visit 1; V3, visit 3.
All participants initiated professional (masked) CGM (iPro2; Medtronic, Inc.) and were then monitored for 6 days. For subsequent calibration of professional CGM, all participants were also instructed to measure capillary blood glucose values at least four times per day.
At visit 2, participants were randomly assigned to use the Guardian Connect Mobile system (rtCGM) or FreeStyle Libre Flash system (isCGM). Randomization at a 1:1 ratio was achieved using an online tool (https://sealedenvelope.com). The masked CGM system was removed prior to initiating rtCGM; however, participants randomized to isCGM wore the masked system in addition to isCGM sensor for 6 days postrandomization to exclude the possibility of bias between measurements of the different CGM systems.
Both groups received training in the use of their respective CGM systems. Training included the use of the absolute value, rate of change arrow, and glucose trend line. Only basic threshold alarms (4.4–10.0 mmol/L [80–180 mg/dL]) were set for the rtCGM system. Advanced alerts such as rise rate, alert before high or fall rate, and alert before low were not activated. An urgent low alert at glucose level 3.1 mmol/L was not available in the version of Guardian Connect Mobile CGM system used in our study.
Participants with rtCGM were shown how to calibrate the system using self-monitored blood glucose values. All participants were instructed to change their sensors according to the manufacturer’s recommendations: every 6 days for rtCGM users and every 14 days for isCGM users. Participants randomized to the isCGM arm (“Libre arm”) simultaneously initiated the masked CGM (iPro2) and were then monitored for 6 days. Patients randomized to isCGM were encouraged to scan the sensor at least 10 times/day.
The following day, all participants initiated the structured 4-day exercise phase, which focused on physical activity according to predefined protocol of physical activity (e.g., circuit training, walking, or swimming). The complete protocol of physical activity is available in Supplementary Table 1. Patients were supervised by trained physiotherapists during the entire exercise phase and monitored by pedometers during the whole postrandomization phase.
Basic insulin administration skills, including timing and dosing of preprandial insulin and prevention of both daytime and nighttime hypoglycemia, as well as theoretical and practical carbohydrate counting were also reviewed during the training program.
At visit 3 (4-week follow-up), investigators again performed physical examinations, obtained blood samples for laboratory assessment tests (A1C and plasma glucose), administered the WHOQOL-BREF questionnaire, and downloaded all sensor devices for analysis.
Outcomes
The primary outcome was percentage of time spent in hypoglycemia (<3.9 mmol/L [<70 mg/dL] and <3.0 mmol/L [<54 mg/dL]) during the 4-day exercise phase, 4-week home phase, and combined exercise and home phases. Secondary outcomes were changes in time in range (TIR) (3.9–10.0 mmol/L [70–180 mg/dL]), mean sensor glucose, and glycemic variability expressed as the coefficient of variation (%CV). Changes in quality of life were also assessed using the WHOQOL-BREF, a validated, non–diabetes-specific questionnaire (15). The incidence of severe hypoglycemia (requiring third-party assistance to treat) and ketoacidosis are reported.
Statistical Analysis
Statistical analyses were performed by stratifying according to study phase (exercise phase, home phase, and exercise plus home phase). Outcomes at baseline and at each study phase were analyzed for rtCGM and isCGM separately. Change from baseline in each study phase was compared between the two interventions. On the basis of previous studies (8,12,16), we estimated 5% improvement in time below range (TBR) (<3.9 mmol/L [<70 mg/dL]) in the rtCGM group with an SD of 9% for the paired difference between study phases. Using these criteria, 28 subjects in each group (56 in total) were required to achieve the desired 80% power and an α level of 0.05 (two-tailed t test). The distribution of demographic characteristics across the groups was tested by χ2 test (count test of distributions); this test does not indicate any differences. Data from repeated measurements such as the mean glucose levels, time in/below target range, and glycemic variability were compared using a linear mixed-effects model. P values <0.05 were considered statistically significant. Analyses were conducted using the R statistical package, version 3.1.1. Data are expressed as mean, SD, %CV, and mean amplitude of glycemic excursion (MAGE). Estimated CIs (mean ± CI) were calculated for these variables.
Results
Baseline Characteristics and Participant Disposition
A total of 68 rtCGM/isCGM-naive adults with T1D were assessed for eligibility. Eight participants were excluded, and 60 were randomized and completed all study phases. Patients had comparable baseline characteristics (Table 1). Glycemic measurements from the baseline phase (masked CGM) are presented in Table 2. Between-group differences in glycemic measures at baseline are presented in Table 2. Masked CGM during the baseline phase showed no significant between-group differences with the exception of glycemic variability (%CV). No episodes of severe hypoglycemia or diabetic ketoacidosis were reported.
Table 1.
Baseline characteristics
| Characteristic | rtCGM (n = 30) | isCGM (n = 30) | P value |
|---|---|---|---|
| Male, % | 52 | 29 | 0.07 |
| Age, years | 39.6 ± 12.2 | 37.8 ± 12.7 | 0.31 |
| BMI, kg/m2 | 26.0 ± 4.2 | 24.9 ± 3.7 | 0.28 |
| Duration of diabetes, years | 15.9 ± 11.4 | 14.4 ± 10.2 | 0.26 |
| Microvascular complications, % | 33 | 27 | 0.78 |
| DKA during lifetime, % | 27 | 30 | 0.99 |
| Regular physical activity, % | 27 | 23 | 0.99 |
| MDI therapy, % | 69 | 55 | 0.26 |
| Total daily dose of insulin, units | 47.2 ± 4.8 | 47.4 ± 16.5 | 0.98 |
| Frequency of SMBG/day, n | 4.4 ± 1.3 | 4.1 ± 0.9 | 0.55 |
| HbA1c, mmol/mol | 61.1 ± 10.7 | 63.5 ± 13.9 | 0.46 |
| HbA1c, % | 7.7 ± 1.0 | 8.0 ± 1.2 | 0.44 |
| Gold score | 2.1 ± 0.9 | 2.1 ± 1.0 | 0.52 |
Data are mean ± SD unless otherwise indicated.
DKA, diabetic ketoacidosis; SMBG, self-monitoring of blood glucose.
Table 2.
Baseline glycemic measures (masked CGM period)
| Baseline period (masked CGM) | rtCGM | isCGM | P value | Δ mean (95% CI) |
|---|---|---|---|---|
| All TBR (<3.9 mmol/L), % | 6.4 ± 5.8 | 4.1 ± 4.1 | 0.0844 | 2.31 (−0.3, 4.9) |
| Day (0600–2359 h) TBR (<3.9 mmol/L), % | 5.5 ± 5.6 | 3.6 ± 4.2 | 0.1254 | 1.95 (−0.6, 4.5) |
| Night (0000–0559 h) TBR (<3.9 mmol/L), % | 9.8 ± 10.2 | 5.8 ± 8.0 | 0.0941 | 4.05 (−0.7, 8.8) |
| All TBR (<3.0 mmol/L), % | 1.8 ± 2.4 | 1.0 ± 1.8 | 0.1531 | 0.76 (−0.3, 1.9) |
| Day (0600–2359 h) TBR (<3.0 mmol/L), % | 1.2 ± 1.7 | 0.9 ± 1.7 | 0.2865 | 0.37 (−0.5, 1.3) |
| Night (0000–0559 h) TBR (<3.0 mmol/L), % | 3.7 ± 6.9 | 1.5 ± 3.0 | 0.1176 | 2.16 (−0.6, 4.9) |
| All TIR (3.9–10.0 mmol/L), % | 65.4 ± 14.8 | 61.4 ± 20.6 | 0.2765 | 3.94 (−5.4, 13.3) |
| Day (0600–2359 h) TIR (3.9–10.0 mmol/L), % | 64.8 ± 15.8 | 62.2 ± 19.4 | 0.3394 | 2.59 (−6.6, 11.8) |
| Night (0000–0559 h) TIR (3.9–10.0 mmol/L), % | 67.2 ± 16.5 | 59.2 ± 27.9 | 0.1573 | 8.02 (−3.9, 20.0) |
| All TAR (>10.0 mmol/L), % | 27.4 ± 15.5 | 34.1 ± 21.3 | 0.1523 | −6.64 (−16.3, 3.0) |
| Day (0600–2359 h) TAR (>10.0 mmol/L), % | 29.0 ± 16.9 | 34.2 ± 19.9 | 0.2190 | −5.22 (−14.8, 4.4) |
| Night (0000–0559 h) TAR (>10.0 mmol/L), % | 22.6 ± 15.8 | 34.8 ± 30.7 | 0.0603 | 12.14 (−0.6, 24.9) |
| All TAR (>13.9 mmol/L), % | 9.9 ± 9.9 | 12.0 ± 13.6 | 0.3134 | −2.12 (−8.3, 4.1) |
| Day (0600–2359 h) TAR (>13.9 mmol/L), % | 11.0 ± 11.5 | 11.3 ± 12.3 | 0.3964 | −0.27 (−6.4, 5.9) |
| Night (0000–0559 h) TAR (>13.9 mmol/L), % | 6.1 ± 8.0 | 13.9 ± 19.9 | 0.0520 | −7.83 (−15.8, 0.1) |
| Mean sensor glucose, mmol/L | 8.5 ± 1.6 | 9.0 ± 2.0 | 0.2116 | −0.51 (−1.4, 0.4) |
| SD | 3.4 ± 1.0 | 3.2 ± 1.1 | 0.2499 | 0.25 (−0.3, 0.8) |
| %CV | 39.2 ± 7.7 | 34.8 ± 8.9 | 0.0473 | 0.04 (0.0, 0.1) |
| MAGE | 6.7 ± 2.0 | 6.0 ± 2.3 | 0.1577 | 0.77 (−0.4, 1.9) |
Data are mean ± SD unless otherwise indicated. TAR, time above range.
Primary End Point
The percentage of the time spent in hypoglycemia (<3.9 mmol/L [<70 mg/dL] and <3.0 mmol/L [<54 mg/dL]) was significantly lower for rtCGM participants versus isCGM participants for both the exercise and home phases and in the combined exercise plus home phase analysis (Table 3). The differences in percentage of time spent <3.9 mmol/L (<70 mg/dL) were most notable overnight (0000–0559 h) during the exercise phase (Fig. 2A). The between-group difference in total percentage of time spent <3.0 mmol/L (<54 mg/dL) during the home phase was not significant; however, it was significantly lower in the rtCGM group overnight.
Table 3.
Between-group differences in percentage of time within glucose ranges during exercise and home study periods
| rtCGM | isCGM | P value | Δ mean (95% CI) | |
|---|---|---|---|---|
| Exercise phase | ||||
| All TBR (<3.9 mmol/L), % | 6.8 ± 5.5 | 11.4 ± 8.6 | 0.0180 | −4.64 (−8.4, −0.9) |
| Day (0600–2359 h) TBR (<3.9 mmol/L), % | 6.5 ± 5.5 | 10.5 ± 8.0 | 0.0304 | −3.98 (−7.5, −0.4) |
| Night (0000–0559 h) TBR (<3.9 mmol/L), % | 7.7 ± 11.4 | 20.1 ± 18.0 | 0.0022 | −12.42 (−20.3, −4.6) |
| All TBR (<3.0 mmol/L), % | 1.5 ± 1.7 | 3.5 ± 3.9 | 0.0131 | −2.02 (−3.6, −0.4) |
| Day (0600–2359 h) TBR (<3.0 mmol/L), % | 1.5 ± 2.1 | 3.2 ± 3.9 | 0.0484 | −1.64 (−3.3, 0.0) |
| Night (0000–0559 h) TBR (<3.0 mmol/L), % | 1.1 ± 2.2 | 8.2 ± 9.9 | 0.0002 | −7.11 (−10.9, −3.3) |
| All TIR (3.9–10.0 mmol/L), % | 78.5 ± 10.2 | 69.7 ± 16.0 | 0.0149 | 8.81 (1.8, 15.8) |
| Day (0600–2359 h) TIR (3.9–10.0 mmol/L), % | 77.4 ± 10.6 | 69.9 ± 16.2 | 0.0396 | 7.53 (0.4, 14.6) |
| Night (0000–0559 h) TIR (3.9–10.0 mmol/L), % | 83.8 ± 16.5 | 64.4 ± 20.4 | 0.0001 | 19.43 (9.8, 29.1) |
| All TAR (>10.0 mmol/L), % | 14.7 ± 9.1 | 18.9 ± 17.7 | 0.2073 | −4.12 (−11.5, 3.2) |
| Day (0600–2359 h) TAR (>10.0 mmol/L), % | 16.2 ± 9.1 | 19.7 ± 18.0 | 0.2520 | −3.50 (−11.0, 4.0) |
| Night (0000–0559 h) TAR (>10.0 mmol/L), % | 8.5 ± 12.7 | 15.5 ± 22.3 | 0.1262 | −7.04 (−16.5, 2.4) |
| All TAR (>13.9 mmol/L), % | 3.4 ± 5.2 | 3.8 ± 6.4 | 0.3804 | −0.46 (−3.5, 2.6) |
| Day (0600–2359 h) TAR (>13.9 mmol/L), % | 3.0 ± 4.3 | 4.2 ± 6.3 | 0.2671 | −1.25 (−4.1, 1.6) |
| Night (0000–0559 h) TAR (>13.9 mmol/L), % | 2.2 ± 7.1 | 2.5 ± 9.2 | 0.3931 | −0.36 (−4.6, 3.9) |
| Mean sensor glucose, mmol/L | 7.3 ± 0.8 | 7.3 ± 1.6 | 0.3962 | −0.04 (−0.7, 0.6) |
| SD | 2.6 ± 0.8 | 2.7 ± 0.8 | 0.3770 | −0.07( (−0.5, 0.3) |
| %CV | 35.1 ± 8.0 | 36.0 ± 7.7 | 0.3564 | −0.01 (−0.1, 0.0) |
| MAGE | 5.2 ± 1.5 | 4.8 ± 1.6 | 0.2656 | 0.36 (−0.4, 1.2) |
| Home phase | ||||
| All TBR (<3.9 mmol/L), % | 5.3 ± 2.5 | 7.3 ± 4.4 | 0.0353 | −2.03 (−3.9, −0.2) |
| Day (0600–2359 h) TBR (<3.9 mmol/L), % | 5.1 ± 2.4 | 7.2 ± 4.9 | 0.0418 | −2.08 (−4.1, −0.1) |
| Night (0000–0559 h) TBR (<3.9 mmol/L), % | 4.9 ± 3.3 | 8.9 ± 8.3 | 0.0192 | −3.96 (−7.3, −0.7) |
| All TBR (<3.0 mmol/L), % | 1.3 ± 1.1 | 2.1 ± 2.0 | 0.0557 | −0.82 (−1.7, 0.0) |
| Day (0600–2359 h) TBR (<3.0 mmol/L), % | 1.2 ± 1.0 | 2.0 ± 2.1 | 0.0963 | −0.73 (−1.6, 0.2) |
| Night (0000–0559 h) TBR (<3.0 mmol/L), % | 1.2 ± 1.5 | 4.0 ± 5.4 | 0.0091 | −2.79 (−4.9, −0.7) |
| All TIR (3.9–10.0 mmol/L), % | 75.6 ± 9.7 | 67.4 ± 17.8 | 0.0339 | 8.14 (0.7, 15.6) |
| Day (0600–2359 h) TIR (3.9–10.0 mmol/L), % | 75.0 ± 9.2 | 67.3 ± 16.5 | 0.0312 | 7.71 (0.8, 14.7) |
| Night (0000–0559 h) TIR (3.9–10.0 mmol/L), % | 79.5 ± 10.4 | 63.9 ± 21.4 | 0.0006 | 15.63 (6.8, 24.4) |
| All TAR (>10.0 mmol/L), % | 18.3 ± 8.6 | 25.3 ± 17.6 | 0.0581 | −6.96 (−14.2, 0.3) |
| Day (0600–2359 h) TAR (>10.0 mmol/L), % | 19.5 ± 8.8 | 25.5 ± 17.6 | 0.0962 | −6.00 (−13.3, 1.3) |
| Night (0000–0559 h) TAR (>10.0 mmol/L), % | 15.3 ± 9.9 | 27.2 ± 21.5 | 0.0082 | −11.92 (−20.7, −3.2) |
| All TAR (>13.9 mmol/L), % | 3.5 ± 3.8 | 7.7 ± 9.5 | 0.0296 | −4.19 (−8.0, −0.4) |
| Day (0600–2359 h) TAR (>13.9 mmol/L), % | 3.3 ± 3.5 | 7.2 ± 9.1 | 0.0339 | −3.91 (−7.5, −0.3) |
| Night (0000–0559 h) TAR (>13.9 mmol/L), % | 2.1 ± 2.8 | 8.3 ± 11.5 | 0.0055 | −6.21 (−10.6, −1.8) |
| Mean sensor glucose, mmol/L | 7.7 ± 0.7 | 8.2 ± 1.6 | 0.1080 | −0.52 (−1.2, 0.1) |
| SD | 2.8 ± 0.6 | 3.1 ± 1.0 | 0.1538 | −0.29 (−0.7, 0.1) |
| %CV | 36.2 ± 5.7 | 37.2 ± 7.8 | 0.3365 | −0.01 (−0.1, 0.0) |
| MAGE | 5.1 ± 1.3 | 5.7 ± 1.9 | 0.1374 | −0.61 (−1.5, 0.2) |
| Postrandomization phase (exercise plus home phases) | ||||
| All TBR (<3.9 mmol/L), % | 5.4 ± 2.5 | 8.3 ± 4.8 | 0.0062 | −2.85 (−4.9, −0.8) |
| Day (0600–2359 h) TBR (<3.9 mmol/L), % | 5.6 ± 2.9 | 7.9 ± 5.2 | 0.0384 | −2.31 (−4.5, −0.1) |
| Night (0000–0559 h) TBR (<3.9 mmol/L), % | 5.1 ± 3.3 | 11.0 ± 7.5 | 0.0001 | −5.94 (−9.0, −2.9) |
| All TBR (<3.0 mmol/L), % | 1.3 ± 1.0 | 2.5 ± 2.2 | 0.0107 | −1.18 (−2.1, −0.3) |
| Day (0600–2359 h) TBR (<3.0 mmol/L), % | 1.2 ± 1.0 | 2.2 ± 2.2 | 0.0277 | −1.00 (−1.9, −0.1) |
| Night (0000–0559 h) TBR (<3.0 mmol/L), % | 1.2 ± 1.4 | 4.7 ± 4.8 | 0.0002 | −3.47 (−5.3, −1.6) |
| All TIR (3.9–10.0 mmol/L), % | 76.4 ± 8.7 | 67.9 ± 15.4 | 0.0117 | 8.52 (2.0, 15.1) |
| Day (0600–2359 h) TIR (3.9–10.0 mmol/L), % | 76.2 ± 8.1 | 67.6 ± 15.7 | 0.0111 | 8.56 (2.0, 15.1) |
| Night (0000–0559 h) TIR (3.9–10.0 mmol/L), % | 80.2 ± 9.6 | 64.0 ± 17.8 | 0.0001 | 16.27 (8.8, 23.7) |
| All TAR (>10.0 mmol/L), % | 18.0 ± 8.1 | 25.2 ± 16.7 | 0.0391 | −7.23 (−14.1, −0.4) |
| Day (0600–2359 h) TAR (>10.0 mmol/L), % | 18.2 ± 8.5 | 25.1 ± 16.6 | 0.0489 | −6.90 (−13.8, 0.0) |
| Night (0000–0559 h) TAR (>10.0 mmol/L), % | 14.3 ± 9.5 | 25.1 ± 18.2 | 0.0058 | −10.80 (−18.4, −3.2) |
| All TAR (>13.9 mmol/L), % | 3.4 ± 3.6 | 6.6 ± 7.7 | 0.0465 | −3.19 (−6.3, 0.0) |
| Day (0600–2359 h) TAR (>13.9 mmol/L), % | 3.6 ± 3.7 | 7.1 ± 8.3 | 0.0423 | −3.47 (−6.8, −0.1) |
| Night (0000–0559 h) TAR (>13.9 mmol/L), % | 2.0 ± 2.7 | 7.0 ± 9.2 | 0.0060 | −5.02 (−8.6, −1.5) |
| Mean sensor glucose, mmol/L | 7.6 ± 0.7 | 8.0 ± 1.4 | 0.1926 | −0.34 (−0.9, 0.2) |
| SD | 2.8 ± 0.6 | 3.1 ± 0.9 | 0.1127 | −0.31 (−0.7, 0.1) |
| %CV | 36.1 ± 5.1 | 38.4 ± 8.3 | 0.1764 | −0.02 (−0.1, 0.0) |
| MAGE | 5.1 ± 1.2 | 5.8 ± 1.8 | 0.0973 | −0.67 (−1.5, 0.1) |
Data are mean ± SD unless otherwise indicated. TAR, time above range.
Figure 2.
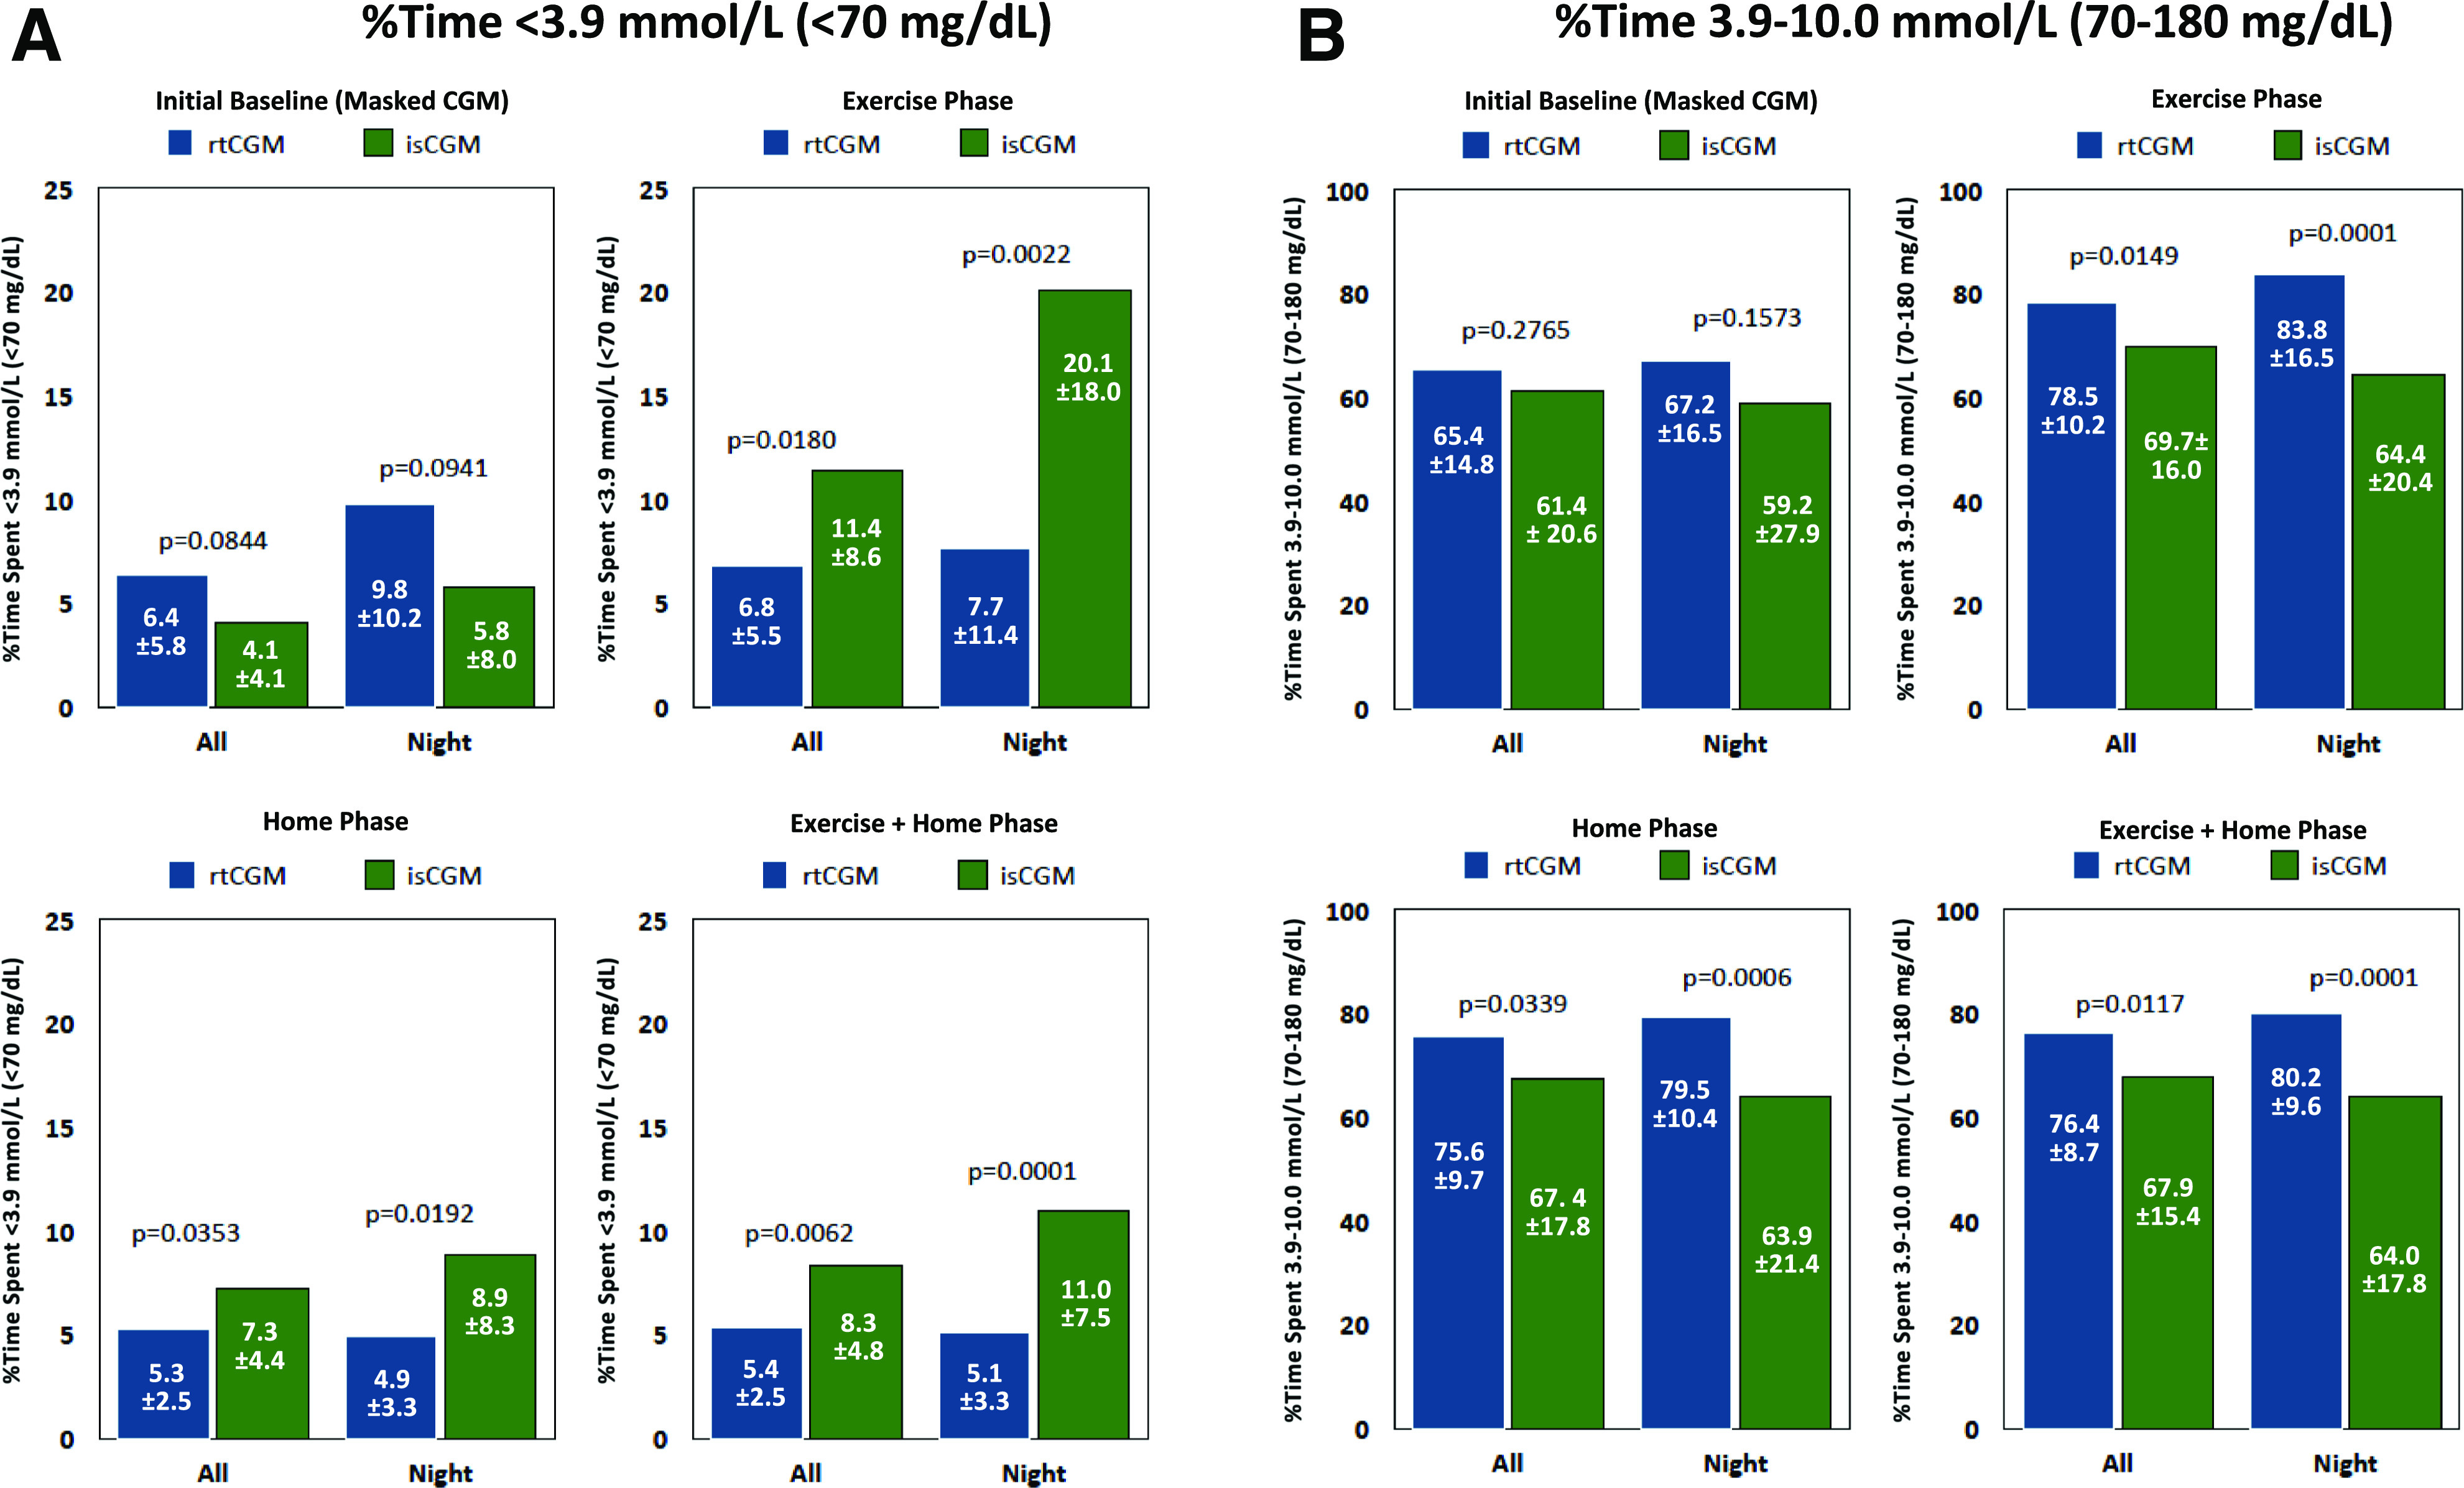
Percentage of time below (A) and within (B) target range. A: Graphs present percentage of TBR within the full 24-h and nighttime (0000–0559 h) periods during baseline (masked CGM), exercise, home, and exercise plus home phases. B: Graphs present percentage of TIR during the same time periods and study phases.
Secondary End Points
Percentage of Time in Target Range
The percentage of time spent in target range (3.9–10.0 mmol/L [70–180 mg/dL)] was significantly higher among rtCGM versus isCGM participants for overall and overnight assessments during the exercise and home phases and combined exercise plus home assessment (Table 3). The differences were most notable in overnight glycemia (Fig. 2B).
Percentage of Time in Hyperglycemic Ranges
No significant between-group differences in percentage of time spent in hyperglycemic ranges (>10.0 mmol/L [>180 mg/dL] and >13.9 mmol/L [>250 mg/dL]) were observed during the exercise phase (Table 3). During the home phase, rtCGM participants experienced a clinically significant advantage in lower overall percentage of time spent in severe hyperglycemia (>13.9 mmol/L [>250 mg/dL]) and a significant advantage during the night in both hyperglycemic ranges.
Changes in Glycemic Outcomes Postrandomization
Across the combined exercise plus home assessment, rtCGM participants experienced a clinically and statistically significant advantage over isCGM participants in both hyperglycemic ranges (Table 3). rtCGM participants experienced notable decreases in percentage of time spent in hypoglycemic ranges (<3.9 mmol/L [<70 mg/dL] and <3.0 mmol/L [<54 mg/dL]) from baseline, whereas worsening in both hypoglycemic ranges was observed among isCGM participants, total and overnight. Similar reductions from baseline in overnight hypoglycemia were also observed in the rtCGM group, whereas isCGM participants showed notable increases. Both study groups showed reductions from baseline in percentage of time spent in the hyperglycemic ranges (>10.0 mmol/L [>180 mg/dL] and >13.9 mmol/L [>250 mg/dL]). Notable reductions from baseline in glycemic variability were observed in rtCGM participants in postrandomization assessments, whereas isCGM participants experienced a slight worsening of glycemic variability throughout the study phases.
During the 6-day postrandomization phase, no significant differences between masked CGM (Medtronic iPro2) and isCGM sensor were observed when measuring the percentage of time <3.9 mmol/L (<70 mg/dL [8.1 ± 8.3% vs. 10.6 ± 8.3%]; P = 0.25).
The number of blood glucose tests per day decreased significantly in the isCGM group (−2.2/day; P < 0.0001) but not in the rtCGM group (−1.1/day; P = 0.922). Within the isCGM group, the average number of scans per day was significantly greater during the exercise phase (31/day) compared with the home phase (12.5/day; P = 0.0002) and postrandomization phase (16/day; P = 0.0031). The average number of threshold alarms (for hypoglycemia and hyperglycemia) per day was 9.1 ± 3.3 in the exercise phase, 7.0 ± 2.1 in the home phase, and 8.1 ± 2.7 in the postrandomization phase.
No significant changes or between-group differences in patient-reported quality of life measures were observed (Supplementary Table 2). No contact dermatitis/allergy or other clinically relevant skin problems were reported. No significant disconnection of CGM system, failure to read, or malfunctions were reported in this trial.
Conclusions
To our knowledge, this is the first prospective, randomized study to compare rtCGM versus isCGM use in adults with T1D and normal awareness of hypoglycemia (Gold score <4) during both exercise and at-home conditions. Our findings showed that rtCGM use was associated with less hypoglycemia (<3.9 mmol/L [<70 mg/dL] and <3.0 mmol/L [<54 mg/dL]) and greater percentage of TIR (3.9–10.0 mmol/L [70–180 mg/dL]) compared with isCGM. The superiority of rtCGM was confirmed by both the percentages of time spent below and within target range during the exercise and home phases, as well as the improvements observed in glycemic measures compared with the baseline phase of masked CGM.
Both TIR and TBR have emerged as important metrics of glycemic control (17,18). The recent international consensus has proposed recommendations that individuals with T1D should strive to achieve <4% below target range (<3.9 mmol/L [<70 mg/dL]), >70% of time within target range (3.9–10.0 mmol/L [70–180 mg/dL]), and <25% above the range (>10.0 mmol/L [180 mg/dL]), with glycemic variability (%CV) ≤36% (18). As demonstrated in our study, rtCGM use was associated with 6.8% time below target range during physical activity and 5.3% throughout the home phase, whereas the percentage of TBR among isCGM users remained significantly greater during exercise (11.4%) and in the home phase (7.3%) (Table 2). During these study phases, rtCGM users maintained TIR well within the recommended target percentages (78.5% and 75.6%, respectively) (17,18). These increases were significant compared with the baseline phase of masked CGM.
Importantly, the significant improvements with rtCGM were seen using only the basic alarm settings, which further reinforces the importance of rtCGM alarms in preventing hypoglycemia and hyperglycemia as well as maintaining time spent within the target range. Moreover, given the advanced alert/alarm features of the study rtCGM device and other rtCGM systems (e.g., predictive alerts), it is likely that use of these predictive alerts would have resulted in even greater glycemic improvements.
The reductions in TBR with isCGM use observed in our study were similar to results reported in the recent IMPACT study, which showed a reduction from 14.51% at baseline to 8.5% after 6 months’ use (9). However, the IHART-CGM study (11), which compared use of rtCGM versus isCGM in adults with T1D with impaired hypoglycemia awareness, showed virtually no reduction in TBR with isCGM use (from 11.9% at baseline to 11.0% at 8 weeks), whereas rtCGM (Dexcom G5; Dexcom, Inc., San Diego, CA) users reduced their TBR from 8.8% to 6.2% (11). An extension of the study (to 16 weeks) showed a significant reduction in TBR among previous isCGM users who switched to rtCGM (from 11.0% to 3.9%) (12). However, no difference in hyperglycemia was observed between two study groups. In contrast with the IHART-CGM study, our study showed that rtCGM was superior to isCGM, not only in hypoglycemia but also in hyperglycemia (>10.0 mmol/L [>180 mg/dL] and >13.9 mmol/L [>250 mg/dL]) during postrandomization.
A key strength of the study was use of a control CGM device (iPro2), which allowed us to eliminate the potential confounding of results due to differences in measurement accuracy of the two study devices. As reported, our analysis showed slight but insignificant differences between the isCGM and iPro2 measurements. Another strength was the size and demographic composition of our cohort compared with the earlier head-to-head reports by Reddy et al. (11,12), which compared the impact of isCGM versus rtCGM use in 40 adults with T1D with problematic hypoglycemia. Our study randomized 60 adults with T1D with normal hypoglycemia awareness, which represents ∼50–60% of the population with T1D (19).
A limitation of our study was use of WHOQOL-BREF to assess changes in quality of life, as it is not specific to diabetes and thus does not cover elements such as diabetes distress and hypoglycemia confidence (15). Therefore, it was not surprising to see no significant changes or between-group differences in the WHOQOL-BREF scores. However, Polonsky et al. (20) recently reported that CGM use contributes to significant improvements in these diabetes-specific measures. Another study limitation is its short duration. Although originally planned as a 6-month follow-up with crossover design, the isCGM sensors were available only on prescription and not on the open market at the time; even now, it is not easy to buy significant numbers of isCGM sensors for research purposes. However, despite these limitations, the superiority of rtCGM over isCGM is clearly evident and is in concordance with the trials by Reddy et al. (11,12).
In conclusion, use of rtCGM in adults with T1D and normal hypoglycemia awareness was superior to isCGM in reducing incidence of hypoglycemia and increasing the time spent within the target range. Importantly, our findings provide guidance to clinicians when discussing monitoring options with their patients.
Article Information
Funding. This study was initiated, designed, and performed by the investigators and supported by Agency for Healthcare Research (AZV) of the Czech Republic grant 15-26705A (program RVO-VFN00064165) and by the Research Project of Charles University (Progres Q25).
Duality of Interest. L.R. has received speaker honoraria from Boehringer Ingelheim, Eli Lilly and Company, and Novo Nordisk. L.P. has received speaker honoraria and has consulted for Medtronic, Inc. and Dexcom, Inc. C.G.P. has received consulting fees from Abbott Diabetes Care, Dexcom, Inc., Diasome, Onduo, Proteus Inc., Novo Nordisk, and Roche Diabetes Care. G.G. has received speaker honoraria from AstraZeneca, Boehringer Ingelheim, Eli Lilly and Company, Novo Nordisk, and Sanofi and has received research funding from Medtronic, Inc. M.M. has received speaker honoraria from Eli Lilly and Company and Novo Nordisk. M.P. has received speaker honoraria and has consulted for Abbott, AstraZeneca, Boehringer Ingelheim, Dexcom, Inc., Eli Lilly and Company, Novartis, Novo Nordisk, Medtronic, Inc., Sanofi, Takeda Pharmaceutical Company, and Roche. J.Š. has received speaker honoraria and consulted for Abbott, Dexcom, Inc., Eli Lilly and Company, Medtronic, Inc., Novo Nordisk, and Roche.
Author Contributions. J.Š. was responsible for the protocol design. A.H., L.R., L.P., C.G.P., G.G., E.H., M.P., and J.Š. wrote and revised the manuscript. A.H., L.R., E.H., V.N., O.K., M.M., M.P., and J.Š. were responsible for study implementation and administration. A.H., L.R., L.P., C.G.P., E.H., and J.Š. reviewed the data. J.Š. is the guarantor of this work and, as such, had full access to all of the data in the study and takes responsibility for the integrity of the data and the accuracy of the data analysis.
Prior Presentation. Parts of this work were presented at the 80th Scientific Sessions of the American Diabetes Association, 12–16 June 2020.
Footnotes
Clinical trial reg. no. NCT04358263, clinicaltrials.gov
This article contains supplementary material online at https://doi.org/10.2337/figshare.12767927.
References
- 1.Cryer PE. Hypoglycemia: still the limiting factor in the glycemic management of diabetes. Endocr Pract 2008;14:750–756 [DOI] [PubMed] [Google Scholar]
- 2.Zinman B, Murray FT, Vranic M, et al. Glucoregulation during moderate exercise in insulin treated diabetics. J Clin Endocrinol Metab 1977;45:641–652 [DOI] [PubMed] [Google Scholar]
- 3.Moser O, Tschakert G, Mueller A, et al. Effects of high-intensity interval exercise versus moderate continuous exercise on glucose homeostasis and hormone response in patients with type 1 diabetes mellitus using novel ultra-long-acting insulin. PLoS One 2015;10:e0136489. [DOI] [PMC free article] [PubMed] [Google Scholar]
- 4.Younk LM, Mikeladze M, Tate D, Davis SN. Exercise-related hypoglycemia in diabetes mellitus. Expert Rev Endocrinol Metab 2011;6:93–108 [DOI] [PMC free article] [PubMed] [Google Scholar]
- 5.Beck RW, Riddlesworth T, Ruedy K, et al.; DIAMOND Study Group . Effect of continuous glucose monitoring on glycemic control in adults with type 1 diabetes using insulin injections: the DIAMOND randomized clinical trial. JAMA 2017;317:371–378 [DOI] [PubMed] [Google Scholar]
- 6.Heinemann L, Guido Freckmann G, Gabriele Faber-Heinemann G, et al. Real-time continuous glucose monitoring in adults with type 1 diabetes and impaired hypoglycaemia awareness or severe hypoglycaemia treated with multiple daily insulin injections (HypoDE): a multicentre, randomised controlled trial. Lancet 2018;391:1367–1377 [DOI] [PubMed] [Google Scholar]
- 7.Šoupal J, Petruželková L, Flekač M, et al. Comparison of different treatment modalities for type 1 diabetes, including sensor-augmented insulin regimens, in 52 weeks of follow-up: a COMISAIR study. Diabetes Technol Ther 2016;18:532–538 [DOI] [PMC free article] [PubMed] [Google Scholar]
- 8.Šoupal J, Petruželková L, Grunberger G, et al. Glycemic outcomes in adults with T1D are impacted more by continuous glucose monitoring than by insulin delivery method: 3 years of follow-up from the COMISAIR Study. Diabetes Care 2020;43:37–43 [DOI] [PubMed] [Google Scholar]
- 9.Bolinder J, Antuna R, Geelhoed-Duijvestijn P, Kröger J, Weitgasser R. Novel glucose-sensing technology and hypoglycaemia in type 1 diabetes: a multicentre, non-masked, randomised controlled trial. Lancet 2016;388:2254–2263 [DOI] [PubMed] [Google Scholar]
- 10.Oskarsson P, Antuna R, Geelhoed-Duijvestijn P, Krӧger J, Weitgasser R, Bolinder J. Impact of flash glucose monitoring on hypoglycaemia in adults with type 1 diabetes managed with multiple daily injection therapy: a pre-specified subgroup analysis of the IMPACT randomised controlled trial. Diabetologia 2018;61:539–550 [DOI] [PMC free article] [PubMed] [Google Scholar]
- 11.Reddy M, Jugnee N, El Laboudi A, Spanudakis E, Anantharaja S, Oliver N. A randomized controlled pilot study of continuous glucose monitoring and flash glucose monitoring in people with type 1 diabetes and impaired awareness of hypoglycaemia. Diabet Med 2018;35:483–490 [DOI] [PMC free article] [PubMed] [Google Scholar]
- 12.Reddy M, Jugnee N, Anantharaja S, Oliver N. Switching from flash glucose monitoring to continuous glucose monitoring on hypoglycemia in adults with type 1 diabetes at high hypoglycemia risk: the extension phase of the I HART CGM study. Diabetes Technol Ther 2018;20:751–757 [DOI] [PMC free article] [PubMed] [Google Scholar]
- 13.World Medical Association Declaration of Helsinki Recommendations guiding physicians in biomedical research involving human subjects. JAMA 1997;277:925–926 [PubMed] [Google Scholar]
- 14.Gold AE, MacLeod KM, Frier BM. Frequency of severe hypoglycemia in patients with type I diabetes with impaired awareness of hypoglycemia. Diabetes Care 1994;17:697–703 [DOI] [PubMed] [Google Scholar]
- 15.The WHOQOL Group Development of the World Health Organization WHOQOL-BREF quality of life assessment. Psychol Med 1998;28:551–558 [DOI] [PubMed] [Google Scholar]
- 16.Lind M, Polonsky W, Hirsch IB, et al. Continuous glucose monitoring vs conventional therapy for glycemic control in adults with type 1 diabetes treated with multiple daily insulin injections: the GOLD randomized clinical trial. JAMA 2017;317:379–387 [DOI] [PubMed] [Google Scholar]
- 17.Danne T, Nimri R, Battelino T, et al. International consensus on use of continuous glucose monitoring. Diabetes Care 2017;40:1631–1640 [DOI] [PMC free article] [PubMed] [Google Scholar]
- 18.Battelino T, Danne T, Bergenstal RM, et al. Clinical targets for continuous glucose monitoring data interpretation: recommendations from the international consensus on time in range. Diabetes Care 2019;42:1593–1603 [DOI] [PMC free article] [PubMed] [Google Scholar]
- 19.Lamounier RN, Geloneze B, Leite SO, et al.; HAT Brazil study group . Hypoglycemia incidence and awareness among insulin-treated patients with diabetes: the HAT study in Brazil. Diabetol Metab Syndr 2018;10:83. [DOI] [PMC free article] [PubMed] [Google Scholar]
- 20.Polonsky WH, Hessler D, Ruedy KJ, Beck RW; DIAMOND Study Group . The impact of continuous glucose monitoring on markers of quality of life in adults with type 1 diabetes: further findings from the DIAMOND randomized clinical trial. Diabetes Care 2017;40:736–741 [DOI] [PubMed] [Google Scholar]