Figure 3.
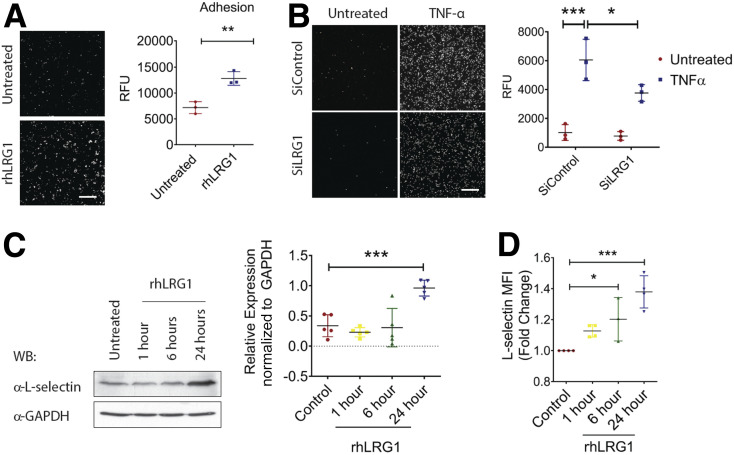
LRG1 mediates neutrophil adhesion. A: Representative images (left) and quantification (right) of neutrophil adhesion assay demonstrated rhLRG1 induced dH60 cell (labeled with CMFDA dye) adhesion to HDMECs. Scale bar: 200 μm. B: Representative images (left) and quantification (right) of TNFα-induced neutrophil adhesion by use of hHL-60 cells (labeled with CMFDA dye) subjected to siRNA-mediated LRG1 knockdown. Scale bar: 200 μm. C: Representative Western blot (left) and densitometry analysis (right) of L-selectin and GAPDH in rhLRG1-treated dHL-60 cells at different time points. D: Quantification of flow cytometry demonstrated an increase in L-selectinHigh population following rhLRG1treatment. All images are representative; data are presented as the mean (95% CI; P) of n ≥ 3 independent experiments per group. Significance was determined by one- or two-way ANOVA followed by Tukey multiple comparisons test or unpaired, two-tailed Student t test. *P < 0.05, **P < 0.01, ***P < 0.001. WB, Western blot.

