

Abstract
Aims
We investigated the effect of gadopiclenol, a new gadolinium‐based contrast agent, on the QTc interval at clinical and supraclinical dose, considering the relative hyperosmolarity of this product.
Methods
This was a single centre, randomized, double‐blind, placebo‐ and positive‐controlled, 4‐way crossover study. Forty‐eight healthy male and female subjects were included to receive single intravenous (i.v.) administrations of gadopiclenol at the clinical dose of 0.1 mmol kg−1, standard for current gadolinium‐based contrast agents, the supraclinical dose of 0.3 mmol kg−1, placebo and a single oral dose of 400 mg moxifloxacin.
Results
The largest time‐matched placebo‐corrected, mean change from‐baseline in QTcF (ΔΔQTcF) was observed 3 hours after administration of 0.1 mmol kg−1 gadopiclenol (2.39 ms, 90% confidence interval [CI]: 0.35, 4.43 ms) and 5 minutes after administration of 0.3 mmol kg−1 (4.81 ms, 90%CI: 2.84, 6.78 ms). The upper limit of the 90% CI was under the threshold of 10 ms, demonstrating no significant effect of gadopiclenol on QTc interval. From 1.5 to 4 hours postdose moxifloxacin, the lower limit of the 90% CI of ΔΔQTcF exceeded 5 ms demonstrating assay sensitivity. Although there was a positive slope, the concentration–response analysis estimated that the values of ΔΔQTcF at the maximal concentration of gadopiclenol at 0.1 and 0.3 mmol kg−1 were 0.41 and 2.23 ms, respectively, with the upper limit of the 90% CI not exceeding 10 ms. No serious or severe adverse events or treatment discontinuations due to adverse events were reported.
Conclusion
This thorough QT/QTc study demonstrated that gadopiclenol did not prolong the QT interval at clinical and supraclinical doses and was well tolerated in healthy volunteers. The positive slope of the QTc prolongation vs concentration relationship suggests that hyperosmolarity could be associated with QTc prolongation. However, the amplitude of this effects is unlikely to be associated with proarrhythmia.
Keywords: gadopiclenol, healthy subjects, osmolarity, QTc interval, thorough QT study
What is already known about this subject
Gadopiclenol is a gadolinium‐based contrast agent in clinical development.
Hyperosmolarity is associated with a reduction of hERG (KCNH2) current and only 1 thorough QT study has been reported with gadolinium‐based contrast agents.
What this study adds
This study demonstrated that intravenous administration of gadopiclenol at clinical and supraclinical doses does not prolong the QTc interval. There was no difference in the occurrence of adverse events or other safety parameters between gadopiclenol and placebo, supporting the overall good safety profile of gadopiclenol.
The study supports the view that hyperosmolarity of gadolinium‐based contrast agents is not associated with clinically significant prolongation of ventricular repolarization.
However, since there was a positive relationship between QTc prolongation and gadopiclenol concentration, it cannot be excluded that contrast agents of greater osmolarity could be associated with clinically significant QTc prolongation.
1. INTRODUCTION
Magnetic resonance imaging (MRI) is a widely used technique in the diagnosis of a large number of pathologies but most notably in the field of oncology. It has allowed more accurate tumour detection, characterization and staging. 1 Often, contrast agents are used to improve the MRI. 1 , 2 These agents most typically contain the paramagnetic gadolinium ion in a chelated form to avoid its potential toxicity. Two types of chelates, linear and macrocyclic, have been approved by regulatory authorities. Linear chelates are less stable than macrocyclic chelates, and thus more prone to release gadolinium within the body.
The pharmacokinetics of the marketed gadolinium‐based contrast agents (GBCAs), which are administered intravenously (i.v.), is very similar in that they distribute only in the extracellular space, are excreted via the kidneys and have a half‐life of 1–2 hours. 3 , 4 In patients with severe renal impairment, administration of GBCAs, mainly if not exclusively the linear chelates, has been associated with the development of nephrogenic systemic fibrosis, probably due to accumulation of dissociated gadolinium in tissues. 5 , 6 In recent years, it has become increasingly clear that with linear GBCAs, gadolinium deposits can also be found in bone and other tissues including brain in patients with normal kidney function and an intact blood brain barrier exposed to multiple cumulative doses. Although clinical data on the potential toxicity of these gadolinium deposits are sparse, 7 , 8 , 9 , 10 linear GBCAs have been suspended in Europe (apart from gadobenic acid and gadoxetate disodium restricted to liver MRI) while macrocyclic GBCAs are still fully authorized due to their favourable benefit–risk balance. Therefore, safety of new GBCAs must be ascertained.
Gadopiclenol is a new macrocyclic GBCA in clinical development. As part of the development of a compound, cardiac safety needs to be assessed in preclinical models and clinical studies. Gadopiclenol induced a concentration‐dependent inhibition of hERG tail current amplitude (data on file) but this effect was considered to be nonspecific and due to the hyperosmolarity of the tested solutions and to the relatively high molecular weight (970.1 g/mol) of gadopiclenol. Hyperosmolarity has been shown to inhibit hERG current 11 and to transiently increase dispersion of refractoriness following intracoronary infusions of contrast agents. 12 Gadopiclenol had no effect on the action potential of rabbit Purkinje fibres nor did it prolong the QTc interval in vivo in conscious dogs (Guerbet, data on file). Further, no cardiac events were reported in the first‐in‐human study 13 and in a dose–response phase IIb study. 14
In the present study, the QT/QTc interval prolongation of gadopiclenol was investigated in a dedicated thorough QTc study, which was performed according to the ICH E14 guideline. 15
2. METHODS
The study was performed in compliance with the principles of the Declaration of Helsinki and Good Clinical Practice. The study was registered with ClinicalTrials.gov (ref: NCT03657264). The protocol, its amendments and any other written information provided to subjects were approved by an independent Ethics Committee (ZNA/OCMW Antwerp, Belgium). The study was performed in a single centre (SGS Clinical Pharmacology Unit, Antwerp, Belgium) and only started after approval of the competent national health authority was received. Written informed consent was obtained from all subjects prior to any study‐related assessment taking place.
2.1. Subjects
Eligibility of the 48 subjects who participated in the study was assessed at the screening visit, which took place within 4 weeks prior to first study treatment administration. Subjects were included if they were healthy, male or female aged between 18 and 60 years, with a body mass index between 19 and 28 kg/m2 and weighing at least 40 (females) or 50 (males) kg and no more than 100 kg. Subjects could not participate in case of a history or family history of inherited or acquired long QT syndrome or risk factors for Torsade de Pointe, unexplained loss of consciousness or convulsion or any history of clinically significant bradycardia, cardiac impairment due to decreasing left ventricular ejection fraction, or arrhythmia (including Wolf–Parkinson–White syndrome). Noncardiac exclusion criteria included smoking more than 10 cigarettes per day, any history of severe allergy or allergic disease, treatment with any concomitant medications, which could induce QT prolongation and administration of any contrast agent within 2 weeks before inclusion or scheduled to receive any contrast agent within 3 months after the last investigational medicinal product administration.
2.2. Study design
This single‐centre study was conducted according to a randomised, 4‐way crossover, double‐blind placebo‐controlled and open‐label positive‐controlled (moxifloxacin) design. Each subject was randomised to 1 of 4 sequences of the 4 study treatments according to a Williams's design, 16 which was balanced for first order carry‐over effect. The 4 study treatments were: bolus i.v. placebo (0.9% NaCl), bolus i.v. gadopiclenol at the dose of 0.1 mmol kg−1, standard dose for most currently approved GBCAs, bolus i.v. gadopiclenol at the supraclinical dose of 0.3 mmol kg−1 and oral 400 mg moxifloxacin. The supraclinical dose was set at 0.3 mmol kg−1, which is a dose still used for some approved GBCAs for limited applications. Starting at time 0, gadopiclenol was administered at a rate of 2 mL/s with a total volume of 11–58 mL, i.e. in 5.5–29 seconds, depending on volunteer's body weight and gadopiclenol dose administered.
Each treatment period lasted 72 hours, resulting in a total study duration of 12 days for each participant, during which the subjects remained confined in the clinical trial unit. One and 3 months after last study drug administration, subjects had to return to the clinical trial unit to assess the long‐term elimination of gadopiclenol.
2.3. Electrocardiography recordings
During each treatment period, 12‐lead Holter electrocardiography (ECG) monitoring using a Mortara H12 + (Milwaukee, WI, USA) was performed from 1 hour before each administration (baseline) and up to 24 hours postadministration. Triplicate ECGs were extracted from the recordings using a dedicated software (Antares, AMPS, Montichiari, Italy) at the following time points for gadopiclenol and placebo: predose and then 5, 10, 20 and 30 minutes, and 1, 1.5, 2, 3, 4, 8 and 24 hours postdose. For moxifloxacin, the time points were: predose and then 30 minutes and 1, 1.5, 2, 3 and 4 hours postdose.
Using a computerized measurement system, callipers were placed on the recording based upon the global waveforms from all 12‐leads. A qualified cardiologist not otherwise involved in the study and blinded to treatment then adjudicated the placement of the callipers on the ECG tracing and performed adjustments if warranted. They also noted any significant morphological abnormality on the tracing. All tracings from a given subject were measured by the same observer.
QT values were corrected for heart rate using Fridericia's and Bazett's formulae and plots were created of QTc vs RR intervals of baseline and placebo data. The correction according to Fridericia showed a horizontal regression line for the relationship between QTc and RR whereas that for Bazett's correction (QTcB) deviated significantly from horizontal. This indicated that the Fridericia formulae was the appropriate correction for QT in the current study.
2.4. Statistical analysis of ECG data
The primary endpoint was defined as the largest time‐matched placebo‐corrected, mean change‐from‐baseline QTcF (ΔΔQTcF) in ms of the 2 gadopiclenol doses. The null hypothesis was that the mean change from baseline in QTcF difference between each of the 2 doses of gadopiclenol and placebo was greater or equal to the noninferiority margin for at least 1 time point. An intersection–union test was performed at a 1‐sided 5% significance level. This is equivalent to compare the upper limit of the 2‐sided 90% confidence interval (CI) of the difference between each of the 2 doses of gadopiclenol and placebo with the noninferiority margin of 10 ms at each time point. The primary analysis was performed using an analysis of covariance model for crossover data with baseline data as covariate, sequence, period, trial drug and sex as fixed effects and subject as a random effect. Differences with placebo between means were tested through the model for each time point and for the 2 doses of gadopiclenol using the Student t‐test. For each time point, the 2‐sided 90% CIs of the difference between each of the 2 doses of gadopiclenol and placebo were calculated for testing the hypotheses. The primary analysis was conducted on subjects who had no major protocol deviations, defined as having an impact on the primary endpoint (per protocol set). As a supportive analysis, the primary analysis was repeated including all randomized subjects who received at least 1 study product (safety set).
Assay sensitivity assessment was defined as the largest time‐matched placebo‐corrected change from‐baseline mean effect of moxifloxacin on QTcF. To validate the assay sensitivity of the trial, the positive control had to increase the ΔΔQTcF by at least 5 ms for at least 1 time point. To account for multiple time points, the overall Type I error rate was adjusted according to Hochberg and Tamhane. 17
Considering an expected intravariability for ΔQTcF of 9 ms and an expected difference of 2 ms between gadopiclenol and placebo, a sample size of 40 subjects was sufficient to demonstrate noninferiority with a noninferiority margin of 10 ms, a power of 85% and a 1‐sided Type I error of 5%. This sample size was also sufficient to detect a difference of 5 ms (with an expected difference of 12 ms for at least 1 time point and an expected intravariability for ΔQTcF of 9 ms) between moxifloxacin and placebo with a power of 85%. To account for potential dropouts and/or unevaluable data points, 48 subjects were included in the study.
Categorical analyses were performed to determine the number of subjects for each treatment who had values for QTcF >450, >480 ms and >500 ms and/or changes from baseline in QTcF >30 and >60 ms.
2.5. Plasma gadopiclenol concentrations
Blood samples for the measurement of gadopiclenol concentration were drawn from predose to 24 hours postdose in each period except in the period in which moxifloxacin was administered. The time points of blood samplings coincided with those at which ECGs were extracted from the Holter recording.
The concentrations of gadopiclenol in plasma were determined using liquid chromatography methods with tandem mass spectrometry detection. The analytical methods were validated as per Food and Drug Administration and European Medicines Agency guidance documents. 18 , 19 The assays were linear in the concentration range 5–2500 μg mL−1 and the limit of quantification was 5.0 μg mL−1. The performance of the method was monitored using quality control samples at concentrations of 15, 1250 and 2000 μg mL−1. At these concentrations, precision (%CV) was ≤4.28% whereas bias varied from 1.44 to 2.59% in plasma.
The plasma concentration data of gadopiclenol were subjected to descriptive statistics and were graphically displayed. No pharmacokinetic analysis was performed.
2.6. Concentration–response analysis
A concentration–response relationship was investigated between ΔΔQTcF and gadopiclenol concentrations using a mixed linear model with baseline‐corrected QTcF as the dependent variable. 20 Placebo data were included in the analysis with concentration values set to 0 and gadopiclenol concentrations below the limit of quantification were also set to 0. The fixed effect parameters of the prespecified model were intercept, slope for gadopiclenol concentrations, influence of baseline on intercept, study treatment (gadopiclenol or placebo) specific intercept and theoretical time points postadministration. Subject specific random effects were added on intercept and slope parameters with an unstructured covariance matrix.
The parameters estimated from the selected model are presented with their standard error and 95% CI. The predicted placebo‐ and baseline‐corrected QTcF for each dose level is presented with its 2‐sided 90% CI and the model is graphically presented by a regression line over the concentration range collected during the study together with its 90% confidence region. The appropriateness of the chosen linear model was checked by inspecting the standard goodness‐of‐fit plots.
2.7. Safety assessments
The safety and tolerability of gadopiclenol, as compared to baseline and placebo, was assessed by recording of adverse events (AEs), vital signs (blood pressure and pulse rate) measurements, ECG recording, clinical laboratory assessments and monitoring of injection site tolerance. AEs were recorded throughout the study, vital signs were recorded at screening and predose up to 24 hours postdose at the same time points as Holter ECGs, 12‐lead safety ECGs were done in triplicate within 1 hour before each study treatment administration and 10 minutes and 3 hours post administration, and blood samples for clinical laboratory assessments were drawn at screening and on Day 1 and 2 of each treatment period.
Injection‐site tolerance (burning, pain, eruption, extravasation, inflammation or other) was assessed over 1 day following each injection (during the injection, up to 30 ± 5 min and the day after injection) and over a longer period if the investigator became aware of any related adverse event. In case of injection‐site pain, the subject was asked to specify the level of pain using a visual analogue scale.
3. RESULTS
3.1. Subject disposition and demographics
In this study, 48 subjects were randomised, all received the 4 study treatments and completed the study. Due to the occurrence of extravasation during the injection of placebo, 1 subject was excluded from the per protocol set. Therefore, 48 and 47 subjects were included in the safety and per protocol sets, respectively.
Half of the enrolled subjects were male and half female and except 1 Asian subject all were Caucasian. A summary of the demographics of the safety set is provided in Table 1.
TABLE 1.
Summary of demographic characteristics
| All subjects | ||
|---|---|---|
| Age (y) | Mean (SD) | 40.5 (11.6) |
| Range | 19–59 | |
| Males/females (n) | 24/24 | |
| Race (n, %) | Asian | 1 (2.1%) |
| Caucasian | 47 (97.9%) | |
| Weight (kg) | Mean (SD) | 75.3 (8.5) |
| Range | 58–97 | |
| Height (cm) | Mean (SD) | 173.5 (8.5) |
| Range | 154–190 | |
| Body mass index (kg m−2) | Mean (SD) | 25.0 (2.2) |
| Range | 19.8–28.2 |
SD, standard deviation.
3.2. Effect of gadopiclenol on QTcF and HR, assay sensitivity and categorical analysis
Baseline QTc of each study period was not significantly different and there was no period effect. Baseline‐corrected least‐square mean differences between gadopiclenol and placebo and between moxifloxacin and placebo vs time after administration are shown in Figure 1. Following i.v. injection of 0.1 mmol kg−1 of gadopiclenol, at none of the tested time points did the upper limit of the 90% CI of ΔΔQTcF exceed 10 ms, indicating the absence of an effect of gadopiclenol on QTcF. The largest time‐matched placebo‐corrected change from baseline was recorded 3 hours postdose and was 2.39 ms (90% CI: 0.35, 4.43). A similar result was obtained with the supraclinical dose of 0.3 mmol kg−1 with a maximum observed ΔΔQTcF of 4.81 ms (90% CI: 2.84, 6.78) occurring at 5 minutes after i.v. injection. This increase in ΔΔQTcF was short‐lasting and had disappeared 20 minutes after administration (ΔΔQTcF = 0.20 ms [90% CI: −1.71, 2.12]).
FIGURE 1.
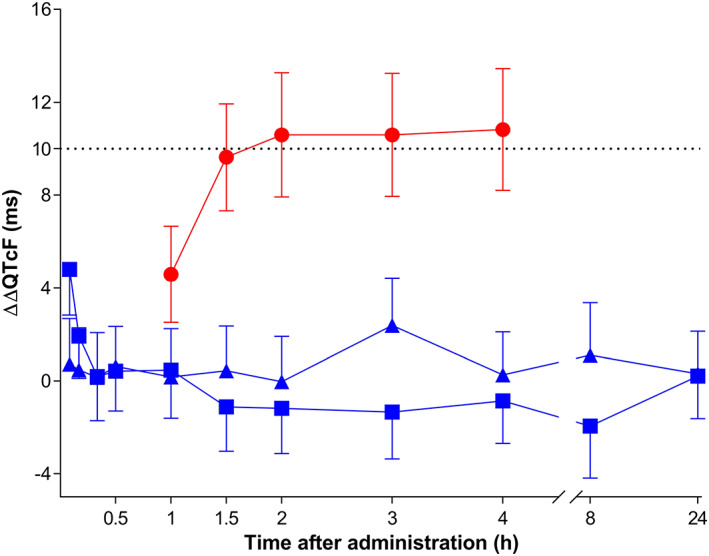
Time‐matched, placebo‐corrected change from baseline in QTcF (ΔΔQTcF). Data are presented as time‐matched least square differences between study drugs and placebo and their corresponding 90% confidence interval. ▲‐▲, 0.1 mmol kg−1 i.v. gadopiclenol, ■‐■, 0.3 mmol kg−1 i.v. gadopiclenol, ●‐●, 400 mg oral moxifloxacin. The threshold of 10 ms is shown as a dotted horizontal line
Figure 1 also shows a plot of ΔΔQTcF vs time following administration of 400 mg moxifloxacin. A relevant (90% CI lower limit > regulatory threshold of 5 ms) increase in ΔΔQTcF was first observed 1.5 hours after moxifloxacin administration and lasted up to 4 hours after administration, with a maximum of 10.83 ms (90% CI: 8.21, 13.46) 4 hours post administration. This result demonstrates adequate assay sensitivity of the study.
No QTcF values exceeding 450 ms and no increases from baseline >30 ms were recorded. No effect on heart rate was observed for any of the study treatments. The mean maximal placebo‐corrected changes from baseline for gadopiclenol‐ and moxifloxacin‐treated subjects were 1.63 beats min−1 (90% CI: −0.14, 3.41) for the 0.1 mmol kg−1 group, 2.55 beats min−1 (90% CI: 0.77, 4.34) for the 0.3 mmol kg−1 group and 1.71 beats min−1 (90% CI: 0.43, 2.98) in the moxifloxacin group. There was also no significant change in systolic or diastolic blood pressure.
3.3. Plasma gadopiclenol concentrations
Following i.v. administration gadopiclenol, concentrations rapidly declined (Figure 2) and at time point 24 hours, all gadopiclenol concentrations were below the limit of quantification. At 1 and 3 months after last study drug administration, the gadopiclenol plasma concentrations were below the limit of quantification in all subjects.
FIGURE 2.
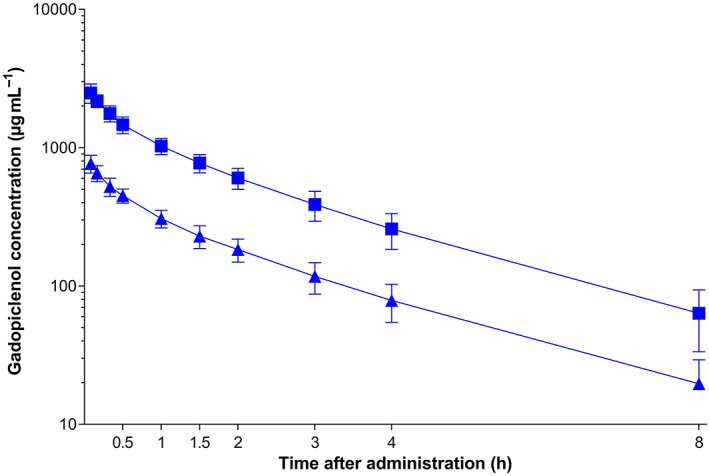
Plasma concentration–time profiles of gadopiclenol. Data are presented as arithmetic mean ± standard deviation. ▲‐▲, 0.1 mmol kg−1 i.v. gadopiclenol, ■‐■, 0.3 mmol kg−1 i.v. gadopiclenol
3.4. Concentration–response analysis
The concentration–response analysis indicated that there was a relationship between ΔΔQTcF and gadopiclenol plasma concentration in that with increasing concentration there was an increase in ΔQTcF. The final model parameters are summarized in Table 2. A graphical illustration of the model‐predicted linear relationship between gadopiclenol concentration and ΔΔQTcF is provided in Figure 3. At the geometric mean Cmax of gadopiclenol, the model‐predicted effect on ΔΔQTcF was 0.41 ms (90% CI: −0.08, 0.90) at a dose of 0.1 mmol kg−1 and 2.23 ms (90% CI: 1.19, 3.26) at the supraclinical dose of 0.3 mmol kg−1.
TABLE 2.
Model parameters of final concentration–response model
| Parameter estimate (SE) | 95% CI | |
|---|---|---|
| Intercept (placebo) (ms) | −2.88 (1.07) | −5.04 to −0.72 |
| Slope (ms per μg mL−1) | 0.0011 (0.0003) | 0.0005 to 0.0016 |
| Baseline covariate (ms) | −0.40 (0.03) | −0.47 to −0.33 |
| Gadopiclenol specific intercept (ms) | −0.40 (0.35) | −1.09 to 0.30 |
SE, standard error.
FIGURE 3.
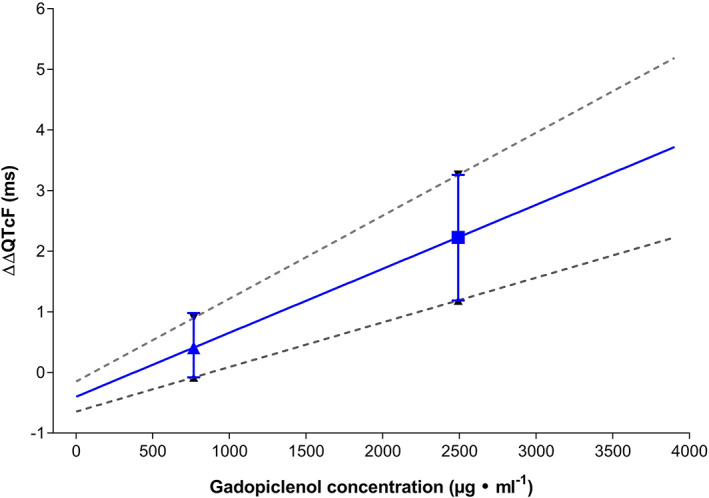
Model‐predicted effect of gadopiclenol on baseline‐ and placebo‐corrected QTcF (ΔΔQTcF) over a concentration range of 0–4000 μg mL−1. The ΔΔQTcF at the doses of 0.1 mmol kg−1 (▲) and 0.3 mmol kg−1 (■) are shown with their respective 90% confidence interval. The lines represent the model‐predicted linear relationship between concentration and effect on ΔΔQTcF and the lower and upper 90% confidence interval
3.5. Safety and tolerability
There were no serious AEs, AEs of severe intensity or AEs that led to premature study withdrawals. A total of 116 treatment emergent AEs were reported in 41 subjects (85.4%): 25 subjects (52.1%) with gadopiclenol 0.1 mmol kg−1, 22 subjects (45.8%) with gadopiclenol 0.3 mmol kg−1, 16 subjects (33.3%) with moxifloxacin and 22 subjects (45.8%) with placebo. A summary of all AEs including those considered not related to study treatments is provided in Table 3. Most AEs (108) were of mild intensity and 8 were moderate (1 with gadopiclenol 0.1 mmol kg−1, 3 with gadopiclenol 0.3 mmol kg−1, 2 with positive control and 2 with placebo).
TABLE 3.
Summary of treatment‐emergent adverse events (AEs) that occurred in at least 2 subjects
| Gadopiclenol 0.1 mmol kg−1 (n = 48) | Gadopiclenol 0.3 mmol kg−1 (n = 48) | Moxifloxacin 400 mg (n = 48) | Placebo (n = 48) | |||||
|---|---|---|---|---|---|---|---|---|
| Subjects | AEs | Subjects | AEs | Subjects | AEs | Subjects | AEs | |
| At least 1 AE | 25 (52.1%) | 33 | 22 (45.8%) | 33 | 16 (33.3%) | 18 | 22 (45.8%) | 32 |
| Application site irritation a | 6 (12.5%) | 7 | 7 (14.6%) | 8 | 5 (10.4%) | 5 | 6 (12.5%) | 6 |
| Headache | 6 (12.5%) | 6 | 5 (10.4%) | 6 | 4 (8.3%) | 4 | 4 (8.3%) | 4 |
| Injection site haematoma | 4 (8.3%) | 4 | 3 (6.3%) | 3 | 0 (0.0%) | 0 | 1 (2.1%) | 1 |
| Injection site pain | 2 (4.2%) | 2 | 0 (0.0%) | 0 | 0 (0.0%) | 0 | 4 (8.3%) | 4 |
| Diarrhoea | 0 (0.0%) | 0 | 1 (2.1%) | 1 | 3 (6.3%) | 3 | 2 (4.2%) | 2 |
| Injection site erythema | 2 (4.2%) | 2 | 1 (2.1%) | 1 | 0 (0.0%) | 0 | 1 (2.1%) | 1 |
| Dysgeusia | 1 (2.1%) | 1 | 1 (2.1%) | 1 | 0 (0.0%) | 0 | 2 (4.2%) | 2 |
| Dizziness | 1 (2.1%) | 1 | 0 (0.0%) | 0 | 2 (4.2%) | 2 | 0 (0.0%) | 0 |
| Nausea | 0 (0.0%) | 0 | 2 (4.2%) | 2 | 0 (0.0%) | 0 | 1 (2.1%) | 1 |
| Abdominal pain | 1 (2.1%) | 1 | 0 (0.0%) | 0 | 0 (0.0%) | 0 | 1 (2.1%) | 1 |
| Injection site reaction a | 1 (2.1%) | 1 | 0 (0.0%) | 0 | 1 (2.1%) | 1 | 0 (0.0%) | 0 |
| Catheter site haematoma | 1 (2.1%) | 1 | 1 (2.1%) | 1 | 0 (0.0%) | 0 | 0 (0.0%) | 0 |
| Injection site inflammation | 1 (2.1%) | 1 | 0 (0.0%) | 0 | 0 (0.0%) | 0 | 1 (2.1%) | 1 |
| Injection site rash | 1 (2.1%) | 1 | 1 (2.1%) | 1 | 0 (0.0%) | 0 | 0 (0.0%) | 0 |
| Oropharyngeal pain | 0 (0.0%) | 0 | 1 (2.1%) | 1 | 0 (0.0%) | 0 | 1 (2.1%) | 1 |
| Back pain | 0 (0.0%) | 0 | 2 (4.2%) | 2 | 0 (0.0%) | 0 | 0 (0.0%) | 0 |
These AEs were associated with catheter placement or the electrode patches.
CI, confidence interval.
Overall, fewer AEs were reported by fewer subjects following moxifloxacin administration when compared to i.v. administration of study treatments including placebo. There was no obvious difference in AE reporting between gadopiclenol and placebo.
No safety concern was observed regarding haematology or biochemistry parameters, vital signs remained stable during the study, and no clinically significant findings on safety ECG and Holter ECG were observed.
4. DISCUSSION
The results of this thorough QT/QTc study show that administration of gadopiclenol, a new macrocyclic GBCA, at standard clinical and supraclinical doses, did not result in a prolongation of the QTc interval in healthy volunteers. At all time points, the upper bound of the 90% CI of ΔΔQTcF was <10 ms and, therefore, from a regulatory and clinical relevance standpoint, this study can be considered negative. The observed increase in QTcF following oral moxifloxacin administration demonstrated that the present study had adequate sensitivity to detect an increase in QTcF.
There are only a limited number of studies published on the effects of GBCAs on the QTc interval. Only 1 thorough QT/QTc study was reported with gadobutrol, which showed an ΔΔQTc increase of 9.91 ms (90% CI 8.01–11.81) at a dose of 0.5 mmol kg−1. This marginally positive QT‐prolonging effect decreased to 7.62 ms (90% CI: 6.37, 8.87), i.e. a negative thorough QT study, after QT/RR hysteresis correction. 21 Hysteresis correction was justified by a 13.1 beats min−1 increase in heart rate, which did not occur in our study. A randomized, double‐blind, placebo‐controlled, crossover clinical trial in patients requiring contrast‐enhanced MRI did not show any significant QTc prolongation with gadoterate meglumine. 22 In a 2‐way crossover study comparing gadobenate at a dose of 0.2 mmol kg−1 to placebo an increase of 3.1 ms in ΔΔQTcB was observed with no difference between healthy volunteers and patients with coronary artery disease. 23 It is interesting to note that both gadobutrol and gadobenate have a higher osmolarity at marketed concentrations (1603 and 1970 mOsm l−1, respectively) than gadopiclenol (843 mOsm l−1). 13 In a comparative study of the high‐osmolarity iodinated contrast agent diatrizoate (osmolarity: 1515 mOsm l−1) 24 and the low‐osmolarity iodinated contrast agents ioxaglate, iopamidol and iohexol, diatrizoate had the largest effect on QTc. 25 It is thus likely that the small effects on QTc observed in this and other studies with GBCAs are related to the high osmolarity of the compounds rather than to their chemical structure and this is supported by in vitro data. 11 , 22 The concentration–response analysis confirmed the absence of clinically significant QTc prolongation with gadopiclenol. However, since there was a positive relationship between gadopiclenol concentration and QTc response, it cannot be excluded that contrast agents of greater osmolarity could be associated with clinically significant QTc prolongation.
Another hypothesis to explain small and transient QTc prolongation with hyperosmolar compounds could be linked to abrupt changes in ventricular loading associated with increased blood pressure. 26 , 27 However, such an effect was not documented in this or other studies of GBCAs and there was no significant change in blood pressure in the present study.
The pharmacokinetic and safety profile observed in the present study are in line with previously published results 13 and confirm the good safety profile of gadopiclenol. AEs were mainly related to the mode of administration and their frequency did not differ from placebo.
A limitation of the present study is that it was performed in healthy volunteers who did not have electrolyte abnormalities that could possibly affect cardiac conduction, with ECGs devoid of any clinically relevant abnormality and who were not treated with concomitant medications that could possibly affect cardiac repolarisation. Patients who are scheduled to undergo an MRI may have any of the above.
In conclusion, results from this thorough QT/QTc study show that at both anticipated clinical and supraclinical doses i.v. gadopiclenol do not prolong the QTc interval and confirm the previously observed favourable safety and pharmacokinetic profiles. In addition, the study supports the view that hyperosmolarity of gadolinium‐based contrast agent could be associated with minimal and clinically insignificant prolongation of ventricular repolarization.
COMPETING INTERESTS
C.F.‐B., P.V., F.V. and M.F. had support from Guerbet for the submitted work. N.L.F., C.D. and P.D. are current employees of Guerbet. There are no other relationships or activities that could appear to have influenced the submitted work.
CONTRIBUTORS
All authors were involved in the study design, data interpretation, reviewed the results and approved the final manuscript. N.L.F., C.D. and P.D. supervised the study conduct. F.V. was responsible for the study conduct. P.V. supervised the central reading of the ECGs. M.F. supervised the statistical analyses. C.F.‐B. produced the final version of the manuscript.
ACKNOWLEDGEMENTS
This study was funded by Guerbet. Medical writing support was provided by Paul van Giersbergen (Van Giersbergen Consulting, Wuenheim, France) and was funded by Guerbet.
Funck‐Brentano C, Felices M, Le Fur N, et al. Randomized study of the effect of gadopiclenol, a new gadolinium‐based contrast agent, on the QTc interval in healthy subjects. Br J Clin Pharmacol. 2020;86:2174–2181. 10.1111/bcp.14309
The authors confirm that the Principal Investigator for this paper is Frédéric Vanhoutte and that he had direct clinical responsibility for the subjects.
DATA AVAILABILITY STATEMENT
Data will be available on request from the authors after product registration (product under development).
REFERENCES
- 1. Morana G, Cugini C, Scatto G, Zanato R, Fusaro M, Dorigo A. Use of contrast agents in oncological imaging: magnetic resonance imaging. Cancer Imaging. 2013;13(3):350‐359. [DOI] [PMC free article] [PubMed] [Google Scholar]
- 2. Zhou Z, Lu ZR. Gadolinium‐based contrast agents for magnetic resonance cancer imaging. Wiley Interdiscip Rev Nanomed Nanobiotechnol. 2013;5(1):1‐18. [DOI] [PMC free article] [PubMed] [Google Scholar]
- 3. Bellin MF, Van Der Molen AJ. Extracellular gadolinium‐based contrast media: an overview. Eur J Radiol. 2008;66(2):160‐167. [DOI] [PubMed] [Google Scholar]
- 4. Kanal E, Maravilla K, Rowley HA. Gadolinium contrast agents for CNS imaging: current concepts and clinical evidence. AJNR am J Neuroradiol. 2014;35(12):2215‐2226. [DOI] [PMC free article] [PubMed] [Google Scholar]
- 5. Grobner T. Gadolinium‐‐a specific trigger for the development of nephrogenic fibrosing dermopathy and nephrogenic systemic fibrosis? Nephrol Dial Transplant. 2006;21:1104‐1108. [DOI] [PubMed] [Google Scholar]
- 6. Grobner T, Prischl FC. Patient characteristics and risk factors for nephrogenic systemic fibrosis following gadolinium exposure. Semin Dial. 2008;21(2):135‐139. [DOI] [PubMed] [Google Scholar]
- 7. Ramalho J, Semelka RC, Ramalho M, Nunes RH, AlObaidy M, Castillo M. Gadolinium‐based contrast agent accumulation and toxicity: an update. AJNR am J Neuroradiol. 2016;37(7):1192‐1198. [DOI] [PMC free article] [PubMed] [Google Scholar]
- 8. Fraum TJ, Ludwig DR, Bashir MR, Fowler KJ. Gadolinium‐based contrast agents: a comprehensive risk assessment. J Magn Reson Imaging. 2017;46(2):338‐353. [DOI] [PubMed] [Google Scholar]
- 9. Rogosnitzky M, Branch S. Gadolinium‐based contrast agent toxicity: a review of known and proposed mechanisms. Biometals. 2016;29(3):365‐376. [DOI] [PMC free article] [PubMed] [Google Scholar]
- 10. Lancelot E, Desche P. Gadolinium retention as a safety signal: experience of a manufacturer. Invest Radiol. 2020;55(1):20‐24. [DOI] [PMC free article] [PubMed] [Google Scholar]
- 11. Yabuuchi F, Beckmann R, Wettwer E, Hegele‐Hartung C, Heubach JF. Reduction of hERG potassium currents by hyperosmolar solutions. Eur J Pharmacol. 2007;566(1‐3):222‐225. [DOI] [PubMed] [Google Scholar]
- 12. Jacobsen EA, Pedersen HK, Klow NE, Refsum H. Cardiac electrophysiology, arrhythmogenic mechanisms and roentgen contrast media. Acta Radiol Suppl. 1995;399:105‐114. [DOI] [PubMed] [Google Scholar]
- 13. Hao J, Bourrinet P, Desche P. Assessment of pharmacokinetic, Pharmacodynamic profile, and tolerance of Gadopiclenol, a new high Relaxivity GBCA, in healthy subjects and patients with brain lesions (phase I/IIa study). Invest Radiol. 2019;54(7):396‐402. [DOI] [PubMed] [Google Scholar]
- 14. Bendszus M, Roberts D, Kolumban B, et al. Dose finding study of Gadopiclenol, a new macrocyclic contrast agent, in MRI of central nervous system. Invest Radiol. 2020, 55(3):129‐137. [DOI] [PubMed] [Google Scholar]
- 15. International Conference on Harmonization . E14: Clinical evaluation of QT. 2005. available at https://www.ich.org/page/efficacy-guidelines; (last accessed: 22 April 2020).
- 16. Williams E. Experimental designs balanced for the estimation of residual effects of treatments. Aust J Sci Res B. 1949;2:149‐168. [Google Scholar]
- 17. Hochberg Y, Tamhane A. Multiple comparison procedures. New York, NY, USA: John Wiley & Sons; 1987. [Google Scholar]
- 18. Food and Drug Administration . Bioanalytical Method Validation Guidance for Industry 2018. Available at: https://www.fda.gov/regulatory-information/search-fda-guidance-documents/bioanalytical-method-validation-guidance-industry; (last accessed: 22 April 2020 ).
- 19. European Medicine Agency . Bioanalytical method validation. 2011. Available at: https://www.ema.europa.eu/en/bioanalytical-method-validation; (last accessed: 22 April 2020 ).
- 20. Garnett C, Bonate PL, Dang Q, et al. Scientific white paper on concentration‐QTc modeling. J Pharmacokinet Pharmacodyn. 2018;45(3):383‐397. [DOI] [PubMed] [Google Scholar]
- 21. Malik M, Hnatkova K, Schmidt A, Smetana P. Correction for QT/RR hysteresis in the assessment of drug‐induced QTc changes‐‐cardiac safety of gadobutrol. Ann Noninvasive Electrocardiol. 2009;14(3):242‐250. [DOI] [PMC free article] [PubMed] [Google Scholar]
- 22. Bourrinet P, Martel E, El Amrani AI, et al. Cardiovascular safety of gadoterate meglumine (Gd‐DOTA). Invest Radiol. 2007;42(2):63‐77. [DOI] [PubMed] [Google Scholar]
- 23. Pirovano G, Goodman DB, Halemane U, Venetianer C, Kirchin MA, Spinazzi A. Cardiac electrophysiologic monitoring after injection of gadobenate dimeglumine versus placebo in healthy volunteers and patients with cardiovascular disease. Radiology. 2004;233(2):555‐565. [DOI] [PubMed] [Google Scholar]
- 24. Drug label information (Dailymed) . Hypaque sodium ‐ Diatrizoate Sodium injection, solution. Available at https://dailymed.nlm.nih.gov/dailymed/drugInfo.cfm?setid=02ff6501-cccc-4f7d-9988-856d4e169b0e; (last accessed: 22 April 2020).
- 25. Mitsumori M, Hayakawa K, Soga T, et al. Effects of contrast media on the RR and QT interval during coronary arteriography. Acta Radiol. 1991;32(2):120‐123. [PubMed] [Google Scholar]
- 26. Taggart P, Sutton P, Lab M, Runnalls M, O'Brien W, Treasure T. Effect of abrupt changes in ventricular loading on repolarization induced by transient aortic occlusion in humans. Am J Physiol. 1992;263(3 Pt 2):H816‐H823. [DOI] [PubMed] [Google Scholar]
- 27. Taggart P, Sutton P, John R, Lab M, Swanton H. Monophasic action potential recordings during acute changes in ventricular loading induced by the Valsalva manoeuvre. Br Heart J. 1992;67(3):221‐229. [DOI] [PMC free article] [PubMed] [Google Scholar]
Associated Data
This section collects any data citations, data availability statements, or supplementary materials included in this article.
Data Availability Statement
Data will be available on request from the authors after product registration (product under development).