

SUMMARY
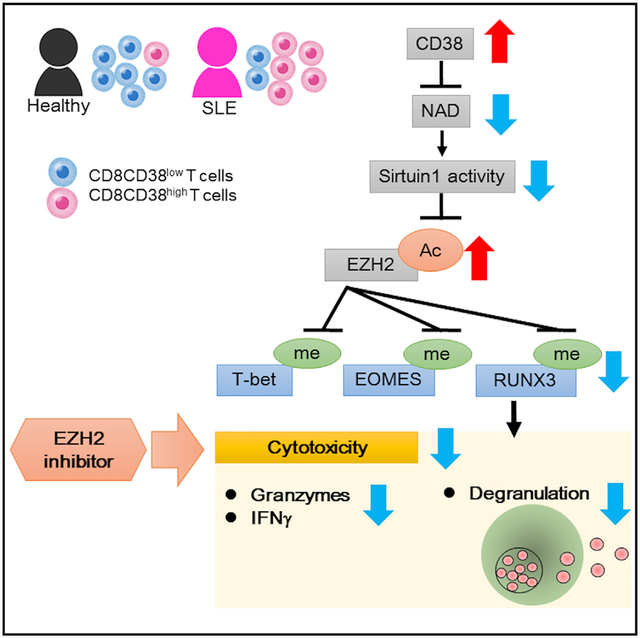
Patients with systemic lupus erythematosus (SLE) suffer frequent infections that account for significant morbidity and mortality. T cell cytotoxic responses are decreased in patients with SLE, yet the responsible molecular events are largely unknown. We find an expanded CD8CD38high T cell subset in a sub-group of patients with increased rates of infections. CD8CD38high T cells from healthy subjects and patients with SLE display decreased cytotoxic capacity, degranulation, and expression of granzymes A and B and perforin. The key cytotoxicity-related transcription factors T-bet, RUNX3, and EOMES are decreased in CD8CD38high T cells. CD38 leads to increased acetylated EZH2 through inhibition of the deacetylase Sirtuin1. Acetylated EZH2 represses RUNX3 expression, whereas inhibition of EZH2 restores CD8 T cell cytotoxic responses. We propose that high levels of CD38 lead to decreased CD8 T cell-mediated cytotoxicity and increased propensity to infections in patients with SLE, a process that can be reversed pharmacologically.
Graphical Abstract
In Brief
Katsuyama et al. find that an expanded CD8CD38high T cell population in SLE patients is linked to infections. CD8CD38high T cells display decreased cytotoxic capacity by suppressing the expression of related molecules through an NAD+/Sirtuin1/EZH2 pathway. EZH2 inhibitors increase cytotoxicity offering a means to mitigate infection rates in SLE.
INTRODUCTION
Systemic lupus erythematosus (SLE) is a female dominant autoimmune disease in which the autoreactive immune system causes inflammation and damage in multiple organs and tissues. Infections represent one of the major causes of morbidity and mortality in patients with SLE (Fors Nieves and Izmirly, 2016). Although the use of immunosuppressive drugs contributes the increased frequency of infections (Danza and Ruiz-Irastorza, 2013), patients and mice prone to systemic autoimmunity are inherently immunosuppressed, and this in part is due to dysfunctional CD8 T cells (Kis-Toth et al., 2016; Larsen et al., 2011; Lieberman and Tsokos, 2014). Patients with SLE display less cytolytic activity even when compared with other rheumatic diseases (Stohl, 1995). CD8 T cells from patients with SLE display decreased production of granzyme B and perforin than normal subjects (Comte et al., 2017). Decreased signaling through the signaling lymphocytic activation molecules (SLAMs) 4 and 7 may partially explain the impaired T cell cytotoxicity in patients with SLE (Comte et al., 2017; Kis-Toth et al., 2016). Our laboratory and others have also claimed that CD8 T cells from some patients with SLE cannot control the expansion of Epstein-Barr virus-infected B cells (Kang et al., 2004; Larsen et al., 2011; Tsokos et al., 1983) and have decreased cytotoxic capacity and proliferative responses to viral peptides (Kis-Toth et al., 2016). However, the involved mechanisms are not understood.
In a recent study in which we sequenced RNA from T cells from patients with SLE, we found that high expression of CD38 in T cells identifies a group of patients with broad abnormalities in terms of gene expression (Bradley et al., 2015). CD38 expression on CD4+, CD8+, and CD25+ T cells was increased in SLE T cells and correlated with disease activity (Alcocer-Varela et al., 1991; Erkeller-Yuksel et al., 1997; Pavón et al., 2006, 2013). Increased CD38 expression in T cells from patients with SLE may contribute to lupus pathogenesis because T cells produce Th1 and Th2 inflammatory cytokines when they are stimulated with CD38 antibodies (Pavón et al., 2013). On the other hand, total CD38-deficient MRL/lpr lupus-prone mice display exacerbated lupus nephritis (Viegas et al., 2011). The detailed molecular characteristics of CD8CD38high cells and their role in the pathogenesis of the disease have not been investigated.
CD38 represents a cell activation marker (Malavasi et al., 1992), yet it functions as an enzyme that acts as a major NADase in multiple tissues with ADP-ribosyl cyclase and hydrolase activity (Malavasi et al., 2008) and participates in intracellular calcium mobilization (Aarhus et al., 1995). CD38 has a short cytoplasmic tail, but it controls the levels of extra- and intra-cellular NAD+ (Aksoy et al., 2006; Chini, 2009). CD38 affects cell metabolism (Cantó et al., 2015), and thus increased CD38 expression can affect T cell function in multiple diseases including leukemias (D’Arena et al., 2001), cancers (Chatterjee et al., 2018), and viral infections (Hua et al., 2014). In multiple myeloma, in which CD38 expression predicts a poor prognosis, CD38 degrades NAD to produce adenosine and leads to effector T cells exhaustion through the adenosine receptor (Horenstein et al., 2019). A recent study demonstrated that increased NAD in the presence of low levels of CD38 switches the intratumoral CD4 T cells into effector Th1/17 cells by enhancing glutaminolysis (Chatterjee et al., 2018). CD38 expression is increased in patients with Cytomegalovirus (Booiman et al., 2017), Epstein-Barr virus (Zidovec Lepej et al., 2003), and mycobacterial (Rodrigues et al., 2002) infections. CD38 expression has been explored in people with human immunodeficiency virus (HIV) infection and claimed to reflect poor prognosis (Dentone et al., 2015; Hua et al., 2014). During HIV infection, patients with high viral loads have more CD38+HLADR+CD8 T cells than people who maintain low viral loads and display show decreased interferon (IFN)-γ and cytotoxicity (Hua et al., 2014).
Here, we present evidence that CD38 expression is increased in CD8 T cells from a subpopulation of patients with SLE who experience a high incidence of infections independently of disease activity. We demonstrate that CD38 expression defines CD8 T cells that have limited cytotoxicity as well as cytotoxicity-related transcriptional factors through the NAD/Sirtuin1/EZH2 axis. We propose that it can be used to identify patients with higher propensity to develop infections and offers opportunities for therapeutic interventions.
RESULTS
Expansion of CD8CD38high T Cells in Patients with SLE
Expression of CD38 on peripheral blood T cell subsets was studied by flow cytometry (Figure 1A; Figure S1A as gating strategy) in 42 patients with SLE and 24 healthy subjects matched for sex and age. As previously reported (Alcocer-Varela et al., 1991; Erkeller-Yuksel et al., 1997; Pavón et al., 2006), patients with SLE have an expanded population of CD8 T cells expressing high levels of CD38 (Figure 1B). There was no statistically significant difference in CD38 mean fluorescence intensity (MFI) levels, suggesting an expansion of the CD38high population of CD8 T cells rather than increased expression per cell (Figure 1C). To further understand the phenotype of these cells, first the distribution of CD38 was investigated between CD8CD38low and CD8CD38high populations. The distribution of naive (CCR7+CD45RA+), central memory (CCR7+CD45RA−), effector memory (CCR7−CD45RA−), and effector memory re-expressing CD45RA (CCR7−CD45RA+) T cells did not show differences between CD8CD38low and CD8CD38high populations in either healthy subjects or patients with SLE (Figure S1B, left: healthy subjects, right: SLE).
Figure 1. Patients with SLE Prone to Infections Display an Increased Percentage of CD8CD38high.
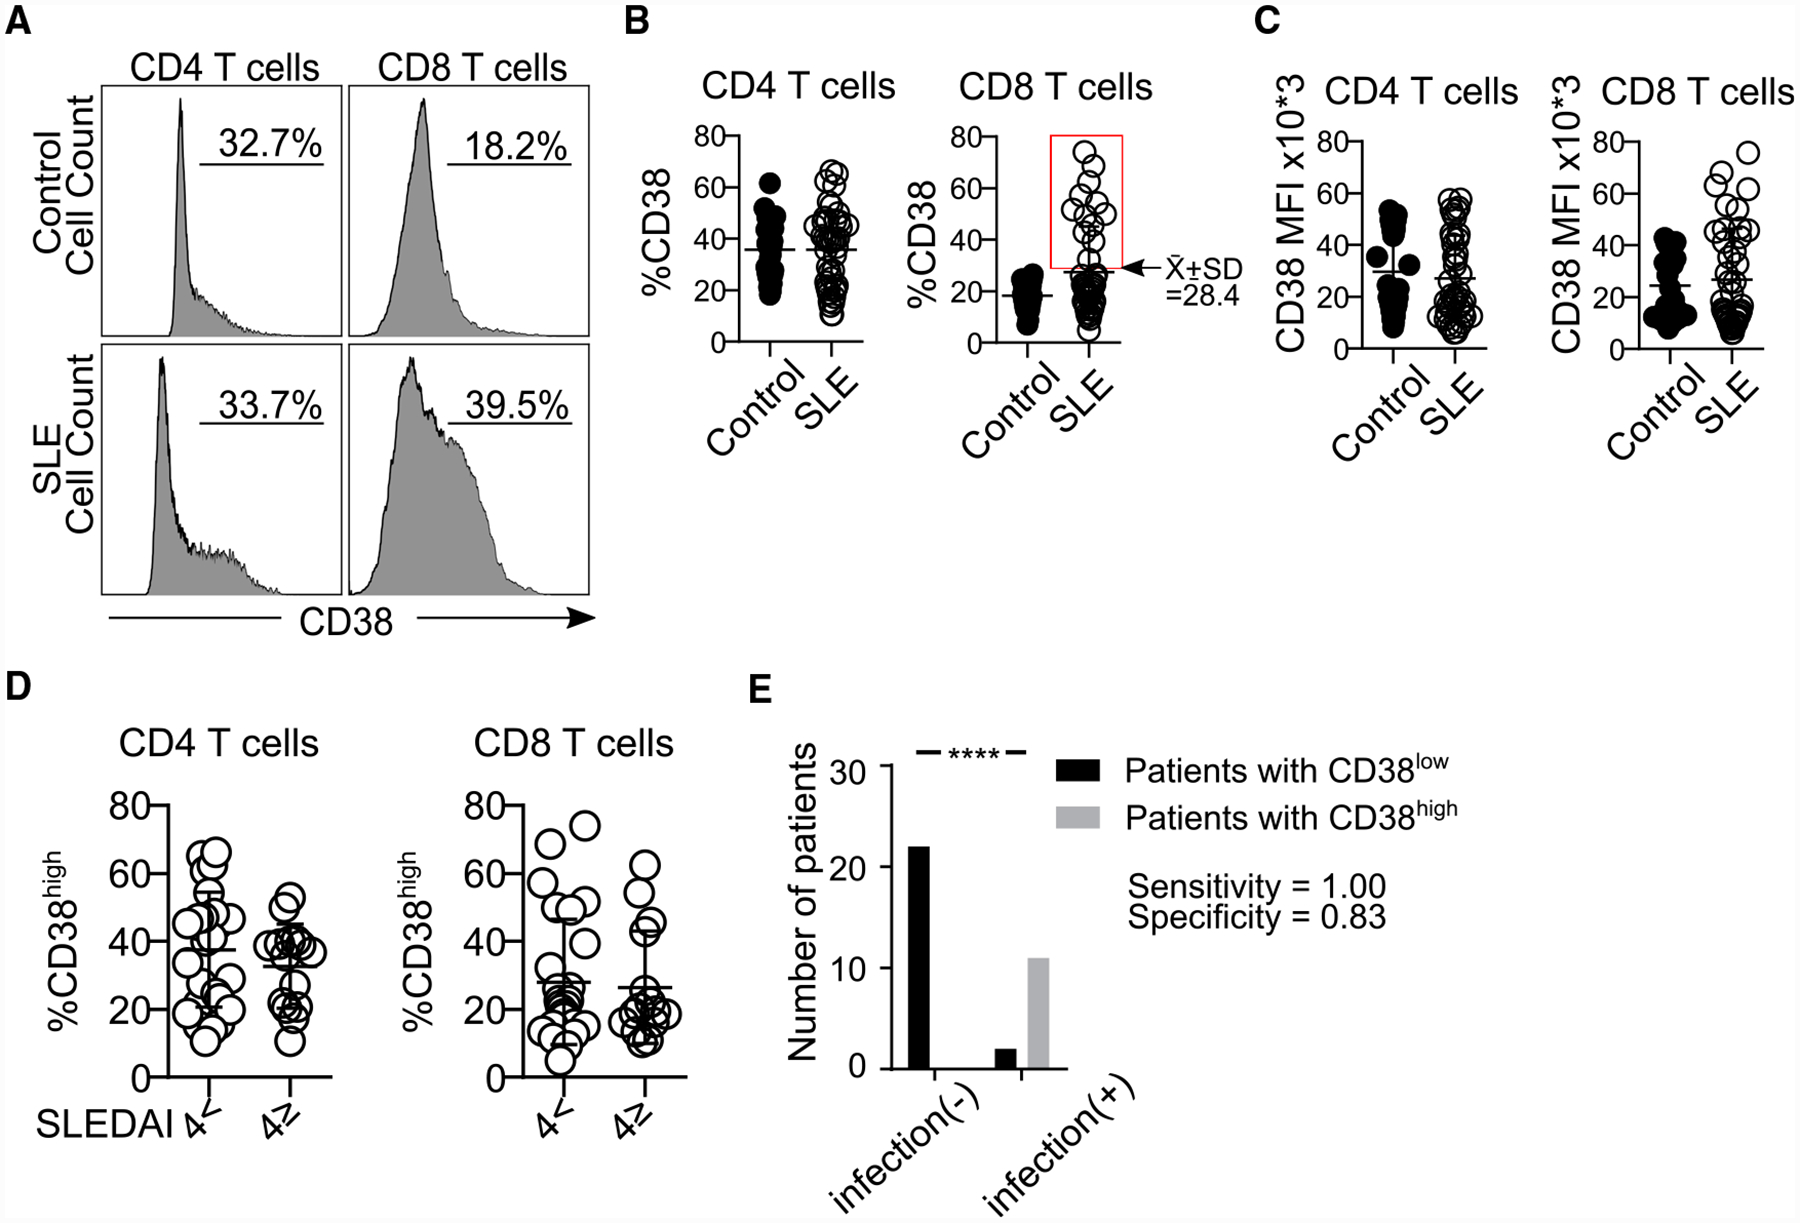
(A) Representative histograms showing CD38 expression in CD4 and CD8 T cells from both a healthy subject and a patient with SLE.
(B) Percentage of CD38 in CD4 and CD8 T cells by flow cytometry. The rectangle identifies the cutoff point separating patients with SLE in 2 subpopulations: those with high or normal percentages of CD8CD38high (healthy subjects = 24, SLE = 42; Welch’s test).
(C) MFI of CD38 in CD4 and CD8CD38high T cells (healthy subjects = 24, SLE = 35: Kolmogorov-Smirnov) from healthy subjects and patients with SLE by flow cytometry.
(D) Percentage of CD4CD38high and CD8CD38high T cells from patients with SLE sorted based on disease activity: inactive (SLEDAI < 4, n = 26) or active (SLEDAI ≥4, n = 15) by flow cytometry (Kolmogorov-Smirnov test).
(E) Sensitivity and specificity of the percentage of CD8CD38high T cells in defining patients with any infection (SLE = 35, chi-square test).
In all figures, average data are represented as mean ± SD.
Next, selected markers for activation or exhaustion (Figure S2A, representative histograms for HLA-DR, CD45RA, LAG3, FAS, CD158, PD1, and TIGIT; Figures S2B–S2H, cumulative data for the same molecules) were analyzed by flow cytometry. HLA-DR expression was higher in CD8CD38high compared to CD8CD38low T cells (20% versus 6.5%) from both normal subjects and patients with SLE (Figure S2B). PD1 was significantly increased in CD8CD38high T cells from patients with SLE but not from normal subjects (Figure S2D). LAG3 was increased in SLE patients regardless of the CD38 levels (Figure S2G). These data suggest that CD8CD38high T cells from patients with SLE, unlike those from normal subjects, display markers of activation and exhaustion.
CD8CD38high T Cells Identify a Population of Patients with SLE with Increased Risk for Infections
Analysis of the clinical data from these patients revealed that the percentage of CD8CD38high T cells was independent of disease activity as measured by SLE Disease Activity Index (SLEDAI) (Figure 1D). Since patients with SLE had an expanded CD8CD38high population compared to healthy subjects (Figure 1B, right, threshold CD8CD38 = 28.4%), we decided to divide our patients into 2 groups: CD8CD38low (%CD8CD38 <28.4) and CD8CD38high (%CD8CD38 ≥ 28.4) and compare their clinical characteristics in patients who have sufficient clinical records (n = 35). There was no difference in SLEDAI, organ damage, or disease flares between patients with CD8CD38low and with CD8CD38high (Table S1). CD38 has been reported to be increased on the surface of T cells from patients infected with HIV (Savarino et al., 2000) and cytomegalovirus (CMV) (Booiman et al., 2017) in whom high levels have been linked to poor prognosis. Patients with SLE are known to be immunocompromised, and therefore we asked whether CD38 expression on CD8 T cells correlates with the infection rates in patients with SLE. To address this, we reviewed the clinical charts of the studied patients and recorded infectious episodes, which occurred within a 6-month period before and after the date of data collection. We noted that the patients with CD8CD38high experienced infectious episodes (11 out of 13 patients), whereas those with CD8CD38low did not experience any infections (0 out of 22 patients) (Figure 1E, chi-square test p < 0.0001; sensitivity = 100%, specificity = 83.3% when cutoff level for CD38 positivity was set at 28.4%). In reference to the type of infections (Table S2), urinary tract infections (4 out of 11 infections) were the most frequently observed; however, we could not collect data on the kind of causative organism. These data suggest a possible role for CD38 in the susceptibility to infection by patients with SLE.
Both CD8CD38high and CD8CD38low groups of patients displayed similar clinical features except for the erythrocyte sedimentation rate (ESR), which was higher (p < 0.01) in the CD8CD38high group and the use of mycophenolate mofetil (MMF), which was more frequent in the CD8CD38low group (p = 0.02) (Table S1). This supports the claim that the detected susceptibility to infections, which was noted in the CD8CD38high group, is not caused by the increased use of immunosuppressive drugs.
High Levels of CD38 Identify CD8 T Cells with Poor Cytotoxic Capacity
Besides the role of the immunosuppressive drugs, decreased cytotoxic cell activity accounts for the increased rates of infections in patients with SLE (Danza and Ruiz-Irastorza, 2013; Fors Nieves and Izmirly, 2016; Iliopoulos and Tsokos, 1996). To determine whether the expression of CD38 affects the function of CD8 T cells, the degranulation capacity of CD8 T cells was analyzed by flow cytometry by assessing the expression of CD107a, a lysosome marker that is expressed when cells degranulate (Figure 2A, representative histograms). The degranulation capacity of CD8 T cells from patients with SLE was decreased compared to that of CD8 T cells from healthy subjects (Figure 2B). We found that there was an inverse correlation between the percentage of CD8CD38high T cells and the percentage of de-granulating CD8 T cells in healthy subjects (R2 = 0.54, p = 0.038, Figure 2C, closed circles), patients with SLE (R2 = 0.42, p = 0.023, Figure 2C, opened circles), and in combined samples (R2 = 0.29, p = 0.014, Figure 2C), indicating a link between the expression of CD38 and degranulation capacity. Indeed, CD8CD38high T cells were characterized by decreased degranulation capacity compared to CD8CD38low T cells from the same donor healthy or a patient with SLE alike (Figures 2D–2F). A similar defect in degranulation occurs in naive, central memory, effector memory, and terminal effector memory CD8 T cell subpopulations (Figure 2G). To determine the in vitro cytotoxic capacity of CD8 cells, we used P815 cells coated with CD3 and CD28 antibodies and labeled with pacific orange and incubated them with sorted CD8CD38low T cells or CD8CD38high cells from healthy subjects. Sorted CD8CD38high human primary T cells showed decreased cytotoxicity against P815 cells compared with their CD8CD38low counterparts (Figure 2H). Overexpression of CD38 (Figure S3A) but not GFP in primary CD8 T cells or in TALL104 human CD8 cell line cells resulted in decreased degranulation (Figures S3B and S3C, respectively). TALL104 cells overexpressing CD38 displayed decreased cytotoxicity against P815 cells (Figure S3D) compared to cells transfected with GFP. These data indicate that CD8CD38high T cells display decreased cytotoxic capacity, which is controlled by CD38 expression.
Figure 2. CD8CD38high T Cells Display Poor Cytotoxic Capacity.
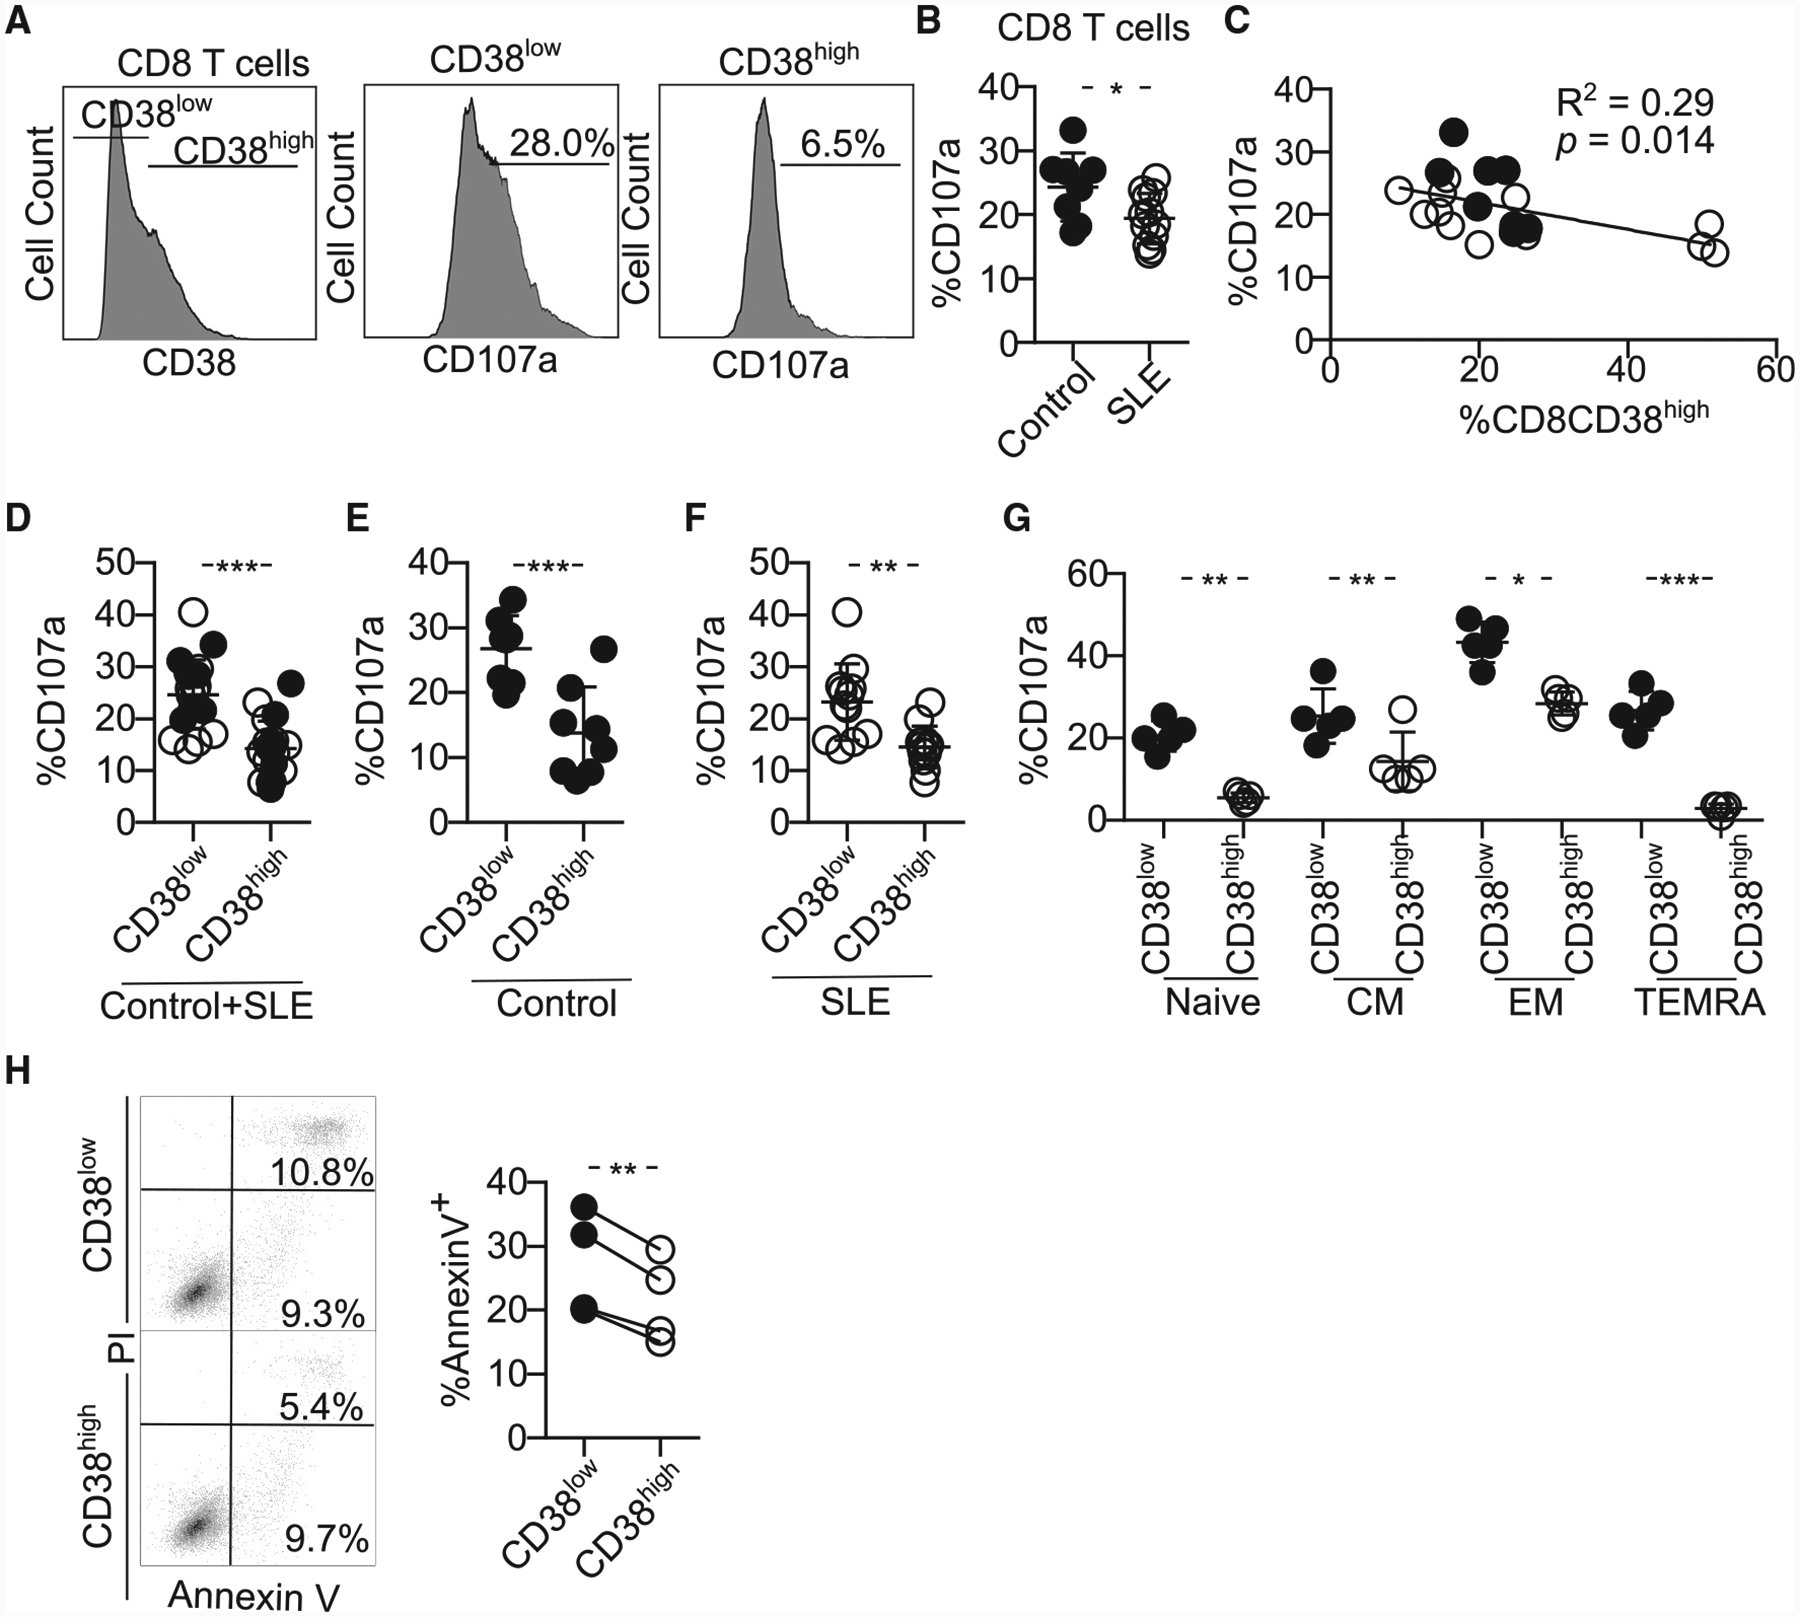
(A) Representative histograms showing the expression of CD107a on CD8CD38low and CD8CD38high T cells from healthy subjects by flow cytometry. To measure CD107a expression, cells were stimulated with plate-coated CD3 and CD28 antibodies with Golgiplug and anti-CD107a for 5 h and stained with proper surface markers.
(B) Degranulation (%CD107a) of CD8 T cells from healthy subjects and patients with SLE evaluated by flow cytometry (healthy subjects = 8, SLE = 12; Welch’s test).
(C) Correlation between percentage of CD38high and degranulation in CD8 T cells (healthy subjects = 8, SLE = 12; closed circles, healthy subjects; opened circles, SLE; Pearson’s correlation).
(D–F) Degranulation (%CD107a) of CD8 T cells sorted on CD38low and CD38high of both healthy subjects and patients with SLE in both groups (D) and separately in healthy subjects (E) and SLE (F) by flow cytometry (healthy subjects = 8, SLE = 12; closed circles, control; opened circles, SLE; healthy subjects = 8, SLE = 12; Welch’s test).
(G) Degranulation (%CD107a) of the different subpopulations of CD8 T cells sorted on CD38low and CD38high by flow cytometry (n = 5 healthy donors; one-way ANOVA with multiple comparison).
(H) Representative dot blots (left) and cumulative data (right) showing percentage of of Annexin V+ P815 cells after coincubation with CD8CD38low or CD8CD38high T cells from healthy subjects analyzed by flow cytometry (normal T cells = 4; Kolmogorov-Smirnov test).
In all figures, average data are represented as mean ± SD.
CD8CD38high T Cells Express Low Levels of Cytotoxic-Related Molecules and Transcription Factors
CD8CD38high T cells were found to display reduced expression of granzyme A (GZMA), granzyme B (GZMB), perforin (PRF1), and IFN-γ molecules, which are needed for the execution of cytotoxic activity both in healthy subjects and patients with SLE (representative histograms are shown in Figure 3A; cumulative data from healthy subjects, Figure 3B, and patients with SLE, Figure 3C). The production of PRF1 in patients with SLE was relatively hard to detect compared to healthy controls, and it was decreased in CD8CD38high T cells. Low protein levels for PRF1 and GZMA and GZMB in CD8CD38high T cells were accompanied by reduced mRNA levels for these molecules in healthy subjects (Figure 3D).
Figure 3. CD8CD38high T Cells Express Low Levels of Cytotoxic Molecules.
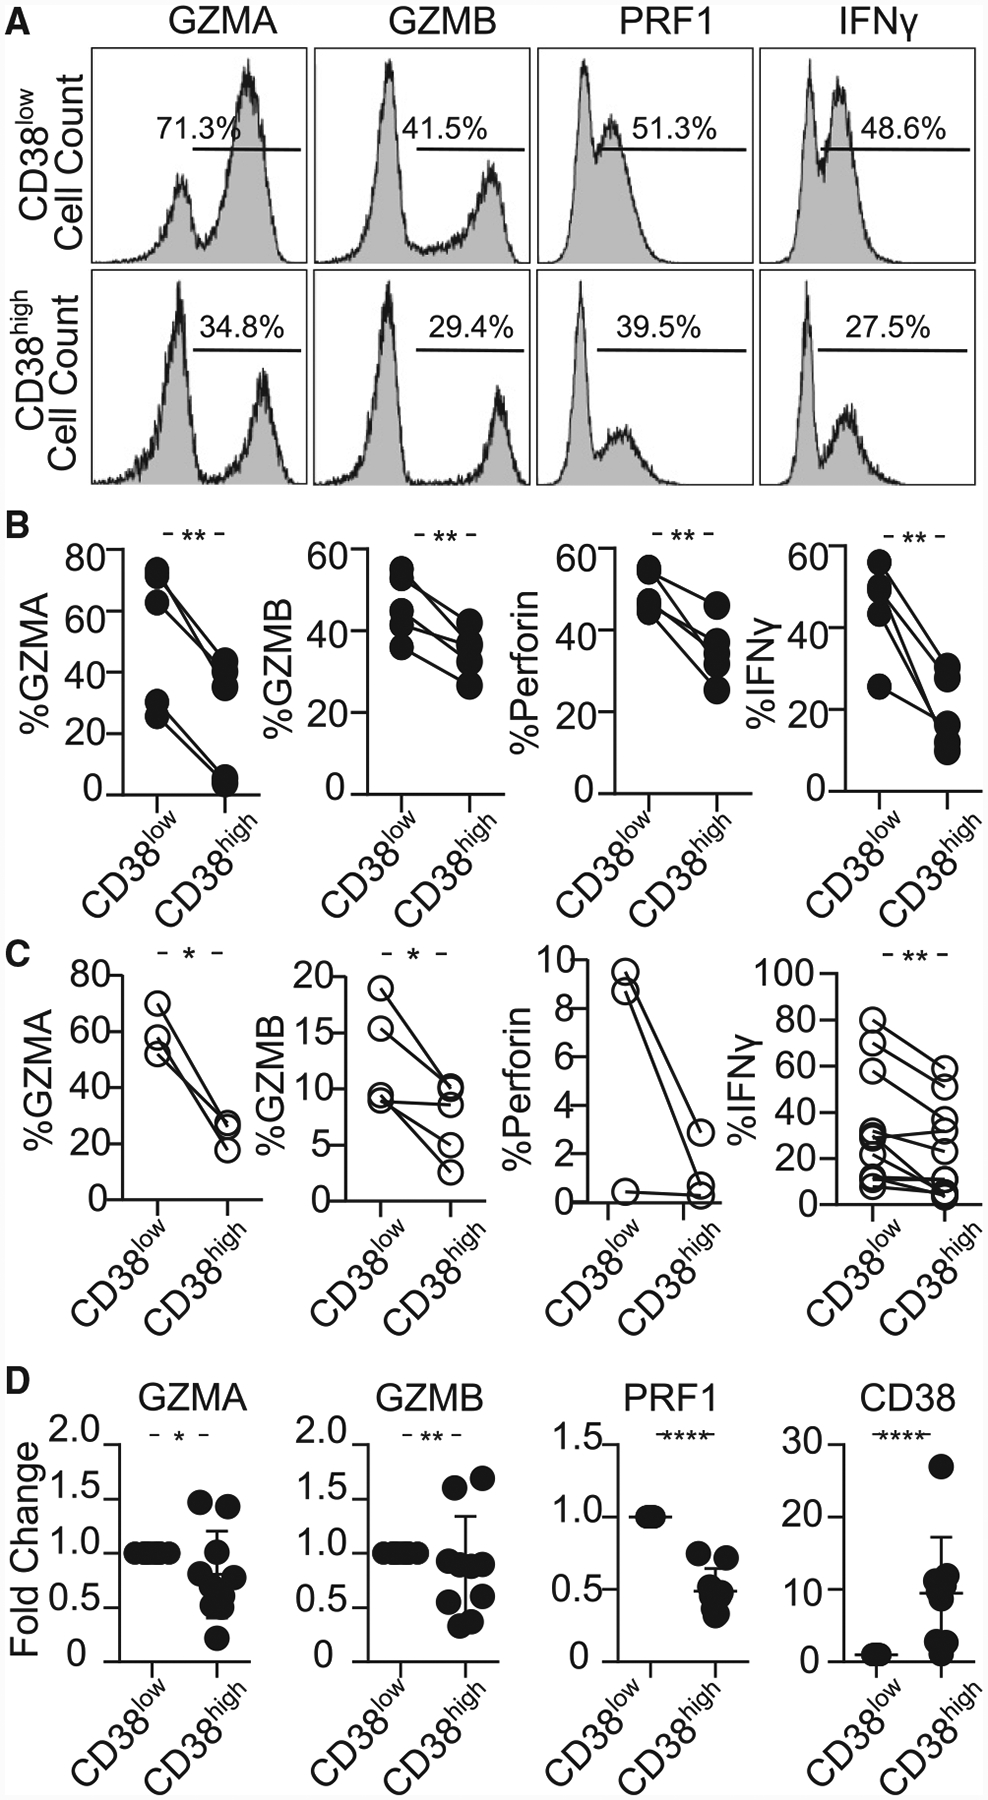
(A) Representative histograms showing granzyme A (GZMA), granzyme B (GZMB), perforin (PRF1), and interferon gamma (IFN-γ) in CD8CD38low and CD38high T cells from a healthy subjects by flow cytometry.
(B) Percentage of GZMA, GZMB, perforin and IFN-γ in CD8CD38low and CD8CD38high T cells evaluated by flow cytometry (healthy subjects ≥3; paired t test).
(C) Percentage of GZMA, GZMB, perforin, and IFN-γ in CD8CD38low and CD8CD38high T cells evaluated by flow cytometry (SLE ≥3; paired t test).
(D) mRNA levels of GZMA, GZMB, PRF1, and CD38 from CD8CD38low and CD8CD38high T cells by quantitative PCR (normal T cells = 10; Kolmogorov-Smirnov test). Cells were sorted by fluorescence-activated cell sorting (FACS) aria.
In all figures, average data are represented as mean ± SD.
The expression of GZMA, GZMB, PRF1, and IFN-γ is controlled by the transcription factors T-bet, Runx3, and EOMES in murine CD8 T cells during infection (Cruz-Guilloty et al., 2009; Pearce et al., 2003; Shan et al., 2017) (scheme in Figure 4A). RUNX3, which directly binds GZMB, IFN-γ, and PRF1 loci, is the main regulator of GZMB. EOMES needs Runx3 to control cytotoxicity (Cruz-Guilloty et al., 2009). T-bet is induced in early stages of infection in response of T cell receptor signaling (Szabo et al., 2002) and is less able to induce PRF1 and GZMB (Cruz-Guilloty et al., 2009). Accordingly, we asked whether the expression of cytotoxic molecules is regulated by RUNX3 and/or EOMES and T-bet in CD38-expressing CD8 T cells. CD8CD38high T cells displayed decreased expression of T-bet, RUNX3, and EOMES at the protein level in healthy controls, but only RUNX3 was decreased in CD8CD38high T cells from patients with SLE (representative histograms, Figure 4B; cumulative data for healthy subjects, Figure 4C and SLE, Figure 4D). The same tendency was confirmed at the mRNA level in healthy controls (Figure 4E). These results suggest that RUNX3 is involved in the regulation of the expression of cytotoxic molecules in CD8CD38high T cells.
Figure 4. CD8CD38high T Cells Express Decreased Levels of EOMES, RUNX3, and T-bet.
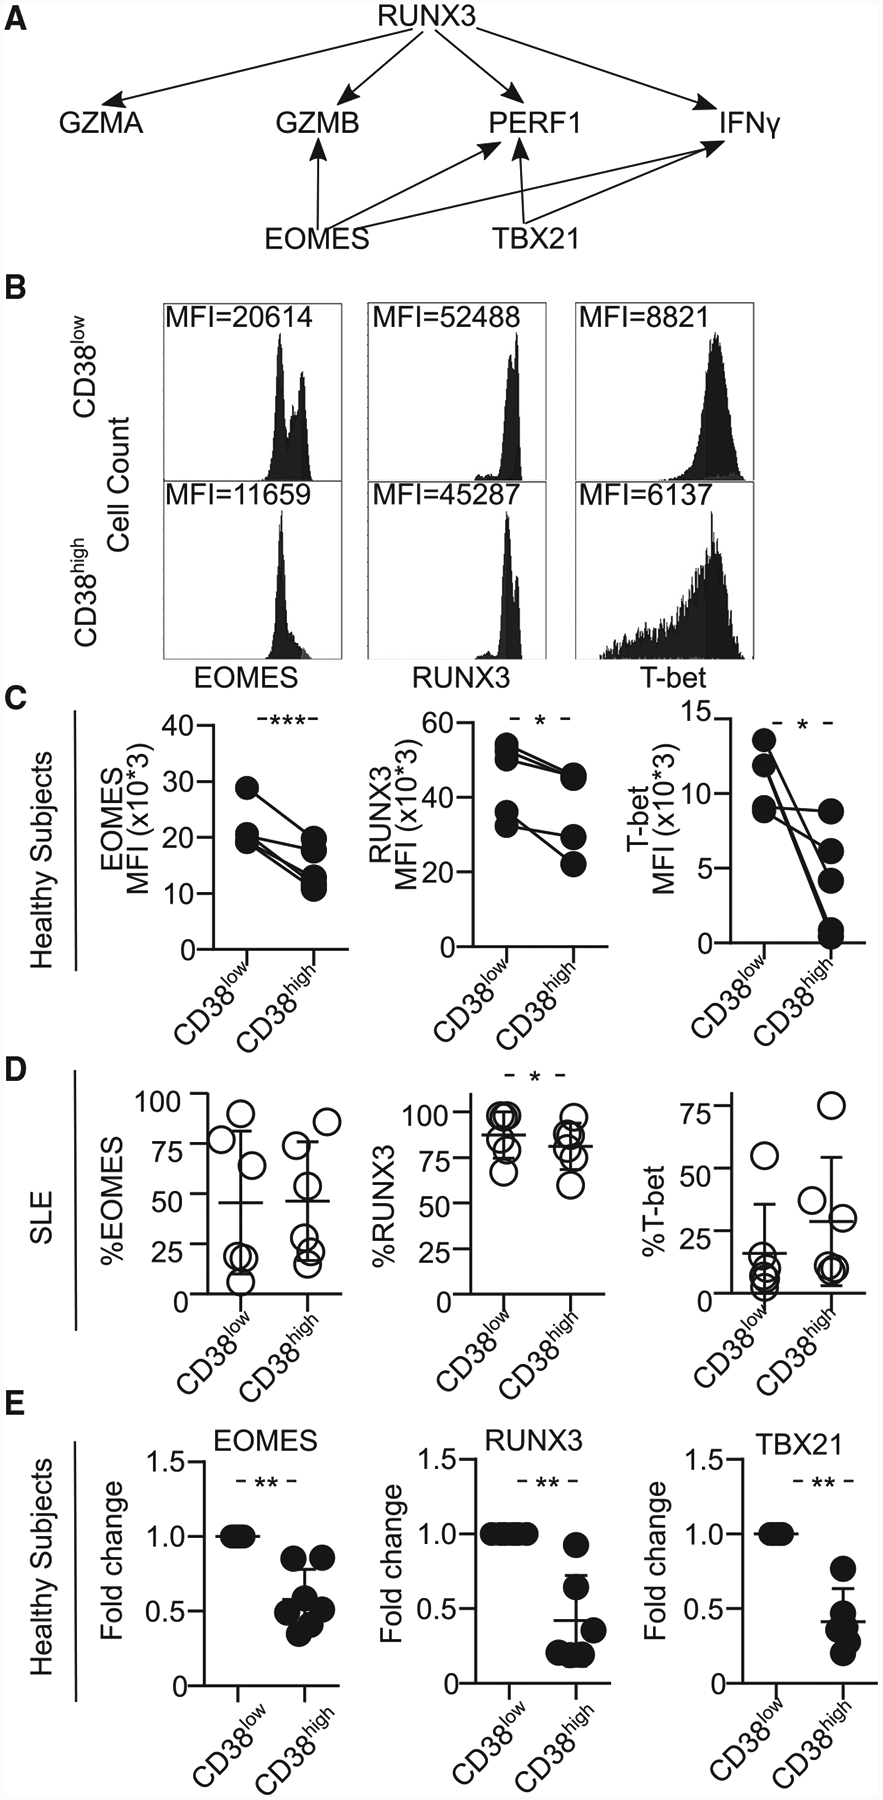
(A) Scheme showing the transcription factors regulating various cytotoxic molecules.
(B) Representative histograms showing EOMES, RUNX3, and T-bet in CD8CD38low and CD38high T cells from a healthy donor by flow cytometry.
(C) MFI from EOMES, RUNX3, and T-bet in CD8CD38low and CD8CD38high T cells from by flow cytometry (healthy subjects ≥3; paired t test).
(D) Percentage of EOMES, RUNX3, and T-bet in CD8CD38low and CD8CD38high T cells by flow cytometry (SLE = 6; paired t test).
(E) mRNA levels of EOMES, RUNX3, and T-bet (TBX21) in CD8CD38low and CD8CD38high T cells by flow cytometry (normal T cells = 10; Kolmogorov-Smirnov test). Cells were sorted by FACS aria.
In all figures, average data are represented as mean ± SD.
CD38 Regulates the Sirtuin1/EZH2 Axis through NAD+
CD38 changes the function of a cell by degrading NAD+, a metabolite that is critical in multiple steps of metabolism. NAD+ is a regulator of Sirtuin1 (SIRT1), which has deacetylase activity (Aksoy et al., 2006) in T cells (Jeng et al., 2018), cancer cells (Chatterjee et al., 2018), and adipocytes (Cantó and Auwerx, 2012) because SIRT1 binds NAD+ to deacetylate targets (Sauve et al., 2006). One of the molecules, which is deacetylated by SIRT1, is EZH2 (Wan et al., 2015), which modulates epigenetically the expression of several molecules including T-bet, RUNX3, and EOMES by trimethylating histone 3 at lysine 27 (H3K27me3) (Fujii et al., 2008; He et al., 2017; Tong et al., 2014). It has been reported that SIRT1 regulates the activity and stability of EZH2 by acetylating it at lysine 348 in HEK293T cells (Wan et al., 2015). Therefore, we hypothesized that increased levels of CD38 leads to decreased levels of NAD+/SIRT1 activity, leading to increased acetylated EZH2 with methyltransferase activity, which consequently represses the expression of cytotoxic molecules (scheme shown in Figure 5A). First, in agreement with the nucleosidase activity of CD38 and with previous reports, we observed that NAD+ levels in CD8CD38high T cells were decreased compared with those in CD8CD38low T cells from healthy subjects (Figure 5B). To compare the function of CD38, especially as NADase better, we generated CD38-deficient Jurkat human CD4 T cell (CD38KO Jurkat cells) using Crisper/Cas9 (Figure S4A). NAD+ levels were clearly decreased in CD38WT Jurkat cells compared to CD38KO Jurkat cells (Figure S4B). Next, we confirmed the increased levels of lysine-acetylated proteins from sorted primary CD8CD38high compared with those of CD8CD38low T cells from healthy subjects (Figure 5C). Lysine acetylation was higher when CD38KO Jurkat cells were compared with CD38WT Jurkat cells (Figure S4C). Overexpression of CD38 in purified CD8CD38low T cells or CD38KO Jurkat cells increased the levels of lysine-acetylated proteins (Figures S4D and S4E, respectively). The expression of P300/CBP-associated factor (PCAF), another acetylase, tended to be higher in CD38WT Jurkat cells, although not at significant levels (Figure S4F), suggesting that SIRT1 is the main deacetylating enzyme in CD8CD38high T cells. CD8CD38high T cells showed increased expression of EZH2 compared to CD8CD38low T cells (Figure 5D); therefore, to further address whether the acetylated levels of EZH2 are increased in CD38high cells, we immunoprecipitated lysates from CD38KO and CD38WT Jurkat cells through the use of an EZH2 antibody. Immunoprecipitated EZH2 from CD38KO Jurkat cells displayed lower levels of acetylation compared to CD38WT Jurkat cells (Figure 5E). Following treatment with EX527, a SIRT1 inhibitor (Gertz et al., 2013), the acetylated levels on EZH2 were increased in CD38KO Jurkat cells (Figure 5F). These data confirmed that EZH2 is increased in CD38high cells, and inhibition of SIRT1 activity induces more EZH2 acetylation. Acetylation stabilizes EZH2 and exerts more methyltransferase activity on its targets (Wan et al., 2015). Indeed, CD8CD38high T cells had increased levels of H3K27me3 compared with CD8CD38low T cells from healthy subjects (Figure 5G). A similar observation was made when we compared with CD38KO Jurkat cells and CD38WT Jurkat cells (Figure S4G). EX527 induced more H3K27me3 in CD38KO Jurkat cells (Figure 5H). These data indicate that CD38 increases methyltransferase activity of EZH2 as a consequence of decreased NAD+ and inhibition of Sirtuin1 deacetylase activity.
Figure 5. CD38 Modulates the Epigenetic Profile of CD8 T Cells by Controlling the Sirtuin1/EZH2 Axis.
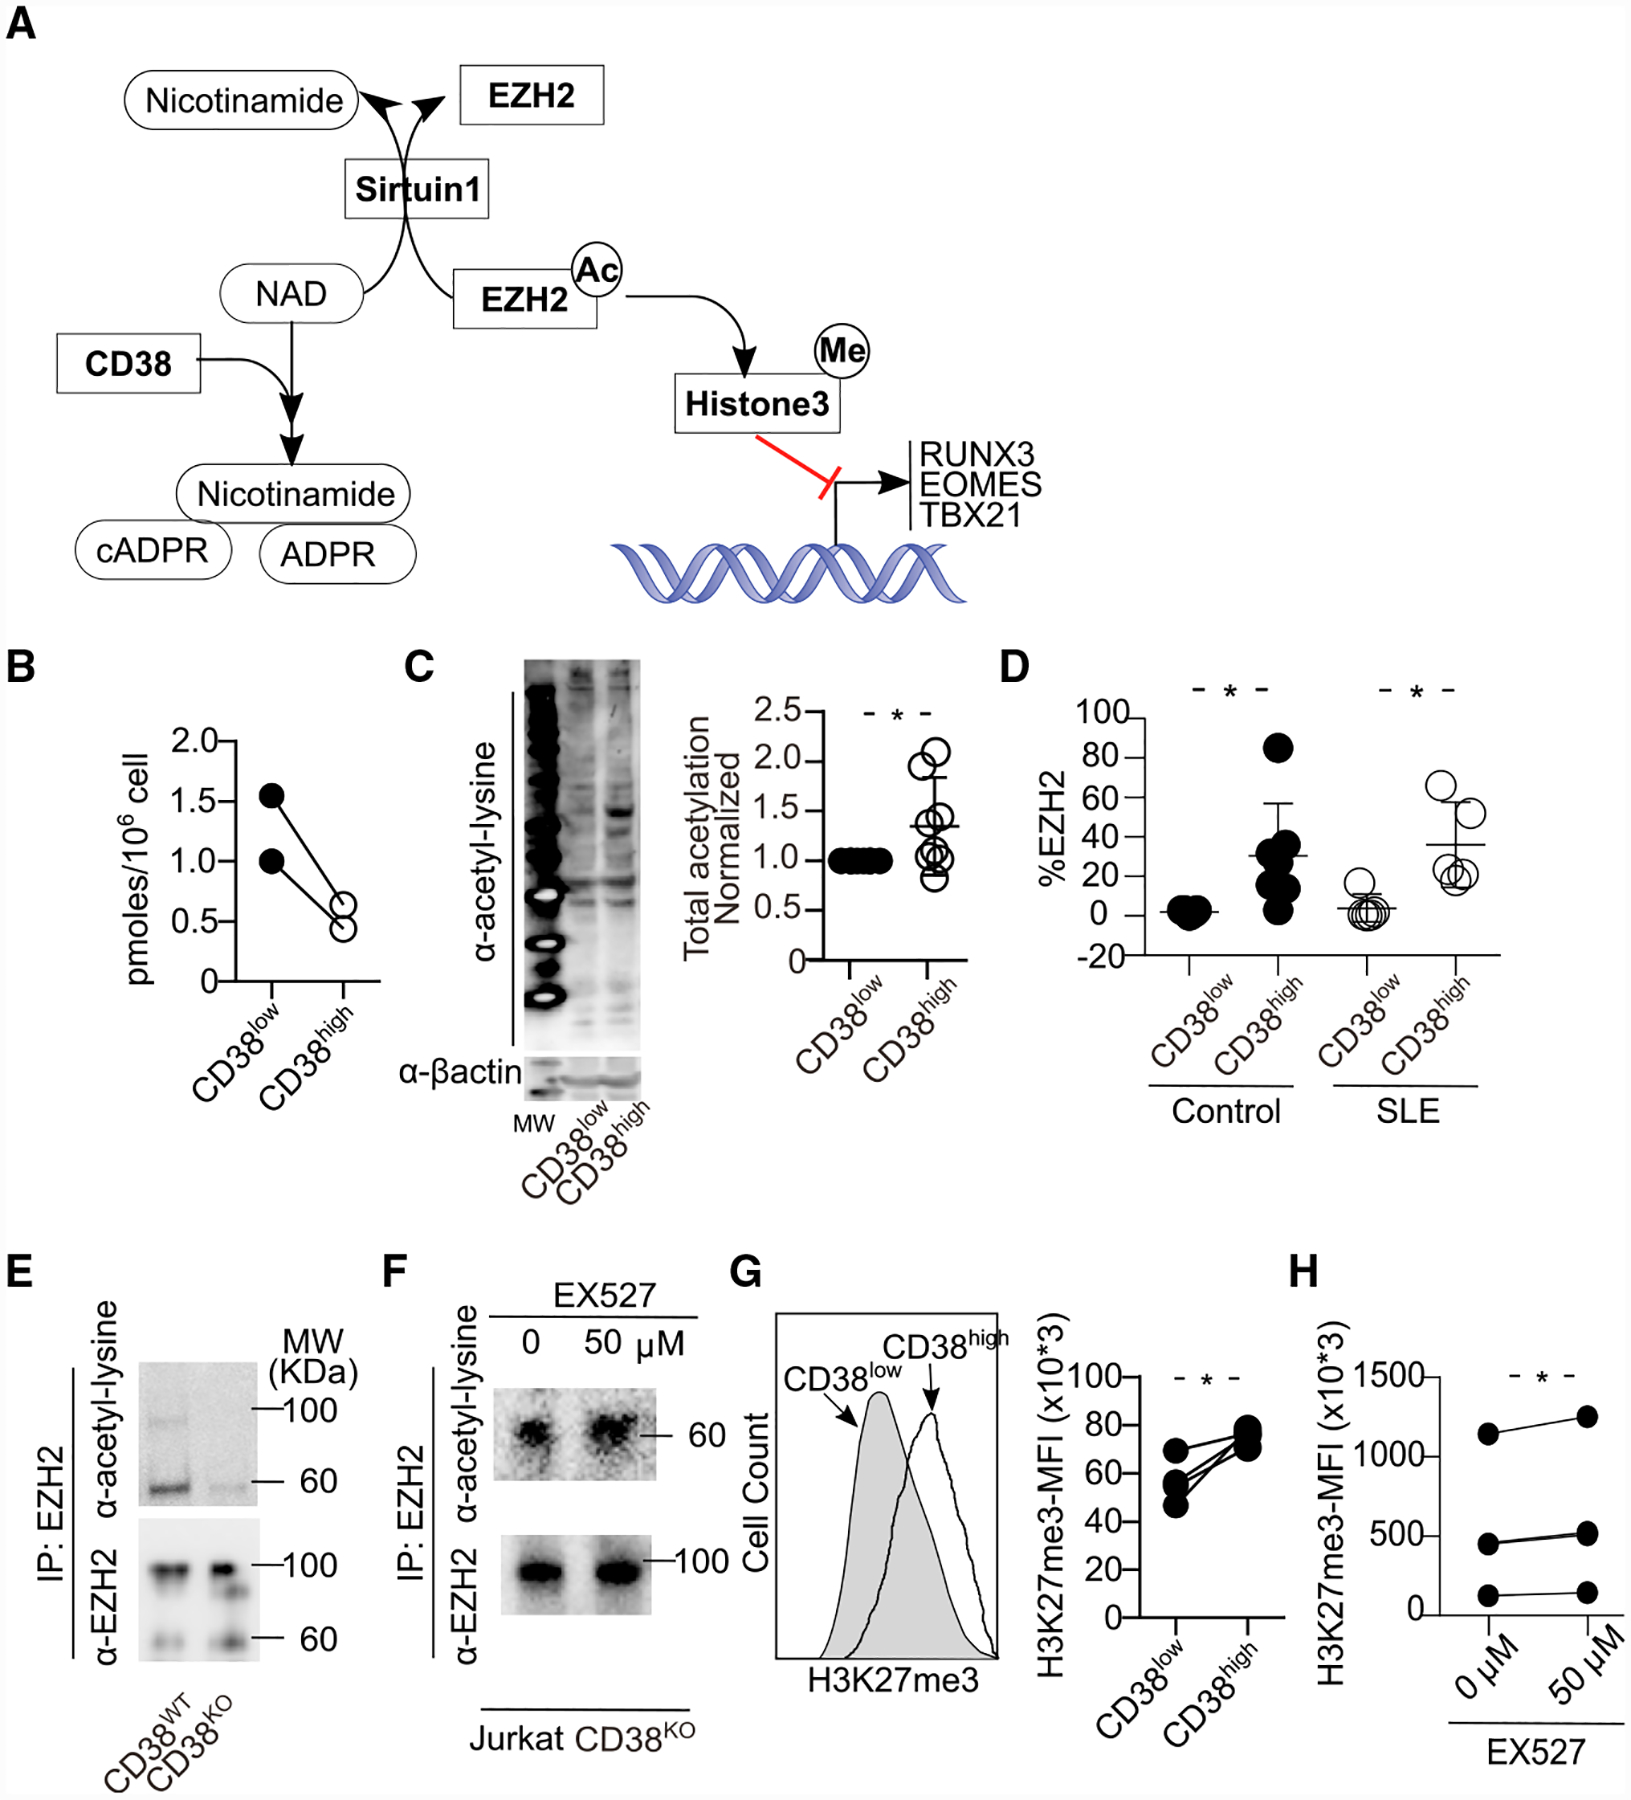
(A) Schema showing the regulation of transcriptional factors by CD38 through the NAD/Sirtuin1 (SIRT1)/EZH2 axis. ADPR, adenosine ribose; cADPR, cyclic adenosine ribose.
(B) NAD+ levels from the same number of CD8CD38low and CD8CD38high T cells, sorted by FACS aria. NAD+ levels were quantified by colorimetric measurements (normal T cells = 2).
(C) Representative western blot (left) and cumulative data (right) showing lysine acetylation in total protein from CD8CD38low and CD8CD38high T cells sorted by FACS aria (normal T cells = 8; Kolmogorov-Smirnov test).
(D) Percentage of EZH2 in CD8CD38low and CD8CD38high T cells from healthy subjects and patients with SLE by flow cytometry (healthy subjects = 7, SLE = 5, paired t test in each group).
(E and F) Cell lysates from Jurkat CD38WT and CD38KO were subjected to immunoprecipitation with an EZH2 antibody followed by western blot analysis with a lysine acetylation or EZH2 antibodies (E). Same experiment as in (E) using cell lysates from Jurkat CD38KO cells, after overnight treatment with 50 μM of EX527 (SIRT1 inhibitor) (F).
(G and H) Representative histogram and cumulative data showing H3K27me3 in CD8CD38low and CD8CD38high T cells by flow cytometry (healthy subjects = 4; paired t test) (G). Same experiment using Jurkat CD38KO cells treated with 50 μM of EX527 overnight (n = 4 in 3 independent experiments, paired t test) (H).
In all figures, average data are represented as mean ± SD.
To determine whether CD38 restricts the chromatin accessibility to RUNX3, EOMES, and T-bet loci, we performed ATAC-seq (Assay for Transposase Accessible Chromatin with high-throughput sequencing) experiments using CD8CD38high and CD8CD38low T cells from healthy subjects and patients with SLE. The correlation heatmap (Figure S5A) and principal-component analysis (PCA) plot (Figure S5B) showed that the variance in chromatin accessibility between CD8CD38low and CD38high T cell populations was higher than the variance between healthy subjects and SLE patients. We then assessed the statistical significance of differentially enrichment peaks between the CD8CD38low and CD38high samples. In healthy subjects, no differences in chromatin accessibility were observed within 5 kb of the transcription start sites (TSSs) for RUNX3 in CD8CD38high T cells compared to CD8CD38low T cells (Figure S5C). However, several intronic regions (Figure S5C) that showed significantly decreased accessibility in CD8CD38high T cells compared to CD8CD38low T cells could potentially regulate the expression of RUNX3. EOMES, TBX21, GZMA, GZMB, PRF1, and IFN-γ all showed decreased accessibility in the 5 kb regions flanking their TSSs for CD8CD38high versus the CD8CD38low T cells in healthy subjects (Figures S5D–S5H and S5J). EZH2 displayed higher chromatin accessibility in CD8CD38high T cells (Figure S5I). These findings are consistent with our results that CD38high cells have higher levels and activity of EZH2, which result in the repression of RUNX3, EOMES, and T-bet in healthy subjects. However, in patients with SLE CD8CD38high T cells had differentially enriched peaks indicating higher chromatin accessibility in the 5 kb regions flanking the TSS of RUNX3, EOMES, and T-bet loci as well as GZMA, GZMB, PRF1, and IFN-γ compared to CD8CD38low T cells. Yet, the expression of RUNX3 was repressed in CD8CD38high T cells in SLE. EZH2 had a significantly higher peak in the promoter specific in SLE (Figure S5I, right) than healthy subjects (Figure S5I, left). It appears that the chromatin occupation status does not reflect gene expression in T cells from SLE patients, and this is reminiscent of previous reports in which chromatin accessibility did not parallel gene expression (Bernstein et al., 2006) (Scharer et al., 2018).
Inhibition of Sirtuin1/EZH2 Axis Restores CD8 Cytotoxicity
Finally, we asked whether manipulation of the SIRT1/EZH2 axis can restore CD8 cytotoxicity. We used a highly specific competitive inhibitor, GSK126 (McCabe et al., 2012), to inhibit EZH2. GSK126 successfully decreased methylation in both CD38KO and CD38WT Jurkat cells (Figure S6A) without affecting apoptosis except in the highest concentration of GSK126 (Figure S6B). While the expression of EOMES and RUNX3 was decreased with EX527 (SIRT1 inhibitor) (Figure 6A), RUNX3 was restored in cells treated with the EZH2 inhibitor GSK126 in TALL104 cells (Figure 6B) and in CD8 T cells in patients with SLE (Figure 6C). GSK126 restored IFN-γ or GZMB in CD8 T cells from healthy subjects and patients with SLE (Figures 6D and 6E). In addition, GSK126 led to increased degranulation of CD8CD38high T cells without affecting the degranulation levels of CD8CD38low T cells from both healthy controls and patients with SLE (Figures 6F and 6G). CD38high cells show higher EZH2 (Figure 5D) and are more inhibition of methylation by GSK126 (Figure S6A). Altogether, our data indicate that the cytotoxic capacity of CD8CD38high T cells is controlled by the CD38/Sirtuin1/EZH2 axis.
Figure 6. Inhibition of Sirtuin1/EZH2 Axis Restores CD8 Cytotoxicity.
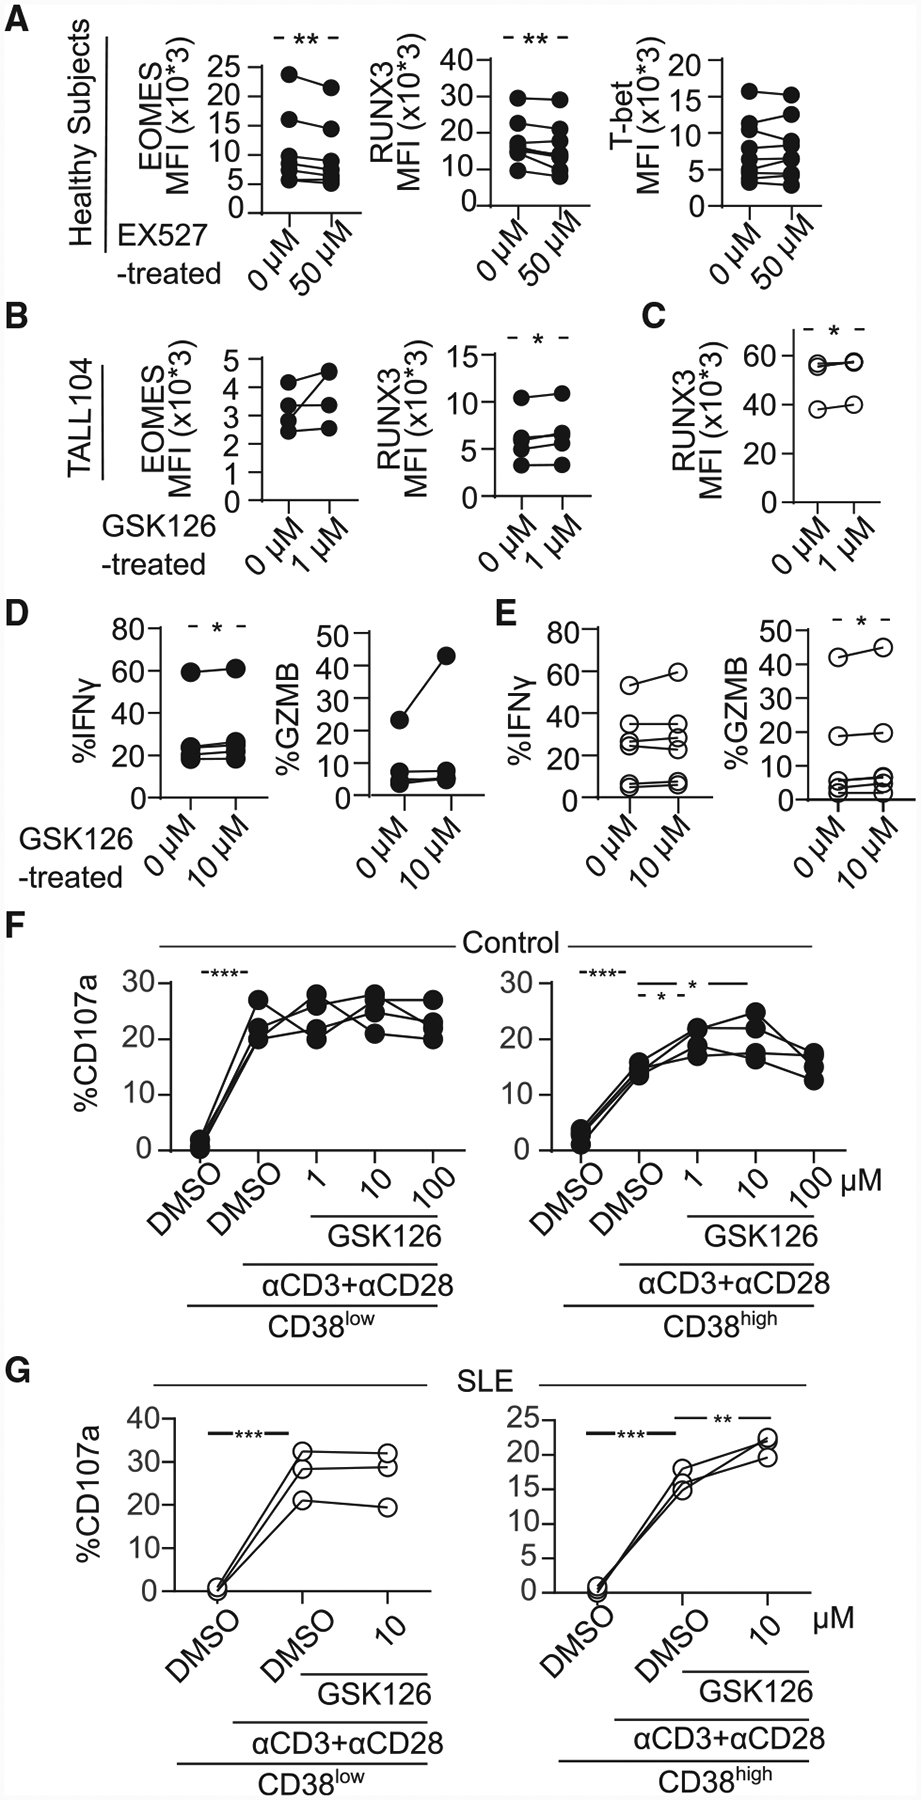
(A) MFI from EOMES, RUNX3, and T-bet in CD8 T cells pretreated with 50 μM of EX527 (SIRT1 inhibitor) overnight by flow cytometry (healthy subjects = 7; paired t test).
(B) MFI from EOMES and RUNX3 in TALL104 CD8 T cells pretreated with 1 μM of GSK126 (EZH2 inhibitor) overnight by flow cytometry (n = 4, 3 independent experiments; paired t test).
(C) MFI from RUNX3 in CD8 T cells in patients with SLE pretreated with 1 μM of GSK126 overnight by flow cytometry (SLE = 4; paired t test).
(D and E) Percentage of IFN-γ and GZMB in CD8CD38low or CD8CD38high T cells from healthy controls (D) and from patients with SLE (E) treated with 1 μM of GSK126 overnight by flow cytometry (healthy subjects = 5, shown in closed circle, SLE = 6, shown in opened circle; paired t test).
(F and G) Degranulation (%CD107a) of CD8CD38low or CD8CD38high T cells from healthy subjects (F) and from patients with SLE (G) treated with GSK126 overnight and stimulated with plate-coated CD3/CD28 antibodies for 5 h with GSK126 at the indicated concentration (n = 4, one-way ANOVA with multiple comparisons).
DISCUSSION
It is highly desired to have a biomarker to identify patients with SLE who are prone to infections, a major cause of morbidity and mortality. It also important to define the underlying cellular and molecular pathways that account for poor defense mechanisms against infectious agents in order to design new and better therapeutic strategies. In this communication, we present evidence that high levels of CD8CD38high in the peripheral blood of patients with SLE are linked to infections, and mechanistically we show that CD38 decreases the levels of NAD+, which leads to less cytotoxic function through CD38/NAD+/Sirtuin1/EZH2 pathway. Importantly, GSK126, an EZH2 inhibitor, restored the impaired cytotoxicity by increasing the expression of cytotoxic molecules and degranulation in T cells from patients with SLE. Our data imply that pharmaceutical correction of this pathway should lead to increased cytotoxic cell function and reduced susceptibility to infection in patients with SLE.
In our cohort, the CD8CD38high T cell population was found expanded in patients with SLE who experienced a higher incidence of infections independently of disease activity. Previous reports have pointed to indicators of susceptibility to infections including serum levels of C reactive protein, procalcitonin (Ospina et al., 2017), T cell surface expression of CD64 (Feng et al., 2019), or deletion of Deltex1 (Leu et al., 2019), but they have fallen short in defining correctable molecular pathways.
Impaired cytotoxic function linked to CD38 has been reported in several murine experiments. CD38-deficient mice infected with bacteria the L. monocytogenes or Streptococcus pneumoniae develop severe pneumonia (Partida-Sánchez et al., 2001). Neutrophils from CD38-deficient mice display defective migration of neutrophils to the lungs due to abnormal chemotaxis or defective function of dendric cells (Partida-Sánchez et al., 2004), while lack of CD38 did not affect their adaptive CD8 T cell responses including IFN-γ production (Partida-Sánchez et al., 2001).
CD38 appears to control a number of cell functions. For example, high expression of CD38 on smooth muscle cells enables an exacerbated response when exposed to inter-leukin-13 (IL-13) and methacholine (Deshpande et al., 2005). CD19+CD24highCD38high B cells exercise more regulatory capacity in normal subjects, although in patients with SLE they function poorly (Blair et al., 2010). We show that both CD8CD38high T cells from normal subjects and SLE patients produce significantly less IFN-γ, while they appear to produce equivalent amounts of Th2-related and suppressive cytokines to CD8CD38low T cells (Figure S2I).
CD8CD38high T cells in the cohort that we studied expressed higher amounts of HLA-DR compared to CD8CD38low T cells. CD8CD38high cells may represent recently activated cells in response to inflammatory cytokines such as IL-6, IFN, or lipo-polysaccharide that are known to increase the expression of CD38 (Malavasi et al., 2008; Matalonga et al., 2017). Also, CD8 T cells from patients with SLE display cell activation markers (Murphy et al., 2019). Along these lines, ESR, a marker of inflammation, was elevated in patients with SLE with expanded CD8CD38high cells. Accordingly, CD38 may represent a sequel of infection, which through mechanisms defined here contributes to decreased CD8 cytotoxic function.
CD8CD38high T cells from patients with SLE showed higher PD1 expression than CD8CD38low T cells. In addition, LAG3 was expressed at higher amounts in all CD8 cells in patients with SLE compared to those from normal subjects. Whether CD38 is associated with exhaustion and whether T cell exhaustion represents a causative mechanism of autoimmunity remain unclear. In our study, CD8CD38high T cells appear to be a product of recent activation unable to display cytotoxic function. It should be noted that blockade of PD1/PDL1 in cancer patients with SLE may cause de novo appearance of systemic autoimmunity (Naidoo et al., 2016), and T cell exhaustion may favor autoimmunity albeit worsen viral infections (McKinney et al., 2015). Also, it should be noted that cell exhaustion markers are linked to infection with HIV and virostatic treatment eliminates cell exhaustion (Pannus et al., 2019).
The expression pattern of cytotoxicity-related transcriptional factors was different in patients with SLE compared to healthy subjects. Decreased cytotoxic cell function of CD8CD38high T cells can be explained by the decreased expression of transcription factors EOMES, RUNX3, and T-bet (Cruz-Guilloty et al., 2009; Pearce et al., 2003). All transcription factors were decreased in CD8CD38high T cells from normal subjects, while only RUNX3 was decreased in cells from patients with SLE and can explain the decreased expression of cytotoxicity-related molecules. We further determined that especially RUNX3 is controlled by the SIRT1/EZH2 axis by causing changes in the epigenetic landscape of effector molecules. As for EOMES and T-bet, they are linked with cell exhaustion and chronic infection. EOMES can cause exhaustion in tumor-infiltrating cells (Li et al., 2018), and chronic infection with HIV is linked to increased T-bet and EOMES expression (Buggert et al., 2014). It appears that the expression of EOMES and T-bet in T cells from patients with SLE may reflect chronic activation or exhaustion, and a better understanding is needed.
We have attributed the lower cytotoxicity of CD8CD38high T cells from both healthy donors and patients with SLE to a dysregulated CD38/SIRT1/EZH2 axis, which controls the methylation of the RUNX3 gene (Fujii et al., 2008; He et al., 2017; Tong et al., 2014). However, ATAC-seq revealed different chromatin landscapes between healthy subjects and patients with SLE. The chromatin accessibility especially in intronic region of RUNX3 was low in CD8CD38high from healthy subjects reflecting repressed gene expression, while RUNX3 accessibility was significantly higher in CD8CD38high T cells from patients with SLE. Yet, the expression of RUNX3 was lower in CD8CD38high T cells from patients with SLE compared to cells from normal subjects. Chromatin accessibility does not always reflect gene transcription. Indeed, promoters that exhibit increased accessibility in the absence of gene expression have been reported in undivided B cells (Scharer et al., 2018). It is also possible that these areas define “bivalent domains,” that is, regions harboring open and closing histones that coincide with transcription factors expressed at low levels (Bernstein et al., 2006).
Our study has a number of identifiable limitations that include the size of cohort originating from one single center and the fact that it was done in a cross-sectional manner. A prospective study should define more accurately the value of CD8CD38high cells identifying the patients prone to infections. As noted, we have not been able to retrieve the causative infectious agents that were responsible for the recorded infections. At the mechanistic level, there is much more to be learned. The issue of chromatin remodeling needs further investigation along with work to identify additional molecular mechanism whereby CD38 may suppress T cell function. For example, CD38 mediates the production of adenosine, which suppresses certain T cell functions (Morandi et al., 2015, 2018). Also, EZH2 is induced by reactive oxygen stress (ROS) (Shrishrimal et al., 2019), and ROS has been shown to contribute to SLE disease pathogenesis (Perl, 2013).
Finally, our data provide evidence that inhibition of EZH2 leads to increased CD8CD38high T cell cytotoxicity in both healthy donors and patients with SLE. Previously, an EZH2 inhibitor was reported to increase the activity of CD8 T cells against human cytomegalovirus, adenovirus, and Zika virus (Arbuckle et al., 2017), all of which can induce increased expression of CD38 in CD8 T cells. Also, treatment of lupus-prone mice with an EZH2 inhibitor significantly improved disease, lymphoproliferation, and the production of inflammatory cytokines (Rohraff et al., 2019).
In conclusion, our study has identified a mechanism to explain why CD8 T cells in patients with SLE have decreased cytotoxic capacity and are prone to infections. The identified molecular pathway (increased CD38 > decreased NAD+ > decreased Sirtuin 1 > increased EZH2 > decreased transcription factors and molecules linked to poor cytotoxic responses) in our study offers therapeutic opportunities to restore cell cytotoxicity.
STAR★METHODS
LEAD CONTACT AND MATERIALS AVAILABILITY
Further information and requests for resources and reagents should be directed to and will be fulfilled by George C Tsokos at gtsokos@bidmc.harvard.edu.
CD38 knocked-out Jurkat cells generated in this study will be made available on request but we may require a payment and a complete Materials Transfer Agreement if there is potential for commercial application.
EXPERIMENTAL MODEL AND SUBJECT DETAILS
Human samples
All patients with SLE (n = 42) fulfilled the American College of Rheumatology classification criteria (Tan et al., 1982). Patients with SLE were recruited from the Division of Rheumatology at Beth Israel Medical Center and provided consent, as approved by the institutional review board. As controls, age- and sex-matched healthy individuals were recruited (n = 24). The average of age was 40 years old and 80% was female in patients with SLE. The average of age was 38 years old and 80% was female in healthy donors.
Disease activity score for the patients with SLE was measured using the SLE Disease Activity Index (SLEDAI) scoring system (Bombardier et al., 1992). For some experiments that required large amounts of human primary cells, we used cells from blood remaining in the leukoreduction system chambers of apheresis instruments after routine platelet collection (“Trima collars”), which were obtained from Boston Children’s Donor Center.
Cell lines
Jurkat human CD4 T cell line and P815 mouse mast cell line were obtained from ATCC were maintained in RPMI1640 (Thermo Fisher Scientific) with L-glutamine, 1% of Penicillin/Streptomycin and 10% of FBS. TALL104 human CD8 T cell line obtained from ATCC was maintained in IMDM following the recommendation by ATCC with 1% of Penicillin/Streptomycin, 20% of FBS, 0.5 μg/ml of D-mannitol, 2.5 ug/ml of human Albumin and 100 IU/ml of human recombinant IL-2. To generate a CD38 knocked-down Jurkat cell line, at first, Cas9-expressing Jurkat cells were made by transduction (spinoculation) with lentivirus constructed with pSPAX2, pVSVg and lentiCas9-Blast (a gift from Feng Zhang, Addgene plasmid # 52962) generated in 293T cells. Following 3 days of selection with 20ug/ml blasticidin, Cas9-expressing Jurkat cells were expanded for 5 days and then 2×10⁶ cells were electroporated with the Amaxa system (Lonza) with 1 μg of several plasmids expressing a guide RNA targeting the first exon of CD38 (pSPgRNA was a gift from Charles Gersbach, Addgene plasmid # 47108). Efficiently CD38-knocked down cells were purified by a FACSAria (Becton Dickenson) using surface staining against CD38. We used guides detected by two online tools (http://zlab.bio/guide-design-resources and http://chopchop.cbu.uib.no/). The expression of one guide (sgCD38b: CACCGATCCTCGTCGTGGTGCTCGCGG) was most efficient and used to generate knock out cells. The line generated was carried forward for characterization, and the knockout cells were complete and stable over several passages without further selection. Cas9-expressing Jurkat cells were used as control although they are referred in the text as wild-type, CD38WT.
METHOD DETAILS
Cell isolation and sorting
Peripheral blood from the study subjects was collected in lithium heparin tubes. Total T or CD8 T cells were enriched by RosetteSep Enrichment Cocktail (StemCell Technologies, Inc.) followed by density-gradient centrifugation (Lymphocyte Separation Medium; Corning Life Sciences). Freshly isolated or frozen T cells were used in further experiments. In order to sort sufficient numbers of CD8CD38low and CD38high T cells from human primary cells, we used blood from “Trima Collars,” using a FACSAria. After resting overnight cells were used in different assays or frozen to perform western blot analyses or NAD+ measurements.
Electroporation
For overexpression assays, 5×10⁶ of cells were electroporated with 2.5 μg of CD38- or GFP- overexpressing plasmid (Sino Biological) for human primary cells using Amaxa nucleofactor (Human T Cell Nucleofactor kit, the program U-014) and for Jurkat and TALL104 cell lines (Cell Line Nucleofactor kit, the program X-001). After electroporation, cells were rested in the culture medium overnight to allow protein expression and then used in experiments.
Flow cytometric analysis
The phenotype of T cell subpopulations was measured by flow cytometry, using fluorochrome-conjugated antibodies against CD3, CD4, CD8, CD38, CD45RA, CCR7, CD107a, CD158, FAS, HLA-DR, LAG3, PD-1, TIGIT, IFNγ, Granzyme A, Granzyme B, Perforin, RUNX3, T-bet and EOMES, PCAF as well as isotype-matched control antibodies (Biolegend). For intracellular staining, cells were fixed and permeabilized using a Cytofix/Cytoperm kit (BD Biosciences) and stained for granzyme A, granzyme B, perforin or IFNγ, IL-4, IL-10 and IL-13 after the stimulation with 25 ng/ml of Phorbol 12-myristate 13-acetate (PMA) and 1 μM of Ionomycin for 4 hours. For transcription factor staining, cells were fixed and permeabilized using a True Nuclear Transcription Factor buffer set (Biolegend) and stained for EOMES, RUNX3, T-bet or Histone 3 methylated at lysine 27 (H3K27me3; Cell Signaling). All the antibodies were used at a concentration of 1:50 in PBS containing 2% FBS. The antibody against H3K27me3 was used at 1:100 dilution. Data were acquired with a Gallios or CytoFLEX S flow cytometers (Beckman Coulter) and analyzed using Kaluza software (version 1.5a; Beckman Coulter).
Degranulation assay
Staining for CD107a (lysosome-associated membrane protein 1 [LAMP-1], a marker of CD8 T cell degranulation following stimulation (Betts et al., 2003), was used to quantify lytic granule exocytosis by flow cytometry (Kis-Toth et al., 2016). Briefly, cells (0.5×10⁶/well in 96-u plate) in cells stimulated with plate-coated immobilized CD3 (5 μg/ml) and CD28 (5 μg/ml) antibodies (both from Bio X Cell) for 5 hours. CD107a antibody (1:100, Biolegend) was added at the beginning along with Brefeldin A (Golgiplug, BD Bioscience). After stimulation, cells were stained with surface markers including CD107a, and the expression of CD107a was measured in flow cytometry. For experiments with EZH2 inhibitor (GSK126, Cayman Chemical), FACS-sorted CD8CD38low and CD8CD38high T cells from human primary cells were treated with GSK126 or DMSO, as control, overnight, and a degranulation assay was performed in the presence of the inhibitor.
In vitro cytotoxicity assay
In vitro cytotoxicity assay was performed as previously described (You et al., 2012; Zaritskaya et al., 2010). Briefly, FACS-sorted CD8CD38low and CD8CD38high T cells were resuspended at 5×10⁶/ml in culture medium. Target P815 cells were stained for 30 min with Pacific Orange to be distinguished (1 μg/ml, Thermo Fisher Scientific) and were incubated with CD3 and CD28 antibodies for 30min on ice (5 μg/ml) which allows P815 to activate CD8 T cells. CD8CD38low or CD38high T cells: P815 cells were cocultured for 2.5 hours at the ratio of 1:5. Cytotoxicity was analyzed by measuring the expression of Annexin V and Propidium Iodide stained cells by flow cytometry.
Western blotting, Immunoprecipitation, and NAD+ measurements
At least 1.5×10⁶ sorted CD8CD38low, CD38high T cells or CD8CD38low T cells overexpressing CD38 or GFP were lysed using RIPA buffer in the presence of protease inhibitors for 30min at 4°C for western blotting. After quantification, the same amount of protein was loaded from both CD38low and CD38high. Immunoprecipitation was performed following the protocol provided by Thermo Fisher Scientific. Briefly 10×106 of Jurkat CD38WT or Jurkat CD38KO were lysed in lysis/wash buffer. Total protein (600 μg) was incubated with anti-EZH2 (Cell Signaling) overnight at 4°C. The immune-complex was mixed with protein A/G beads and washed 3 times. Acetylation was detected by subsequent western blotting using an acetyl-lysine antibody (1:1000, Cell signaling). Images were analyzed using ImageJ. To measure NAD+, we used a colorimetric assay (NAD+/NADH quantitation kit, Sigma-Aldrich) using 2×10⁶ cell per point and following manufacturer protocol.
RNA Isolation and Quantitative PCR
RNeasy Mini Kit (QIAGEN) was used to extract total RNA. The following TaqMan probes (Thermo Fisher Scientific) were used to detect target genes CD38 Hs01120071_m1, TBX21 Hs00894392_m1, EOMES Hs00172872_m1, RUNX3 Hs01091094_m1, GZMB Hs00188051_m1, GZMA Hs00989184_m1, PRF1 Hs00169473_m1, GUSB Hs00939627_m1, and TBP Hs00427620_m1. Gene expression was assessed by the comparative CT method and normalized to the reference gene TBP and GUSB (Kono et al., 2018). We did not use GAPDH as endogeneous control because CD38, a NADase, may affect metabolism and change the expression of GAPDH.
Inhibitors
The Sirtuin1 inhibitor 6-Chloro-2,3,4,9-tetrahydro-1H-Carbazole-1-carboxamide (EX527) (Sigma-Aldrich) and the EZH2 inhibitor N-[(1,2-dihydro-4,6-dimethyl-2-oxo-3-pyridinyl)methyl]-3-methyl-1-[(1S)-1-methylpropyl]-6-[6-(1-piperazinyl)-3-pyridinyl]-1H-indole-4-carboxamide (GSK126, Cayman chemical) were used. Cells were incubated with these inhibitors overnight in culture medium at the indicated concentrations.
Omni-ATAC-seq (Assay for Transposase Accessible Chromatin with high-throughput sequencing)
To assay chromatin accessibility, we used 50,000 of sorted CD8CD38low, and CD38high T cells from two different healthy donors and two different SLE patients. Cells were once stocked in banbanker and thawed just before the ATAC-seq cell preparation. We followed the Omni-ATAC protocol (Corces et al., 2017) and deep sequencing was performed using PE35-bp reads on Illumina NextSeq500 at Boston Nutrition Obesity Research Center Functional Genomics Core.
ATAC-seq data was evaluated for quality using FASTQC (Andrews, 2010). Reads were filtered and trimmed with Atropos (Didion et al., 2017). High quality reads were mapped to the human genome (build GRcH37/hg19) using Bowtie2 (Langmead et al., 2009). After filtering reads from mitochondrial DNA, properly paired reads with high mapping quality (MAPQ score > 10, non-duplicates, qualified reads) were retained using Sambamba (Tarasov et al., 2015) for further analysis. The ‘alignmentSieve’ function of Deeptools (Ramírez et al., 2014) and ‘sort’ and ‘index’ functions of Samtools (Li et al., 2009) were used to isolate fragments in nucleosome free regions (NFRs). Reads were shifted by 9 bp (+4 in positive and [C0]5 in negative strand) to account for the dimeric binding of the Tn5 transposase that results in insertion of two adaptors separated by 9 bp. To call the peaks with unique reads, we used MACS2 (Zhang et al., 2008) followed by a quality check with the ChIPQC Bioconductor package (Carroll et al., 2014). CPM-normalized bigwig files (bin size = 20) were visualized using IGV (Robinson et al., 2011).
Differential binding between CD38high and CD38low samples in SLE patients and healthy subjects was assessed with Diffbind (Stark and Brown, 2011) using DESeq2 (Love et al., 2014) and including sample preparation date in the model. Peaks were filtered at FDR < 0.05 and |log2 fold change| > 1 to obtain significant peaks.
QUANTIFICATION AND STATISTICAL ANALYSIS
Student’s t test with or without Welch’s correction, Kolmogorov-Smirnov test, paired hi or Wilcoxon Signed Rank Test were used for statistical comparisons between two groups depending on the characteristics of the population. Data are represented as mean ± SD (standard deviation). The association between the proportion of CD8CD38high T cells and infection rates was evaluated by Chi square test. Pearson’s correlation was used to detect linear relationship between two variables. Correlation between degranulation and % CD8CD38high T cells was searched by linear regression. GraphPad Prism (version 6) was used for statistical analysis. P value is defined as follows; * p < 0.05, ** p < 0.01; *** p < 0.001, **** p < 0.0001.
DATA AND CODE AVAILABILITY
The ATAC-seq data generated during this study are available in Gene Expression Omnibus (GEO). The accession number is GSE141197.
Supplementary Material
KEY RESOURCES TABLE
| REAGENT or RESOURCE | SOURCE | IDENTIFIER |
|---|---|---|
| Antibodies | ||
| PE/Cy7 anti-human CD38 antibody | Biolegend | Cat# 303516, RRID:AB_2072782 |
| Mouse IgG1 kappa Isotype Control PE / Cyanine 7 | Biolegend | Cat# 400126, RRID:AB_326448 |
| Pacific Blue anti-human CD45RA antibody | Biolegend | Cat# 304118, RRID:AB_493657 |
| APC/Cyanine7 anti-human CD197 (CCR7) antibody | Biolegend | Cat# 353212, RRID:AB_10916390 |
| Alexa Fluor® 700 anti-human CD8a antibody | Biolegend | Cat# 301028, RRID:AB_493745 |
| PE anti-human CD107a (LAMP-1) antibody | Biolegend | Cat# 328608, RRID:AB_1186040 |
| CD279 (PD-1) Monoclonal Antibody (MIH4) | eBioscience | Cat# 17-9969-42, RRID:AB_10718533 |
| Alexa Fluor® 700 anti-human CD8a antibody | Biolegend | Cat# 301028, RRID:AB_493745 |
| Alexa Fluor® 700 anti-human Granzyme A antibody | Biolegend | Cat# 507210, RRID:AB_961343 |
| Granzyme B antibody | eBioscience | Cat# 563388, RRID:AB_2738174 |
| Perforin antibody | BD Biosciences | Cat# 563762, RRID:AB_2738409 |
| PE anti-human CD107a (LAMP-1) antibody | Biolegend | Cat# 328608, RRID:AB_1186040 |
| PE anti-human IFN-gamma antibody | Biolegend | Cat# 502509, RRID:AB_315234 |
| APC anti-human CD3 antibody | Biolegend | Cat# 300439, RRID:AB_2562045 |
| Tri-Methyl-Histone H3 (Lys27) (C36B11) Rabbit mAb (Alexa FluorR 647 Conjugate) | Cell Signaling Technology | Cat# 12158S, RRID:AB_2797834 |
| Acetylated-Lysine Antibody | Cell Signaling Technology | Cat# 9441S, RRID:AB_331805 |
| Ezh2 (AC22) Mouse mAb | Cell Signaling Technology | Cat# 3147S, RRID:AB_10694383 |
| Runx3 human antibody PE | BD Biosciences | Cat# 564814, RRID:AB_2738969 |
| EOMES Monoclonal Antibody (WD1928), PE | eBioscience | Cat# 12-4877-42, RRID:AB_2572615 |
| Alexa Fluor® 647 anti-T-bet antibody | Biolegend | Cat# 644804, RRID:AB_1595466 |
| FITC anti-human CD223 (LAG-3) antibody | Biolegend | Cat# 369308, RRID:AB_2629751 |
| APC anti-human HLA-DR antibody | Biolegend | Cat# 307610, RRID:AB_314688 |
| PE anti-human TIGIT (VSTM3) antibody | Biolegend | Cat# 372704, RRID:AB_2632730 |
| PE anti-human CD158 (KIR2DL1/S1/S3/S5) antibody | Biolegend | Cat# 339505, RRID:AB_2130376 |
| Anti-KAT3B / p300 antibody | abcam | Cat# Ab10485, RRID:AB_297224 |
| IL-17A Monoclonal Antibody (eBio64DEC17) | Cat# 17-7179-42, RRID:AB_1582221 | |
| FITC anti-human IL-4 antibody | Biolegend | Cat# 500807, RRID:AB_315126 |
| PE anti-human IL-13 antibody | Biolegend | Cat# 501903, RRID:AB_315198 |
| IL-10 Monoclonal Antibody (JES3–9D7) | eBioscience | Cat# 50-7108-42, RRID:AB_11149363 |
| anti-human CD3 (OKT3) | Bio X Cell | Cat# BE0001–2, RRID:AB_1107632 |
| LEAF(TM) Purified anti-human CD28 antibody | Biolegend | Cat# 302923, RRID:AB_2291210 |
| Chemicals, Peptides, and Recombinant Proteins | ||
| LentiCas9-Blast | ATCC | Cat# 52962 |
| pSPgRNA | ATCC | Cat# 47108 |
| GSK126 | Cayman Chemical | Cat# 15415 |
| EX527 | Sigma-Aldrich | Cat# E7034 |
| Pacific Orange Succinimidyl Ester | Thermo Fisher Scientific | Cat# P30253 |
| Critical Commercial Assays | ||
| NAD+/NADH quantitation kit | Sigma-Aldrich | Cat# MAK037–1KT |
| BD Cytofix/Cytoperm Fixation/Permeabilization Solution Kit | BD Biosciences | Cat# 554714 |
| Pierce Classic Magnetic IP/Co-IP Kit | Thermo Fisher Scientific | Cat# 888804 |
| RosetteSep Human CD8+ T Cell Enrichment Cocktail | Stem Cell technologies | Cat# 15063 |
| RosetteSep Human T Cell Enrichment Cocktail | Stem Cell technologies | Cat# 15061 |
| Cell Line Nucleofector™ Kit V | Lonza | Cat# VVCA-1003 |
| Human T Cell Nucleofector™ Kit | Lonza | Cat# VPA-1002 |
| RNeasy Plus Mini kit | QIAGEN | Cat# 74134 |
| Lymphocyte Separation Medium | Corning | Cat# 25–072-CV |
| Deposited Data | ||
| Raw and analyzed ATAC-seq data | This paper | GEO: GSE141197 |
| Experimental Models: Cell Lines | ||
| Jurkat E6.1 | ATCC | CLS Cat# 300223 RRID:CVCL_0367 |
| TALL-104 | ATCC | CRL-11386 |
| P815 | ATCC | Cat# TIB-64 |
| Oligonucleotides | ||
| CD38 Hs01120071_m1 | Thermo Fisher Scientific | Cat# 4331182 |
| TBX21 Hs00894392_m1 | Thermo Fisher Scientific | Cat# 4331182 |
| EOMES Hs00172872_m1 | Thermo Fisher Scientific | Cat# 4331182 |
| RUNX3 Hs01091094_m1 | Thermo Fisher Scientific | Cat# 4331182 |
| GZMB Hs00188051_m1 | Thermo Fisher Scientific | Cat# 4331182 |
| GZMA Hs00989184_m1 | Thermo Fisher Scientific | Cat# 4331182 |
| PRF1 Hs00169473_m1 | Thermo Fisher Scientific | Cat# 4331182 |
| GUSB Hs00939627_m1 | Thermo Fisher Scientific | Cat# 4331182 |
| TBP Hs00427620_m1 | Thermo Fisher Scientific | Cat# 4331182 |
| Recombinant DNA | ||
| CD38 cDNA ORF Clone, Human, C-Myc tag | Sino Biological | Cat# HG10818-CM |
| pmaxGFP | Lonza | Cat# VPA-1002 |
| pCMV3-C-Myc Negative Control Vector | Sino Biological | Cat# CV014 |
| Software and Algorithms | ||
| Kaluza software | Beckman Coulter | version 1.5a |
| Prism version 6 | GraphPad | https://www.graphpad.com/ |
| ImageJ | NIH | https://imagej.nih.gov/ij/ |
| CHOPCHOP | N/A | http://chopchop.cbu.uib.no/ |
Highlights.
Expanded CD8CD38high T cells in SLE patients identify patients with infections
CD8CD38high T cells express decreased amounts of cytotoxic molecules
CD38 decreases NAD+ and SIRT1 activity and releases the activity of EZH2
Inhibition of EZH2 restores the degranulation capacity of CD8CD38high T cells
ACKNOWLEDGMENTS
This work was supported by National Institutes of Health (NIH) grants RO1 AI42269 and RO1 AI148161 to G.C.T. We are also extremely grateful to all patients participating in our ongoing SLE studies.
Footnotes
SUPPLEMENTAL INFORMATION
Supplemental Information can be found online at https://doi.org/10.1016/j.celrep.2019.12.014.
DECLARATION OF INTERESTS
G.C.T. is on the Scientific Advisory Board (SAB) of A2 Therapeutics, ABPRO, and CUGENE and has received research grants from Janssen and Pfizer.
REFERENCES
- Aarhus R, Graeff RM, Dickey DM, Walseth TF, and Lee HC (1995). ADP-ribosyl cyclase and CD38 catalyze the synthesis of a calcium-mobilizing metabolite from NADP. J. Biol. Chem 270, 30327–30333. [DOI] [PubMed] [Google Scholar]
- Aksoy P, White TA, Thompson M, and Chini EN (2006). Regulation of intracellular levels of NAD: a novel role for CD38. Biochem. Biophys. Res. Commun 345, 1386–1392. [DOI] [PubMed] [Google Scholar]
- Alcocer-Varela J, Alarcón-Riquelme M, Laffón A, Sánchez-Madrid F, and Alarcón-Segovia D (1991). Activation markers on peripheral blood T cells from patients with active or inactive systemic lupus erythematosus. Correlation with proliferative responses and production of IL-2. J. Autoimmun 4, 935–945. [DOI] [PubMed] [Google Scholar]
- Andrews S (2010). FastQC: a quality control tool for high throughput sequence data. Available online. http://www.bioinformatics.babraham.ac.uk/projects/fastqc.
- Arbuckle JH, Gardina PJ, Gordon DN, Hickman HD, Yewdell JW, Pierson TC, Myers TG, and Kristie TM (2017). Inhibitors of the Histone Methyltransferases EZH2/1 Induce a Potent Antiviral State and Suppress Infection by Diverse Viral Pathogens. MBio 8, Published online August 15, 2017. 10.1128/mBio.01141-17. [DOI] [PMC free article] [PubMed] [Google Scholar]
- Bernstein BE, Mikkelsen TS, Xie X, Kamal M, Huebert DJ, Cuff J, Fry B, Meissner A, Wernig M, Plath K, et al. (2006). A bivalent chromatin structure marks key developmental genes in embryonic stem cells. Cell 125, 315–326. [DOI] [PubMed] [Google Scholar]
- Betts MR, Brenchley JM, Price DA, De Rosa SC, Douek DC, Roederer M, and Koup RA (2003). Sensitive and viable identification of antigen-specific CD8+ T cells by a flow cytometric assay for degranulation. J. Immunol. Methods 281, 65–78. [DOI] [PubMed] [Google Scholar]
- Blair PA, Noreña LY, Flores-Borja F, Rawlings DJ, Isenberg DA, Ehrenstein MR, and Mauri C (2010). CD19(+)CD24(hi)CD38(hi) B cells exhibit regulatory capacity in healthy individuals but are functionally impaired in systemic Lupus Erythematosus patients. Immunity 32, 129–140. [DOI] [PubMed] [Google Scholar]
- Bombardier C, Gladman DD, Urowitz MB, Caron D, and Chang CH; The Committee on Prognosis Studies in SLE (1992). Derivation of the SLEDAI. A disease activity index for lupus patients. Arthritis Rheum. 35, 630–640. [DOI] [PubMed] [Google Scholar]
- Booiman T, Wit FW, Girigorie AF, Maurer I, De Francesco D, Sabin CA, Harskamp AM, Prins M, Franceschi C, Deeks SG, et al. ; ComorBidity in Relation to Aids (COBRA) Collaboration (2017). Terminal differentiation of T cells is strongly associated with CMV infection and increased in HIV-positive individuals on ART and lifestyle matched controls. PLoS ONE 12, e0183357. [DOI] [PMC free article] [PubMed] [Google Scholar]
- Bradley SJ, Suarez-Fueyo A, Moss DR, Kyttaris VC, and Tsokos GC (2015). T Cell Transcriptomes Describe Patient Subtypes in Systemic Lupus Erythematosus. PLoS ONE 10, e0141171. [DOI] [PMC free article] [PubMed] [Google Scholar]
- Buggert M, Tauriainen J, Yamamoto T, Frederiksen J, Ivarsson MA, Michaëlsson J, Lund O, Hejdeman B, Jansson M, Sönnerborg A, et al. (2014). T-bet and Eomes are differentially linked to the exhausted phenotype of CD8+ T cells in HIV infection. PLoS Pathog. 10, e1004251. [DOI] [PMC free article] [PubMed] [Google Scholar]
- Cantó C, and Auwerx J (2012). Targeting sirtuin 1 to improve metabolism: all you need is NAD(+)? Pharmacol. Rev 64, 166–187. [DOI] [PMC free article] [PubMed] [Google Scholar]
- Cantó C, Menzies KJ, and Auwerx J (2015). NAD(+) Metabolism and the Control of Energy Homeostasis: A Balancing Act between Mitochondria and the Nucleus. Cell Metab. 22, 31–53. [DOI] [PMC free article] [PubMed] [Google Scholar]
- Carroll TS, Liang Z, Salama R, Stark R, and de Santiago I (2014). Impact of artifact removal on ChIP quality metrics in ChIP-seq and ChIP-exo data. Front. Genet 5, 75. [DOI] [PMC free article] [PubMed] [Google Scholar]
- Chatterjee S, Daenthanasanmak A, Chakraborty P, Wyatt MW, Dhar P, Selvam SP, Fu J, Zhang J, Nguyen H, Kang I, et al. (2018). CD38-NAD(+) Axis Regulates Immunotherapeutic Anti-Tumor T Cell Response. Cell Metab 27, 85–100. [DOI] [PMC free article] [PubMed] [Google Scholar]
- Chini EN (2009). CD38 as a regulator of cellular NAD: a novel potential pharmacological target for metabolic conditions. Curr. Pharm. Des 15, 57–63. [DOI] [PMC free article] [PubMed] [Google Scholar]
- Comte D, Karampetsou MP, Yoshida N, Kis-Toth K, Kyttaris VC, and Tsokos GC (2017). Signaling Lymphocytic Activation Molecule Family Member 7 Engagement Restores Defective Effector CD8+ T Cell Function in Systemic Lupus Erythematosus. Arthritis Rheumatol. 69, 1035–1044. [DOI] [PMC free article] [PubMed] [Google Scholar]
- Corces MR, Trevino AE, Hamilton EG, Greenside PG, Sinnott-Armstrong NA, Vesuna S, Satpathy AT, Rubin AJ, Montine KS, Wu B, et al. (2017). An improved ATAC-seq protocol reduces background and enables interrogation of frozen tissues. Nat. Methods 14, 959–962. [DOI] [PMC free article] [PubMed] [Google Scholar]
- Cruz-Guilloty F, Pipkin ME, Djuretic IM, Levanon D, Lotem J, Lichten-held MG, Groner Y, and Rao A (2009). Runx3 and T-box proteins cooperate to establish the transcriptional program of effector CTLs. J. Exp. Med 206, 51–59. [DOI] [PMC free article] [PubMed] [Google Scholar]
- D’Arena G, Musto P, Cascavilla N, Dell’Olio M, Di Renzo N, Perla G, Savino L, and Carotenuto M (2001). CD38 expression correlates with adverse biological features and predicts poor clinical outcome in B-cell chronic lymphocytic leukemia. Leuk. Lymphoma 42, 109–114. [DOI] [PubMed] [Google Scholar]
- Danza A, and Ruiz-Irastorza G (2013). Infection risk in systemic lupus erythematosus patients: susceptibility factors and preventive strategies. Lupus 22, 1286–1294. [DOI] [PubMed] [Google Scholar]
- Dentone C, Fenoglio D, Schenone E, Cenderello G, Prinapori R, Signori A, Parodi A, Kalli F, Battaglia F, Feasi M, et al. (2015). Increased CD38 expression on T lymphocytes as a marker of HIV dissemination into the central nervous system. HIV Clin. Trials 16, 190–196. [DOI] [PubMed] [Google Scholar]
- Deshpande DA, White TA, Guedes AG, Milla C, Walseth TF, Lund FE, and Kannan MS (2005). Altered airway responsiveness in CD38-deficient mice. Am. J. Respir. Cell Mol. Biol 32, 149–156. [DOI] [PubMed] [Google Scholar]
- Didion JP, Martin M, and Collins FS (2017). Atropos: specific, sensitive, and speedy trimming of sequencing reads. PeerJ 5, e3720. [DOI] [PMC free article] [PubMed] [Google Scholar]
- Erkeller-Yuksel FM, Lydyard PM, and Isenberg DA (1997). Lack of NK cells in lupus patients with renal involvement. Lupus 6, 708–712. [DOI] [PubMed] [Google Scholar]
- Feng M, Zhang SL, Liang ZJ, Wang YL, Zhao XC, Gao C, Guo H, and Luo J (2019). Peripheral neutrophil CD64 index combined with complement, CRP, WBC count and B cells improves the ability of diagnosing bacterial infection in SLE. Lupus 28, 304–316. [DOI] [PubMed] [Google Scholar]
- Fors Nieves CE, and Izmirly PM (2016). Mortality in Systemic Lupus Erythematosus: an Updated Review. Curr. Rheumatol. Rep 18, 21. [DOI] [PubMed] [Google Scholar]
- Fujii S, Ito K, Ito Y, and Ochiai A (2008). Enhancer of zeste homologue 2 (EZH2) down-regulates RUNX3 by increasing histone H3 methylation. J. Biol. Chem 283, 17324–17332. [DOI] [PMC free article] [PubMed] [Google Scholar]
- Gertz M, Fischer F, Nguyen GT, Lakshminarasimhan M, Schutkowski M, Weyand M, and Steegborn C (2013). Ex-527 inhibits Sirtuins by exploiting their unique NAD+-dependent deacetylation mechanism. Proc. Natl. Acad. Sci. USA 110, E2772–E2781. [DOI] [PMC free article] [PubMed] [Google Scholar]
- He S, Liu Y, Meng L, Sun H, Wang Y, Ji Y, Purushe J, Chen P, Li C, Madzo J, et al. (2017). Ezh2 phosphorylation state determines its capacity to maintain CD8+ T memory precursors for antitumor immunity. Nat. Commun 8, 2125. [DOI] [PMC free article] [PubMed] [Google Scholar]
- Horenstein AL, Bracci C, Morandi F, and Malavasi F (2019). CD38 in Adenosinergic Pathways and Metabolic Re-programming in Human Multiple Myeloma Cells: In-tandem Insights From Basic Science to Therapy. Front. Immunol 10, 760. [DOI] [PMC free article] [PubMed] [Google Scholar]
- Hua S, Lécuroux C, Sáez-Cirión A, Pancino G, Girault I, Versmisse P, Boufassa F, Taulera O, Sinet M, Lambotte O, and Venet A (2014). Potential role for HIV-specific CD38-/HLA-DR+ CD8+ T cells in viral suppression and cytotoxicity in HIV controllers. PLoS ONE 9, e101920. [DOI] [PMC free article] [PubMed] [Google Scholar]
- Iliopoulos AG, and Tsokos GC (1996). Immunopathogenesis and spectrum of infections in systemic lupus erythematosus. Semin. Arthritis Rheum 25, 318–336. [DOI] [PubMed] [Google Scholar]
- Jeng MY, Hull PA, Fei M, Kwon HS, Tsou CL, Kasler H, Ng CP, Gordon DE, Johnson J, Krogan N, et al. (2018). Metabolic reprogramming of human CD8+ memory T cells through loss of SIRT1. J. Exp. Med 215, 51–62. [DOI] [PMC free article] [PubMed] [Google Scholar]
- Kang I, Quan T, Nolasco H, Park SH, Hong MS, Crouch J, Pamer EG, Howe JG, and Craft J (2004). Defective control of latent Epstein-Barr virus infection in systemic lupus erythematosus. J. Immunol 172, 1287–1294. [DOI] [PubMed] [Google Scholar]
- Kis-Toth K, Comte D, Karampetsou MP, Kyttaris VC, Kannan L, Terhorst C, and Tsokos GC (2016). Selective Loss of Signaling Lymphocytic Activation Molecule Family Member 4-Positive CD8+ T Cells Contributes to the Decreased Cytotoxic Cell Activity in Systemic Lupus Erythematosus. Arthritis Rheumatol. 68, 164–173. [DOI] [PMC free article] [PubMed] [Google Scholar]
- Kono M, Yoshida N, Maeda K, and Tsokos GC (2018). Transcriptional factor ICER promotes glutaminolysis and the generation of Th17 cells. Proc. Natl. Acad. Sci. USA 115, 2478–2483. [DOI] [PMC free article] [PubMed] [Google Scholar]
- Langmead B, Trapnell C, Pop M, and Salzberg SL (2009). Ultrafast and memory-efficient alignment of short DNA sequences to the human genome. Genome Biol. 10, R25. [DOI] [PMC free article] [PubMed] [Google Scholar]
- Larsen M, Sauce D, Deback C, Arnaud L, Mathian A, Miyara M, Boutolleau D, Parizot C, Dorgham K, Papagno L, et al. (2011). Exhausted cytotoxic control of Epstein-Barr virus in human lupus. PLoS Pathog. 7, e1002328. [DOI] [PMC free article] [PubMed] [Google Scholar]
- Leu CM, Hsu TS, Kuo YP, Lai MZ, Liu PC, Chen MH, Chang DM, Tsai CY, and Chen MH (2019). Deltex1 suppresses T cell function and is a biomarker for diagnosis and disease activity of systemic lupus erythematosus. Rheumatology (Oxford) 58, 719–728. [DOI] [PubMed] [Google Scholar]
- Li H, Handsaker B, Wysoker A, Fennell T, Ruan J, Homer N, Marth G, Abecasis G, and Durbin R; 1000 Genome Project Data Processing Sub-group (2009). The Sequence Alignment/Map format and SAMtools. Bioinformatics 25, 2078–2079. [DOI] [PMC free article] [PubMed] [Google Scholar]
- Li J, He Y, Hao J, Ni L, and Dong C (2018). High Levels of Eomes Promote Exhaustion of Anti-tumor CD8+ T Cells. Front. Immunol 9, 2981. [DOI] [PMC free article] [PubMed] [Google Scholar]
- Lieberman LA, and Tsokos GC (2014). Lupus-prone mice fail to raise antigen-specific T cell responses to intracellular infection. PLoS ONE 9, e111382. [DOI] [PMC free article] [PubMed] [Google Scholar]
- Love MI, Huber W, and Anders S (2014). Moderated estimation of fold change and dispersion for RNA-seq data with DESeq2. Genome Biol. 15, 550. [DOI] [PMC free article] [PubMed] [Google Scholar]
- Malavasi F, Funaro A, Alessio M, DeMonte LB, Ausiello CM, Dianzani U, Lanza F, Magrini E, Momo M, and Roggero S (1992). CD38: a multi-lineage cell activation molecule with a split personality. Int. J. Clin. Lab. Res 22, 73–80. [DOI] [PubMed] [Google Scholar]
- Malavasi F, Deaglio S, Funaro A, Ferrero E, Horenstein AL, Ortolan E, Vaisitti T, and Aydin S (2008). Evolution and function of the ADP ribosyl cyclase/CD38 gene family in physiology and pathology. Physiol. Rev 88, 841–886. [DOI] [PubMed] [Google Scholar]
- Matalonga J, Glaria E, Bresque M, Escande C, Carbó JM, Kiefer K, Vicente R, León TE, Beceiro S, Pascual-García M, et al. (2017). The Nuclear Receptor LXR Limits Bacterial Infection of Host Macrophages through a Mechanism that Impacts Cellular NAD Metabolism. Cell Rep. 18, 1241–1255. [DOI] [PubMed] [Google Scholar]
- McCabe MT, Ott HM, Ganji G, Korenchuk S, Thompson C, Van Aller GS, Liu Y, Graves AP, Della Pietra A 3rd, Diaz E, et al. (2012). EZH2 inhibition as a therapeutic strategy for lymphoma with EZH2-activating mutations. Nature 492, 108–112. [DOI] [PubMed] [Google Scholar]
- McKinney EF, Lee JC, Jayne DR, Lyons PA, and Smith KG (2015). T-cell exhaustion, co-stimulation and clinical outcome in autoimmunity and infection. Nature 523, 612–616. [DOI] [PMC free article] [PubMed] [Google Scholar]
- Morandi F, Morandi B, Horenstein AL, Chillemi A, Quarona V, Zaccarello G, Carrega P, Ferlazzo G, Mingari MC, Moretta L, et al. (2015). A non-canonical adenosinergic pathway led by CD38 in human melanoma cells induces suppression of T cell proliferation. Oncotarget 6, 25602–25618. [DOI] [PMC free article] [PubMed] [Google Scholar]
- Morandi F, Horenstein AL, Rizzo R, and Malavasi F (2018). The Role of Extracellular Adenosine Generation in the Development of Autoimmune Diseases. Mediators Inflamm. 2018, 7019398. [DOI] [PMC free article] [PubMed] [Google Scholar]
- Murphy KA, Bhamidiphati K, Rubin SJS, Kipp L, Robinson WH, and Lanz TV (2019). Immunomodulatory receptors are differentially expressed in B and T cells subsets relevant to autoimmune disease. Clin. Immunol 209, 108276. [DOI] [PubMed] [Google Scholar]
- Naidoo J, Page DB, Li BT, Connell LC, Schindler K, Lacouture ME, Postow MA, and Wolchok JD (2016). Toxicities of the anti-PD-1 and anti-PD-L1 immune checkpoint antibodies. Ann. Oncol 27, 1362. [DOI] [PMC free article] [PubMed] [Google Scholar]
- Ospina FE, Echeverri A, Zambrano D, Suso JP, Martínez-Blanco J, Cañas CA, and Tobón GJ (2017). Distinguishing infections vs flares in patients with systemic lupus erythematosus. Rheumatology (Oxford) 56 (suppl_1), i46–i54. [DOI] [PubMed] [Google Scholar]
- Pannus P, Adams P, Willems E, Heyndrickx L, Florence E, Rutsaert S, De Spiegelaere W, Vandekerckhove L, Seguin-Devaux C, and Vanham G (2019). In-vitro viral suppressive capacity correlates with immune checkpoint marker expression on peripheral CD8+ T cells in treated HIV-positive patients. AIDS 33, 387–398. [DOI] [PubMed] [Google Scholar]
- Partida-Sánchez S, Cockayne DA, Monard S, Jacobson EL, Oppenheimer N, Garvy B, Kusser K, Goodrich S, Howard M, Harmsen A, et al. (2001). Cyclic ADP-ribose production by CD38 regulates intracellular calcium release, extracellular calcium influx and chemotaxis in neutrophils and is required for bacterial clearance in vivo. Nat. Med 7, 1209–1216. [DOI] [PubMed] [Google Scholar]
- Partida-Sánchez S, Goodrich S, Kusser K, Oppenheimer N, Randall TD, and Lund FE (2004). Regulation of dendritic cell trafficking by the ADP-ribosyl cyclase CD38: impact on the development of humoral immunity. Immunity 20, 279–291. [DOI] [PubMed] [Google Scholar]
- Pavón EJ, Muñoz P, Navarro MD, Raya-Alvarez E, Callejas-Rubio JL, Navarro-Pelayo F, Ortego-Centeno N, Sancho J, and Zubiaur M (2006). Increased association of CD38 with lipid rafts in T cells from patients with systemic lupus erythematosus and in activated normal T cells. Mol. Immunol 43, 1029–1039. [DOI] [PubMed] [Google Scholar]
- Pavón EJ, Zumaquero E, Rosal-Vela A, Khoo KM, Cerezo-Wallis D, García-Rodríguez S, Carrascal M, Abian J, Graeff R, Callejas-Rubio JL, et al. (2013). Increased CD38 expression in T cells and circulating anti-CD38 IgG autoantibodies differentially correlate with distinct cytokine profiles and disease activity in systemic lupus erythematosus patients. Cytokine 62, 232–243. [DOI] [PubMed] [Google Scholar]
- Pearce EL, Mullen AC, Martins GA, Krawczyk CM, Hutchins AS, Zediak VP, Banica M, DiCioccio CB, Gross DA, Mao CA, et al. (2003). Control of effector CD8+ T cell function by the transcription factor Eomesodermin. Science 302, 1041–1043. [DOI] [PubMed] [Google Scholar]
- Perl A (2013). Oxidative stress in the pathology and treatment of systemic lupus erythematosus. Nat. Rev. Rheumatol 9, 674–686. [DOI] [PMC free article] [PubMed] [Google Scholar]
- Ramírez F, Dündar F, Diehl S, Grüning BA, and Manke T (2014). deep-Tools: a flexible platform for exploring deep-sequencing data. Nucleic Acids Res. 42, W187–W191. [DOI] [PMC free article] [PubMed] [Google Scholar]
- Robinson JT, Thorvaldsdóttir H, Winckler W, Guttman M, Lander ES, Getz G, and Mesirov JP (2011). Integrative genomics viewer. Nat. Biotechnol 29, 24–26. [DOI] [PMC free article] [PubMed] [Google Scholar]
- Rodrigues DS, Medeiros EA, Weckx LY, Bonnez W, Salomão R, and Kallas EG (2002). Immunophenotypic characterization of peripheral T lymphocytes in Mycobacterium tuberculosis infection and disease. Clin. Exp. Immunol 128, 149–154. [DOI] [PMC free article] [PubMed] [Google Scholar]
- Rohraff DM, He Y, Farkash EA, Schonfeld M, Tsou PS, and Sawalha AH (2019). Inhibition of EZH2 Ameliorates Lupus-Like Disease in MRL/lpr Mice. Arthritis Rheumatol 71, 1681–1690. [DOI] [PMC free article] [PubMed] [Google Scholar]
- Sauve AA, Wolberger C, Schramm VL, and Boeke JD (2006). The biochemistry of sirtuins. Annu. Rev. Biochem 75, 435–465. [DOI] [PubMed] [Google Scholar]
- Savarino A, Bottarel F, Malavasi F, and Dianzani U (2000). Role of CD38 in HIV-1 infection: an epiphenomenon of T-cell activation or an active player in virus/host interactions? AIDS 14, 1079–1089. [DOI] [PubMed] [Google Scholar]
- Scharer CD, Barwick BG, Guo M, Bally APR, and Boss JM (2018). Plasma cell differentiation is controlled by multiple cell division-coupled epigenetic programs. Nat. Commun 9, 1698. [DOI] [PMC free article] [PubMed] [Google Scholar]
- Shan Q, Zeng Z, Xing S, Li F, Hartwig SM, Gullicksrud JA, Kurup SP, Van Braeckel-Budimir N, Su Y, Martin MD, et al. (2017). The transcription factor Runx3 guards cytotoxic CD8+ effector T cells against deviation towards follicular helper T cell lineage. Nat. Immunol 18, 931–939. [DOI] [PMC free article] [PubMed] [Google Scholar]
- Shrishrimal S, Kosmacek EA, and Oberley-Deegan RE (2019). Reactive Oxygen Species Drive Epigenetic Changes in Radiation-Induced Fibrosis. Oxid. Med. Cell. Longev 2019, 4278658. [DOI] [PMC free article] [PubMed] [Google Scholar]
- Stark R, and Brown G (2011). DiffBind: differential binding analysis of ChIP-Seq peak data. http://bioconductor.org/packages/release/bioc/vignettes/DiffBind/inst/doc/DiffBind.pdf.
- Stohl W (1995). Impaired polyclonal T cell cytolytic activity. A possible risk factor for systemic lupus erythematosus. Arthritis Rheum. 38, 506–516. [DOI] [PubMed] [Google Scholar]
- Szabo SJ, Sullivan BM, Stemmann C, Satoskar AR, Sleckman BP, and Glimcher LH (2002). Distinct effects of T-bet in TH1 lineage commitment and IFN-gamma production in CD4 and CD8 T cells. Science 295, 338–342. [DOI] [PubMed] [Google Scholar]
- Tan EM, Cohen AS, Fries JF, Masi AT, McShane DJ, Rothfield NF, Schaller JG, Talal N, and Winchester RJ (1982). The 1982 revised criteria for the classification of systemic lupus erythematosus. Arthritis Rheum. 25, 1271–1277. [DOI] [PubMed] [Google Scholar]
- Tarasov A, Vilella AJ, Cuppen E, Nijman IJ, and Prins P (2015). Sambamba: fast processing of NGS alignment formats. Bioinformatics 31, 2032–2034. [DOI] [PMC free article] [PubMed] [Google Scholar]
- Tong Q, He S, Xie F, Mochizuki K, Liu Y, Mochizuki I, Meng L, Sun H, Zhang Y, Guo Y, et al. (2014). Ezh2 regulates transcriptional and posttranslational expression of T-bet and promotes Th1 cell responses mediating aplastic anemia in mice. J. Immunol 192, 5012–5022. [DOI] [PMC free article] [PubMed] [Google Scholar]
- Tsokos GC, Magrath IT, and Balow JE (1983). Epstein-Barr virus induces normal B cell responses but defective suppressor T cell responses in patients with systemic lupus erythematosus. J. Immunol 131, 1797–1801. [PubMed] [Google Scholar]
- Viegas MS, Silva T, Monteiro MM, do Carmo A, and Martins TC (2011). Knocking out of CD38 accelerates development of a lupus-like disease in lpr mice. Rheumatology (Oxford) 50, 1569–1577. [DOI] [PubMed] [Google Scholar]
- Wan J, Zhan J, Li S, Ma J, Xu W, Liu C, Xue X, Xie Y, Fang W, Chin YE, and Zhang H (2015). PCAF-primed EZH2 acetylation regulates its stability and promotes lung adenocarcinoma progression. Nucleic Acids Res. 43, 3591–3604. [DOI] [PMC free article] [PubMed] [Google Scholar]
- You Q, Wu Y, Wu Y, Wei W, Wang C, Jiang D, Yu X, Zhang X, Wang Y, Tang Z, et al. (2012). Immunogenicity and protective efficacy of heterologous prime-boost regimens with mycobacterial vaccines and recombinant adenovirus- and poxvirus-vectored vaccines against murine tuberculosis. Int. J. Infect. Dis 16, e816–e825. [DOI] [PubMed] [Google Scholar]
- Zaritskaya L, Shurin MR, Sayers TJ, and Malyguine AM (2010). New flow cytometric assays for monitoring cell-mediated cytotoxicity. Expert Rev. Vaccines 9, 601–616. [DOI] [PMC free article] [PubMed] [Google Scholar]
- Zhang Y, Liu T, Meyer CA, Eeckhoute J, Johnson DS, Bernstein BE, Nusbaum C, Myers RM, Brown M, Li W, and Liu XS (2008). Model-based analysis of ChIP-Seq (MACS). Genome Biol. 9, R137. [DOI] [PMC free article] [PubMed] [Google Scholar]
- Zidovec Lepej S, Vince A, Dakovic Rode O, Remenar A, and Jeren T (2003). Increased numbers of CD38 molecules on bright CD8+ T lymphocytes in infectious mononucleosis caused by Epstein-Barr virus infection. Clin. Exp. Immunol 133, 384–390. [DOI] [PMC free article] [PubMed] [Google Scholar]
Associated Data
This section collects any data citations, data availability statements, or supplementary materials included in this article.
Supplementary Materials
Data Availability Statement
The ATAC-seq data generated during this study are available in Gene Expression Omnibus (GEO). The accession number is GSE141197.