Abstract
Cherenkov emission induced by external beam radiation from a clinical linear accelerator (LINAC) has been shown in preclinical molecular imaging and clinical imaging. The broad spectrum Cherenkov emission should have a short wavelength infrared (SWIR, 1000–1700 nm) component, as predicted theoretically. This report is the first experimental observation of this SWIR Cherenkov emission, induced by external beam radiation. The measured spectrum of SWIR Cherenkov emission matches the theoretical prediction, with a fluence rate near 1/3 of the visible and near infrared red emissions (Vis-NIR, 400-900 nm). Imaging in water based phantoms and biological tissues indicates that there is sufficient fluence rate for radiotherapy dosimetry applications. The spatial resolution is improved approximately 5.3 times with SWIR Cherenkov emission detection versus Vis-NIR Cherenkov emission, which provides some improvement in the potential for higher resolution Cherenkov emission dosimetry and molecular sensing during clinical radiotherapy by imaging with SWIR wavelengths.
OCIS codes: (170.3880) Medical and biological imaging, (260.3800) Luminescence, Cerenkov
Cherenkov emission is an electromagnetic radiation induced by charged particles passing through a dielectric medium at a speed greater than the phase velocity of light in that medium, which was first reported in 1934 by Pavel A Cherenkov [1]. Recently it was demonstrated that Cherenkov emission induced by MeV energies photons or electrons from a linear accelerator can be detected by optical imaging systems [2]. In this study, the demonstration of short wave near infrared (SWIR) emission is shown in water as well as biological tissues, as is theoretically predicted by the Frank-Tamm equation. This could allow for deeper tissue signal sampling of Cherenkov emission, with higher spatial resolution and lower auto-fluorescence signal.
Cherenkov emission imaging during irradiation with a clinical linear accelerator (LINAC) provides the potential for direct visualization of position, shape and dose of radiation beam during radiation therapy, in water tanks, tissue phantoms and human tissues [3, 4]. Also, luminescence of phosphors or fluorophores excited by the Cherenkov light can be used to monitor the molecular signatures of tumors during radiation therapy [5]. Cherenkov is a broadband optical emission, and Frank-Tamm theory indicates that the intensity distribution is inversely proportional to λ2 dictated by the index of refraction of the medium [6]. Cherenkov emission peaks in the UV-blue region of the spectrum In human tissue though, visible and near infrared red (Vis-NIR,400-900 nm) Cherenkov emission are usually detected for imaging applications, because of the limits of light penetration depth in biological tissues, where blood absorbs essentially all blue-green light However, the remaining Vis-NIR light is still highly scattered and attenuated, making the signal quite superficial (4-7mm). Recently, in vivo biological imaging in short wavelength infrared (SWIR, 1000–1700 nm) or second near-infrared window (NIR-II) has been shown to have some important advantages over imaging in Vis-NIR window [7-10]. Detecting SWIR photons affords an important reduction in scattering in biological tissues, accompanied by lower auto-fluorescence, leading to higher spatial resolution and deeper tissue penetration depth [9,10]. Following the theoretical prediction of Frank-Tamm theory, there should exist SWIR light in Cherenkov emission, but there has been no report of Cherenkov emission detection in SWIR region for MeV radiation so far. The question of whether SWIR emission of MeV external radiation could be captured or not is still unknown, and so this study is the first experimental verification of the existence of SWIR Cherenkov emission generated from MeV external radiation.
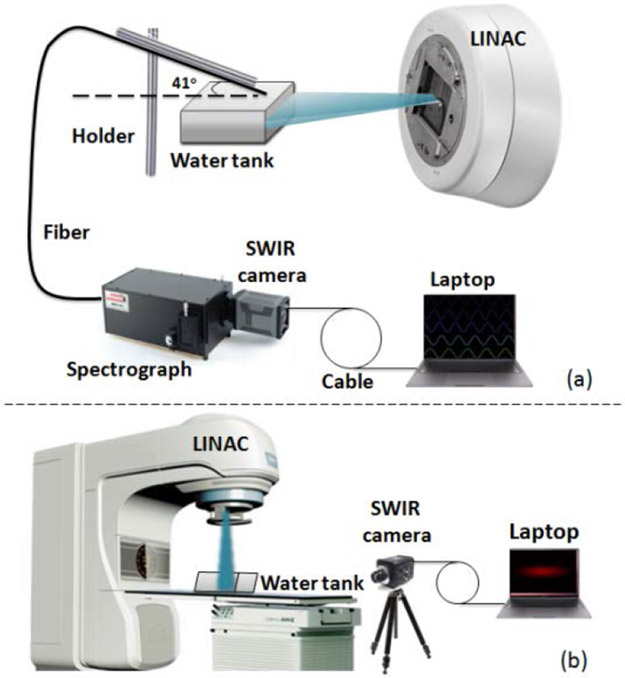
As shown in Figs. 1(a) and 1(b) The MeV electron beam is generated from a LINAC (Varian LINAC 2100C, Varian Medical Systems, Palo Alto, USA). A water tank of size 12x7x9cm was used as the imaging phantom in this study. In the spectroscopy system Fig. 1(a), a fiber bundle composed of seven 400 um diameter silica fibers was used for detection, and the tip of fiber bundle was tilted at 41° relative to the surface of water for maximal capture of Cherenkov photons from the tank The spectrometer (SP2150, Princeton Instruments, Acton, USA) was equipped with a grating of 300 g/mm with blaze wavelength of 1200nm. The camera for SWIR Cherenkov spectroscopy and imaging was a SWIR scientific-grade InGaAs camera (NIRvana 640 Princeton Instruments, Acton, USA) with 640 x 512 pixels (pixel size of 20um). This camera had high sensitivity of photons in the wavelength range of 900 nm to 1700 nm. The camera for Vis-NIR Cherenkov spectroscopy and imaging was an ICCD camera (PI-MAX 3 1024i, Princeton Instruments, Acton, USA), which had 1024 x 1024 pixels with an 18mm UNIGEN II intensifier. The grating for Vis-NIR Cherenkov spectroscopy was 300 g/mm and blaze wavelength of 500nm Integrating time for SWIR and Vis-NIR spectroscopy were 30 and 10 seconds, respectively. For each measurement, a background room light spectrum was first captured using the same parameters as with the Cherenkov spectrum acquisition, and this was subtracted, frame by frame, during subsequent data processing. The spectral bandwidths obtained from each data acquisition in SWIR and Vis-NIR regions were limited to 200nm and 240nm, respectively, so that the full SWIR and Vis-NIR spectra were obtained by shifting the center wavelength from 1000nm to 1400nm and 500nm to 700nm with increments of 100nm at a time so the data was joined together. To eliminate the quantum efficiency variation at different wavelengths of the spectrometer, we calibrated the intensity for different wavelengths using a tungsten halogen light source (Ocean Optics, HL-2000-FHSA) with known spectral output Then the measured Cherenkov spectral bands were corrected using this intensity calibration. The imaging setup is depicted in Fig. 1(b), and the water tank was put on the treatment coach in the field of the radiation beam. The collimator was adjusted to acquire different sizes and positions of the field of radiation beam The SWIR camera used in spectroscopy setup coupled to a Canon 135mm f/2.0 lens, and was fixed on a tripod about 2 meters away from the water tank The integration time for all images was 10 s. Images were processed by subtraction of a background images and a spatial median filtering with pixels of 3x3 in MATLAB 2013b.
Fig. 1.
The experimental set up for SWIR Cherenkov (a) spectroscopy, and (b) imaging.
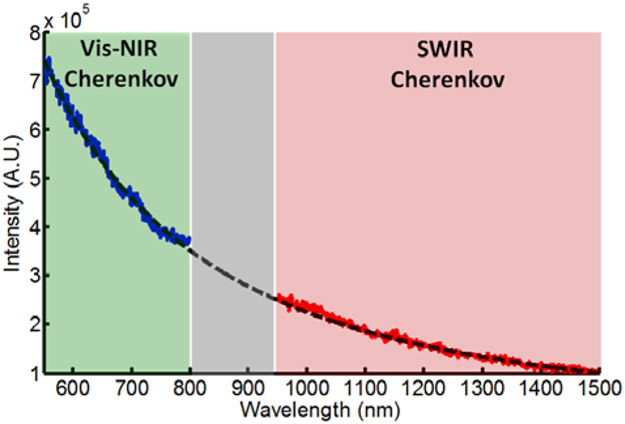
Figure 2 shows the measured spectrum of Cherenkov emission from 550nm to 1500nm induced by 18 MeV electrons. The grey region in the wavelength range of 800nm-950nm indicates the wavelengths in which neither the SWIR nor Vis-NIR cameras had enough sensitivity to detect Cherenkov photons. The black dotted line is the calculated number of Cherenkov photons per wavelength, which is proportional to ~ 1/λ2 [6]. The measured spectrum of Cherenkov emission agreed well with its calculated values. Through integrating the spectrum curves over the SWIR and Vis-NIR ranges, the total fluence rate of Vis-NIR Cherenkov is estimated about 3 times as that of SWIR Cherenkov.
Fig. 2.
Full spectrum of Cherenkov emission taken in Vis-NIR (blue solid line), and SWIR regions (red solid line), along with the predicted theory (black dotted line).
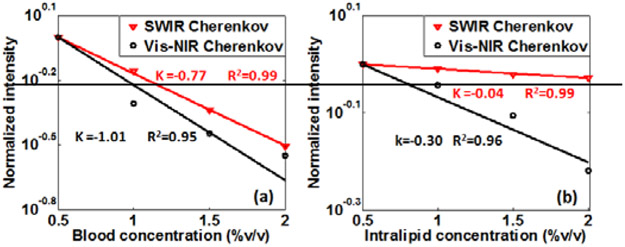
To understand the penetration characteristics of SWIR Cherenkov photons, the attenuation of SWIR and Vis-NIR Cherenkov emission passing through the diffusing medium were compared, as a function of different absorption and scattering parameters, shown in Fig. 3. A 6MeV electron beam irradiated the water solution of intralipid and blood as shown in the setup of Fig. 1(b). The field size of the electron beam was 10x2cm2, and the distance from the beam edge to the tank edge was 1 cm The concentrations of intralipid and blood were varied each from 0.5% to 2% to mimic different absorption and scattering value of tissue. After collecting SWIR and Vis-NIR Cherenkov images, the average intensity over the center area defined by the pixels with intensity above the threshold of 50% maximum at each blood or intralipid concentration was normalized by that at 0.5% blood or intralipid, to eliminate the influences of camera sensitivity.
Fig. 3.
Intensity attenuation of SWIR and Vis-NIR Cherenkov emission in diffuse medium. (a) Attenuation versus blood concentration. (b) Attenuation versus intralipid concentration.
Figure 3 shows the relative SWIR and Vis-NIR Cherenkov intensities decreasing with increasing the concentrations of each of blood (Fig. 3 (a)) and intralipid (Fig. 3(b)), respectively. It can be seen that the decay rates of SWIR Cherenkov photons are lower than that of Vis-NIR Cherenkov photons for both increases in absorption and scattering. The lower decay rates of SWIR Cherenkov light intensity indicate that these wavelengths have better penetration in biological tissue, as compared to Vis-NIR wavelengths.
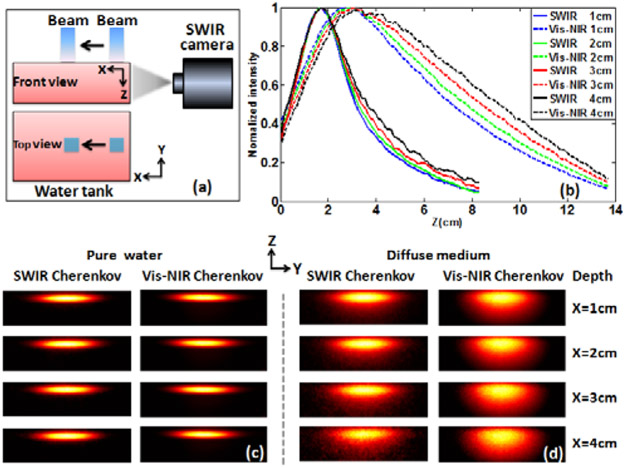
To understand how the resolution of SWIR Cherenkov emission can be improved as compared to Vis-NIR, a 10x10cm2 6MeV electron beam was used to vertically irradiate a water tank (tank size 40x28x15cm]. The electron beam was moved laterally away from the tank edge (which was the imaging plane) towards center with step of 1cm (see Fig. 4(a)) thereby varying the observed signal from a depth into the water. The SWIR and Vis-NIR Cherenkov images of this electron beam were captured for pure water and diffuse medium (0.1% porcine blood and 0.1% intralipid water solution) with consistent electron beam sizes, radiation dose, and exposure times, for each depth.
Fig. 4.
Resolution evolution of SWIR Cherenkov imaging. (a) Experiment setup configuration. (b) The corresponding vertical profiles by summating all pixel values in X direction of Cherenkov images in diffuse medium. (c) SWIR and Vis-NIR Cherenkov images in pure water at different depths. (d) SWIR and Vis-NIR Cherenkov images in diffuse medium at different depths.
Figures 4(c) and 4(d) show the images of Cherenkov emission in the pure water (Fig. 4(c)) and diffuse medium (Fig. 4(d)), at the different depths. Self-normalized images clearly show the spatial resolution changes of Cherenkov images. It can be seen in Fig. 4(c) that SWIR and Vis-NIR Cherenkov images of the electron beam were identical at each depth and kept constant at different depths in pure water with the vertical full width at half maximum (FW HM) of 2.0cm.
While in Fig. 4(d), they both blur in diffuse medium as a result of scattering with increasing the depth. Comparing SWIR with Vis-NIR Cherenkov images, the resolution decline level (at each depth) and rate (while increasing depth) of SWIR Cherenkov images are much less than that of Vis-NIR Cherenkov images. Fig. 4(b) is the vertical profiles by summing all pixel values in Y direction of Cherenkov images. The solid and dash lines are the vertical profiles of SWIR and Vis-NIR at each depth. This result clearly shows that the spreading widths along the electron propagation direction for SWIR Cherenkov images were much smaller than that for Vis-NIR imaging. The FWHM vertical beam size in SWIR and Vis-NIR Cherenkov images were increased from 2.6 to 3.2cm and from 6.9 to 8.4 cm, respectively, while increasing the depth from 1 to 4 cm. Considering the true electron dose is not a perfect line source, we used the relative change of FWHM to describe the spatial resolution. So, the spatial resolution was improved approximately 5.3 times with SWIR emission versus Vis-NIR emission. The smaller vertical FWHM in the SWIR Cherenkov images indicates that this has the potential for better spatial resolution as compared to that of Vis-NIR imaging.
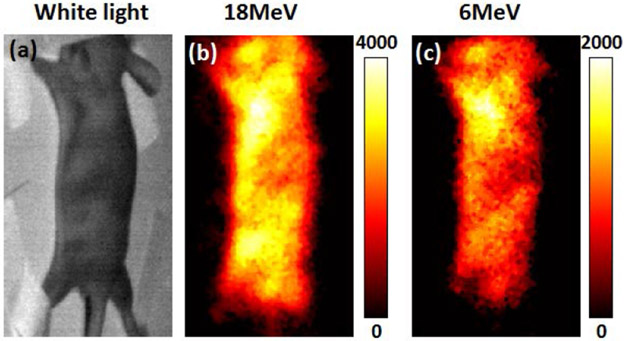
In order to validate that SWIR Cherenkov imaging is possible in vivo, a nude mouse was imaged using the camera setup similar with Fig. 1(b) but at an angle of 45° to capture the top surface of the mouse. An electron beam with field size of 12x6cm2 was used to irradiate the whole mouse body. With an exposure times of 10s, Fig. 5(a) shows the white light image without the electron beam on, and Figs. 5(b, c) show the SWIR Cherenkov images for 18MeV and 6MeV irradiation, respectively. The intensity of Cherenkov emission under 18MeV was approximately 2 times of that for 6MeV.
Fig. 5.
SWIR Cherenkov imaging of small animal. (a) White light image of the mouse. (b) SWIR Cherenkov image of 18MeV electron beam irradiation. (c) SWIR Cherenkov image of 6MeV electron beam irradiation.
It is well-known that Cherenkov emission is low intensity light produced by high energy radiation through dielectric media. Since LINACs use a pulsed irradiation strategy (~5μs of MeV electrons with a 2.8ms repetition time at high dose rate), a time gated technique with an ICCD has been shown to minimize noise and background induced by ambient light [11]. The SWIR camera used in this study had no ability to use a time gating, and as a consequence, the signal to noise ratio of our SWIR Cherenkov imaging was much lower than that in Vis-NIR Cherenkov imaging. It should be expected that a SWIR camera which is equipped with a time gated image intensifier could significantly improve the SWIR Cherenkov imaging. Additionally, the SWIR camera was insensitive in the wavelength ranges below 900nm, and so it is worth noting that this could yield a significant practical benefit for using SWIR Cherenkov imaging, because the ambient room lighting signals would be inherently suppressed without altering the visibility of room lighting in a clinical setting.
It was found that the SWIR camera was much more sensitive to X-rays and electrons, and so the dark noise of the SWIR cameras is much higher than that of an ICCD camera, when the X-ray or electron beam is on. This fact is probably due to the nature of InGaAs focal plane arrays (FPA), which show a higher dark current and higher inherent readout noise in comparison with CCD detectors. We also found that the dark noise (with the X-ray beam on) of a SWIR camera was about 20 times higher than that of a ICCD camera even with several micro seconds exposure time (effective time with beam on). So this high level noise is not due to the long integration time when we acquire SWIR Cherenkov images. The penetration ability of MeV X-rays is stronger than that of MeV electrons, so there is much more X-ray scattering that reaches the camera sensor itself when the beam is on. The noise level of a MeV X-ray beam is about 50 times higher than that of a MeV electron beam, and so it is difficult to acquire SWIR Cherenkov signals with high SNR A longer distance between the camera and the radiation beam can significantly reduce this noise, however, it also leads to lower overall detected signal. After imaging at many different distances, it was found that a 2 meter distance was a good balance between detection and noise for SWIR Cherenkov imaging.
In summary, Cherenkov imaging has been used to visualize radiation beams directly and as an excitation source for molecular imaging, yet all of the previous studies were based on Vis-NIR Cherenkov emission. This study successfully showed detection of SWIR wavelength Cherenkov emission for the first time, to our knowledge. Experimental results demonstrated that imaging with this SWIR emission can reach higher spatial resolution and deeper penetration depth as compared with conventional Vis-NIR Cherenkov imaging, and so could provide higher quality imaging for dosimetry and molecular sensing during clinical radiotherapy.
Acknowledgment.
We thank Sebastian Remi and Princeton Instruments for providing use of the NIRvana SWIR camera.
Funding. Medical Research Program for Breast Cancer Research Program; U.S. Army USAMRAA contract (W81XWH-16-1-0004); National Institutes of Health research grant (R01 EB024498).
References
- 1.Cherenkov PA, "Visible emission of clean liquids by action of γ radiation," Doklady Akademii Nauk SSSR 2, 451–454 (1934). [Google Scholar]
- 2.Axelsson J, Davis SC, Gladstone DJ, and Pogue BW, ” Cerenkov emission induced by external beam radiation stimulates molecular fluorescence,” Med. Phys 38, 4127–4132 (2011). [DOI] [PMC free article] [PubMed] [Google Scholar]
- 3.Jarvis LA, Zhang R, Gladstone DJ, Jiang S, Hitchcock W, Friedman OD, Glaser AK, Jermyn M, and Pogue BW, ” Cherenkov video imaging allows for the first visualization of radiation therapy in real time,” Int J. Radiat Oncol. Biol. Phys 89, 615–622 (2014). [DOI] [PubMed] [Google Scholar]
- 4.Andreozzi JM, Zhang R, Gladstone DJ, Williams BB, Glaser AK, Pogue BW, and Jarvis LA, ” Cherenkov imaging method for rapid optimization of clinical treatment geometry in total skin electron beam therapy,” Med. Phys 43, 993–1002 (2016). [DOI] [PMC free article] [PubMed] [Google Scholar]
- 5.Pogue BW, Feng J, LaRochelle EP, Bruža P, Lin H, Zhang R, Shell JR, Dehghani H, Davis SC, and Vinogradov SA, Nat. Biomed. Eng 2, 254 (2018). [DOI] [PMC free article] [PubMed] [Google Scholar]
- 6.Tamm I, and Frank I ”Coherent radiation of fast electrons in a medium,” Doklady Akademii Nauk SSSR 14, 107–112 (1937). [Google Scholar]
- 7.Smith AM, Mancini MC, and Nie S, ”Bioimaging second window for in vivo imaging,” Nat. Nanotechnol 4, 710 (2009). [DOI] [PMC free article] [PubMed] [Google Scholar]
- 8.Welsher K, Sherlock SP and Dai H, ”Deep-tissue anatomical imaging of mice using carbon nanotube fluorophores in the second near-infrared window,” Proc Natl. Acad. Sci 108, 8943–8948 (2011). [DOI] [PMC free article] [PubMed] [Google Scholar]
- 9.Hong G, Zou Y, Antaris AL, Diao S, Wu D, Cheng K, Zhang X, Chen C, Liu B, and He Y, ”Ultrafast fluorescence imaging in vivo with conjugated polymer fluorophores in the second near-infrared window” Nat Commun 5, 4206 (2014). [DOI] [PubMed] [Google Scholar]
- 10.Antaris AL, Chen H, Cheng K, Sun Y, Hong G Qu C, Diao S, Deng Z, Hu X, Zhang B Zhang X, Yaghi OK, Alamparambil ZR, Hong X, Cheng Z and Dai H, ” A small-molecule dye for NIR-II imaging” Nature Mat 15, 235–242 (2016). [DOI] [PubMed] [Google Scholar]
- 11.Glaser AK, Zhang R, Davis SC, Gladstone DJ, and Pogue BW,” Time-gated Cherenkov emission spectroscopy from linear accelerator irradiation of tissue phantoms,” Opt. Lett 37, 1193–1195 (2012). [DOI] [PMC free article] [PubMed] [Google Scholar]


