Abstract
Cardiovascular disease (CVD) is the number one leading cause for human mortality. Besides genetics and environmental factors, in recent years, gut microbiota has emerged as a new factor influencing CVD. Although cause-effect relationships are not clearly established, the reported associations between alterations in gut microbiota and CVD are prominent. Therefore, we hypothesized that machine learning (ML) could be used for gut microbiome-based diagnostic screening of CVD. To test our hypothesis, fecal 16S rRNA sequencing data of 478 CVD and 473 non-CVD human subjects collected through the American Gut Project were analyzed using 5 supervised ML algorithms including random forest (RF), support vector machine, decision tree, elastic net and neural networks (NN). Thirty-nine differential bacterial taxa were identified between the CVD and non-CVD groups. ML modeling using these taxonomic features achieved a testing AUC (area under the receiver operating characteristic curves; 0.0: perfect anti-discrimination; 0.5: random guessing; 1.0: perfect discrimination) of ~0.58 (RF and NN). Next, the ML models were trained with the top 500 high-variance features of operational taxonomic units (OTUs), instead of bacterial taxa, and an improved testing AUC of ~0.65 (RF) was achieved. Further, by limiting the selection to only the top 25 highly contributing OTU features, the AUC was further significantly enhanced to ~0.70. Overall, our study is the first to identify dysbiosis of gut microbiota in CVD patients as a group and apply this knowledge to develop a gut microbiome-based ML approach for diagnostic screening of CVD.
Keywords: cardiovascular disease, supervised machine learning, artificial intelligence, gut microbiota, diagnosis, metagenomic sequencing
Graphical Abstract
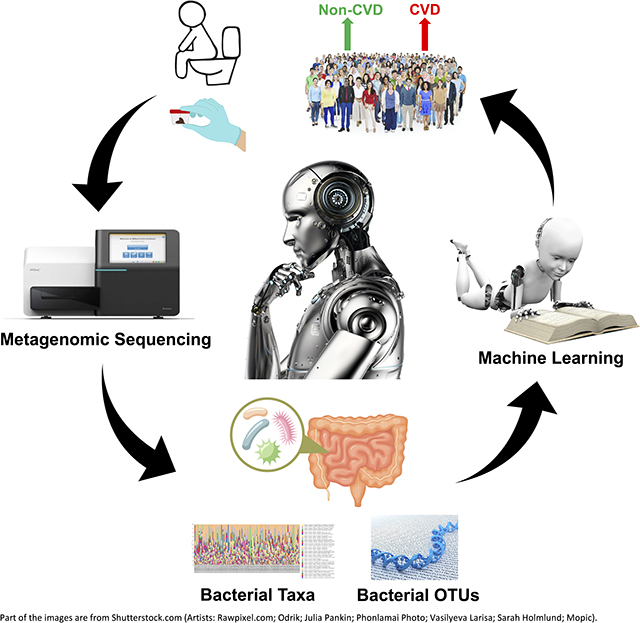
Introduction
Cardiovascular disease (CVD) refers to a number of morbid conditions such as heart failure,1 hypertension 2 and atherosclerosis,3 which could develop simultaneously or may lead to each other.4,5 Worldwide, by 2030, CVD death toll is estimated to surpass 23.6 million.1 Multiple clinical tests, including electrocardiogram (ECG),6 chest x-ray (CXR) 7 and echocardiogram,8 are routinely required for a comprehensive evaluation of cardiovascular health. Therefore, a convenient screening test for an overall evaluation of cardiovascular health could save diagnostic time and facilitate a timely therapeutic intervention.9
Machine learning (ML), a major branch of artificial intelligence (AI), has been successfully used for diagnostic testing and prediction of a variety of diseases such as cancer,10 diabetes mellitus 11 and inflammatory bowel disease (IBD).12 For example, ML models have been trained with gut microbiota features to classify healthy and IBD subjects.13 Since dysregulated gut microbiota is observed in several types of CVD, such as hypertension,14–20 heart failure 21 and atherosclerosis, 22 we hypothesized that supervised ML models could be trained with gut microbiota data for diagnostic screening of CVD. To test this hypothesis, we evaluated the capacity of different supervised ML models to detect and differentiate gut microbiome signatures from fecal 16S metagenomics data obtained from 478 CVD and 473 non-CVD subjects through American Gut Project. To our knowledge, our study is the first to demonstrate the promising potential of AI via ML models for a convenient diagnostic screening of CVD based on fecal microbiota composition.
Methods
The authors declare that all supporting data are available within the article [and its online supplementary files].
Data collection and processing
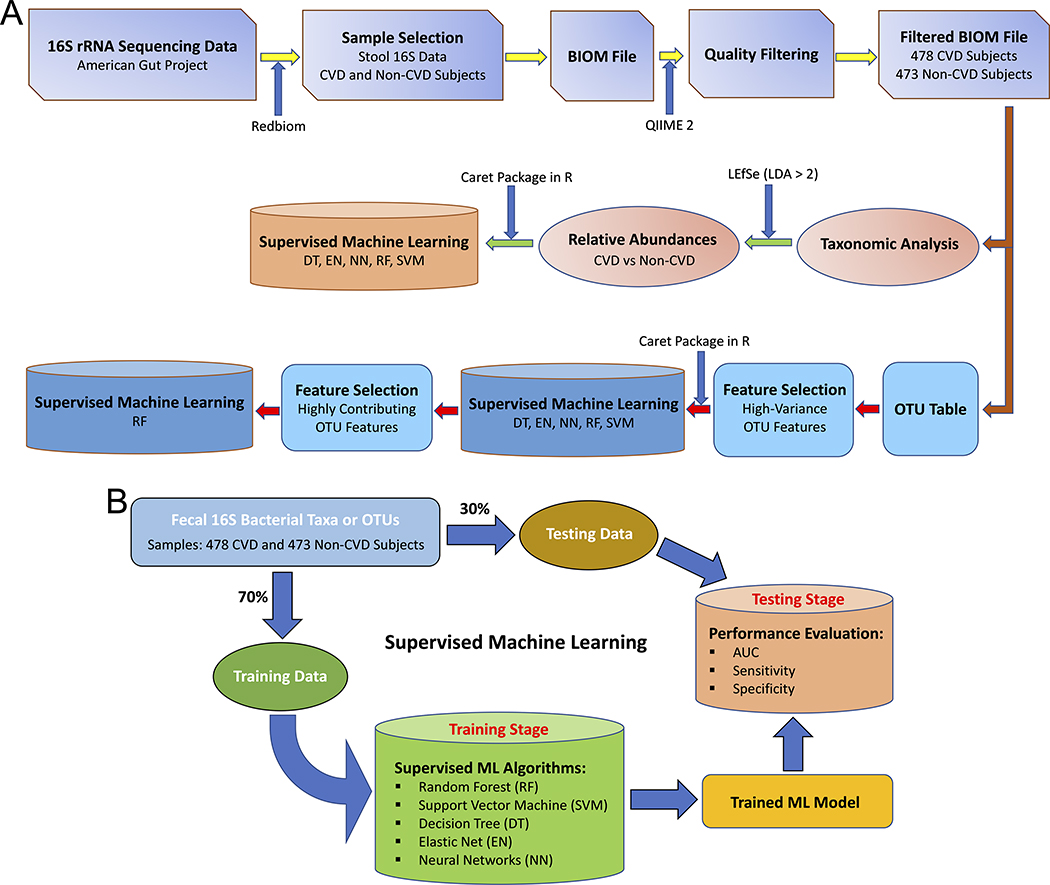
The workflow of the whole study is summarized in Figure 1A. Human 16S rRNA sequencing data was collected through the American Gut Project 23 using Redbiom.24 Out of a total of 16,998 stool samples (as of February 11, 2020) under Qiita study ID 10317, 613 CVD samples were collected from the participants diagnosed (by a medical professional) with cardiovascular disease and 16,385 non-CVD samples were collected from the participants with no cardiovascular disease. Out of 16,385 non-CVD samples, 602 samples were randomly selected in order to match the final sample size of the CVD group after quality filtering. Metadata and BIOM files of the samples were downloaded using the “redbiom fetch” function with the context “Deblur-Illumina-16S-V4–150nt-780653”. The BIOM file was further processed using QIIME 2 (version 2019.10) for quality filtering to discard the samples with a total frequency less than 10,000. The table of operational taxonomic units (OTUs) was generated using the filtered BIOM file with the BIOM format tool.25 The stool 16S data collected from 478 CVD and 473 non-CVD subjects were obtained for subsequent analyses.
Figure 1. The study workflow.
(A) Overall analysis. (B) Supervised machine learning.
Taxonomic analysis
Taxonomic assignment was performed using QIIME 2 with a pre-trained Naive Bayes classifier on the Greengenes (version 13.8) 99% OTUs.26 Linear discriminant analysis effect size (LEfSe) 27 via Galaxy/Hutlab (https://huttenhower.sph.harvard.edu/galaxy/) was used to identify differentially abundant taxonomic features. Taxonomical features with a linear discriminant analysis (LDA) score more than 2.0 were plotted with the LEfSe bar graph and cladogram.
Supervised ML modeling
The process of supervised ML is summarized in Figure 1B. Five different supervised ML algorithms were trained with the features of bacterial taxa or OTUs using the caret R package:28 decision tree (DT), elastic net (EN), neural networks (NN), random forest (RF) and support vector machine with radial kernel (SVM). Kernlab,29 randomForest,30 rpart,31 and glmnet 32 were used as the helper R packages. Data were assigned into training (70%) and testing (30%) datasets after the whole dataset was shuffled. In order to reduce the computational complexity and the dimensionality of the feature space, OTU-wise variance was calculated for each OTU as a preliminary task for the selection of OTU features and the top 500 OTUs with the highest variance across all the samples were selected for training the ML models. Training performance of the different ML models was evaluated by 10-fold cross-validation and the process was repeated for 10 times. Hyperparameter tuning was automatically executed by caret testing 10 different values for each hyperparameter. In the testing phase, prediction performance of each ML model was evaluated by the performance parameters including AUC (area under the receiver operating characteristic curves), sensitivity and specificity. The entire process, representing a Monte Carlo procedure 33, comprising of data shuffling, data splitting, training and testing were independently performed for 50 iterations. The box-plot representations of the values of AUC, sensitivity and specificity were generated using the ggplot2 package 34 in R.
Identification of highly contributing OTU features (HCOFs)
HCOFs were selected on the basis of variable importance scores (ranged from 0 to 100; 0: no contribution to the model; 100: contributing most to the model) calculated using the “varlmp” function 28 from the caret R package. Importance scores of top OTU features were plotted using the ggplot2 package in R. To evaluate how the selected HCOFs were able to classify the CVD and non-CVD groups, only selected HCOFs were used for ML modeling as described above.
Statistical Analysis
LEfSe 27 was used to perform the Kruskal-Wallis test for differential analysis of bacterial taxa among different groups and the LDA score more than 2.0 was defined as the threshold for selecting the discriminative features. The values of mean and standard deviation of AUC, sensitivity and specificity were computed from the 50 independent iterations of ML modeling.
Results
Differential bacterial taxa between the CVD and non-CVD groups
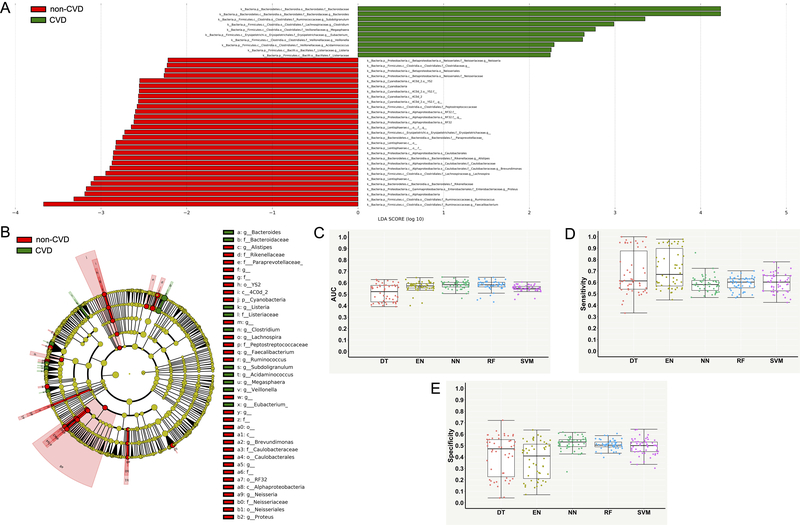
Significant differences in gut microbiota were observed between the CVD and non-CVD subjects (Figure 2A and Figure 2B). A total of 39 taxonomic features (LDA > 2) were found to be enriched in either CVD or non-CVD group (Figure 2A and Supplementary Table S1). For example, at the bacterial genus level, Bacteroides, Subdoligranulum, Clostridium, Megasphaera, Eubacterium, Veillonella, Acidaminococcus and Listeria were more abundant in the CVD group (Figure 2A). In contrast, Faecalibacterium, Ruminococcus, Proteus, Lachnospira, Brevundimonas, Alistipes, and Neisseria were more abundant in the non-CVD group (Figure 2A). Differential enrichments in several major bacterial taxa in the CVD and non-CVD group and their phylogenetic relationships are presented using the cladogram (Figure 2B).
Figure 2. Differential bacterial taxa between the groups of cardiovascular disease (CVD) and non-CVD and performance measures of supervised machine learning models for classifying the CVD and non-CVD subjects using differential taxonomic features.
(A) Linear discriminant analysis effect size (LEfSe) bar graph showing differential bacterial taxa. (B) Cladogram showing phylogenetic relationships of differential bacterial taxa. (C) Area under the receiver operating characteristic curve (AUC). (D) Sensitivity. (E) Specificity. Each point in the box plot represents the corresponding performance measure in one iteration (total 50 iterations).
Supervised ML models trained with enriched taxonomic features
Supervised ML models were trained with the 39 differential taxonomic features for predictive classification and diagnostics of the CVD and non-CVD subjects. Table 1 and Figure 2C through 2E present performances measures of the 5 different ML algorithms evaluated on the testing dataset for the CVD versus non-CVD classification. RF and NN performed better than other models, but they only achieved an AUC of ~0.58, followed by EN (~0.57 AUC), SVM (~0.55 AUC) and DT (~0.51 AUC) (Table 1 and Figure 2C). RF and NN had lower sensitivity but higher specificity than EN, DT and SVM (Table 1, Figure 2D and 2E).
Table 1.
Performance measures of supervised ML models for classifying the CVD and non-CVD subjects using differential taxonomic features and top 500 high-variance OTU features.
| Features | Algorithms | AUC | Sensitivity | Specificity |
|---|---|---|---|---|
| DT | 0.51 ± 0.07 | 0.68 ± 0.18 | 0.41 ± 0.18 | |
| EN | 0.57 ± 0.04 | 0.71 ± 0.17 | 0.37 ± 0.16 | |
| Bacterial Taxa | NN | 0.58 ± 0.04 | 0.59 ± 0.07 | 0.52 ± 0.06 |
| RF | 0.58 ± 0.04 | 0.59 ± 0.06 | 0.51 ± 0.04 | |
| SVM | 0.55 ± 0.03 | 0.60 ± 0.08 | 0.49 ± 0.07 | |
| DT | 0.52 ± 0.08 | 0.57 ± 0.10 | 0.53 ± 0.11 | |
| EN | 0.56 ± 0.05 | 0.56 ± 0.09 | 0.55 ± 0.09 | |
| High-Variance OTUs | NN | 0.48 ± 0.04 | 0.59 ± 0.30 | 0.46 ± 0.28 |
| RF | 0.65 ± 0.03 | 0.70 ± 0.05 | 0.50 ± 0.04 | |
| SVM | 0.57 ± 0.04 | 0.60 ± 0.07 | 0.52 ± 0.09 | |
Values are presented as mean ± standard deviation (calculated from 50 iterations). In each iteration, entire processes of data shuffling, data splitting, training and testing were independently performed to compute for all the performance parameters.
Supervised ML models trained with high-variance OTUs
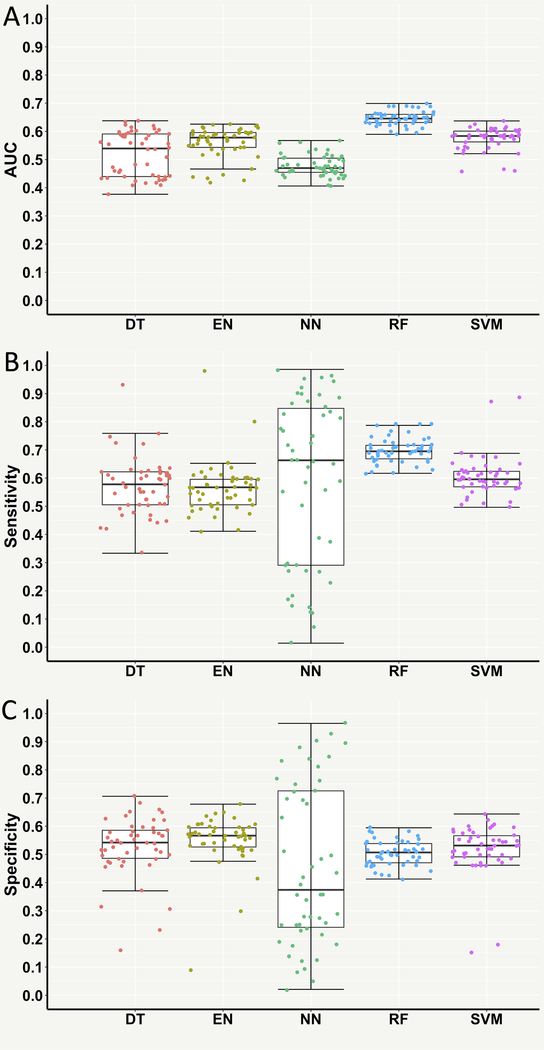
Next, supervised ML models were trained with the top 500 high-variance OTU features, instead of taxonomic features, to test if the diagnostic classification could be further improved. Interestingly, the testing AUC of RF was significantly improved to ~0.65 and its sensitivity was also significantly increased to ~0.70 despite no significant improvement of specificity (Table 1 and Figure 3). However, the AUC and specificity of NN significantly decreased to ~0.48 and ~0.46, respectively (Table 1 and Figure 3). No significant improvements in the performance measures of EN, DT and SVM were observed (Table 1 and Figure 3).
Figure 3. Performance measures of supervised machine learning models for classifying the cardiovascular disease (CVD) and non-CVD subjects using the top 500 high-variance operational taxonomic unit (OTU) features.
(A) Area under the receiver operating characteristic curve (AUC). (B) Sensitivity. (C) Specificity. Each point in the box plot represents the corresponding performance measure in one iteration (total 50 iterations).
Supervised ML models trained with HCOFs
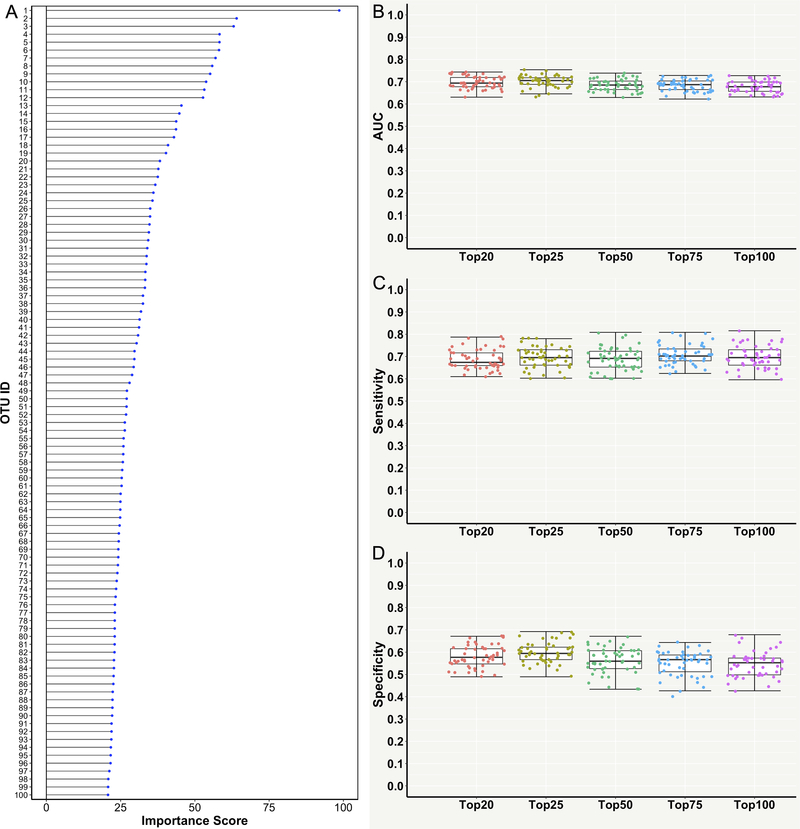
To further improve the diagnostic classification of the RF model and also reduce the dimensionality of the OTU feature space, HCOFs were further selected from the top 500 high-variance OTU features. Variable importance scores (ranged from 0 to 100) of OTUs were calculated and the top 100 HCOFs with the highest scores were selected for training the RF model (Figure 4A and Supplementary Table S2). The RF algorithm was then re-implemented using the top 20, 25, 50, 75 and 100 HCOFs, respectively. The RF models trained with the top 20 and top 25 HCOFs not only reduced the dimensionality of the feature space, but also achieved a further improvement of testing AUC (~0.70) and performed slightly better than other three RF models trained with ≥50 HCOFs (Table 2 and Figure 4B). The RF model trained with the top 25 HCOFs had slightly higher sensitivity and specificity than the model trained with the top 20 HCOFs (Table 2, Figure 4C and 4D). Therefore, we concluded that the RF model trained with only 25 OTU features could achieve a good diagnostic classification power of predicting and identifying the subjects with CVD.
Figure 4. Performance measures of the random forest (RF) model for classifying the cardiovascular disease (CVD) and non-CVD subjects using the top highly contributing operational taxonomic unit features (HCOFs).
(A) Variable importance scores (ranged from 0 to 100) of the top 100 HCOFs. (B) Area under the receiver operating characteristic curve (AUC). (C) Sensitivity. (D) Specificity. Each point in the box plot represents the corresponding performance measure in one iteration (total 50 iterations).
Table 2.
Performance measures of the RF model for classifying the CVD and non-CVD subjects using the highly contributing OTU features.
| Top Features | AUC | Sensitivity | Specificity |
|---|---|---|---|
| Top 20 | 0.70 ± 0.03 | 0.69 ± 0.04 | 0.58 ± 0.05 |
| Top 25 | 0.70 ± 0.03 | 0.70 ± 0.05 | 0.60 ± 0.05 |
| Top 50 | 0.69 ± 0.03 | 0.69 ± 0.05 | 0.56 ± 0.06 |
| Top 75 | 0.68 ± 0.03 | 0.71 ± 0.04 | 0.55 ± 0.06 |
| Top 100 | 0.68 ± 0.03 | 0.70 ± 0.05 | 0.55 ± 0.06 |
Values are presented as mean ± standard deviation (calculated from 50 iterations). In each iteration, entire processes of data shuffling, data splitting, training and testing were independently performed to compute for all the performance parameters.
Discussion
Mounting evidence points to a strong link between cardiovascular health and gut microbiota.35–37 Albeit being highly variable between individuals, gut microbiota has been successfully used as a feature to differentiate between health and disease in a variety of illnesses.13,38,39 Therefore, in this study we asked whether gut microbiome data can be used to diagnose CVD in humans. CVD is a broad term including a range of morbid conditions from hypertension and atherosclerosis to heart failure. As such, the host molecular mechanisms underlying a broad group of subjects classified as having CVD vary widely. Even so, we asked if there are any early warning signs which are trackable across all of the clinical conditions which belong under the broad class called as CVD. To this end, given the recent literature on a strong association between gut microbial communities and a variety of CVD 17,21,22,40, we examined whether an alteration in gut microbial composition could serve as a common differentiator between subjects with any form of CVD and those with normal cardiovascular health. Remarkably, not only were we able to detect distinct microbial signatures (Figure 2A and 2B), but we were also successful in applying gut microbiome data as training modules for supervised ML modeling to differentiate between these two groups with a promising predictive diagnostics potential.
The approach of utilizing 16S metagenomics data for disease prediction using supervised ML is not new,38,41–43 however its application in CVD is novel. One of the strengths of our study is that it was conducted with a large sample size consisting of 478 CVD and 473 non-CVD human subjects. While larger sample sizes are better under a controlled setting of restricting them by a single feature such as age for example, the cohort we used here were not limited by any features. The entire cohort was well represented by a dynamic range of various features such as ages, sexes, dietary habits and lifestyles.23 Thereby, the experimental design was more permissive to contribute to a high degree of within-group variability for a rigorous examination of the capacity of ML models using gut microbiota as the sole feature for diagnostic classification of non-CVD vs CVD. However, we have to point out the limitation that gut microbiome can be influenced by other features such as diet and medication, but those data are not fully available in the American Gut Project for a comprehensive evaluation of their impact in our current ML analysis. Moreover, even though we only used the fecal 16S data collected from the CVD participants indicated by “diagnosed by a medical professional (doctor, physician assistant)” and the non-CVD participants indicated by “I do not have this condition” in the database of the American Gut Project, we could not rule out the possibility of misreported or undiagnosed CVD cases. Despite this, remarkably, differential gut microbiol signatures were detectable between the CVD and non-CVD groups. These data point to a core set of altered gut microbiota as a common denominator for a variety of clinical presentations of CVD.
Initial ML modeling using these differential taxonomic features was not satisfactory and only achieved ~0.58 AUC (Table 1 and Figure 2C), indicating that the identified differential bacterial taxa were not sufficient as reliable features in the ML based decision-making process. As OTUs differentiate bacteria based on DNA sequence similarity and represents a more informative feature than taxonomic assignment, we further tested if OTU features could be used to train ML models to improve their prediction power. It should be noted that our study did not normalize OTU data across all the samples as we aimed to test the capacity and adaptability of ML models trained with raw OTU data to classify and predict new unknown samples without the need for repeated processing of all the previous samples with the new samples in future. Top 500 high-variance OTU features, representing those most variable OTUs within all the CVD and non-CVD samples to provide rich feature information, were used for ML modeling and an improved testing AUC, ~0.65, was achieved by the RF model (Table 1 and Figure 3A). Since OTUs performed better than known taxa, it is also likely that a vast majority of the microbes which are common to all the forms of CVD are perhaps yet unknown for their taxonomic assignments.
In order to reduce the dimensionality of the feature space and further improve the predictive diagnostics performance, we calculated the variable importance scores of the top 500 high-variance OTUs and selected the top 100 OTUs with the highest scores as the most highly contributing features for re-training the RF model. A final testing AUC of ~0.70 was achieved with only 25 OTU features which were used to train the RF model (Table 2 and Figure 4B). Importantly, these high-contributing OTUs (Figure 4A and Supplementary Table S2) for ML modeling could be considered as new biomarkers for future mechanistic research and clinical application.
The current ML study differs from the prior reported ML approaches in that we used microbial composition data of stool sample, whereas almost all reported prior studies are based on health records.44–49 One of those reported accuracies is through supervised ML modeling trained with multiple clinical factors, including age, gender, smoking habit, systolic blood pressure, total cholesterol, HDL cholesterol, blood pressure treatment and diabetes, to predict CVD risks, wherein an AUC of ~0.76 was achieved.49 By comparison, our study has achieved a promising AUC of ~0.70 with a single parameter of stool gut microbiome data. While this demonstrates the promising potential of applying microbiome-based ML for predicting CVD, in future, it will be of interest to further calibrate and improve predictive capability of ML modeling by including more samples from different sources or stratifying specific types of CVD incorporated with combinatorial features such as health records, in addition to gut microbiome data.
Perspectives
To our knowledge, our study is the first to demonstrate the promising potential of AI via ML modeling for a convenient diagnostic screening of CVD based on fecal microbiota composition. As multiple clinical tests, such as electrocardiogram, chest x-ray and blood work, are usually required for a comprehensive evaluation of cardiovascular health, our gut microbiome-based supervised ML approach is promising for initial routine cardiovascular health monitoring prior to proceeding with those various clinical tests for proper diagnosis of specific kinds of CVD. Moreover, the ML-based feature selection approach that we described by identifying highly contributing OTUs, further expands the biomarker toolkit for CVD. Our feature selection results show that a small number of highly informative OTUs not only reduce computational complexity of ML modeling but also further improve their diagnostic classification performances. These highly contributing OTUs could be further investigated for their pathophysiological and mechanistic implications in cardiovascular health.
Supplementary Material
Novelty and Significance.
a. What is new?
Our study analyzed the large-scale gut microbiota data collected from a significant number of human CVD and non-CVD subjects and reported distinct gut microbiome features associated with cardiovascular health and disease, without any further sub-classification into the various types of CVD.
Further, this is the first study which demonstrates the successful application of AI via gut microbiome-based ML modeling for potential diagnostic screening of CVD.
b. What is relevant?
Hypertension is one of the most significant risk factors for developing almost all kinds of CVD, and thus our gut microbiome-based supervised ML approach can be potentially used for routine monitoring and evaluation of hypertension-involved cardiovascular deterioration.
c. Summary
Differential composition of gut microbiota was identified in human subjects diagnosed with and without CVD. Gut-microbiome based supervised ML modeling has been demonstrated as a promising novel approach for diagnostic screening of CVD.
Acknowledgments
Xi Cheng acknowledges the funding support from the P30 Core Center Pilot Grant from NIDA Center of Excellence in Omics, Systems Genetics, and the Addictome. Bina Joe acknowledges grant support from the National Heart, Lung, and Blood Institute (HL143082).
Sources of Funding: The work was supported by the Dean’s Postdoctoral to Faculty Fellowship from University of Toledo College of Medicine and Life Sciences to Xi Cheng.
Footnotes
Disclosures: The authors declare no conflict of interest.
References
- 1.Bonnefont-Rousselot D. Resveratrol and cardiovascular diseases. Nutrients. 2016;8(5):250. [DOI] [PMC free article] [PubMed] [Google Scholar]
- 2.Cheriyan J, O’Shaughnessy KM, Brown MJ. Primary prevention of CVD: treating hypertension. BMJ Clin Evid. 2010;2010. [PMC free article] [PubMed] [Google Scholar]
- 3.Frostegård J. Immunity, atherosclerosis and cardiovascular disease. BMC Med. 2013;11(1):117. [DOI] [PMC free article] [PubMed] [Google Scholar]
- 4.Agmon Y, Khandheria BK, Meissner I, et al. Independent association of high blood pressure and aortic atherosclerosis: a population-based study. Circulation. 2000;102(17):2087–2093. [DOI] [PubMed] [Google Scholar]
- 5.Guglin M, Khan H. Pulmonary hypertension in heart failure. J Card Fail. 2010;16(6):461–474. [DOI] [PubMed] [Google Scholar]
- 6.Hadjem M, Salem O, Naït-Abdesselam F. An ECG monitoring system for prediction of cardiac anomalies using WBAN. In: 2014 IEEE 16th International Conference on E-Health Networking, Applications and Services (Healthcom) IEEE; 2014:441–446. [Google Scholar]
- 7.Iijima K, Hashimoto H, Hashimoto M, et al. Aortic arch calcification detectable on chest X-ray is a strong independent predictor of cardiovascular events beyond traditional risk factors. Atherosclerosis. 2010;210(1):137–144. [DOI] [PubMed] [Google Scholar]
- 8.Chanthong P, Lapphra K, Saihongthong S, et al. Echocardiography and carotid intima-media thickness among asymptomatic HIV-infected adolescents in Thailand. AIDS. 2014;28(14):2071–2079. doi: 10.1097/qad.0000000000000376 [DOI] [PMC free article] [PubMed] [Google Scholar]
- 9.Bakirhan NK, Ozcelikay G, Ozkan SA. Recent progress on the sensitive detection of cardiovascular disease markers by electrochemical-based biosensors. J Pharm Biomed Anal. 2018;159:406–424. [DOI] [PubMed] [Google Scholar]
- 10.Ramos-Pollán R, Guevara-López MA, Suárez-Ortega C, et al. Discovering mammography-based machine learning classifiers for breast cancer diagnosis. J Med Syst. 2012;36(4):2259–2269. [DOI] [PubMed] [Google Scholar]
- 11.Tapak L, Mahjub H, Hamidi O, Poorolajal J. Real-data comparison of data mining methods in prediction of diabetes in Iran. Healthc Inform Res. 2013;19(3):177–185. [DOI] [PMC free article] [PubMed] [Google Scholar]
- 12.Mossotto E, Ashton JJ, Coelho T, Beattie RM, MacArthur BD, Ennis S. Classification of paediatric inflammatory bowel disease using machine learning. Sci Rep. 2017;7(1):1–10. [DOI] [PMC free article] [PubMed] [Google Scholar]
- 13.Hacılar H, Nalbantoğlu OU, Bakir-Güngör B. Machine Learning Analysis of Inflammatory Bowel Disease-Associated Metagenomics Dataset. In: 2018 3rd International Conference on Computer Science and Engineering (UBMK) IEEE; 2018:434–438. [Google Scholar]
- 14.Mell B, Jala VR, Mathew AV, et al. Evidence for a link between gut microbiota and hypertension in the Dahl rat. Physiol Genomics. 2015;47(6):187–197. [DOI] [PMC free article] [PubMed] [Google Scholar]
- 15.Jose PA, Raj D. Gut microbiota in hypertension. Curr Opin Nephrol Hypertens. 2015;24(5):403. [DOI] [PMC free article] [PubMed] [Google Scholar]
- 16.Li J, Zhao F, Wang Y, et al. Gut microbiota dysbiosis contributes to the development of hypertension. Microbiome. 2017;5(1):14. [DOI] [PMC free article] [PubMed] [Google Scholar]
- 17.Sun S, Lulla A, Sioda M, et al. Gut microbiota composition and blood pressure: The CARDIA study. Hypertension. 2019;73(5):998–1006. [DOI] [PMC free article] [PubMed] [Google Scholar]
- 18.Yang T, Santisteban MM, Rodriguez V, et al. Gut dysbiosis is linked to hypertension. Hypertension. 2015;65(6):1331–1340. [DOI] [PMC free article] [PubMed] [Google Scholar]
- 19.Yan Q, Gu Y, Li X, et al. Alterations of the gut microbiome in hypertension. Front Cell Infect Microbiol. 2017;7:381. [DOI] [PMC free article] [PubMed] [Google Scholar]
- 20.Chakraborty S, Mandal J, Cheng X, et al. Diurnal Timing Dependent Alterations in Gut Microbial Composition Are Synchronously Linked to Salt-Sensitive Hypertension and Renal Damage. Hypertension. 2020:HYPERTENSIONAHA-120. [DOI] [PMC free article] [PubMed] [Google Scholar]
- 21.Cui X, Ye L, Li J, et al. Metagenomic and metabolomic analyses unveil dysbiosis of gut microbiota in chronic heart failure patients. Sci Rep. 2018;8(1):1–15. [DOI] [PMC free article] [PubMed] [Google Scholar]
- 22.Karlsson FH, Fåk F, Nookaew I, et al. Symptomatic atherosclerosis is associated with an altered gut metagenome. Nat Commun. 2012;3(1):1–8. [DOI] [PMC free article] [PubMed] [Google Scholar]
- 23.McDonald D, Hyde E, Debelius JW, et al. American gut: an open platform for citizen science microbiome research. MSystems. 2018;3(3):e00031–18. [DOI] [PMC free article] [PubMed] [Google Scholar]
- 24.McDonald D, Kaehler B, Gonzalez A, et al. redbiom: a Rapid Sample Discovery and Feature Characterization System. MSystems. 2019;4(4):e00215–19. [DOI] [PMC free article] [PubMed] [Google Scholar]
- 25.McDonald D, Clemente JC, Kuczynski J, et al. The Biological Observation Matrix (BIOM) format or: how I learned to stop worrying and love the ome-ome. Gigascience. 2012;1(1):2047–217X. [DOI] [PMC free article] [PubMed] [Google Scholar]
- 26.Bokulich NA, Kaehler BD, Rideout JR, et al. Optimizing taxonomic classification of marker-gene amplicon sequences with QIIME 2’s q2-feature-classifier plugin. Microbiome. 2018;6(1):90. [DOI] [PMC free article] [PubMed] [Google Scholar]
- 27.Segata N, Izard J, Waldron L, et al. Metagenomic biomarker discovery and explanation. Genome Biol. 2011;12(6):R60. [DOI] [PMC free article] [PubMed] [Google Scholar]
- 28.Kuhn M Building predictive models in R using the caret package. J Stat Softw. 2008;28(5):1–26.27774042 [Google Scholar]
- 29.Karatzoglou A, Smola A, Hornik K, Zeileis A. kernlab - An S4 Package for Kernel Methods in R. J Stat Software; Vol 1, Issue 9 November 2004. https://www.jstatsoft.org/v011/i09. [Google Scholar]
- 30.Liaw A, Wiener M. Classification and Regression by RandomForest. Forest. 2001;23. [Google Scholar]
- 31.Therneau T, Atkinson B, Ripley B, Ripley MB. Package ‘rpart.’ Available onlinecranmaicacuk/web/packages/rpart/rpartpdf (accessed 20 April 2016). 2015.
- 32.Jurka TP, Collingwood L, Boydstun AE, Grossman E, van Atteveldt W. RTextTools: A Supervised Learning Package for Text Classification. R J. 2013;5(1). [Google Scholar]
- 33.Andrieu C, De Freitas N, Doucet A, Jordan MI. An introduction to MCMC for machine learning. Mach Learn. 2003;50(1–2):5–43. [Google Scholar]
- 34.Wickham H Ggplot2: Elegant Graphics for Data Analysis. springer; 2016. [Google Scholar]
- 35.Stock J Gut microbiota: an environmental risk factor for cardiovascular disease. Atherosclerosis. 2013;229(2):440–442. [DOI] [PubMed] [Google Scholar]
- 36.Li XS, Obeid S, Klingenberg R, et al. Gut microbiota-dependent trimethylamine N-oxide in acute coronary syndromes: a prognostic marker for incident cardiovascular events beyond traditional risk factors. Eur Heart J. 2017;38(11):814–824. [DOI] [PMC free article] [PubMed] [Google Scholar]
- 37.Heianza Y, Ma W, Manson JE, Rexrode KM, Qi L. Gut microbiota metabolites and risk of major adverse cardiovascular disease events and death: a systematic review and meta‐analysis of prospective studies. J Am Heart Assoc. 2017;6(7):e004947. [DOI] [PMC free article] [PubMed] [Google Scholar]
- 38.Zeller G, Tap J, Voigt AY, et al. Potential of fecal microbiota for early‐stage detection of colorectal cancer. Mol Syst Biol. 2014;10(11):766. [DOI] [PMC free article] [PubMed] [Google Scholar]
- 39.Frank DN, Amand ALS, Feldman RA, Boedeker EC, Harpaz N, Pace NR. Molecular-phylogenetic characterization of microbial community imbalances in human inflammatory bowel diseases. Proc Natl Acad Sci. 2007;104(34):13780–13785. [DOI] [PMC free article] [PubMed] [Google Scholar]
- 40.Wang Z, Klipfell E, Bennett BJ, et al. Gut flora metabolism of phosphatidylcholine promotes cardiovascular disease. Nature. 2011;472(7341):57–63. [DOI] [PMC free article] [PubMed] [Google Scholar]
- 41.Douglas GM, Hansen R, Jones CMA, et al. Multi-omics differentially classify disease state and treatment outcome in pediatric Crohn’s disease. Microbiome. 2018;6(1):1–12. [DOI] [PMC free article] [PubMed] [Google Scholar]
- 42.Wingfield B, Coleman S, McGinnity TM, Bjourson AJ. A metagenomic hybrid classifier for paediatric inflammatory bowel disease. In: 2016 International Joint Conference on Neural Networks (IJCNN) IEEE; 2016:1083–1089. [Google Scholar]
- 43.Chen W, Cheng Y-M, Zhang S-W, Pan Q. Supervised method for periodontitis phenotypes prediction based on microbial composition using 16S rRNA sequences. Int J Comput Biol Drug Des. 2014;7(2–3):214–224. [DOI] [PubMed] [Google Scholar]
- 44.Elsayad AM, Fakhr M. Diagnosis of Cardiovascular Diseases with Bayesian Classifiers. JCS. 2015;11(2):274–282. [Google Scholar]
- 45.Papaloukas C, Fotiadis DI, Likas A, Michalis LK. An ischemia detection method based on artificial neural networks. Artif Intell Med. 2002;24(2):167–178. [DOI] [PubMed] [Google Scholar]
- 46.Khalaf AF, Owis MI, Yassine IA. A novel technique for cardiac arrhythmia classification using spectral correlation and support vector machines. Expert Syst Appl. 2015;42(21):8361–8368. [Google Scholar]
- 47.Masetic Z, Subasi A. Congestive heart failure detection using random forest classifier. Comput Methods Programs Biomed. 2016;130:54–64. [DOI] [PubMed] [Google Scholar]
- 48.TK KF, CN B, YK KL, PS KS, Bryant L, Kendall H. Machine Learning Clustering for Blood Pressure Variability Applied to Systolic Blood Pressure Intervention Trial (SPRINT) and the Hong Kong Community Cohort. Hypertension. 2020;0(0):HYPERTENSIONAHA.119.14213. doi: 10.1161/HYPERTENSIONAHA.119.14213 [DOI] [PubMed] [Google Scholar]
- 49.Weng SF, Reps J, Kai J, Garibaldi JM, Qureshi N. Can machine-learning improve cardiovascular risk prediction using routine clinical data? PLoS One. 2017;12(4). [DOI] [PMC free article] [PubMed] [Google Scholar]
Associated Data
This section collects any data citations, data availability statements, or supplementary materials included in this article.


