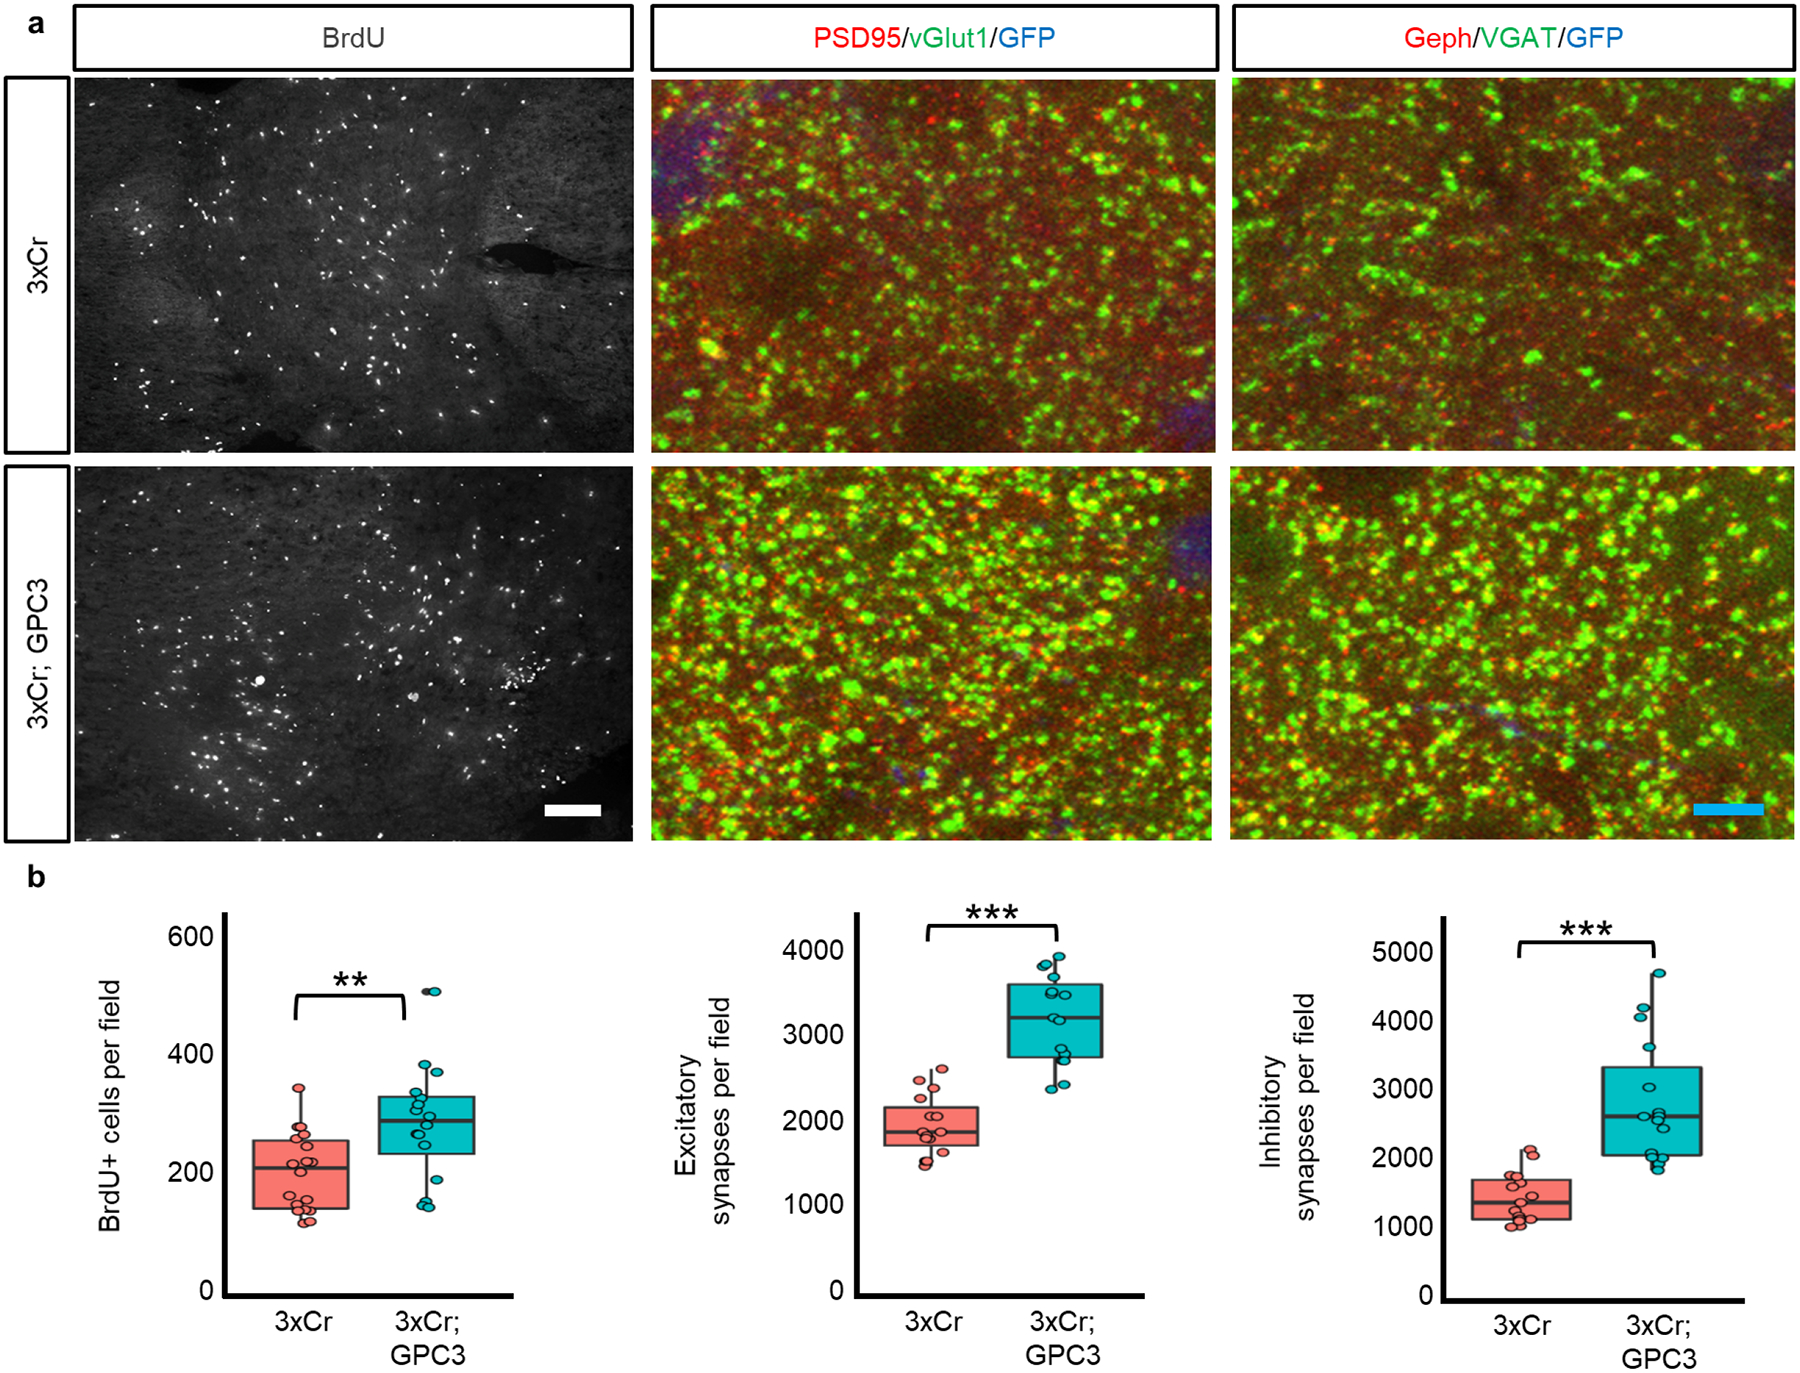
Extended Data Figure 8. GPC3 promotes gliomagenesis and synaptic imbalance.

a) Immunohistofluorescence analyses of 3xCr control and GPC3 overexpression tumors for BrdU, excitatory synapses, and inhibitory synapses. White scale bar = 50μm; blue scale bar = 5μm. b) Quantification of immunohistofluorescence analysis. NBrdU = 4 mice of each condition; NtechnicalBrdU-3xCr = 18; NtechnicalBrdU-GPC3 = 16. Nsynapse = 3 mice of each condition. Ntechnical-synapse = 15 for each condition and synapse type. Field for BrdU incorporation = 1600μm2 field; field for synapse analysis = 34,000μm2. Plots are centered on mean, boxing the interquartile range (25th-75th percentiles), with whiskers extending to 1.5 times the interquartile range above and below. p-values:* p<.05; ** p<.01; *** p<.001; calculated by One-way ANOVA.
