Abstract
Human regulatory T (Treg) cells are essential for immune homeostasis. The transcription factor (TF) FOXP3 maintains Treg cell identity, yet the complete set of key TFs that control Treg cell gene expression remains unknown. Here, we used pooled and arrayed Cas9 ribonucleoprotein (RNP) screens to identify TFs that regulate critical proteins in primary human Treg cells under basal and pro-inflammatory conditions. We then generated 54,424 single-cell transcriptomes from Treg cells subjected to genetic perturbations and cytokine stimulation, which revealed distinct gene networks individually regulated by FOXP3 and PRDM1, in addition to a network co-regulated by FOXO1 and IRF4. We also discovered that HIVEP2, not previously implicated in Treg cell function, co-regulates another gene network with SATB1 and is important for Treg cell-mediated immunosuppression. By integrating CRISPR screens and scRNA-seq profiling, we have uncovered novel transcriptional regulators and downstream gene networks in human Treg cells that could be targeted for immunotherapies.
Introduction
Regulatory T (Treg) cells are a highly specialized subset of CD4+ T cells that express the transcription factor FOXP3 and are essential for maintenance of self-tolerance and immune homeostasis. Treg cell-mediated suppression of autoreactive effector T cell responses has been demonstrated to occur via multiple mechanisms including secretion of anti-inflammatory factors such as IL-10, competition for the T cell growth promoting cytokine IL-2 via constitutive expression of the high affinity IL-2 receptor subunit CD25, and expression of inhibitory cell-surface receptors such as CTLA-4 which may disrupt costimulatory signals on antigen presenting cells (APCs)1. Disruption of any of these mechanisms, among others, can lead to severe inflammatory diseases. Indeed, Treg cells isolated from patients with multiple sclerosis, type 1 diabetes and systemic lupus erythematosus often have impaired suppressive functions2. Adoptive transfer of Treg cells is under active development as a strategy to treat a wide range of autoimmune and inflammatory diseases and for organ transplantation3.
In contrast, the immunosuppressive function of Treg cells has been shown to limit cancer immunity, and depletion of Treg cells in murine tumor models enhances immune-mediated clearance of cancer cells4. Moreover, experimental destabilization of FOXP3 expression in Treg cells can result in loss of suppressive function and acquisition of the capacity to produce proinflammatory cytokines such as IFN-γ, which has been implicated in boosting anti-tumor responses4, 5, 6. These findings suggest that manipulation of Treg cells to enhance or interfere with their function, either pharmacologically or via ex vivo genetic engineering, may be a promising therapeutic avenue for treatment of autoimmune diseases or malignancy, respectively. However, to realize the full therapeutic potential of these cells, we must first define the gene networks that underpin and coordinate their function.
The best-characterized transcription regulator in Treg cells is the lineage-defining transcription factor FOXP3, which is required for Treg cell development and function; congenital loss-of-function mutations in FOXP3 in humans result in immunodysregulation, polyendocrinopathy, enteropathy, X-linked syndrome (IPEX) characterized by severe multi-organ autoimmunity7. FOXP3, however, is not solely responsible for the Treg cell phenotype, and both mice and humans lacking functional FOXP3 still possess a population of “wannabe” Treg cells that – despite their lack of immunosuppressive capacity – express a number of classical Treg cells markers such as ICOS, CTLA-4 and CD258, 9, 10. Extracellular cues can provide a physiologic means of altering Treg cell function via effects on transcription factor (TF) levels and activity. For example, in viral-induced inflammatory lesions, Treg cells can lose FOXP3 expression and adopt a proinflammatory TH1-like phenotype in a manner at least partly dependent on over-exuberant signalling downstream of IL-1211. Similarly, exposure of Treg cells to IL-6 and IL-23 during autoimmune inflammation can result in FOXP3 loss and induction of IL-17 secretion12. These observations argue that additional TFs, modulated by the inflammatory milieu, help to shape distinct aspects of Treg cell gene expression programs. Indeed, current literature suggests that several TFs including FOXP1, IRF4, GATA1, and LEF1 synergize with FOXP3 to induce or reinforce the gene networks that underlie normal Treg function13, 14. A more comprehensive map of the gene networks that drive human Treg cell phenotypes would greatly help elucidate how such TFs control their gene targets in different cellular environments.
CRISPR-Cas9 RNP technology now allows dissection of complex gene modules in primary human Treg cells through targeted gene perturbation studies. We developed an approach to assess cellular phenotypes resulting from knockout (KO) of 40 different candidate TFs in primary human Treg cells with novel pooled and arrayed Cas9 RNP screens carried out in vitro under different pro-inflammatory cytokine conditions. First, we used pooled delivery of Cas9 RNPs coupled with flow-sorted and multiplexed amplicon sequencing to identify TFs that, when disrupted, caused dysregulated expression of canonical Treg and T effector (Teff) cell proteins. We then validated the results from this novel approach and further studied the effects of individual TF KOs by arrayed RNP delivery and multi-parameter flow cytometry. Based on these results, we selected a subset of TFs for functional transcriptional profiling using scRNA-seq. Thus, through combination of TF KOs, cytokine stimulations, and scRNA-seq, we have compiled a large resource of single-cell transcriptomes from both control and gene edited human Treg cells subjected to variable cytokine conditions. We identified multiple gene networks controlling the regulation of cytokines, co-inhibitory receptors, and TFs, themselves, each regulated by distinct sets of TFs, including one co-regulated by HIVEP2, a TF not previously implicated in Treg cell biology. The resulting functional network maps may help guide future development of drug targets and design of Treg cell-based therapies for treatment of immune dysregulated states.
Results
Selection of candidate Treg cell TFs for genetic perturbation
We sought to identify TFs that are essential for the expression or repression of key genes in Treg cells, focusing on FOXP3, CTLA-4 and IFN-γ. Twenty-five candidate TFs, including the canonical Treg cell TFs FOXP3 and Helios (IKZF2), were chosen based on preferential expression in Treg cells compared to other CD4+ T cell subsets in published RNA-seq datasets (Roadmap Epigenomics Project15). In addition, we hypothesized that TF-encoding genes containing regions specifically demethylated in human Treg cells as opposed to conventional CD4+ T cells might, like FOXP3, be critical for Treg cell function16. Accordingly, TCF7 (TCF-1), PRDM1 (PRDM1; also known as BLIMP-1), JAZF1 (JAZF1) and HIVEP2 (HIVEP2) were selected on the basis on preferential intragenic demethylation17. 11 additional TFs were selected based on their described roles in murine Treg cell gene regulation (Supplementary Table 1).
Pooled Cas9 RNP screens link indels with phenotypic changes in human Treg cells
To dissect the phenotypic and functional effects of expression of the 40 selected candidate TFs on Treg cell identity, we developed a pooled Cas9 RNP KO approach in ex vivo cultured primary human Treg cells (Fig. 1a). Ex vivo cultured and expanded human Treg cells have been shown to maintain stable phenotype and to have high suppressive capacity18. We adapted clinical protocols for Treg cell isolation and initial expansion for the following experiments18, 19. Each TF was targeted with one gRNA, selected based on predicted and experimentally validated on-target editing efficiency (Dharmacon pre-designed crRNAs). The individual RNPs were mixed in equimolar ratios and the pool of Cas9 RNPs was electroporated into ex vivo expanded human Treg cells. In parallel, expanded Treg cells were electroporated separately with control non-targeting RNPs: functional RNPs loaded with guide RNAs that are not expected to target the human genome. Two days after electroporation, Treg cells were incubated for 72 hours with IL-2 alone (‘w/o’) or in combination with a pro-inflammatory cytokine (IL-4, IL-6, IL-12 or IFN-γ). On day 5 post-electroporation, cells were flow sorted based on their expression levels of Treg cell markers (FOXP3 and CTLA-4) or based on their expression levels of the pro-inflammatory effector cytokine IFN-γ (Fig. 1b; gating strategy: Extended Data Fig.1a). Replicate experiments were performed in Treg cells from four human blood donors. The pooled Cas9 RNPs successfully altered target protein levels relative to control treated cells (Fig. 1b and Extended Data Fig. 1b).
Figure 1. Pooled Cas9 RNP screens identify regulators of FOXP3, CTLA-4 and IFN-γ levels in Treg cells.
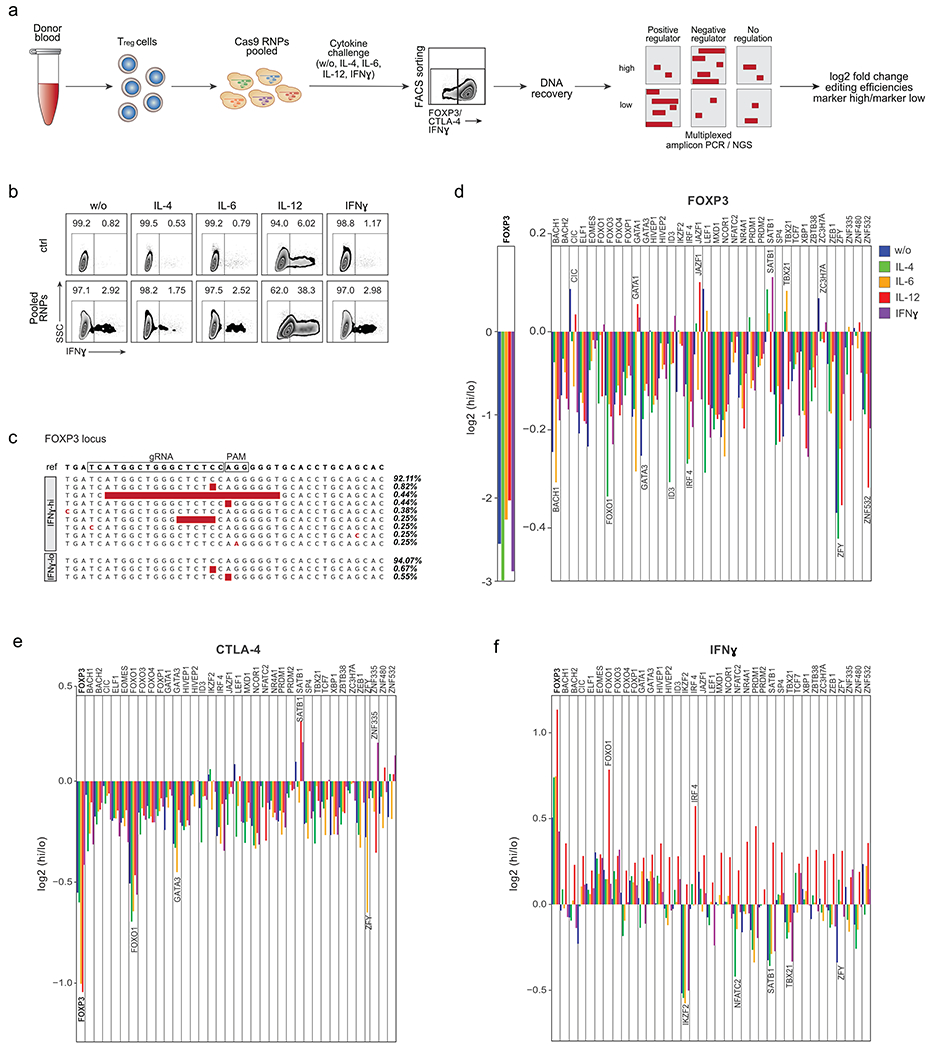
(a) Schematic workflow of pooled Cas9 RNP screens. Following cell sorting based on protein expression in varying cytokine conditions, DNA is recovered, target and control sites are amplified by multiplex PCR, and amplicons are subjected to deep sequencing. (b) FACS sorting strategy to isolate IFN-γ–high (hi) and IFN-γ-lo w (lo) Treg cells after electroporation with non-targeting control Cas9 RNP (ctrl; top) or with a pool of RNPs targeting 40 selected TFs. Ctrl and “Pool RNP” Treg cells were stimulated with IL-2 only (w/o) or IL-2 with IL-4, IL-6, IL-12 or IFN-γ. Representative example from one of 4 human blood donors (ZFY KO was assessed in only 3 human blood donors). (c) Selected examples of indels detected with multiplex PCR and deep sequencing at the targeted FOXP3 locus in FACS-sorted IFN-γ–hi and IFN-γ-lo cell populations. Read frequencies are shown on the right. (d) log2 fold enrichment of indels in FOXP3-hi vs. FOXP3-lo cell populations at the targeted FOXP3 locus (left) or at other targeted TF loci (right). (e) log2 fold enrichment of indels in CTLA-4-hi vs. CTLA-4-lo cell populations at target loci. (f) log2 fold enrichment of indels in IFN-γ–hi vs IFN-γ-lo cell populations at target loci. d-f: Mean of log2 fold enrichment in cells from 4 blood donors. Results of the ctrl regions: Extended Data Fig. 1c – e.
We reasoned that disruptive mutations in critical TF genes would be enriched in cells with dysregulated target gene expression. DNA from sorted cell populations was subjected to multiplexed amplicon PCR followed by next generation sequencing (NGS) (Fig. 1a, Supplementary Table 1). For 37 of the 40 targeted loci, the indel frequency in the sorted cell fraction could be determined successfully (IKZF4, TGIF1 and ZNF831 target loci were not efficiently PCR-amplified and were thus excluded from further analysis). For each of the 40 loci, we included one control amplicon within +/− 1 kb of the gRNA target site to test for potential artefacts after DNA processing (Supplementary Table 1). We did not detect indels in Treg cells electroporated with non-targeting control RNP, and only low levels of the control regions 1 kb up- or downstream of the target sites, suggesting that non-specific sequencing errors were only introduced at low levels during intracellular staining and DNA recovery (Supplementary Table 1; Extended Data Fig. 1c–e). We confirmed that, as expected, FOXP3 mutations caused dysregulated expression of IFN-γ. Indeed, in the absence of additional cytokine stimulation, the pooled RNP library increased the frequency of IFN-γ-producing Treg cells to 2.92% from 0.82% in the control-treated Treg cells20. Although we found preferential accumulation of large disruptive mutations in the FOXP3 locus in IFN-γ+ Treg cells validating our novel pooled Cas9 RNP platform (Fig. 1c, f), 92% of the FOXP3 alleles were not mutated, suggesting that the pool of RNPs is targeting key TFs in addition to FOXP3 to result in increased IFN-γ production. Thus, pooled Cas9 RNP editing allows for efficient assessment of the effects of RNP-mediated mutations on Treg cell phenotypes (Fig. 1c).
Novel regulators of FOXP3, CTLA-4 and IFN-γ in human Treg cells
Next, we systematically analysed the effects of each TF on regulation of FOXP3, CTLA-4 and IFN-γ in human Treg cells across multiple cytokine conditions. Based on measured indel frequencies in each sorted population, we calculated the log2 of the ratio of edit enrichment in the “marker-high” cells to the edit enrichment in the “marker-low” cells (Fig. 1d–f).
As expected, direct targeting of the FOXP3 gene had the strongest effect on FOXP3 expression in all conditions. We found that ablation of most TFs reduced FOXP3 expression, suggesting that many regulators converge to maintain stable levels of FOXP3. Reduced FOXP3 levels were associated with mutations in known regulators of FOXP3 expression (IRF4 and GATA3)21, 22, as well as in novel regulators (BACH1 and ZNF532). The effects of some mutations were only revealed in particular cytokine conditions. For example, loss of FOXP3 expression was most pronounced in ID3 KO Treg cells following IL-4 treatment. We also discovered TFs KOs that stabilized or potentially increased FOXP3 expression in specific treatment conditions including CIC (w/o, IL-12) and SATB1 (IFN-γ, IL-4), suggesting context-dependent negative regulation of FOXP3 expression by these TFs (Fig. 1d).
We also discovered TFs that regulate CTLA-4 protein expression in Treg cells (Fig. 1e). Mutations in most of the candidate TFs led to reduced CTLA-4 levels, with the most pronounced losses arising from FOXP3 and FOXO1 mutations. The FOXO1 KO phenotype was consistent with observations in mouse models23. In contrast, SATB1 and ZNF335 mutations stabilized or increased CTLA-4 expression in Treg cells treated with IFN-γ, highlighting novel regulators that could potentially be targeted to enhance CTLA-4 expression in inflamed tissues.
Consistent with prior reports, IL-12 treatment induced IFN-γ expression in human Treg cells (Fig. 1b, 1f)20. We found that IL-12-mediated induction of IFN-γ was potentiated by mutations in FOXP3, IRF4 and FOXO1. Conversely, deletions in TBX21 (encoding the transcription factor T-bet) strongly reduced IL-12-induced Treg cell IFN-γ production, consistent with critical roles for T-bet in the regulation of TH1-like Treg cells24. IKZF2 KO cells were mainly found in the IFN-γ-negative cell fraction in all cytokine conditions except for IL-12. This result contrasts with prior observations that murine Helios-deficient Treg cells secrete pro-inflammatory cytokines including IFN-γ25, 26. This discrepancy may result from constitutive deletion of IKZF2 in murine studies as opposed to acute depletion in our studies, or may be secondary to species-specific effects. We demonstrated here that pooled Cas9 RNP screens can serve as a medium-throughput platform to identify mutations that cause key phenotypic changes in human Treg cells. This platform could be adapted readily for functional genetic studies in other human primary cell populations.
Characterization of TF KO Treg cells by arrayed delivery of CRISPR RNPs
We tested the same set of TFs in an arrayed 96-well Cas9 RNP format using three individual gRNAs for each TF (Supplementary Table 2), performed in cells from two additional human blood donors in the presence or absence of IL-12, a condition that had pronounced effects in our pooled screen (Fig. 1b–f). To assess the resulting changes in Treg cell phenotypes, we used flow cytometry to measure cell viability and expression levels of the canonical Treg and effector T cell molecules and cytokines FOXP3, Helios, CTLA-4, CD25, IL-10, IL-2, IL-4, IL-17a, and IFN-γ (Fig. 2a, FACS gating strategy: Extended Data Fig. 2a, b). We used three different RNPs with non-targeting gRNAs to control for possible confounding effects of RNP electroporation. Cell viability generally was not affected strongly by genetic perturbation or cytokine stimulation (Extended Data Fig. 2c). This approach allowed us to validate the observed effects of each gene perturbation in the pooled screen and further characterize the effect of each gene perturbation on an expanded panel of core T cell protein products.
Figure 2. Arrayed flow cytometry characterization of TF KO Treg cells.
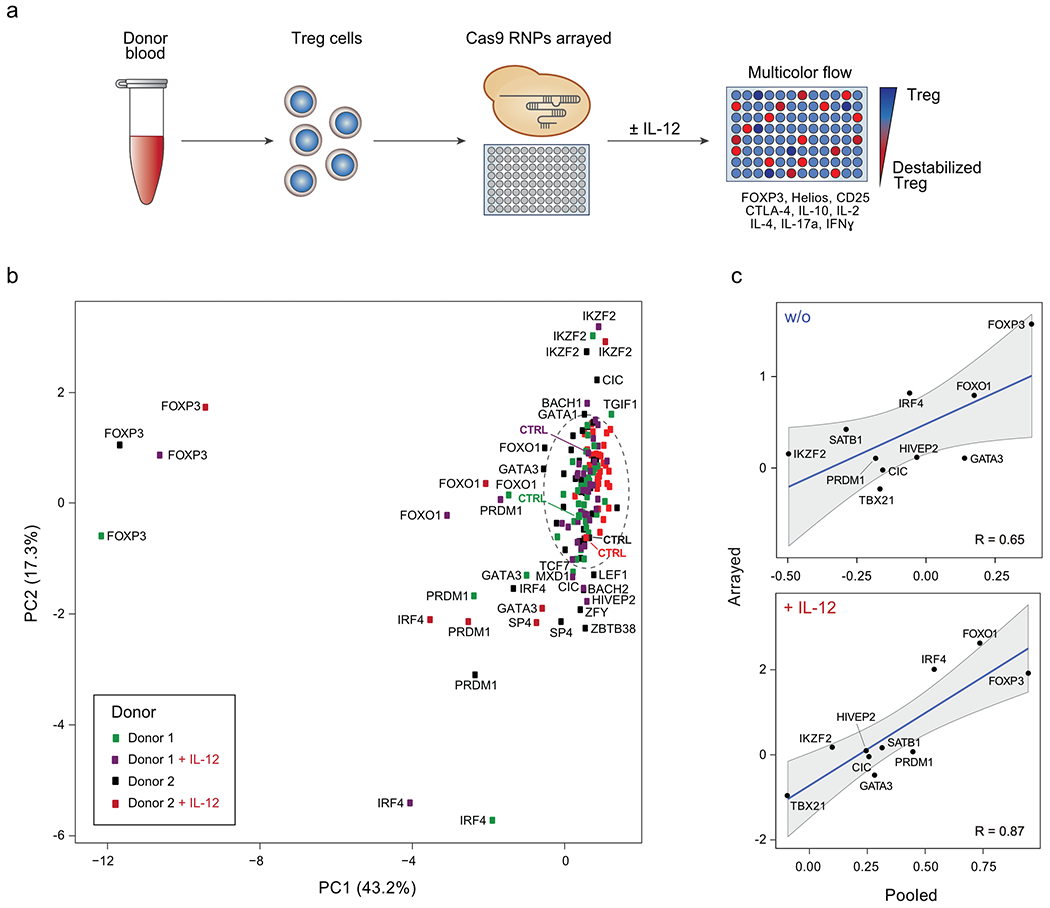
(a) Workflow of arrayed Cas9 RNP screens for TFs regulating Treg cell identity. The flow cytometry panel of assessed Treg and Teff cell proteins is shown. (b) Principal Component Analysis (PCA) summarizing flow cytometry results of 40 TF KOs Treg cells and non-targeting controls without and with IL-12 (results from 2 human blood donors). In the circle: Controls and KO conditions with minimal dysregulation of assessed proteins based on PCA. The mean of 3 independent gRNAs targeting each TF was used as the input for each condition. (c) Comparison of IFN-γ results generated in pooled (log2(#indels in IFN-γ-high population/#indels in IFN-γ-low population) versus arrayed Cas9 RNP screens (log2(% IFN-γ-high in KO/% IFN-γ-high in ctrl)) with and w/o IL-12 for 10 selected TFs with notable effects on protein levels (see Methods and Supplementary Table 4). For the pooled screen, the calculated values are based on the mean frequency fold-change values from 4 human blood donors. For the arrayed screen, the calculated values are based on the mean fold-change values derived from 3 independent gRNAs and 2 blood donors. Correlation coefficients (R values) are based on these data points and shown in each graph. Shading is provided by the loess algorithm in R, which uses polynomial regression to locally fit a surface to each point.
To visualize changes in the overall phenotypic state resulting from each perturbation, we first used the Principal Components Analysis (PCA) algorithm to dimensionally reduce the nine marker flow cytometry space to two dimensions. The resulting plot summarizes the cellular phenotypic shifts caused by the three individual Cas9 RNPs targeting each TF in each cytokine stimulation condition across both donors (Fig. 2b). The efficiencies of most, but not all, genetic perturbations were assessed by amplicon sequencing (Supplementary Table 2). Non-targeting Cas9 RNP treatments clustered together as did the majority of other conditions, consistent with reproducible phenotypic data across experimental conditions and modest effects for most perturbations. In contrast, Cas9 RNPs targeting FOXP3 and IKZF2 had pronounced effects, as expected based on their known roles in Treg cell biology. GATA3, PRDM1, IRF4 and FOXO1 KO cells all showed distinct patterns of protein dysregulation with and without IL-12. Several conditions—such as HIVEP2 KO after IL-12 treatment—only led to marked dysregulation in one blood donor, which may be due to experimental variables or donor-specific biology such as genetic background or immune history. Overall, data in the arrayed gene KO experiments correlated well with those in pooled screens (Fig. 2c; Extended Data Fig. 3a, b), validating our novel pooled approach and confirming that disruption of specific TFs caused distinct patterns of Treg cell phenotypic dysregulation.
Multidimensional analysis of phenotypic changes in KO Treg cell subpopulations
We next assessed the quantitative effects of each TF KO on the core Treg cell phenotypic protein markers. For each KO, we visualized protein levels using traditional two-dimensional flow cytometry then used “personality plots” and multidimensional Scaffold analysis to assess altered Treg cell phenotypes promoted by TF ablation (Fig. 3; gating strategy: Extended Data Fig. 2a, b)27. Scaffold is a graph-based approach (schematic of the Scaffold analysis workflow: Extended Data Fig. 3c), initially designed for mass cytometry data, that allows a global view of phenotypic diversity of single cells in a dataset. Each cluster represents a sub-phenotype of perturbed Treg cells characterized by a distinctive expression pattern of the nine markers in our panel (Fig. 3, Extended Data Fig. 3d, e). Proximity to one of the landmark nodes on the Scaffold graph indicates similarity of the cluster to the respective landmark. The size of an individual cluster indicates the number of cells with that sub-phenotype. The change in colour indicates a change in phenotype intensity (detailed description in Material and Methods).
Figure 3. Deep phenotypic analysis of altered protein expression resulting from individual TF ablations.
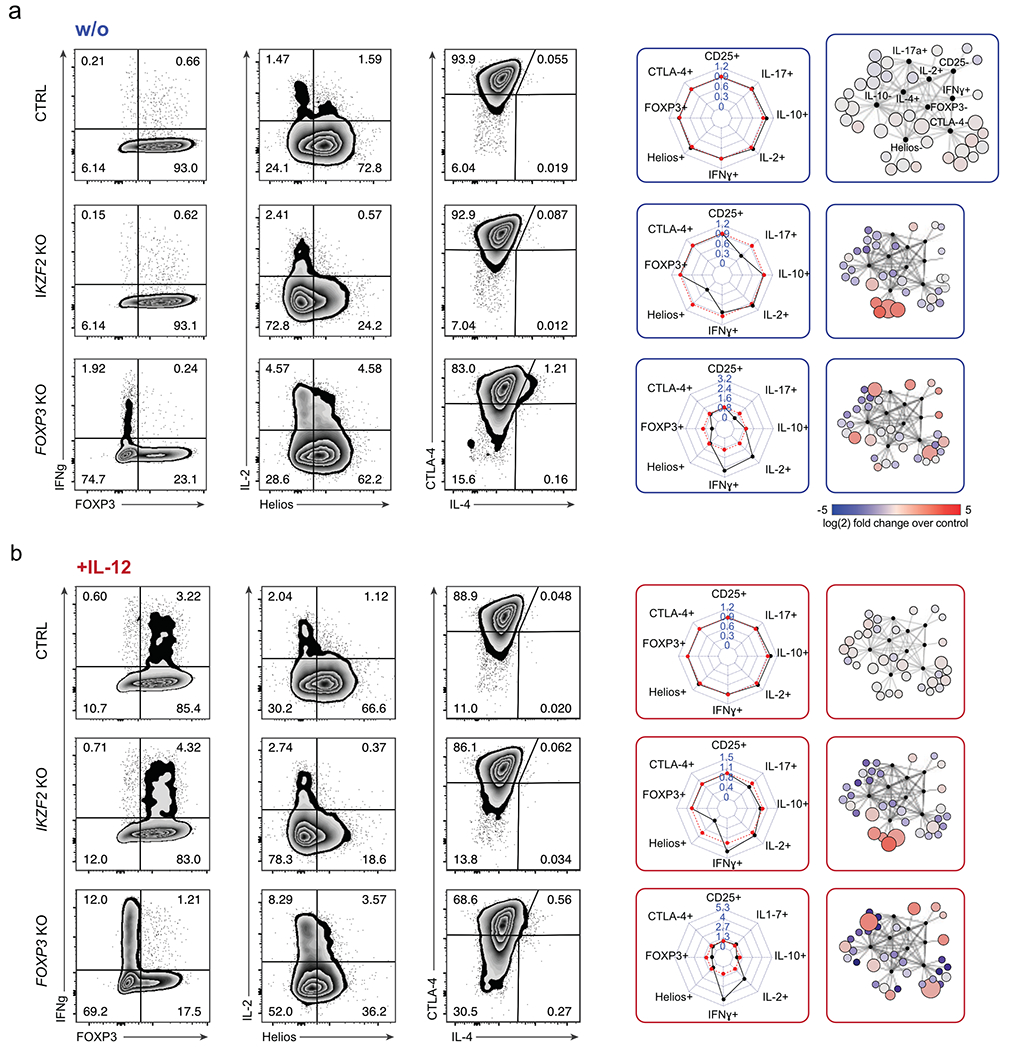
(a) Left: Representative flow cytometry analysis of IKZF2 KO and FOXP3 KO Treg cells compared to control non-targeting RNP-treated Treg cells (ctrl) without IL-12 stimulation. Middle: Personality plots summarizing flow cytometry results for 8 markers (IL-4 was excluded from these plots due to low absolute levels that skewed fold-change analyses). Each dimension on the personality plots—representing one flow cytometry marker—indicates the ratio of the percent “marker-high” cells in TF KO population relative to the percent “marker-high” in non-targeting RNP treated Treg cells. Red lines indicate average marker positive cells in ctrl cells electroporated with non-targeting RNP (6 ctrls; 3 different non-targeting RNPs, one replicate each). For each TF KO, black lines indicate the ratio of percent positive expression of a given marker relative to the average of the associated ctrls. Right: Corresponding Scaffold plots for 9-dimensional visualization of flow cytometry data27. Landmark nodes (black) are labelled based on reference gates in ctrl samples. Size of cluster nodes indicates number of cells in the cluster. Colour scale: increase (red) or decrease (blue) in relative population frequency of given cluster. Representative results from one of two blood donors and one of three independent gRNAs. (b) Flow cytometry results and personality plots for ctrl, IKZF2 KO and FOXP3 KO Treg cells with IL-12 treatment (same Cas9 RNPs and same donor as in a). Representative result from one of two blood donors and one of three independent gRNAs.
As expected, IKZF2 KO cells were marked by strongly reduced Helios levels and enriched in the Scaffold region corresponding to Helios-negative cells in both cytokine conditions. Similarly, FOXP3 deletion resulted in cells with reduced FOXP3 protein. FOXP3 KO Treg cells were characterized by varying levels of increased production of the inflammatory cytokines IL-4, IFN-γ and IL-2; these cells occupied various states across the Scaffold map, with significantly altered phenotype frequencies relative to control-treated Treg cells. IFN-γ and IL-2 levels were boosted further in FOXP3 KO Treg cells upon treatment with IL-12. These results were consistent across multiple gRNAs and blood donors (Extended Data Fig. 3d, e). Scaffold results were consistent with two-dimensional flow cytometric analysis, which confirmed a largely single parameter dysregulation with IKZF2 ablation and multiparametric changes in Treg cell identity with FOXP3 ablation (Fig. 3a and b). Thus, we were able to detect the frequency and severity of altered Treg cell phenotypes that emerged upon ablation of key TFs in different cytokine conditions.
We next compared the effects of disrupting FOXP3, Helios and a few other selected TFs in conventional CD4+ T cells in addition to Treg cells. We also assessed three TFs (MYBL1, IRF8, and T-bet) that are preferentially expressed in conventional CD4+ CD25low CD127high T cell subsets (here also called Teff cells) based on published data15. FOXP3 ablation had more pronounced effects in Treg cells compared to Teff cells, whereas MYBL1, IRF8, and T-bet ablation had clear effects on the cytokine profiles of Teff cells but showed only minor effects on Treg cells. Helios depletion resulted in distinct phenotypes in both Teff and Treg cell subsets, as did disruption of TFs that were highly expressed in both subsets (SATB1, HIVEP2, GATA3). These experiments confirmed our ability to identify Treg cell specific (as opposed to general CD4+ T cell) gene regulatory programs (Extended Data Fig. 4, Supplementary Table 3).
We next used Scaffold analysis to identify and rank the TF KOs with the strongest multiparametric effects on human Treg cells from both blood donors (ranking of the Scaffold analysis across perturbations in two independent donors: Supplementary Table 4). While only minor phenotypic effects were observed in IL-12-treated HIVEP2 and SATB1 KO Treg cells when a limited set of target proteins were assessed with the pooled Cas9 RNP screens or two-dimensional flow cytometry analysis (Fig. 2b), multiparametric analysis with Scaffold in the arrayed screen revealed a complex pattern of phenotypic dysregulation (Scaffold analysis and personality plots; Fig. 4a). We also discovered strong phenotypic changes in FOXO1, IRF4 and PRDM1 KO Treg cells; FOXO1 and IRF4 KO cells secreted high amounts of proinflammatory IFN-γ after IL-12 treatment while PRDM1 KO cells secreted IL-2 independent of cytokine treatment (Fig. 4b). Based on this Scaffold analysis, we selected a subset of conditions for even higher resolution phenotypic profiling with scRNA-seq. We chose the nine TFs with the strongest effects on Treg cell phenotype and also included T-bet due to its essential function in promoting IFN-γ production after IL-12 stimulation (Supplementary Table 4).
Figure 4. Multidimensional characterization of selected hits from arrayed Cas9 RNP screen.
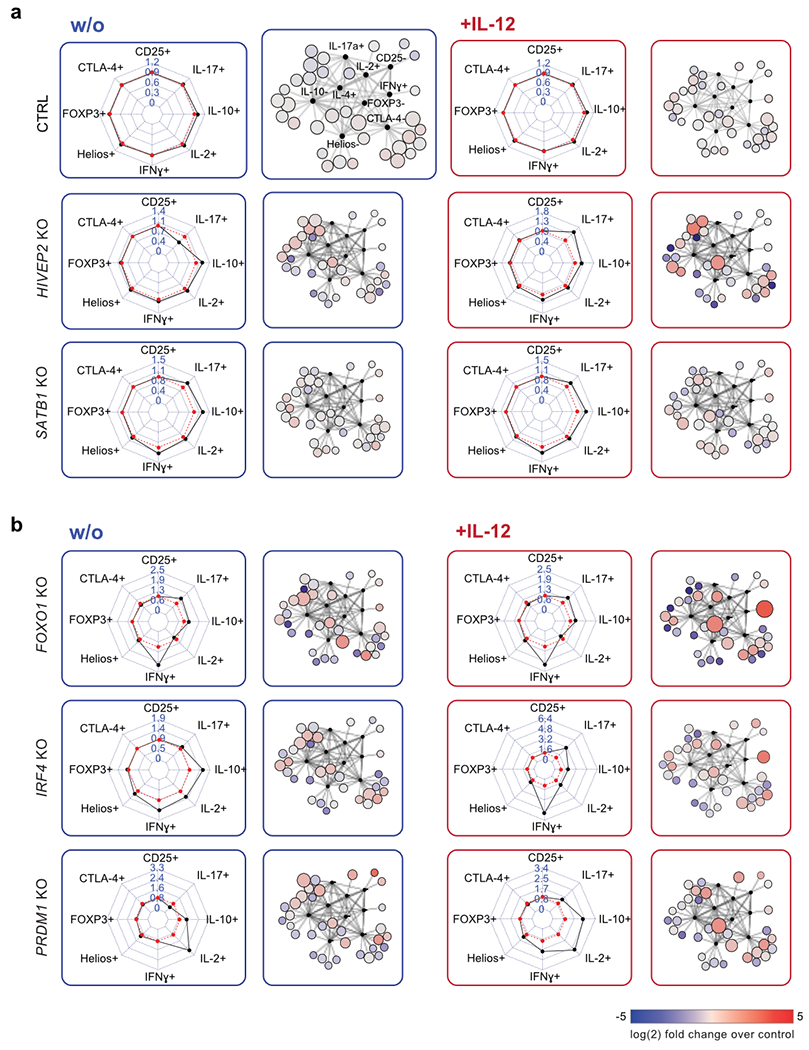
(a) Representative personality plots and Scaffold analysis of SATB1 KO and HIVEP2 KO Treg cells compared to control non-targeting RNP treated Treg cells (ctrl) without (blue) and with IL-12 stimulation (red) (IL-4 was excluded from these plots due to low absolute levels that skewed fold-change analyses). Ctrl Treg cells are the same as shown in Fig. 3a. (b) Representative personality and Scaffold plots for FOXO1, IRF4 and PRDM1 KO Treg cells. Dysregulated cytokine production after IL-12 production is highlighted in the respective Scaffold plots. Representative results from one out of two blood donor and one of three independent gRNAs.
scRNA-seq maps of altered gene networks in TF KO Treg cells
We next identified the gene networks regulated by the ten selected TFs, in the presence or absence of IL-12, in Treg cells isolated from two blood donors (Supplementary Table 3). We coupled targeted disruption of individual TFs with scRNA-seq to generate a high-resolution resource of transcriptomes (54,424 single-cell Treg transcriptomes; editing efficiencies: Supplementary Table 3).
We identified the most highly variable genes (618 genes) in this data set and used these genes as inputs for downstream dimensional reduction and clustering. Our analysis identified eight distinct cell-state clusters (Fig. 5a – c). Fig. 5a and 5b lists the top ten upregulated genes in each cluster, generated by differential gene expression analysis comparing the expression profile of a given cluster against all others clusters. Control RNP-treated Treg cells could be found in all detected clusters with widely varying frequencies revealing cell-state heterogeneity among non-edited human Treg cells. The scRNA-seq results were largely concordant with the multidimensional protein analysis above; transcript analysis of TF KO Treg cells revealed shifted phenotypic landscapes relative to the distribution of cell phenotypes observed in control-treated cells (Fig 5c, Extended Data Fig. 5). Additionally, previously measured changes in protein expression after TF ablation in the arrayed Cas9 RNP screen correlated well with changes in mRNA levels assessed by scRNA-seq (Extended Data Fig. 6a).
Figure 5. Distinct phenotypic landscapes in scRNA-seq of TF KO human Treg cells.
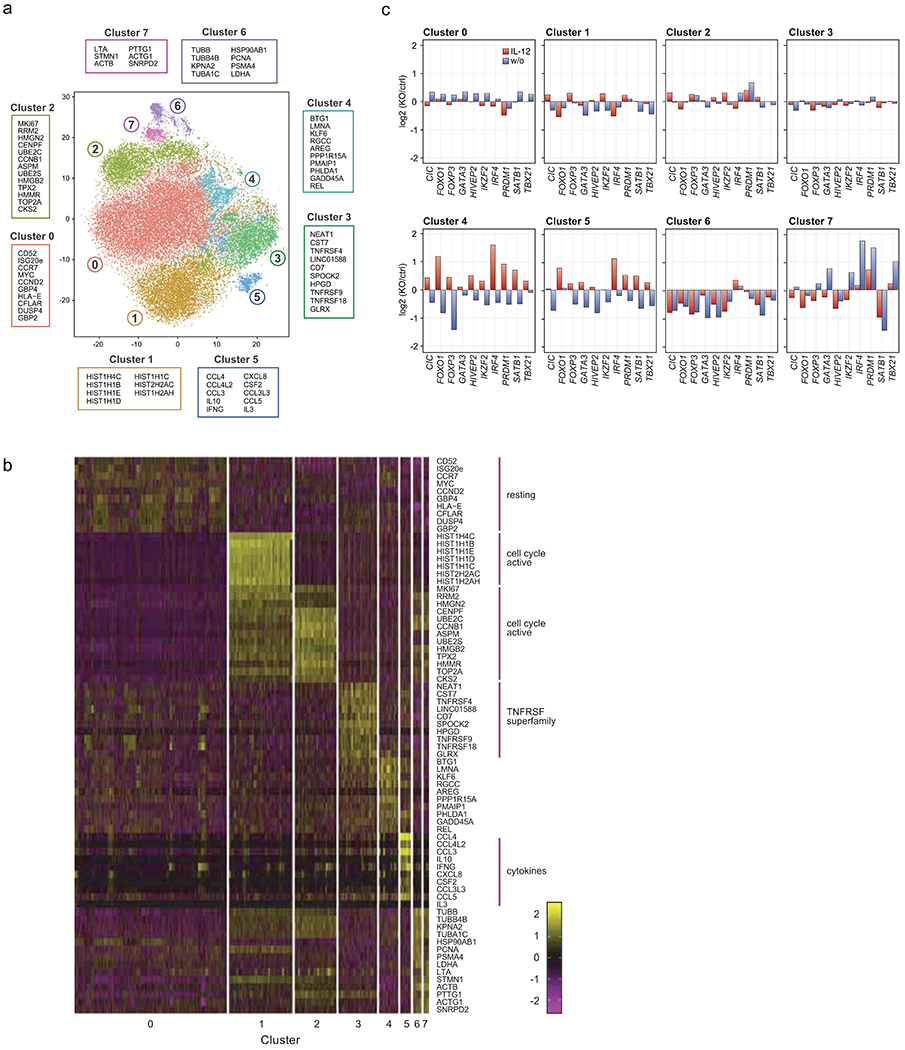
(a) t-SNE plot summarizing all cell states assessed by analysis of 10 TF KO and control Treg cells electroporated with non-targeting Cas9 RNP with and without IL-12 stimulation. 8 cell phenotype clusters (Clusters 0-7) were identified based on DE gene expression analysis of the scRNA-seq data. The 10 genes with the highest fold-change in expression levels in each individual cluster compared to all clusters are indicated. (b) Heatmap showing the individual cellular expression levels of the top 10 genes differentially expressed in each cluster versus other clusters in Fig. 5a). (c) Phenotypic distribution of cells in each cluster resulting from each TF KO w/o (blue) and with IL-12 stimulation (red) (normalized to ctrl cells in the corresponding cytokine condition). Data were generated with ex vivo expanded Treg cells from 2 human blood donors. Detailed list of all conditions: Supplementary Table 3.
Phenotypic clusters of cells were characterized by differential upregulation of cell cycle/cell survival genes (cluster 0–2), co-inhibitory receptor genes (cluster 3), and cytokine/chemokine genes (cluster 5). Cells in cluster 5 expressed the immunosuppressive cytokine IL-10 along with the pro-inflammatory cytokines IFN-γ and IL-4 (Fig. 5b). Normalized frequencies of TF KO cells with and without IL-12 stimulation in each cluster are summarized in Fig. 5c and Extended Data Fig. 5 (density plots). These analyses revealed the natural heterogeneity amongst human Treg cells as well as shifts in their phenotypic landscape following different genetic perturbations.
Identification of key gene networks regulating Treg cell identity
We systematically assessed the relative strength of each TF’s effect on expression of each gene by using our scRNA-seq data to create a weighted adjacency matrix (Methods: computational analysis of scRNA-seq data). We visualized these relationships in force-directed network graphs (Fig. 6).
Figure 6: Functional dissection of gene networks downstream of key TFs in human Treg cells using scRNA-seq data.
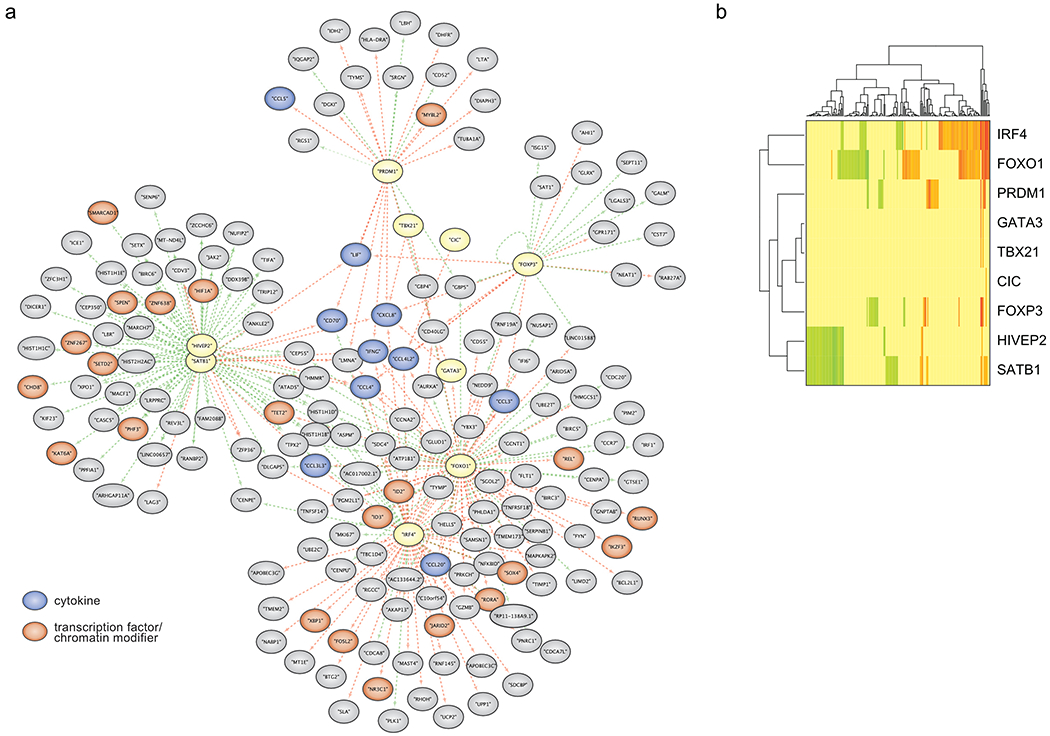
(a) Force-directed graph of gene modules regulated by Treg TFs (yellow) after IL-12 stimulation. Genes with reduced expression in response to a given TF KO are indicated by adjoining green arrows, and genes with increased expression in response to a given TF KO are marked with adjoining red arrows. TF target genes encoding cytokines and chemokines are shown in blue and target genes encoding TFs and chromatin modifiers are shown in orange. (b) Heatmap summarizing the results of the network graph shown in Fig 6a. Scale bar: log2(mean expression of TF KO population/mean expression of ctrl cells of the corresponding cytokine condition). Green indicates that TF KO represses expression of a gene, while red indicates that TF KO increases expression of a gene. Data were generated in ex vivo expanded Treg cells from two human blood donors, the same as presented in Fig 5. Detailed list of all conditions: Supplementary Table 3.
Consistent with our prior analyses, we observed marked transcriptome changes in TF KO Treg cells, especially after IL-12 treatment (Fig. 6a; unstimulated KO Treg cells: Extended Data Fig. 6b, c). We focused on gene networks altered by loss of FOXP3, IRF4, FOXO1, PRDM1, SATB1 and HIVEP2 in IL-12 treated cells (other tested TFs only showed less pronounced effects and were excluded from the network analysis). The network graphs highlight a central set of proinflammatory genes encoding LIF, CXCL8, IFN-γ, CCL4, CCL4L2, and CD40L that are jointly repressed by multiple TFs, consistent with the paramount importance of suppressing proinflammatory protein production in normal Treg cells even in an inflammatory milieu (Fig. 6a). FOXP3 and PRDM1 regulated distinct gene networks that were largely separate from the networks regulated by other TFs and included genes associated with Treg cell proliferation and function. The network of genes with altered transcript levels in FOXP3 KO Treg cells (relative to control Treg cells) was enriched for genes that are directly bound by FOXP3 (p = 0.0003; see methods)28. PRDM1 appeared to act mainly as a transcriptional repressor, as PRDM1 disruption increased transcription of gene target clusters. The genes regulated by IRF4 and FOXO1 had notable overlap (Fig. 6a, b) and numerous genes depended on their coordinated action for proper tuning of mRNA expression (largely mRNA repression). IRF4 and FOXO1 target genes were linked to cell survival and proliferation and encoded a substantial number of TFs implicated in Treg cell function including c-Rel, ID2, ID3, IKZF3, RUNX3 and XBP113, 29, 30, 31.
We additionally discovered a large network of genes co-regulated by SATB1 and HIVEP2, the latter a TF not previously implicated in human Treg cell biology. SATB1- and HIVEP2-dependent genes encoded several TFs and chromatin modifiers including HIF1α—which is involved in Treg cell differentiation and metabolism—and TET2, an enzyme regulating critical DNA demethylation events in Treg cells32, 33, 34 (Fig. 6a, b). Loss of HIVEP2 (also: Schnurri-2) in murine models has been noted to affect thymic selection and promote marked TH2 skewing35, 36. However, HIVEP2 has not been previously identified as a critical regulator of Treg cell stability or function. Consequently, we tested whether HIVEP2 was critical for the immunosuppressive function of human Treg cells in a model of graft-versus-host disease (GvHD). Transfer of human PBMCs into immunodeficient NOD scid gamma (NSG) mice causes xeno-GvHD that can be suppressed by co-transfer of functional human Treg cells37. We found that mice adoptively transferred with PBMCs together with either HIVEP2 KO Treg or FOXP3 KO Treg cells tended to lose weight faster and have lower survival rates than mice that received PBMCs with control-edited Treg cells (treated with RNPs that target the AAVS1 safe harbour locus) (Extended Data Fig. 7 ). These findings suggest that human Treg cell suppressive function depends on HIVEP2 in addition to FOXP3.
Discussion
Here, we have used pooled Cas9 RNP screens to identify TFs that help shape human Treg cell identity in various pro-inflammatory milieus4, 20, 38, 39. This new CRISPR RNP discovery platform complements recently developed methods for genome-scale pooled CRISPR screening in human and murine T cells40, 41. Unlike approaches that track lentiviral integration of gRNA-encoding sequences and correlate them with cell phenotypes, pooled Cas9 RNP screens allow us to directly track and quantify targeted mutations, removing small in frame deletions (3, 6 bps) from further analysis. This technology can be easily adapted to decipher functional effects of specific mutations at targeted sites in various cell types with a broad range of selectable phenotypes.
Our work moreover provides a rich resource of single cell human Treg cell state data assessed by multi-parametric flow cytometry and transcriptome sequencing (scRNA-seq). Arrayed CRISPR RNP delivery allowed us to validate key TFs identified in our pooled Cas9 RNP screens and to determine their gene regulatory functions at the single cell level. Importantly, disruption of TFs in Treg and Teff cells resulted in distinct phenotypic changes, consistent with specialized TF functions within distinct T cell subsets. Our results profiling single human Treg cells further revealed the breadth of phenotypic states these cells can adopt, with loss of key TFs and alterations in the cytokine environment markedly affecting the relative frequencies and stability of these states. Critically, many of the altered states resulting from TF ablation were only pronounced in certain cytokine conditions, highlighting the central role of these TF in translating cellular context into an appropriate transcriptional response.
The TFs we examined in human Treg cells regulated networks of downstream target genes encoding TFs, histone modifiers, cell signalling proteins, survival proteins, and cell surface markers. While a core set of genes including multiple proinflammatory cytokines (LIF, CXCL8, IFN-γ, CCL4) required multiple TFs for proper repression, we also discovered separate gene modules that were selectively regulated by FOXP3 or PRDM1.
We uncovered transcriptional modules that were regulated by distinct pairs of TFs. One was regulated by IRF4 and FOXO1, which were both required to regulate (mainly repress) a set of genes encoding several TFs, cytokines, and co-inhibitory receptors. Prior studies in murine models have shown that, FOXO1 is required for normal Treg cell development and function, including proper regulation of CTLA-4 and IFN-γ, of thymic-derived Treg cells23. We now have evidence that acute loss of FOXO1 in mature human Treg cells also causes dysregulation of key genes23. In contrast, effects of acute loss of IRF4 and several other factors in human Treg cells did not closely recapitulate what has been observed in transcriptional profiling of Treg cells from TF KO mice13, 42, 43. These discrepancies underscore the importance of functional dissection of gene modules in mature human Treg cells to identify potential targets for human therapies.
Our pooled screens and deep phenotyping also revealed another gene module dually regulated by SATB1 and HIVEP2, uncovering a previously unappreciated role for the later transcription factor in human Treg cells. Interestingly, HIVEP2 has known roles in murine T cell signalling and is crucial for the positive selection of thymocytes35, 44. In human cell lines, HIVEP2 ablation results in decreased levels of MYC, TGF-β and NF-kB and human HIVEP2 haploinsufficiency has been implicated in developmental defects and intellectual disability45, 46, 47. How precisely HIVEP2 interacts with SATB1 to promote human Treg cell function remains to be elucidated. However, the target gene module regulated by these two factors includes genes with well-characterized roles in Treg cell biology including the DNA-demethylase TET2 and HIF1a32, 34, 48. In murine Treg cells, SATB1 levels are tightly controlled for optimal Treg function, and SATB1 has been described to “lock in” the FOXP3 transcriptional signature13, 49. Our data suggest that HIVEP2, a novel regulator of human Treg cell identity, is necessary to reinforce this tightly controlled transcriptional program.
Currently, polyclonal ex vivo expanded Treg cells are in clinical trials for the treatment of autoimmunity and organ rejection post-transplantation18, 50. We have defined functional gene modules by ex vivo gene editing in mature human Treg cells from peripheral blood using an ex vivo expansion protocol similar to what has been used in these autologous Treg cell therapy trials. Thus, the core regulators we have explored in this study may potentially be targeted to to fine-tune the functionality of these Treg cells (e.g. modify suppressive or proinflammatory function in response to particular inflammatory environments) for the next generation of cell therapies for autoimmune diseases, or for conditions of ineffective immunity, such as cancer.
Data availability
The scRNA-seq data generated in this project can be found at the link: https://drive.google.com/drive/u/0/folders/1pXuKlCwdxsK69cUU-aMg3-embxES9uaO in the “scRNA-seq_files” folder which contains the filtered gene-barcode expression matrix and associated metadata. The “treg_rnaseq_bams” folder contains the bam files used to determine Teff and Treg cell specific TFs. The external datasets used in this project are from the Roadmap Epigenomic Project (http://www.roadmapepigenomics.org/ ; ChIP-seq and RNA-seq data of different human T cell subsets), Schmidl et al 201428 (FOXP3 ChIP-seq data of primary human Treg cells) and Ohkura et al 202017 (Treg and Teff DNA methylation data). Please contact the corresponding authors for any further requests.
Code Availability
The scRNA-seq data processing scripts developed in this project can be found at the link: https://drive.google.com/drive/u/0/folders/1pXuKlCwdxsK69cUU-aMg3-embxES9uaO in the “scripts” subfolder of the “scRNA-seq_files” folder. The processing scripts for the pooled and arrayed data can be found in the “pooled_arrayed_files” folder at the above link.
Material and Methods
Human blood
Whole blood from healthy human donors was collected in blood bags (anticoagulant citrate phosphate dextrose salutation USP; Fenwal) with approval by the UCSF Committee on Human Research. Buffy coats were collected by the German Heart Centre Munich with the approval of the local Institutional Review Board (Ethics Committee TUM School of Medicine, Technical University Munich). We have obtained informed consent from all participants.
Treg cell isolation and culture
Whole human blood and buffy coats were processed within 48 hrs after donation. Peripheral blood mononuclear cells (PBMCs) were isolated by Ficoll-Paque PLUS (GE Healthcare) or Lymphoprep (Stemcell Technologies) gradient centrifugation in SepMate50 tubes. After centrifugation (1,200 g, 10 min) the PBMC layer was removed and cells washed with EasySep buffer (PBS containing 2% FBS and 1mM EDTA). CD4+ T cells were enriched with the EasySep Human CD4+ T-cell enrichment kit (Stemcell Technologies). Pre-enriched CD4+ T cells were stained with following antibodies: αCD4-PerCp (clone: SK3; TONBO Biosciences) or αCD4-PacificBlue (clone: SK3; Biolegend), αCD25-APC (clone: BC96; TONBO Biosciences or Biolegend) and αCD127-PE (clone: R34–34; TONBO Biosciences or clone: HIL-7R-M21; BD Biosciences). CD4+CD25hiCD127low Treg cells were isolated using a FACS Aria Illu (Becton Dickinson; BD FACSDiva software). Treg cell purity was >97% based on CD4+CD25hiCD127low expression. Isolated Treg cells were suspended in complete Roswell Park Memorial Institute (cRPMI), consisting of RPMI-1640 (Sigma) supplemented with 5 mM 4-(2-hydroxyethyl)-1-piperazineethanesulfonic acid (HEPES, Gibco), 2 mM Glutamine (Gibco), 50 μg/mL penicillin/streptomycin (Gibco), 5 mM nonessential amino acids (Gibco), 5 mM sodium pyruvate (Gibco), and 10% fetal bovine serum (FBS, Atlanta Biologicals).
For pooled and arrayed Cas9 RNP screens and for GvHD experiments freshly isolated Treg cells were cultured in cRPMI with αCD3/CD28-coated beads (Stemcell technologies) in a 1:1 ratio. Starting day 2 of culture 300 −600 IU/ml IL-2 were added and replenished after 72 hrs and thereafter every 48 hrs19. On day 9 of Treg cell expansion cells were restimulated for 48 hrs on plates coated overnight with 10 μg/ml αCD3 (clone: UCHT1; TONBO Biosciences or Biolegend) in cRPMI supplemented with 5 μg/ml αCD28 (clone: CD28.2; TONBO Biosciences or Biolegend).
For scRNA-seq experiments freshly isolated Treg cells were directly after cell isolation stimulated for 48 hrs in cRPMI with 5 μg/ml αCD28 (clone: CD28.2; TONBO Biosciences) on plates coated with 10 μg/ml αCD3 (clone: UCHT1; TONBO Biosciences) prior electroporation.
Cas9 RNP assembly and electroporation
80 μM crRNA (Dharmacon) and 80 μM tracrRNA (Dharmacon) were mixed in a 1:1 ratio and incubated 30 min at 37°C to generate 40 μM crRNA:tracrRNA duplexes. An equal volume of 40 μM S. pyogenes Cas9-NLS (Macrolabs, Berkeley) was slowly added to the crRNA:tracrRNA and incubated for 15 min at 37°C to generate 20 μM Cas9 RNPs. For each editing reaction, 1.5-5x10⁵ stimulated Treg cells were pelleted and re-suspended in 20 μL P3 buffer. 3 μl 20 μM Cas9 RNP and 0.75 μl 100 μM electroporation enhancer (IDT) was added directly to the cells and the entire volume transferred to a 96-well reaction cuvette (Lonza). Treg cells were electroporated using program EH-115 on the Amaxa 4D-Nucleofector (Lonza). 80 μL pre-warmed cRPMI was added to each well after electroporation and the cells were allowed to recover for 30 minutes at 37°C before restimulation.
Pooled Cas9 RNP screen
We selected one synthetic gRNA targeting each of the 40 candidate TFs based on predicted and experimentally validated on-target editing efficiency (Supplementary Table 1).
Treg cells were isolated, expanded and restimulated as described before. For the pooled Cas9 RNP-mix all 40 μM Cas9 RNPs were prepared separately as described before and mixed in equimolar ratios. 1.5x10⁷ cells were suspended in 100 μl P3 electroporation buffer (Lonza) with 20 μl Cas9 RNP-mix and 6.6 μl 100 μM electroporation enhancer. Control cells were electroporated with equal amounts of non-targeting Cas9 RNP and electroporation enhancer (IDT). Treg cells were electroporated using program EH-115 on the 4D-Nucleofector (Lonza). 400 μl of pre-warmed cRPMI were added immediately after electroporation. After 30 min at 37°C cells were restimulated with 300 U/ml IL-2 and αCD3/αCD28-coated beads (Stemcell technologies) in a 1:1 ratio. After 48 hrs cells were split and stimulated with different cytokine combinations: 600 IU/ml IL-2 alone or 600 IU/ml IL-2 with 10 ng/ml IL-12 (Fisher Scientific), 10 ng/ml IL-4 (TONBO Biosciences), 10 ng/ml IL-6 (Fisher Scientific) and 10 ng/ml IFN-γ (TONBO Biosciences) for 72 hrs. Prior to staining, cells were stimulated with PMA/Ionomycin/Brefeldin (cell activation cocktail with Brefeldin; Biolegend) for 4.5 hrs at 37°C. Cells were stained extracellularly with αCD25-APC (clone: M-A251; Biolegend) and ghost dye 780 (TONBO Biosciences) on ice for 30 min. After performing Fix&Perm (FOXP3 staining buffer set; Biolegend) for 30 min at room temperature (RT) cells were stained intracellularly for the following protein markers: αFOXP3-AF488 (clone: 206D; Biolegend), αCTLA-4-PE (clone: L3D10; Biolegend), αIL-2-BV650 (clone: MQ1-17H12; Biolegend) and αIFNy-V450 (clone: B27; Biolegend). All samples were sorted with a FACSAria II sorter (Becton Dickinson; BD FACSDiva software) based on the expression of FOXP3, CTLA-4, and IFN-y. Between 5x10⁴ and 2x10⁵ cells of the negative and positive subpopulation for each marker were collected.
Sorted cells were incubated overnight in 400 μl lysis buffer (0.5% SDS, 50 mM Tris, pH 8, 10 mM EDTA) at 66°C to reverse crosslinking introduced by the Fix&Perm buffer. For RNA digestion samples were treated with 0.2 mg/ml RNAse (Qiagen) at 37°C for 1 hr. For protein digestion samples were incubated with 0.5 mg/ml Proteinase K for 1 h at 45°C. DNA extraction was performed with Phenol:Chloroform:Isoamyl Alcohol (25:24:1; Sigma) according to standard protocols. The targeted regions and 40 control regions within 1 kb up- or downstream of the target sites were amplified with multiplexed amplicon PCR using a custom-designed CleanPlex™ Targeted Library Kit from Paragon Genomics. The amplicon size ranged from 150 to 200 bps. 40 ng of extracted genomic DNA were applied for each initial PCR reaction. All steps were performed according to manufacturer’s instructions. Sequencing was performed on the MiniSeq (Illumina) platform in combination with the MiniSeq System High-Output Kit (150 cycles).
Arrayed Cas9 RNP screen
Each of the 40 TFs was targeted with 3 different gRNAs (Dharmacon; predesigned crRNA library) in ex vivo expanded Treg cells to monitor potential off-target effects of individual gRNAs tested in the pooled Cas9 RNP screen. We additionally targeted two positive control genes: 1) the gene encoding the surface receptor CD25 (IL2RA) as an editing control, and 2) the gene encoding chromatin regulator EZH2, described to be crucial in murine Treg cells1, 5. Targeting EZH2 in human Treg cells had minimal phenotypic effects and further analysis was not pursued. Two crRNAs “FOXO3_3” and “FOXO4_3” were excluded from further analysis because of off-target effects detected by amplicon sequencing in the FOXO1 locus (data not shown).
Electroporation of cells was performed using the P3 Primary Cell 96-well Nucleofector kit (Lonza) and 4D-Nucleofecter (Lonza; code: EH-115). Each reaction contained 2×10⁵ expanded Treg cells, 3 μl of the respective Cas9 RNP and 0.75 μl of electroporation enhancer (IDT). After 48 hrs, cells were split and half were stimulated with 600 IU/ml IL-2 alone or 600 IU/ml IL-2 and 10 ng/ml IL-12 for 72 hrs.
Prior to staining, cells were stimulated with PMA/Iono/Brefeldin (cell activation cocktail with Brefeldin; Biolegend) for 6 hrs at 37°C. Cells were stained extracellularly with αCD25-PeCy7 (clone: M-A251; Biolegend) and ghost dye 510 (TONBO Biosciences) on ice for 30 min. After performing Fix&Perm (FOXP3 staining buffer set; Biolegend) for 30 min at RT cells were stained intracellularly for the following protein markers: αFOXP3-AF488 (clone: 206D; Biolegend), αIFN-γ-BD Horizon 450 (clone: B27; Biolegend), αIL-10-PE (clone: JES3-9D7; BD Pharmingen), αIL-2-BV650 (clone: MQ1-17H12; Biolegend), αHelios-Percy-Cy5.5 (clone: 22F6; Biolegend), αCTLA-4-APC (clone: L3D10; Biolegend), αIL-17a-AF700 (clone: BL168; Biolegend) and αIL-4-APC-Cy7 (clone: MP4-25D2; Biolegend). Intracellular staining was performed in 80% Perm buffer (FOXP3 staining buffer set; Biolegend) and 20% BDHorizon Brilliant Stain Buffer (BD Biosciences) for 30 min at room temperature. Cells were analyzed on a BD Fortessa X20 Dual instrument (Becton Dickinson; BD FACSDiva software).
Comparison of Treg and Teff TF KO cells
Treg cells were isolated out of buffy coats, expanded and restimulated at day 9 as described before. CD4+ CD25low CD127high Teff cells were frozen directly after FACS sorting and thawed one day prior cell stimulation for 48 hrs on plates coated with 10 μg/ml αCD3 and 5 ng/ml soluble αCD28. Cas9 RNPs were assembled with 100 μM crRNA (IDT) and 100 μM tracrRNA (IDT) mixed in a 1:1 ratio and incubated 5 min at 96°C to generate 50 μM crRNA:tracrRNA duplexes. 40 μM S. pyogenes Cas9-NLS (Macrolabs, Berkeley) was slowly added to the crRNA:tracrRNA and incubated for 15 min at RT. Treg and Teff cells were electroporated, restimulated after electroporation and treated with IL-12 as described before. Prior to staining, cells were stimulated with PMA/Ionomycin/GolgiPlug™ (BD Biosceinces) for 5 hrs at 37°C. Cells were stained extracellularly with αCD25-PE/Cy7 (clone: 3C7; BD Biosciences) and Zombie UV™ Fixable Viability Kit (Biolegend) and intracellularly for the following protein markers: αFOXP3-AF488 (clone: 206D; Biolegend), αCTLA-4-APC (clone: L3D10; Biolegend), αHelios-PE (clone: 22F6; Biolegend), αIL-2-BV510 (clone: MQ1–17H12; Biolegend), αIFNy-BV785 (clone: 4S.B3; Biolegend), αIL-4-BV421 (clone: MP4–25D2; Biolegend), αIL-10-PE (clone: JES3–9D7; Biolegend), and αIL-17a-APC (clone: BL168; Biolegend). Cells were analyzed on a Cytoflex LX instrument (Beckman Coulter; CytExpert software). Editing efficiencies were determined by amplicon Sanger sequencing followed by TIDE (Supplementary Table 3).
Graft-versus-host disease in vivo suppression assay
Primary human Treg cells were sourced from freshly drawn whole blood from 2 human blood donors 18-25 years of age under a protocol approved by the UCSF Institutional Review Board. PBMCs were isolated as described before and 2x10⁸ PBMCs were frozen for later use. Treg cells were isolated out of the remaining PBMCs as described before. Treg cell expansion, restimlation and CRISPR editing with RNPs (IDT) also were conducted as described before, only the electroporation enhancer was replaced with 100 mg/ml 15-50 kDa polyglutamic acid (Sigma) at final volume ratio of gRNA:PGA:Cas9 of 1:0.8:1. Editing efficiencies were determined by amplicon Sanger sequencing followed by TIDE (Supplementary Table 3). On day 16 of the Treg cell culture, previously frozen autologous PBMCs were thawed and rested in RPMI-1640 at 37°C for 6 hrs prior to adoptive transfer into 8-10 weeks old male NSG recipient mice that were sublethally irradiated with 2.5 Gy the day before, in order to induce xenogeneic GvHD. Both PBMC and Treg cells from the same human blood donor were infused intravenously via retro-orbital vein injections with a PBMC to Treg cell ratio of 2:1, using 6 x10⁶ PBMCs and 3 x10⁶ Treg cells per mouse. GvHD severity was assessed by monitoring weight loss and survival, as previously reported37. Changes in posture (hunching) and mobility were also assessed, but not reported here. Mice were assessed for weight loss thrice weekly and were monitored for GvHD severity on a daily basis during the 40-day duration of the experiment post adoptive transfer. Mice reaching weight loss of more than 15% of total body weight were sacrificed in agreement with IACUC guidelines. Survival curves were modelled using Kaplan-Meier method.
Single-cell RNA-seq (10x)
Treg cells were freshly isolated out of human PBMCs, activated for 48 hrs on plates coated with αCD3 in cRMPI supplemented with αCD28. CRISPR editing was performed as described before (crRNAs: Dharmacon). Editing efficiencies were determined by amplicon Sanger sequencing followed by TIDE (Supplementary Table 3). CRISPR-edited Treg cells were stimulated with PMA/Iono (cell activation cocktail without Brefeldin; Biolegends) for 6 hrs in RPMI complete with 300 IU/ml IL-2. Cells were washed twice with PBS and resuspended to a final concentration of 1- 2x10³ cells/μl in PBS containing 0.4% BSA. scRNA-seq cells was performed on pooled cells from two donors that were mixed in a 1:1 ratio and 3 x10⁵ cells loaded on one lane of a 10x chip (10x Genomics). The RNA capture, barcoding, cDNA and library preparation were performed according to the manufacturer’s recommendations. 10x libraries were sequenced either on HiSeq4000 or NovaSeq S4 instruments (Illumina).
For each donor cell pellets were stored at −80°C for subsequent genotyping. Genomic DNA (gDNA) isolation was performed with Qiagen Blood&Tissue DNA isolation kit (Qiagen). gDNA was submitted to exome sequencing (Illumina Global Screening Array; Center for Applied Genomics, The Children’s Hospital of Philadelphia). Genotyping data were used to deconvolute scRNA-seq data by applying demuxlet 51.
Amplicon NGS sequencing
The editing efficiencies in the samples of the arrayed Cas9 RNP screen were determined by amplicon sequencing followed by NGS. 5x10⁴ to 1x10⁵ cells were re-suspended in 50 μL of DNA Quick Extraction solution (Epicentre) to lyse the cells and extract genomic DNA. The cell lysate was incubated at 65°C for 20 min, 95°C for 20 min, and stored at −20°C.
Each PCR reaction contained 10 μl Phusion GC buffer (New England Biolabs), 1 μl dNTPs, 0.5 μl Phusion polymerase Phusion High Fidelity DNA Polymerase (New England Biolabs), 0.5 μl DMSO, 2.5 μl forward primer (IDT), 2.5 μl reverse primer (IDT), 5 μl DNA and 28 μl H2O. The thermocycler setting consisted of one step at 95°C for 1 min, followed by 18 cycles at 98°C for 10 sec, 65°C for 15 sec, and 72°C for 15 sec (wherein the annealing temperature was decreased by 0.5°C per cycle), followed by 15 cycles at 98°C for 10 sec, 58°C for 15 sec, and 72°C for 15 sec with one final step at 72°C for 5 minutes. The PCR products were cleaned up using AMPure beads (Beckmann Coulter) and eluted in 20 μl H2O. For barcoding 1 μl of the purified DNA was added to 12.5 μl 2x NEB NEXT mix (New England Biolabs), 2 μl Nextera XT index 1 (i7) primer, 2 μl Nextera XT index 2 (i5) primer (Illumina; Supplementary Table 2) and 7.5 μl H2O. The second PCR products were again purified with AMPpure beads, eluted in 20 μl H20. The same volume of each sample was pooled and sequenced on an Illumina MiniSeq instrument with a MiniSeq high output 300 cycles Kit (Illumina) according to manufacturer’s recommendations. We tested the editing efficiency for all IL-12 stimulated conditions for both donors. 89% of all amplicons were successfully amplified and sequenced (at least two amplicons for each TF; Supplementary Table 2).
Amplicon Sanger sequencing
Each PCR reaction contained 2 μl 10x High-fidelity PCR buffer (Life Technologies), 3 μl 2mM dNTPs (Bioline), 0.8 μl 50mM MgCl2 (Life Technologies), 0.6 μl 10 μM forward primer, 0. 6μl 10 μM reverse primer, 0.2 μl 5 U/μl Platinum HIFI Taq (Life Technologies), 1μl extracted DNA, and 11.8 μl H2O. The thermocycler setting consisted of one step at 95°C for 5 min, followed by 14 cycles at 94°C for 20 sec, 65°C for 20 sec, and 72°C for 1 min (wherein the annealing temperature was decreased by 0.5°C per cycle), followed by 35 cycles at 94°C for 20 sec, 58°C for 20 sec, and 72°C for 1 min with one final step at 72°C for 10 min. Sanger sequencing was performed by Quintarabio (San Francisco, CA, USA) or Microsynth (Göttingen, Germany). Sequencing traces were analysed with the Tracking of Indels by DEcomposition (TIDE) webtool (http://tide.nki.nl; 52). The used primer sets and TIDE results are shown in Supplementary Table 3 (comparison of Treg and Teff KO cells; scRNA-seq; GvHD experiment).
Analysis of sequencing results of pooled Cas9 RNP screens
Sequencing results of pooled Cas9 RNP screens were analysed with R-based webtool CRISPResso (http://crispresso.rocks/) with the packages: “ggplot”, “limma” (batch correction) and “vegan”. In frame indels of 3 or 6 bps were excluded. For each amplicon the log2 fold change of the editing efficiency between the sorted “marker-high” and “marker-low” subpopulations was calculated.
Scaffold analysis of flow cytometry data of arrayed Cas9 RNP screen
Flow cytometry data were analysed using FlowJo. To create networks of the flow cytometry data, we relied upon the Scaffold package27. The guidelines can be found at https://github.com/SpitzerLab/statisticalScaffold.
To apply Scaffold, Treg cells electroporated with non-targeting Cas9 RNPs were gated based on the same gating strategy used for 2-dimensional flow cytometry analyses (Extended Data Fig. 2). These gates were transformed into “landmark populations.” By density peak approximation using the VorteX Clustering Environment53, we determined that 33 clusters would be an optimal number of subpopulations to discover across the populations of cells in our dataset. Based on ranking of the Scaffold analysis across perturbations in two independent donors (Supplementary Table 4) 10 TFs were selected with notable effects on protein levels and applied for analysis in Fig. 2b, Extended Data Fig. 3a, b and scRNA-seq experiments.
Computational analysis of scRNA-seq data
For downstream scRNA-seq analysis, we used the R package “Seurat” (a toolkit for single-cell genomics). Broadly, we followed the Guided Clustering Tutorial at https://satijalab.org/seurat/pbmc3k_tutorial.html and the CCA-Alignment Tutorial found at https://satijalab.org/seurat/immune_alignment.html. We filtered out cells with <150 different genes detected and genes that were expressed in fewer than 5 cells. Next, we normalized the gene expression measurements for each cell by dividing each of its counts by the sum of all of its counts, multiplied that total expression by a scale factor of 10,000, and log-transformed the result. Further, we scaled the normalized dataset to remove confounding sources of variation by regressing out the signals driven by percent of mitochondrial gene expression and number of unique molecular identifiers.
We then used Multiple Canonical Correlation Analysis (MCCA) to dimensionally reduce our dataset to 30 dimensions and align our dataset before further analysis. As the inputs to this algorithm, we first filtered our dataset down to 618 genes, which we found in the following way: for each “population”, which we defined as subset of our dataset consisting of a donor, stimulation, and KO, we found the 250 top variable genes and took the union of all of these genes to create the input gene list. After examining the Metagene Bicorrelation Plot, we observed an elbow around the 20th dimension (CC20), and so chose CCs 1–20 for the CCA alignment, for which we chose donor as the grouping variable.
To discover subtle differences among our cells, we next performed KNN graph-based Louvain clustering. We used a resolution of 0.45 in Seurat’s “FindClusters” command, and discovered 8 clusters. For visualization purposes, we used the t-SNE dimensional reduction algorithm.
We next used Seurat’s “FindConservedMarkers” command to run differential expression analysis between our clusters using a Wilcoxon rank-sum test and identified expression markers that define a given cluster regardless of the stimulation. We compared the gene lists to known literature to label the clusters. Significance was determined by Wilkinson’s method of “minimum p” implemented by the metap package in R.
To generate the scRNA-seq network graphs, we started with an input list of genes consisting of the 618 gene input list. We filtered out any genes that did not have on average 1 count per every 3 cells. For the remaining genes, we computed the method of moments estimator of the mean of the zero-inflated Poisson distribution for both the control and KO in the same stimulation condition. We then computed the log fold change of this mean between the KO and the control; if the absolute value of the fold change was above 0.8, then we recorded the magnitude of that change in the appropriate entry in an adjacency matrix whose rows and columns were concatenations of the TFs and filtered genes. We then imported the resulting adjacency matrix into Cytoscape, constructing a force-directed graph from it.
In Schmidl et al., ChIP-seq for FOXP3 in primary human Treg cells identified 4193 genes whose promoters were bound by FOXP3. Of the 63 genes that we found to be affected by FOXP3 KO based on our scRNA-seq data of IL-12 treated cells, 24 genes were FOXP3 targets in the gene set from Schmidl et al.28. To determine whether this overlap was significant, we employed a permutation test. In the permutation test, we generate a distribution of test statistics through resampling of the data in order to determine the likelihood of the initially observed result. In this case, we aimed to assess how often an intersection between our 63 genes and 4193 randomly selected protein-coding genes would yield a set of 24 genes or more. We found that this result only occurred with probability p = 0.0003 over 10,000 trial runs, and thus concluded that our dataset is generally consistent with the independent FOXP3-binding dataset from Schmidl et al.28.
Extended Data
Extended Data Fig. 1. Limited effects of control site indel mutations on target protein levels in pooled RNP screens.
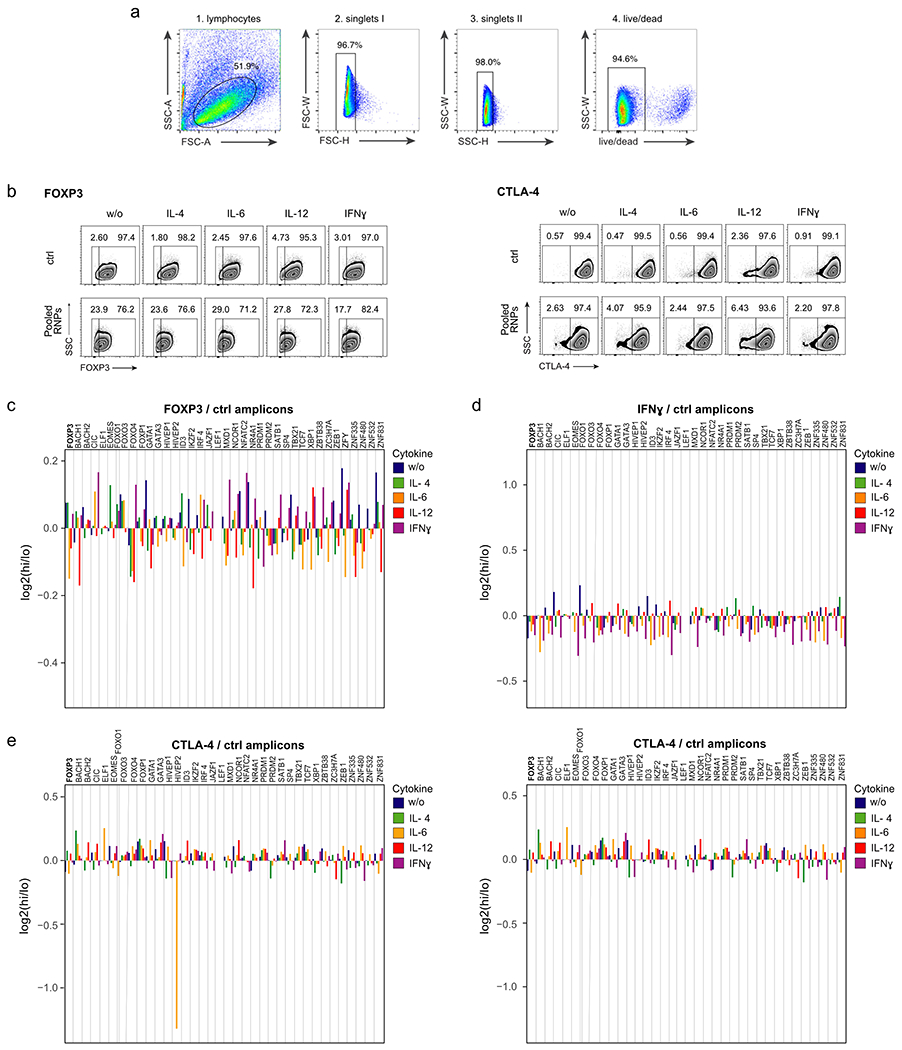
(a) FACS-gating strategy for pooled Cas9 RNP screens. Treg cells were gated on singlet live cells. Representative example from 1 of 4 human blood donors. (b) FACS sorting strategy to isolate FOXP3-high (hi) and FOXP3-low (lo) (left) and CTLA-4-hi and CTLA-4-lo Treg cells (right) electroporated with non-targeting control RNP (ctrl; top) and with a pool of RNPs targeting 40 individual TFs (bottom). Representative examples from experiments in one of 4 human blood donors. (c - e) log2 fold enrichment of indels in FOXP3-hi vs. FOXP3-lo (c), IFNg-hi vs. IFNg-lo (d) and CTLA-4-hi vs. CTLA-4-lo cell populations (e) at ctrl regions within 1 kb up- or downstream of the predicted gRNA cut site. Note: indel mutations in one control site near HIVEP2 were associated with altered CTLA-4 levels, which could be an artefact or could be due to effects on a regulatory element. Right graph (e) shows ctrl amplicons in the CTLA-4-hi and CTLA-4-lo sorted Treg cells without HIVEP2 KO control amplicon after IL-6 stimulation. (c – e): Mean of log2 fold enrichment of experiments performed in cells from 4 human blood donors with the exempt of the control amplicons for FOXO, ELF1 and ZFY (see Supplementary Table 1).
Extended Data Fig. 2. Flow cytometry gating strategy to define changes in Treg cell phenotype in arrayed Cas9 RNP screen.
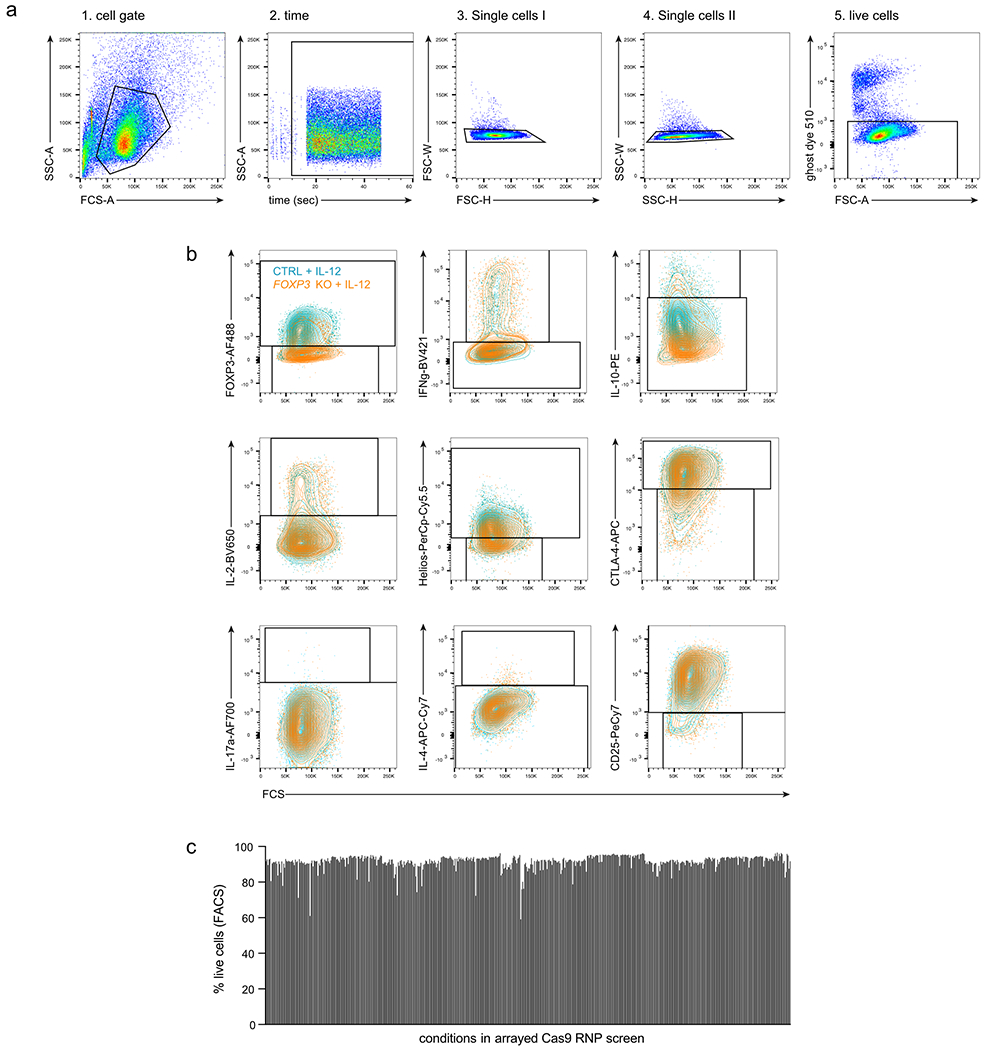
(a) Initial gating strategy to identify live cells. (b) Gating strategy to assess Treg cell stability for personality and Scaffold plots. Control non-targeting Cas9 RNP-treated Treg cells (ctrl) after IL-12 conditioning are shown in light blue and FOXP3 KO Treg cells after IL-12 stimulation are shown in orange. a, b: Representative result for one non-targeting control Cas9 RNP in one out of two human blood donors. (c) % of live cells based on flow cytometry staining for all conditions tested in the arrayed Cas9 RNP screen.
Extended Data Fig. 3. Extended analysis of arrayed Cas9 RNP screen data.
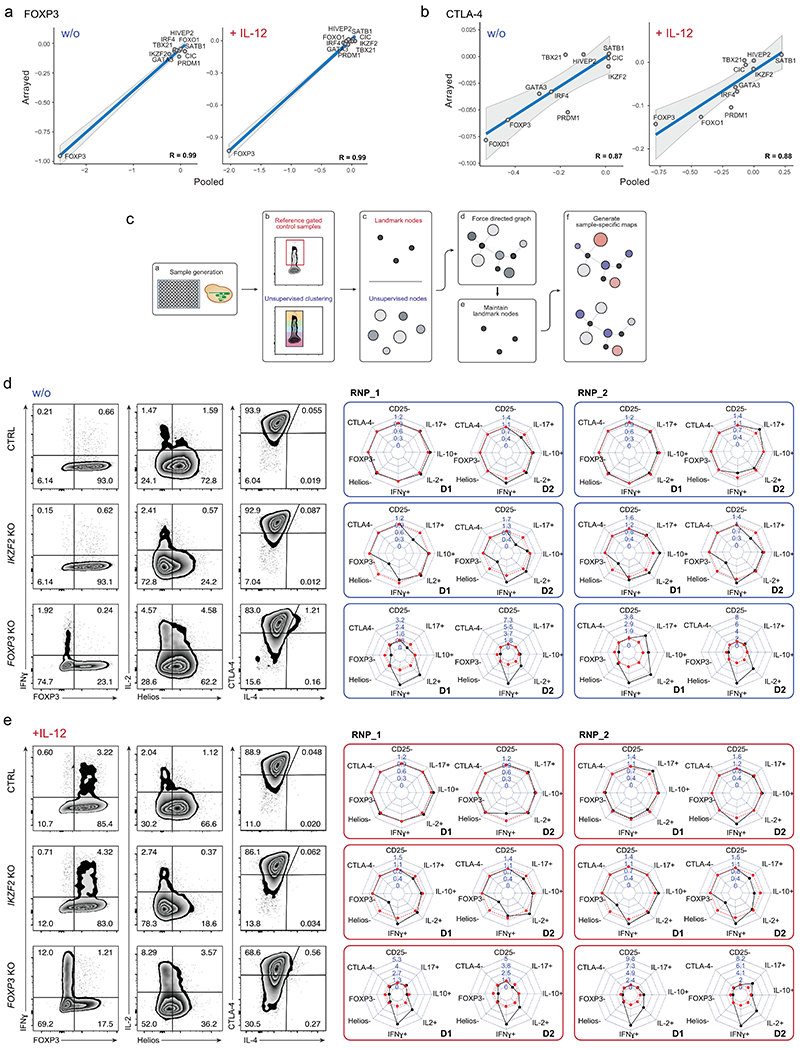
Comparison of results generated in pooled (log2(#indels in “marker high” population/#indels in “marker low” population) versus arrayed Cas9 RNP screens (log2(% “marker high” in KO/% “marker high” in ctrl)) for FOXP3 (a) and CTLA-4 expression (b) with and w/o IL-12 stimulation for 10 selected TFs with notable effects on protein levels (see Methods and Supplementary Table 4) For the pooled screen, the calculated values are based on 4 human blood donors. For the arrayed screen, the calculated values are based mean fold-change values determined from 3 independent gRNAs and 2 human blood donors. The R value is based on these data points (highlighted in the graphs). Grey shading is provided by the loess algorithm in R, which uses polynomial regression to locally fit a surface to each point. (c) Schematic workflow of Scaffold generating landmark nodes and unsupervised clustering for visualization of TF KO cell subpopulations. (d, e) Phenotypic characterization of ctrl, IKZF2 and FOXP3 KO Treg cells with two-dimensional flow cytometry and personality plots w/o (d) and with IL-12 treatment (e) in Treg cells from two human blood donors (D1 and D2) with two of three different Cas9 RNPs targeting each gene (extended version of Fig. 3). Note: IL-4 was excluded from these plots due to low absolute levels that skewed fold-change analyses.
Extended Data Fig. 4. Phenotypic comparison of Treg and Teff TF KO cells.
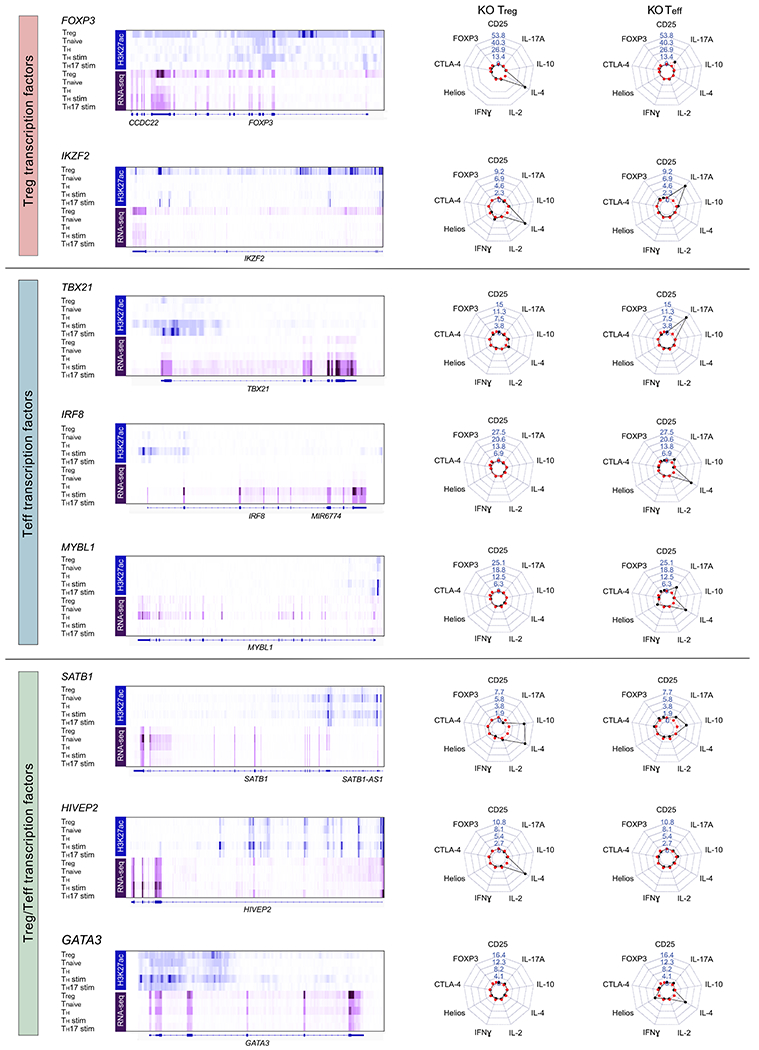
We selected a subset of candidate Treg TFs. In addition, here we selected additional candidate TFs that are preferentially expressed in conventional CD4+ T cell subsets (referred to here as Teff cells) based on RNA-seq data (Roadmap Epigenomics Project15). Corresponding H3K27ac and RNA-seq data (Treg, Tnaive, TH, TH stim and TH17 stim) are shown on the left for each tested TF. On the right: Representative personality plots of TF KO Treg cells and TF KO Teff cells after IL-12 stimulation of one of two donors tested. Note: Treg cells from this blood donor had distinct cytokine responses compared to those included in the larger arrayed TF KO screen experiments. IRF8 and MYBL1 were targeted with 3 independent gRNAs, while the other TFs were targeted with a previously validated gRNA (includes data of 2 human donors and 1 technical replicate for each condition). crRNA sequences and editing efficiencies are shown in Supplementary Table 3. Note: changes in IL-4 regulation helped to distinguish effects of TF KO in Treg versus Teff cells in these experiments and IL-4 is therefore included in these personality plots.
Extended Data Fig. 5. Distribution of cells states altered by TF ablation in Treg cells.
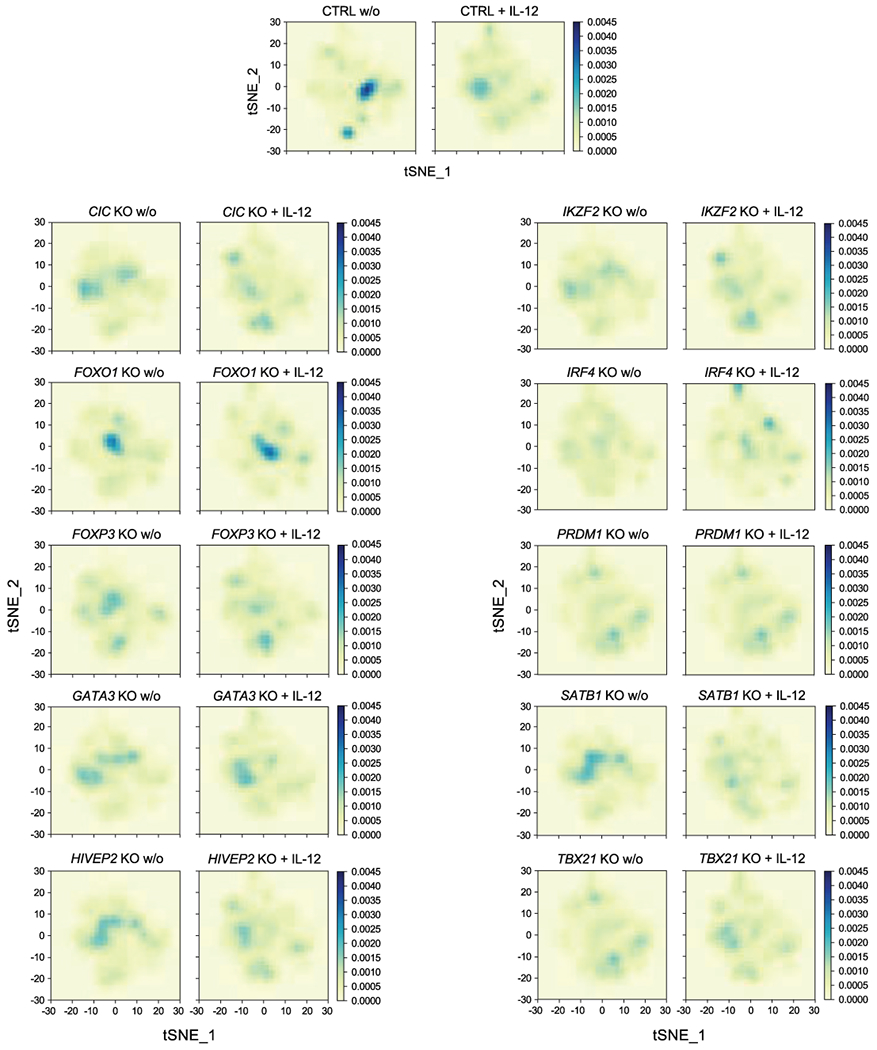
Cell density maps highlight the altered distribution cell states assessed by scRNA-seq (visualized with t-SNE dimensionality reduction, Fig. 5a) in individual TF KO Treg cell conditions with and w/o IL-12 treatment. The colour scale represents the population densities of particular cell states across regions of the t-SNE map. Data were generated in ex vivo expanded Treg cells from 2 human blood donors, the same data referenced in Fig. 5. Detailed list of all conditions: Supplementary Table 3.
Extended Data Fig. 6. Extended characterization of TF KO Treg cell scRNA-seq data.
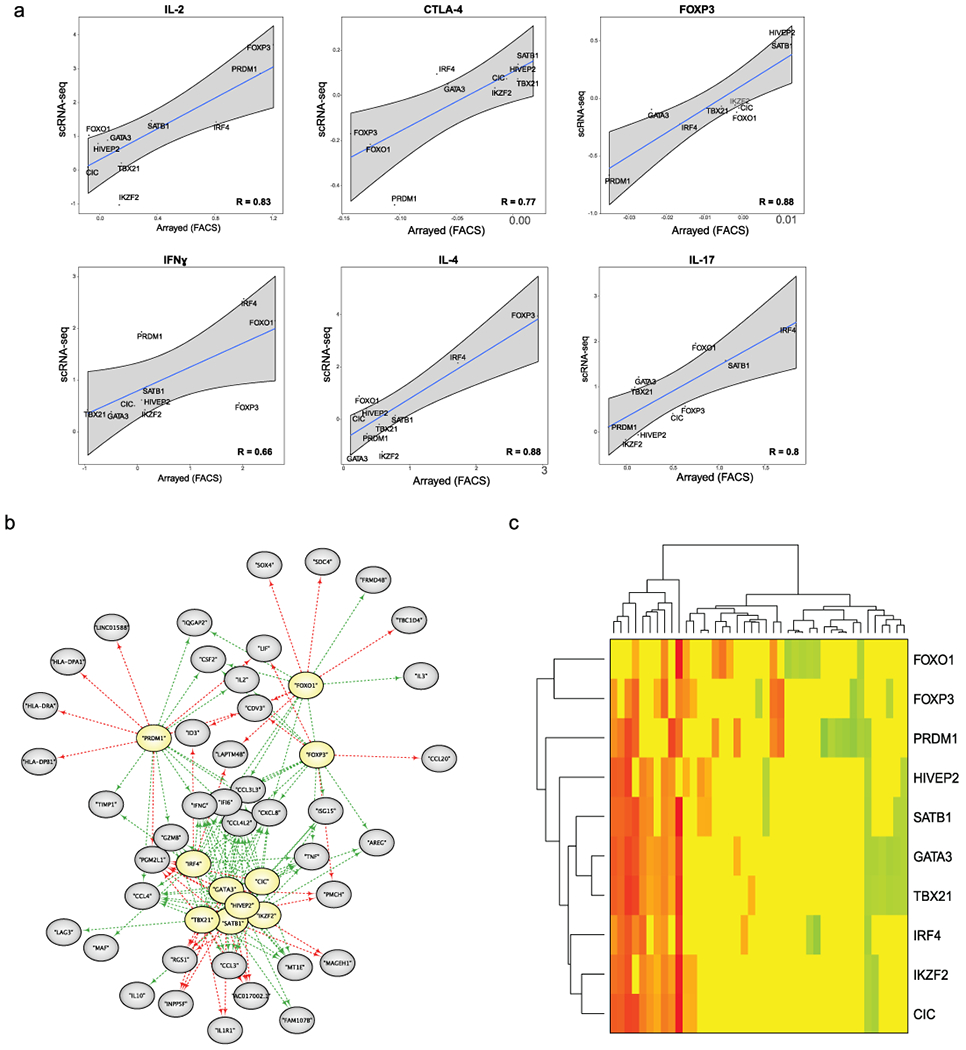
(a) Comparison of results generated by flow cytometry for TF KO Treg cells in arrayed Cas9 RNP screens and scRNA-seq data after IL-12 treatment. Each of the 10 data points on the scatter plot represents arrayed Cas9 RNP screens (log2(% “marker high” in KO/% “marker high” in ctrl)) vs the scRNA-seq data (log2(mean expression KO/mean expression in ctrl)) for a given targeted TF. For the arrayed screen, the calculated values are based on 3 independent gRNAs and 2 human blood donors. For the scRNA-seq data, the calculated values are based on mean expression fold-change in a given KO and stimulation condition across 2 human blood donors. The R value is based on these data points (highlighted in the graphs). Grey shading is provided by the loess algorithm in R, which uses polynomial regression to locally fit a surface to each point. (b) Force-directed network graphs highlight gene modules in TF KO Treg cells without IL-12 treatment. Genes that depended (directly or indirectly) on each TF (yellow) are indicated by green arrows and genes repressed by each TF are marked with red arrows. (c) Heatmap summarizing the results of the network graph in a. Green indicates that TF KO represses expression of a gene, while red indicates that TF KO increases expression of a gene. Scale bar: log2(TF KO value of gene/ctrl value of gene). Data were generated in ex vivo expanded Treg cells from 2 human blood donors. Detailed list of all conditions: Supplementary Table 3.
Extended Data Fig. 7. Functional assessment of HIVEP2 KO Treg cells in a humanized mouse model of GVHD.
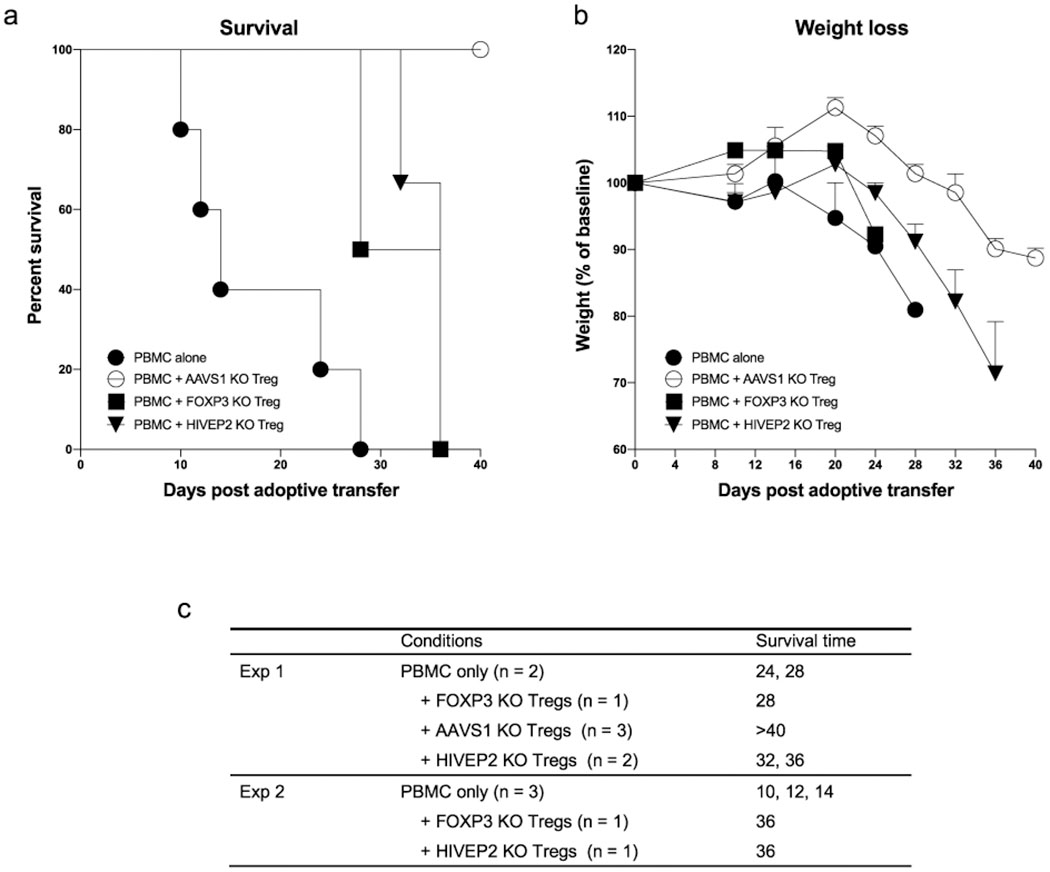
PBMC and Treg cells from 2 human blood donors were injected in a 2:1 ratio into NSG mice. Survival rate (a) and weight changes (b) were monitored over 40 days. PBMC alone (n = 5), PBMC + AAVS1 KO Treg cells (targeted a control safe harbour locus; n = 3), PBMC + FOXP3 KO Treg cells (n = 2), PBMC + HIVEP2 KO Treg cells (n = 3). The mice were all male age matched from three litters and randomized to different experimental groups. (c) Detailed information about the number of mice used and their survival time. Experiment 1 and 2 refers to the two different human blood donors. crRNA sequences and editing efficiencies are shown in Supplementary Table 3.
Supplementary Material
Acknowledgments:
We thank members of the Marson, Ye, Spitzer, and Bluestone labs for helpful suggestions and technical assistance; Shimon Sakaguchi for sharing Treg and Teff DNA methylation data; Andrew Levine for suggestions on the manuscript and Eunice Wan for technical assistance with single-cell RNA-seq. The UCSF Flow Cytometry Core was supported by the Diabetes Research Center (NIH P30 DK063720). We also thank the CyTUM-MIH Flow Cytometry core for assistance. We thank Victoria Tobin for assistance in coordinating blood donations at UCSF and the German Heart Centre Munich for the provision of buffy coats. This research was supported by Juno Therapeutics, NIH grants DP3DK111914-01 (A.M.), P50GM082250 (A.M.), and DP5OD023056 (M.H.S.), grants from the Keck Foundation (A.M.), National Multiple Sclerosis Society (A.M.; CA 1074-A-21), gifts from J. Aronov, G. Hoskin, K. Jordan and B. Bakar. A.M. holds a Career Award for Medical Scientists from the Burroughs Wellcome Fund and received the Lloyd Old STAR career award from the Cancer Research Institute (CRI). The Marson lab has received funding from the Innovative Genomics Institute (IGI) and the Parker Institute for Cancer Immunotherapy (PICI). A.M. and M.H.S. are Chan Zuckerberg Biohub investigators. K.S. was supported by the German Research Foundation (DFG). M.L. was supported by the Hanns-Seidel-Stiftung.
Competing interests: A.M. is a cofounder, member of the Boards of Directors and a member of the Scientific Advisory Boards of Spotlight Therapeutics and Arsenal Biosciences. A.M. served as an advisor to Juno Therapeutics, was a member of the scientific advisory board of PACT Pharma and was an advisor to Trizell. A.M. owns stock in Arsenal Biosciences, Spotlight Therapeutics and PACT Pharma. The Marson laboratory has received research funding from Epinomics, Sanofi, GlaxoSmithKline, Anthem and Gilead. J.A.B. is a member of the Scientific Advisory Boards of Arcus, Celsius, and VIR; and a member of the Board of Directors of Rheos and Provention. J.A.B has recently joined Sonoma Biotherapeutics as President and CEO. Q.T. is a co-founder of Sonoma Biotherapeutics. C.J.Y. is a co-founder of Dropprint Genomics. C.J.Y. is a member of the scientific advisory board at Related Sciences and an advisor to TReX Bio. C.J.Y owns stock in Dropprint Genomics and Related Sciences. M.H.S. receives research funding from Roche/Genentech, Bristol-Myers Squibb and Valitor and has been a paid consultant for Five Prime Therapeutics, Ono Pharmaceutical and January Inc. This research project was supported by Juno Therapeutics. A provisional patent has been filed based on the results described here (A.M., K.S., J.A.B.).
References
- 1.Schmidt A, Oberle N & Krammer PH Molecular mechanisms of treg-mediated T cell suppression. Front Immunol 3, 51 (2012). [DOI] [PMC free article] [PubMed] [Google Scholar]
- 2.Long SA & Buckner JH CD4+FOXP3+ T regulatory cells in human autoimmunity: more than a numbers game. J Immunol 187, 2061–2066 (2011). [DOI] [PMC free article] [PubMed] [Google Scholar]
- 3.Ferreira LMR, Muller YD, Bluestone JA & Tang Q Next-generation regulatory T cell therapy. Nat Rev Drug Discov 18, 749–769 (2019). [DOI] [PMC free article] [PubMed] [Google Scholar]
- 4.Overacre-Delgoffe AE et al. Interferon-gamma Drives Treg Fragility to Promote Anti-tumor Immunity. Cell 169, 1130–1141 e1111 (2017). [DOI] [PMC free article] [PubMed] [Google Scholar]
- 5.Wang D et al. Targeting EZH2 Reprograms Intratumoral Regulatory T Cells to Enhance Cancer Immunity. Cell Rep 23, 3262–3274 (2018). [DOI] [PMC free article] [PubMed] [Google Scholar]
- 6.Goswami S et al. Modulation of EZH2 expression in T cells improves efficacy of anti-CTLA-4 therapy. J Clin Invest 128, 3813–3818 (2018). [DOI] [PMC free article] [PubMed] [Google Scholar]
- 7.Bennett CL et al. The immune dysregulation, polyendocrinopathy, enteropathy, X-linked syndrome (IPEX) is caused by mutations of FOXP3. Nat Genet 27, 20–21 (2001). [DOI] [PubMed] [Google Scholar]
- 8.Gavin MA et al. Foxp3-dependent programme of regulatory T-cell differentiation. Nature 445, 771–775 (2007). [DOI] [PubMed] [Google Scholar]
- 9.Otsubo K et al. Identification of FOXP3-negative regulatory T-like (CD4(+)CD25(+)CD127(low)) cells in patients with immune dysregulation, polyendocrinopathy, enteropathy, X-linked syndrome. Clin Immunol 141, 111–120 (2011). [DOI] [PubMed] [Google Scholar]
- 10.Wan YY & Flavell RA Regulatory T-cell functions are subverted and converted owing to attenuated Foxp3 expression. Nature 445, 766–770 (2007). [DOI] [PubMed] [Google Scholar]
- 11.Bhela S et al. The Plasticity and Stability of Regulatory T Cells during Viral-Induced Inflammatory Lesions. J Immunol 199, 1342–1352 (2017). [DOI] [PMC free article] [PubMed] [Google Scholar]
- 12.Komatsu N et al. Pathogenic conversion of Foxp3+ T cells into TH17 cells in autoimmune arthritis. Nat Med 20, 62–68 (2014). [DOI] [PubMed] [Google Scholar]
- 13.Fu W et al. A multiply redundant genetic switch ‘locks in’ the transcriptional signature of regulatory T cells. Nat Immunol 13, 972–980 (2012). [DOI] [PMC free article] [PubMed] [Google Scholar]
- 14.Konopacki C, Pritykin Y, Rubtsov Y, Leslie CS & Rudensky AY Transcription factor Foxp1 regulates Foxp3 chromatin binding and coordinates regulatory T cell function. Nat Immunol 20, 232–242 (2019). [DOI] [PMC free article] [PubMed] [Google Scholar]
- 15.Farh KK et al. Genetic and epigenetic fine mapping of causal autoimmune disease variants. Nature 518, 337–343 (2015). [DOI] [PMC free article] [PubMed] [Google Scholar]
- 16.Polansky JK et al. DNA methylation controls Foxp3 gene expression. Eur J Immunol 38, 1654–1663 (2008). [DOI] [PubMed] [Google Scholar]
- 17.Ohkura N et al. Regulatory T Cell-Specific Epigenomic Region Variants Are a Key Determinant of Susceptibility to Common Autoimmune Diseases. Immunity 52, 1119–1132 e1114 (2020). [DOI] [PubMed] [Google Scholar]
- 18.Bluestone JA et al. Type 1 diabetes immunotherapy using polyclonal regulatory T cells. Sci Transl Med 7, 315ra189 (2015). [DOI] [PMC free article] [PubMed] [Google Scholar]
- 19.Putnam AL et al. Expansion of human regulatory T-cells from patients with type 1 diabetes. Diabetes 58, 652–662 (2009). [DOI] [PMC free article] [PubMed] [Google Scholar]
- 20.Dominguez-Villar M, Baecher-Allan CM & Hafler DA Identification of T helper type 1-like, Foxp3+ regulatory T cells in human autoimmune disease. Nat Med 17, 673–675 (2011). [DOI] [PMC free article] [PubMed] [Google Scholar]
- 21.Darce J et al. An N-terminal mutation of the Foxp3 transcription factor alleviates arthritis but exacerbates diabetes. Immunity 36, 731–741 (2012). [DOI] [PMC free article] [PubMed] [Google Scholar]
- 22.Rudra D et al. Transcription factor Foxp3 and its protein partners form a complex regulatory network. Nat Immunol 13, 1010–1019 (2012). [DOI] [PMC free article] [PubMed] [Google Scholar]
- 23.Kerdiles YM et al. Foxo transcription factors control regulatory T cell development and function. Immunity 33, 890–904 (2010). [DOI] [PMC free article] [PubMed] [Google Scholar]
- 24.Levine AG et al. Stability and function of regulatory T cells expressing the transcription factor T-bet. Nature 546, 421–425 (2017). [DOI] [PMC free article] [PubMed] [Google Scholar]
- 25.Thornton AM et al. Expression of Helios, an Ikaros transcription factor family member, differentiates thymic-derived from peripherally induced Foxp3+ T regulatory cells. J Immunol 184, 3433–3441 (2010). [DOI] [PMC free article] [PubMed] [Google Scholar]
- 26.Kim HJ et al. Stable inhibitory activity of regulatory T cells requires the transcription factor Helios. Science 350, 334–339 (2015). [DOI] [PMC free article] [PubMed] [Google Scholar]
- 27.Spitzer MH et al. IMMUNOLOGY. An interactive reference framework for modeling a dynamic immune system. Science 349, 1259425 (2015). [DOI] [PMC free article] [PubMed] [Google Scholar]
- 28.Schmidl C et al. The enhancer and promoter landscape of human regulatory and conventional T-cell subpopulations. Blood 123, e68–78 (2014). [DOI] [PubMed] [Google Scholar]
- 29.Grinberg-Bleyer Y et al. NF-kappaB c-Rel Is Crucial for the Regulatory T Cell Immune Checkpoint in Cancer. Cell 170, 1096–1108 e1013 (2017). [DOI] [PMC free article] [PubMed] [Google Scholar]
- 30.Miyazaki M et al. Id2 and Id3 maintain the regulatory T cell pool to suppress inflammatory disease. Nat Immunol 15, 767–776 (2014). [DOI] [PMC free article] [PubMed] [Google Scholar]
- 31.Klunker S et al. Transcription factors RUNX1 and RUNX3 in the induction and suppressive function of Foxp3+ inducible regulatory T cells. J Exp Med 206, 2701–2715 (2009). [DOI] [PMC free article] [PubMed] [Google Scholar]
- 32.Clambey ET et al. Hypoxia-inducible factor-1 alpha-dependent induction of FoxP3 drives regulatory T-cell abundance and function during inflammatory hypoxia of the mucosa. Proc Natl Acad Sci U S A 109, E2784–2793 (2012). [DOI] [PMC free article] [PubMed] [Google Scholar]
- 33.Miska J et al. HIF-1alpha Is a Metabolic Switch between Glycolytic-Driven Migration and Oxidative Phosphorylation-Driven Immunosuppression of Tregs in Glioblastoma. Cell Rep 27, 226–237 e224 (2019). [DOI] [PMC free article] [PubMed] [Google Scholar]
- 34.Yue X, Lio CJ, Samaniego-Castruita D, Li X & Rao A Loss of TET2 and TET3 in regulatory T cells unleashes effector function. Nat Commun 10, 2011 (2019). [DOI] [PMC free article] [PubMed] [Google Scholar]
- 35.Staton TL et al. Dampening of death pathways by schnurri-2 is essential for T-cell development. Nature 472, 105–109 (2011). [DOI] [PMC free article] [PubMed] [Google Scholar]
- 36.Kimura MY et al. Schnurri-2 controls memory Th1 and Th2 cell numbers in vivo. J Immunol 178, 4926–4936 (2007). [DOI] [PubMed] [Google Scholar]
- 37.Hannon M et al. Infusion of clinical-grade enriched regulatory T cells delays experimental xenogeneic graft-versus-host disease. Transfusion 54, 353–363 (2014). [DOI] [PubMed] [Google Scholar]
- 38.Noval Rivas M et al. Regulatory T cell reprogramming toward a Th2-cell-like lineage impairs oral tolerance and promotes food allergy. Immunity 42, 512–523 (2015). [DOI] [PMC free article] [PubMed] [Google Scholar]
- 39.Zhou L et al. IL-6 programs T(H)-17 cell differentiation by promoting sequential engagement of the IL-21 and IL-23 pathways. Nat Immunol 8, 967–974 (2007). [DOI] [PubMed] [Google Scholar]
- 40.Shifrut E et al. Genome-wide CRISPR Screens in Primary Human T Cells Reveal Key Regulators of Immune Function. Cell 175, 1958–1971 e1915 (2018). [DOI] [PMC free article] [PubMed] [Google Scholar]
- 41.Ting PY et al. Guide Swap enables genome-scale pooled CRISPR-Cas9 screening in human primary cells. Nat Methods 15, 941–946 (2018). [DOI] [PubMed] [Google Scholar]
- 42.Zheng Y et al. Regulatory T-cell suppressor program co-opts transcription factor IRF4 to control T(H)2 responses. Nature 458, 351–356 (2009). [DOI] [PMC free article] [PubMed] [Google Scholar]
- 43.Cretney E et al. The transcription factors Blimp-1 and IRF4 jointly control the differentiation and function of effector regulatory T cells. Nat Immunol 12, 304–311 (2011). [DOI] [PubMed] [Google Scholar]
- 44.Takagi T, Harada J & Ishii S Murine Schnurri-2 is required for positive selection of thymocytes. Nat Immunol 2, 1048–1053 (2001). [DOI] [PubMed] [Google Scholar]
- 45.Iwashita Y, Fukuchi N, Waki M, Hayashi K & Tahira T Genome-wide repression of NF-kappaB target genes by transcription factor MIBP1 and its modulation by O-linked beta-N-acetylglucosamine (O-GlcNAc) transferase. J Biol Chem 287, 9887–9900 (2012). [DOI] [PMC free article] [PubMed] [Google Scholar]
- 46.Srivastava S et al. Loss-of-function variants in HIVEP2 are a cause of intellectual disability. Eur J Hum Genet 24, 556–561 (2016). [DOI] [PMC free article] [PubMed] [Google Scholar]
- 47.Steinfeld H et al. Mutations in HIVEP2 are associated with developmental delay, intellectual disability, and dysmorphic features. Neurogenetics 17, 159–164 (2016). [DOI] [PMC free article] [PubMed] [Google Scholar]
- 48.Yue X et al. Control of Foxp3 stability through modulation of TET activity. J Exp Med 213, 377–397 (2016). [DOI] [PMC free article] [PubMed] [Google Scholar]
- 49.Beyer M et al. Repression of the genome organizer SATB1 in regulatory T cells is required for suppressive function and inhibition of effector differentiation. Nat Immunol 12, 898–907 (2011). [DOI] [PMC free article] [PubMed] [Google Scholar]
- 50.Chandran S et al. Polyclonal Regulatory T Cell Therapy for Control of Inflammation in Kidney Transplants. Am J Transplant 17, 2945–2954 (2017). [DOI] [PMC free article] [PubMed] [Google Scholar]
References - Online Methods:
- 51.Kang HM et al. Multiplexed droplet single-cell RNA-sequencing using natural genetic variation. Nat Biotechnol 36, 89–94 (2018). [DOI] [PMC free article] [PubMed] [Google Scholar]
- 52.Brinkman EK, Chen T, Amendola M & van Steensel B Easy quantitative assessment of genome editing by sequence trace decomposition. Nucleic Acids Res 42, e168 (2014). [DOI] [PMC free article] [PubMed] [Google Scholar]
- 53.Samusik N, Good Z, Spitzer MH, Davis KL & Nolan GP Automated mapping of phenotype space with single-cell data. Nat Methods 13, 493–496 (2016). [DOI] [PMC free article] [PubMed] [Google Scholar]
Associated Data
This section collects any data citations, data availability statements, or supplementary materials included in this article.
Supplementary Materials
Data Availability Statement
The scRNA-seq data generated in this project can be found at the link: https://drive.google.com/drive/u/0/folders/1pXuKlCwdxsK69cUU-aMg3-embxES9uaO in the “scRNA-seq_files” folder which contains the filtered gene-barcode expression matrix and associated metadata. The “treg_rnaseq_bams” folder contains the bam files used to determine Teff and Treg cell specific TFs. The external datasets used in this project are from the Roadmap Epigenomic Project (http://www.roadmapepigenomics.org/ ; ChIP-seq and RNA-seq data of different human T cell subsets), Schmidl et al 201428 (FOXP3 ChIP-seq data of primary human Treg cells) and Ohkura et al 202017 (Treg and Teff DNA methylation data). Please contact the corresponding authors for any further requests.


