

Abstract
Background and Aims:
Microsatellite instability (MSI) and mismatch-repair deficiency (dMMR) in colorectal tumors are used to select treatment for patients. Deep learning can detect MSI and dMMR in tumor samples on routine histology slides faster and cheaper than molecular assays. But clinical application of this technology requires high performance and multisite validation, which have not yet been performed.
Methods:
We collected hematoxylin and eosin-stained slides, and findings from molecular analyses for MSI and dMMR, from 8836 colorectal tumors (of all stages) included in the MSIDETECT consortium study, from Germany, the Netherlands, the United Kingdom, and the United States. Specimens with dMMR were identified by immunohistochemistry analyses of tissue microarrays for loss of MLH1, MSH2, MSH6, and/or PMS2. Specimens with MSI were identified by genetic analyses. We trained a deep-learning detector to identify samples with MSI from these slides; performance was assessed by cross-validation (n=6406 specimens) and validated in an external cohort (n=771 specimens). Prespecified endpoints were area under the receiver operating characteristic (AUROC) curve and area under the precision-recall curve (AUPRC).
Results:
The deep-learning detector identified specimens with dMMR or MSI with a mean AUROC curve of 0.92 (lower bound 0.91, upper bound 0.93) and an AUPRC of 0.63 (range, 0.59–0.65), or 67% specificity and 95% sensitivity, in the cross-validation development cohort. In the validation cohort, the classifier identified samples with dMMR with an AUROC curve of 0.95 (range, 0.92–0.96) without image-preprocessing and an AUROC curve of 0.96 (range, 0.93–0.98) after color normalization.
Conclusions:
We developed a deep-learning system that detects colorectal cancer specimens with dMMR or MSI using hematoxylin and eosin-stained slides; it detected tissues with dMMR with an AUROC of 0.96 in a large, international validation cohort. This system might be used for high-throughput, low-cost evaluation of colorectal tissue specimens.
Keywords: biomarker, cancer immunotherapy, Lynch syndrome, mutation
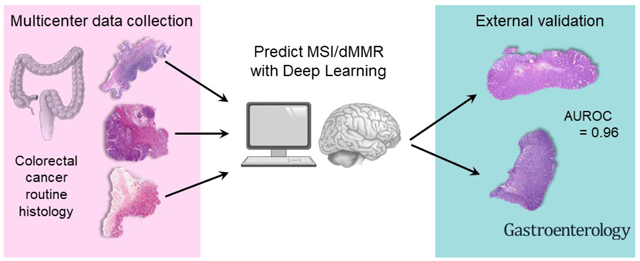
Graphical Abstract
Lay summary
Many patients with bowel cancer are not tested for genetic changes. This study showed that and artificial intelligence system can complement existing histologic analyses of tissue specimens to detect colorectal cancer, increasing the speed and reduce the costs of testing.
Introduction
Mismatch repair deficiency (dMMR) is observed in 10% to 20% of colorectal cancer (CRC) patients and indicates a biologically distinct type of CRC with broad prognostic, predictive and therapeutic relevance.1 In CRC and other cancer types, dMMR causes microsatellite instability (MSI), a specific DNA damage pattern. MSI and dMMR are associated with lack of chemotherapy response in intermediate stage CRC (pT3–4 N0–2), a reduced incidence of locoregional metastases and hence the opportunity of cure by local excision in early stage disease and a reduced requirement for adjuvant chemotherapy in stage II disease. In late-stage disease, MSI and dMMR are predictive of response to immune checkpoint inhibition and is the only clinically approved pan-cancer biomarker for checkpoint inhibition in the United States.2 Furthermore, MSI and dMMR are the genetic mechanism driving carcinogenesis in Lynch Syndrome (LS), the most common hereditary condition leading to colorectal cancer.3 Because of this broad clinical importance, MSI or dMMR testing is recommended for all colorectal cancer patients by national and international guidelines such as the British National Institute for Health and Care Excellence (NICE) guideline4 and the European Society for Medical Oncology (ESMO) guidelines.5 However, in clinical practice, only a subset of CRC patients is investigated for presence of MSI or dMMR because of the high costs associated with universal testing. This lack of testing potentially leads to overtreatment with adjuvant chemotherapy, underdiagnosis of LS, reduced opportunities to consider local excision instead of extensive surgery with related risks and morbidity and failure to identify candidates for cancer immunotherapy.
Current laboratory assays for MSI and dMMR testing involve a multiplex PCR assay or a multiplex immunohistochemistry (IHC) panel. Specifically, MSI can be tested by the “Bethesda panel” PCR6 whereas a four-plex IHC can demonstrate absence of one of four mismatch-repair (MMR) enzymes (MLH1, MSH2, MSH6, and PMS2)7. However, both assays for MSI or dMMR incur cost8, require additional sections of tumor tissue in addition to routine hematoxylin and eosin (H&E) histology9 and yield imperfect results. Sensitivity and specificity of these tests have been evaluated in numerous population-based studies which are summarized in current clinical guidelines.10 In these reference studies, test performance of molecular assays is reported with a sensitivity of 100% and specificity of 61.1%11 or a higher specificity of 92.5% with a lower sensitivity of 66.7%12 for MSI testing. Similarly, for IHC based tests, sensitivity is reported as 85.7% with a 91.9% specificity in a key study13 while other international guidelines estimate that IHC testing has a sensitivity of 94% and a specificity of 88%5. This variable performance of clinical gold standard tests indicates that there is need for improvement. In addition, all available tests incur a substantial cost and require specialized molecular pathology laboratories. This highlights the need for new robust, low-cost and ubiquitously applicable diagnostic assays for MSI or dMMR detection in CRC patients.
In routine hematoxylin and eosin (H&E) histological images, MSI and dMMR tumors are characterized by distinct morphological patterns such as tumor-infiltrating lymphocytes, mucinous differentiation, heterogeneous morphology and a poor differentiation.14 Although these patterns are well known to pathologists, manual quantification of these features by experts is not reliable enough for clinical diagnosis and therefore is not feasible in routine clinical practice.15 In contrast, computer-based image analysis by deep learning has enabled robust detection of MSI and dMMR status directly from routine H&E histology: we have recently presented16 and later refined17 such a deep learning assay, which was independently validated by two other groups18,19. However, all of these studies have used a few hundred CRC patients at most, while clinical implementation of a deep learning based diagnostic assay requires enhanced sensitivity and specificity to those previously reported and large-scale validation across multiple populations in different countries.
To address this, we formed the MSIDETECT consortium: a group of multiple academic medical centers across and beyond Europe (http://www.msidetect.eu). In this not-for-profit consortium, we collected tumor samples from more than 8000 patients with molecular annotation. Pre-specified intent was to train and externally validate a deep learning system for MSI and dMMR detection in CRC. The primary endpoint was diagnostic accuracy measured by area under the receiver operating curve (AUROC), area under the precision-recall curve (AUPRC) and, correspondingly, specificity at multiple sensitivity levels (99%, 98%, 95%).
Materials and methods
Ethics statement and patient cohorts
We retrospectively collected anonymized H&E stained tissue slides of colorectal adenocarcinoma patients from multiple previous studies and population registers. For each patient, at least one histological slide was available and MSI status or MMR status was known. We included patients from the following four previous studies with the intent of retraining a previously described deep learning system.16,17 First, we used the publicly available Cancer Genome Atlas (TCGA, n=616 patients, Suppl. Figure 1), a multicenter study with Stage I to IV patients mainly from the United States of America.20 All images and data from the TCGA study are publicly available at https://portal.gdc.cancer.gov. Second, we used “Darmkrebs: Chancen der Verhütung durch Screening” (DACHS, n=2292, Suppl. Figure 2), a population-based study of CRC Stage I to IV patients from south western Germany21. Tissue samples from the DACHS study were provided by the Tissue Bank of the National Center for Tumor Diseases (NCT) Heidelberg, Germany in accordance with the regulations of the tissue bank and the approval of the ethics committee of Heidelberg University.21,22 Third, we used samples from the “Quick and Simple and Reliable” trial (QUASAR, n=2206, Suppl. Figure 3), which originally aimed to determine survival benefit from adjuvant chemotherapy in patients from the United Kingdom with mainly Stage II tumors.23 Lastly, the Netherlands Cohort Study (NLCS, N=2197, Suppl. Figure 4)24,25 collected tissue samples as part of the Rainbow-TMA consortium, and like DACHS, this study included patients with any tumor stage. All studies were cleared by the institutional ethics board of the respective institutions as described before (for QUASAR23, DACHS22 and NLCS25).
With the intent of external validation of the deep learning system, we collected H&E slides from the population-based Yorkshire Cancer Research Bowel Cancer Improvement Programme (YCR-BCIP)26 cohort, where routine National Health Service diagnosis of dMMR was undertaken with further BRAF mutation and/or hMLH1 methylation screening to identify patients at high risk of having LS. The primary validation cohort from YCR-BCIP contained n=771 patients with standard histology after surgical resection (YCR-BCIP-RESECT, Suppl. Figure 5). For an additional exploratory analysis, we also acquired a non-overlapping set of n=1531 patients from YCR-BCIP with endoscopic biopsy samples (YCR-BCIP-BIOPSY, Suppl. Figure 6). A set of N=128 polypectomy samples from the YCR-BCIP study (YCRBCIP-BIOPSY) contained only N=4 MSI or MMRd patients and was not used for further analyses as AUROC and AUCPR values are not meaningful for such low prevalence features. For all patient samples in YCR-BCIP26, a fully anonymized single scanned image of a representative H&E slide for each patient was utilized as a service evaluation study with no access to tissue or patient data aside from mismatch repair status.
Available clinico-pathological characteristics of all cases in each cohort are summarized in Table S1. MSI status in the TCGA study was determined genetically as described before.20 MSI status in the DACHS study was determined genetically with a three-plex panel as described before.27 In the QUASAR, NLCS and YCR-BCIP cohorts, mismatch-repair deficiency (dMMR) or proficiency (pMMR) was determined with a standard immunohistochemistry assays on tissue microarrays as described before (two-plex for MLH1 and MSH2 in NLCS and QUASAR, four-plex for MLH1, MSH2, MSH6 and PMS2 for YCR-BCIP).23 This study complies with the “Transparent reporting of a multivariable prediction model for individual prognosis or diagnosis” (TRIPOD) statement as shown in Table S2.
Image preprocessing and deep learning
All slides were individually, manually reviewed by trained observers supervised by expert pathologists to ensure that tumor tissue was present on the slide and the slide had diagnostic quality. Observers and supervisors were blinded regarding MSI status and any other clinical information. Tumor tissue was manually outlined in each slide. A small number of cases were excluded due to insufficient quality, technical issues, absence of tumor tissue on the observed slide or lack of molecular information (Suppl. Figure 1–6). Tumor regions were tessellated into square tiles of 256 μm edge length and saved at a resolution of 0.5 μm per pixel using QuPath v0.1.228. Initially, the method pipeline was kept as simple as possible and color normalization was not used to preprocess the images. In a slight variation of the initial experiments, all image tiles were color-normalized with the Macenko method29 as described previously30. A modified shufflenet deep learning system with a 512×512x input layer was trained on these image tiles in Matlab R2019a (Mathworks, Natick, MA, USA) with the hyperparameters listed in Table S3, as described before17. Tile-level predictions were averaged on a patient level with the proportion of predicted MSI or dMMR tiles (positive threshold) being the free parameter for the Receiver Operating Characteristic (ROC) analysis. All confidence intervals were obtained by 10-fold bootstrapping. No image tiles, or slides from the same patient were ever part of the training set and test set. All trained deep learning classifiers were assigned a unique identifier as listed in Table S4. All classifiers can be downloaded at https://dx.doi.org/10.5281/zenodo.3627523. Source codes are publicly available at https://github.com/jnkather/DeepHistology.
Experimental design
All deep learning experiments (training and test runs) were pre-specified and are listed in Table S5. All patients from TCGA, DACHS, QUASAR and NLCS were combined and served as the training set (“international cohort”). To assess the magnitude of batch effects, we trained a deep learning system on each sub-cohort in this international training cohort, assessing inter-cohort and intra-cohort performance, the latter being estimated by three-fold cross-validation (experiment #1). In addition, we performed a three-fold cross-validation on the full international cohort without (experiment #2) and with color normalization (experiment #2N), which was used for a detailed subgroup analysis according to predefined clinic-pathological and molecular subgroups. To identify the optimal number of patients needed for training, we used the international cohort, randomly set aside n=906 patients for testing, and trained on increasing proportions of the remaining n=5500 patients (experiment #3). To evaluate the deep learning system in an independent, external, population-based cohort, we trained on the international cohort and tested on YCR-BCIP-RESECT (experiment #4, this was the primary objective of our study). This experiment was repeated with color-normalized image tiles (experiment #4N). YCR-BCIP-RESECT was regarded as the “holy” test set and was not used for any other purpose than to evaluate the final classifier. Exploratively, we also evaluated the final classifier on YCR-BCIP-BIOPSY (experiment #5). Furthermore, to investigate the performance “train-on-biopsy, test-on-biopsy”, we exploratively trained a three-fold cross-validated classifier on YCR-BCIP-BIOPSY (experiment #6).
Results
Deep learning consistently predicts MSI in multiple patient cohorts
In the MSIDETECT consortium, a deep learning system was trained to predict MSI or dMMR status from digitized routine H&E whole slide images alone, with ground truth labels according to local standard procedures (PCR testing for MSI or IHC testing for dMMR). First, we investigated deep learning classifier performance in patients of the TCGA, DACHS, QUASAR and NLCS cohorts alone. We found that training the deep learning system on individual cohorts yielded an intra-cohort AUROC of 0.74 [0.66, 0.80] in the TCGA cohort (n=426), 0.89 [0.86, 0.91] in the QUASAR cohort (n=1770), 0.92 [0.91, 0.94] in the DACHS cohort (n=2013) and 0.89 [0.88, 0.92] in the NLCS cohort (n=2197 patients) (Table S6). This high intra-cohort performance dropped in some inter-cohort experiments (Table 1, experiment #1 in Table S5). Together, these data show that deep learning systems attain high diagnostic accuracy in single-center cohorts but do not necessarily generalize to other patient cohorts.
Table 1:
Estimating batch effects by analyzing intra-cohort and inter-cohort performance in all sub-cohorts in the international cohort.
| train on TCGA n=426 15% MSI | train on QUASAR n=1770 14% dMMR | train on DACHS n=2013 14% MSI | train on NLCS n=2197 10% dMMR | |
|---|---|---|---|---|
| test on TCGA (US) | 0.74 [0.66, 0.80] | 0.76 [0.70, 0.79] | 0.77 [0.73, 0.79] | 0.72 [0.71, 0.78] |
| test on QUASAR (UK) | 0.67 [0.64, 0.68] | 0.89 [0.86, 0.91] | 0.71 [0.68, 0.75] | \ 0.76 [0.73, 0.78] |
| test on DACHS (DE) | 0.81 [0.79, 0.83] | 0.68 [0.65, 0.72] | 0.92 [0.91, 0.94] | 0.80 [0.78, 0.82] |
| test on NLCS (NL) | 0.77 [0.74, 0.79] | 0.80 [0.78, 0.81] | 0.82 [0.79, 0.83] | 0.90 [0.89, 0.91] |
Main performance measure was area under the receiver operating curve, shown as mean with lower and upper bounds in a 10-fold bootstrapped experiment. Intra-cohort-performance was estimated by three-fold cross-validation. US = United States, UK = United Kingdom, DE = Germany, NL = Netherlands, MSI = microsatellite instability, dMMR = mismatch repair deficiency.
Increasing patient number compensates for batch effects and improves performance
In the intra-cohort experiments (Table 1), training on larger cohorts generally yielded higher performance, corroborating the theoretical assumption that training on larger data sets yields more robust classifiers. To quantify this effect, we merged all patients from TCGA, DACHS, QUASAR and NLCS in a large “international cohort” (n=6406 patients) (Figure 1a). From these digitized whole slide histology images, we created a library of image tiles for training deep learning classifiers (Figure 1b). Thus, we increased the patient number as well as the data heterogeneity due to different pre-analytic pipelines in the respective medical centers. We set aside a randomly chosen proportion of n=906 of these patients and re-trained deep learning classifiers on 500, 1000, 1500 up to 5500 patients of the international cohort. In this experiment, we found that AUROC (Figure 1c) and AUPRC (Suppl. Figure 7) on the test set initially increased as the number of patients in the training set increased. However, each increase in patient number yielded diminishing performance returns and AUROC and AUPRC plateaued at approximately 5000 patients (Figure 1d). The top performance was achieved by training on 5500 patients and testing on the fixed test set of n=906 patients, with an AUROC of 0.92 [0.90, 0.93] (compared to a baseline of 0.5 by a random model, Figure 1c), an AUPRC of 0.59 [0.49, 0.63] (compared to a baseline of 0.12 in a random model, Suppl. Figure 7, experiment #3 in Table S5), translating to a specificity of 52% at a sensitivity of 98%. To ensure that this performance was not due to the random selection of the internal test set, we performed a patient-level three-fold cross-validation on the full international cohort (n=6406), reaching a similar mean AUROC of 0.92 [0.91, 0.93] (Figure 1d, experiment #2 in Table S5). Together, these data show that approximately 5000 patients are necessary and sufficient to train a high-quality deep learning detector of MSI and dMMR.
Figure 1: Deep learning workflow and learning curves.
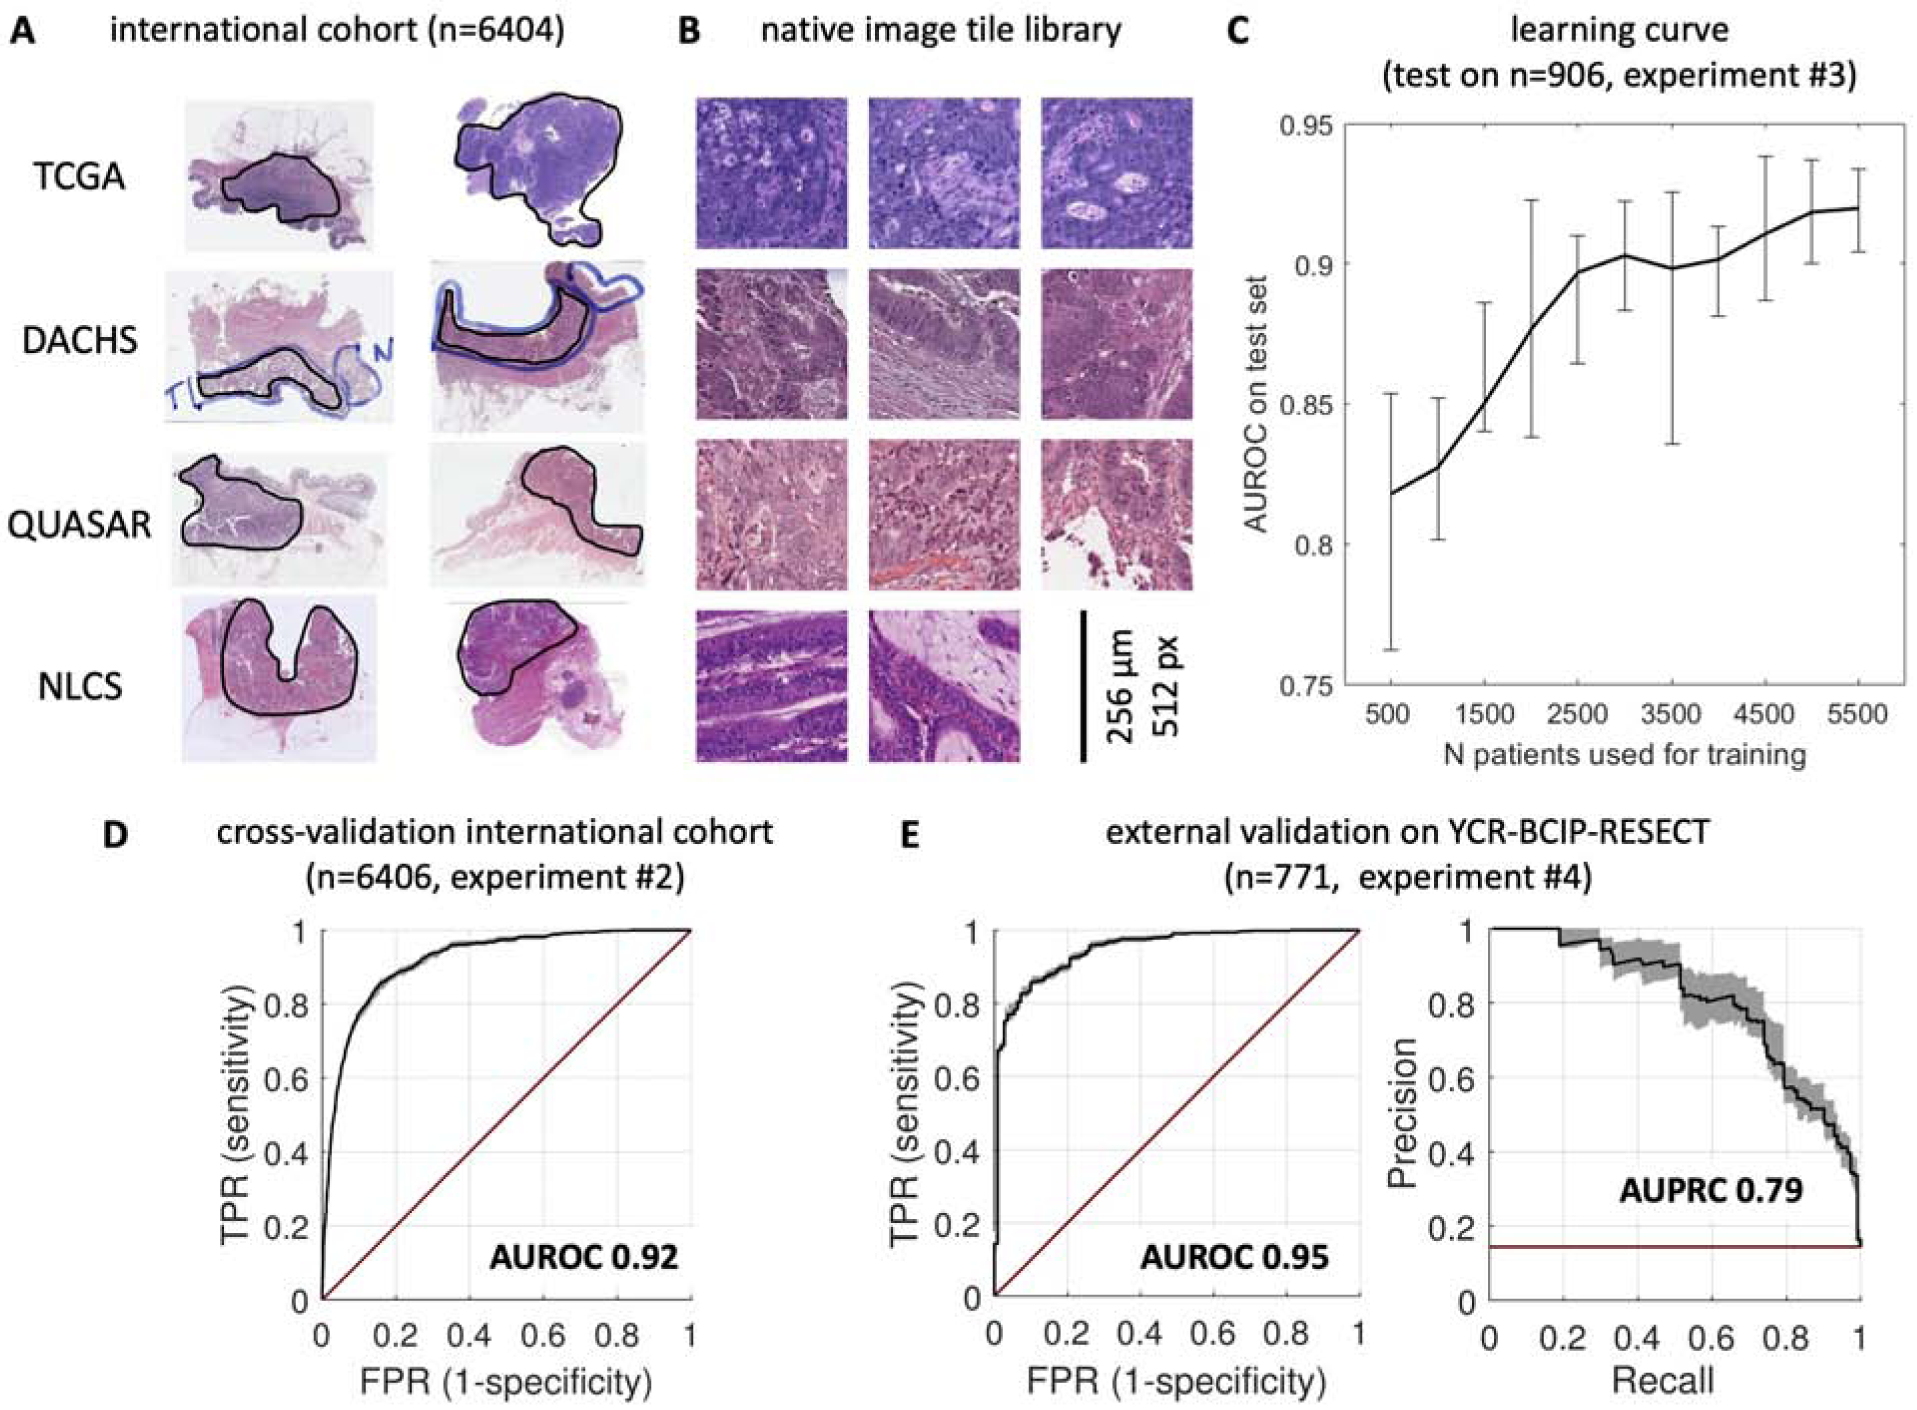
(A) Histological routine images were collected from four large patient cohorts. All slides were manually quality-checked to ensure presence of tumor tissue (circled in black). (B) Tumor regions were automatically tessellated and a library of millions of non-normalized (native) image tiles was created. (C) The deep learning system was trained on increasing numbers of patients and evaluated on a random subset (n=906 patients). Performance initially increased by adding more patients to the training set, but reached a plateau at approximately 5000 patients. (D) Cross-validated experiment on the full international cohort (comprising TCGA, DACHS, QUASAR and NLCS). Receiver operating characteristic (ROC) with true positive rate (TPR) shown against false positive rate (FPR), area under the ROC curve (AUROC) is shown on top. (E) ROC curve (left) and precision-recall-curve (right) of the same classifier applied to a large external dataset. High test performance was maintained in this dataset and thus, the classifier generalized well beyond the training cohorts. Black line = average performance, shaded area = bootstrapped confidence interval, red line = random model (no skill).
Clinical-grade performance in an external test cohort
Deep learning systems are prone to overfit to the dataset they were trained on and thus, must be validated in external test sets. Correspondingly, the pre-specified primary endpoint of this study was the test performance in a completely independent set of patients. This set of patients was intended to be population-based, i.e. to mirror the clinico-pathological characteristics of a real-world screening population. It was used for no other purpose than to validate the final classifier, which was previously trained on the international cohort. The test set comprised routine H&E slides from the population-based YCR-BCIP study (YCR-BCIPRESECT, n=771 patients, one slide per patient). In this population, we found a high classification performance with a mean AUROC of 0.95 and [0.92, 0.96] lower and upper bootstrapped confidence bounds, respectively (Figure 1e, Table S6, experiment #4). Because the target feature MSI and dMMR are unbalanced in real-world populations such as YCR-BCIP-RESECT, we also assessed the precision-recall-characteristics of this test, demonstrating a very high AUPRC of 0.79 [0.74, 0.86], compared to the baseline AUPRC of 0.14 of the null model in this cohort. These data show that a deep learning system trained on a large and heterogeneous international training cohort generalizes well beyond the training set, and thus constitutes a tool of potential clinical applicability.
Prediction performance is robust in clinico-pathological and molecular subgroups
Colorectal cancer comprises a number of anatomically and biologically distinct molecular sub-groups, including right- and left-sided colon cancer, rectal cancer, BRAF-driven and RAS-driven tumors, among others. This is especially relevant these features are partially dependent on each other, e.g. BRAF mutations and right-sidedness are associated with MSI status31,32. To assess if image-based MSI prediction is robust across these heterogeneous subgroups, we used the cross-validated deep learning system (experiment #2 in Table S5) and compared AUROC and AUPRC across subgroups. (Figure 2 and 9). We found some variation in classifier performance regarding anatomical location: the AUROC was 0.89 for right-sided cancer (n=2371 patients), 0.88 for left-sided cancer (n=3846), 0.91 for colon cancer overall (n=4408) and 0.83 for rectal cancer (n=1938). Little variation was observed in classifier performance according to molecular features: AUROC was 0.86 in BRAF mutants (N=298) and 0.91 in BRAF wild type (N=3226); also, AUROC was 0.90 in KRAS mutants (N=1263) and 0.93 in KRAS wild type tumors (N=2248). Finally, we analyzed the robustness of MSI predictions for different “Union for International Cancer Control” (UICC) stages, showing stable performance with an AUROC of 0.93 in Stage I (N=871), 0.92 in Stage II (N=3261) and 0.91 in Stage III (N=1554) tumors and a minor reduction of performance in Stage IV patients (N=636) reaching an AUROC of 0.83. In addition, histological grading (Suppl. Figure 8) did not influence classification performance. Next, we asked if this robust performance across subgroups was maintained in the external test cohort (YCR-BCIPRESECT, N=771 patients). Again, in this cohort, we did not find any relevant loss in performance with regard to the following subgroups: tumor stage, organ, anatomical location and sex (Suppl. Figure 10 and 11). In summary, this analysis demonstrates and quantifies variations in performance according to CRC subgroups, but demonstrates that overall, MSI and dMMR detection performance is robust.
Figure 2: Cross-validated subgroup analysis for detection of MSI and dMMR in the international cohort (n=6406 patients).
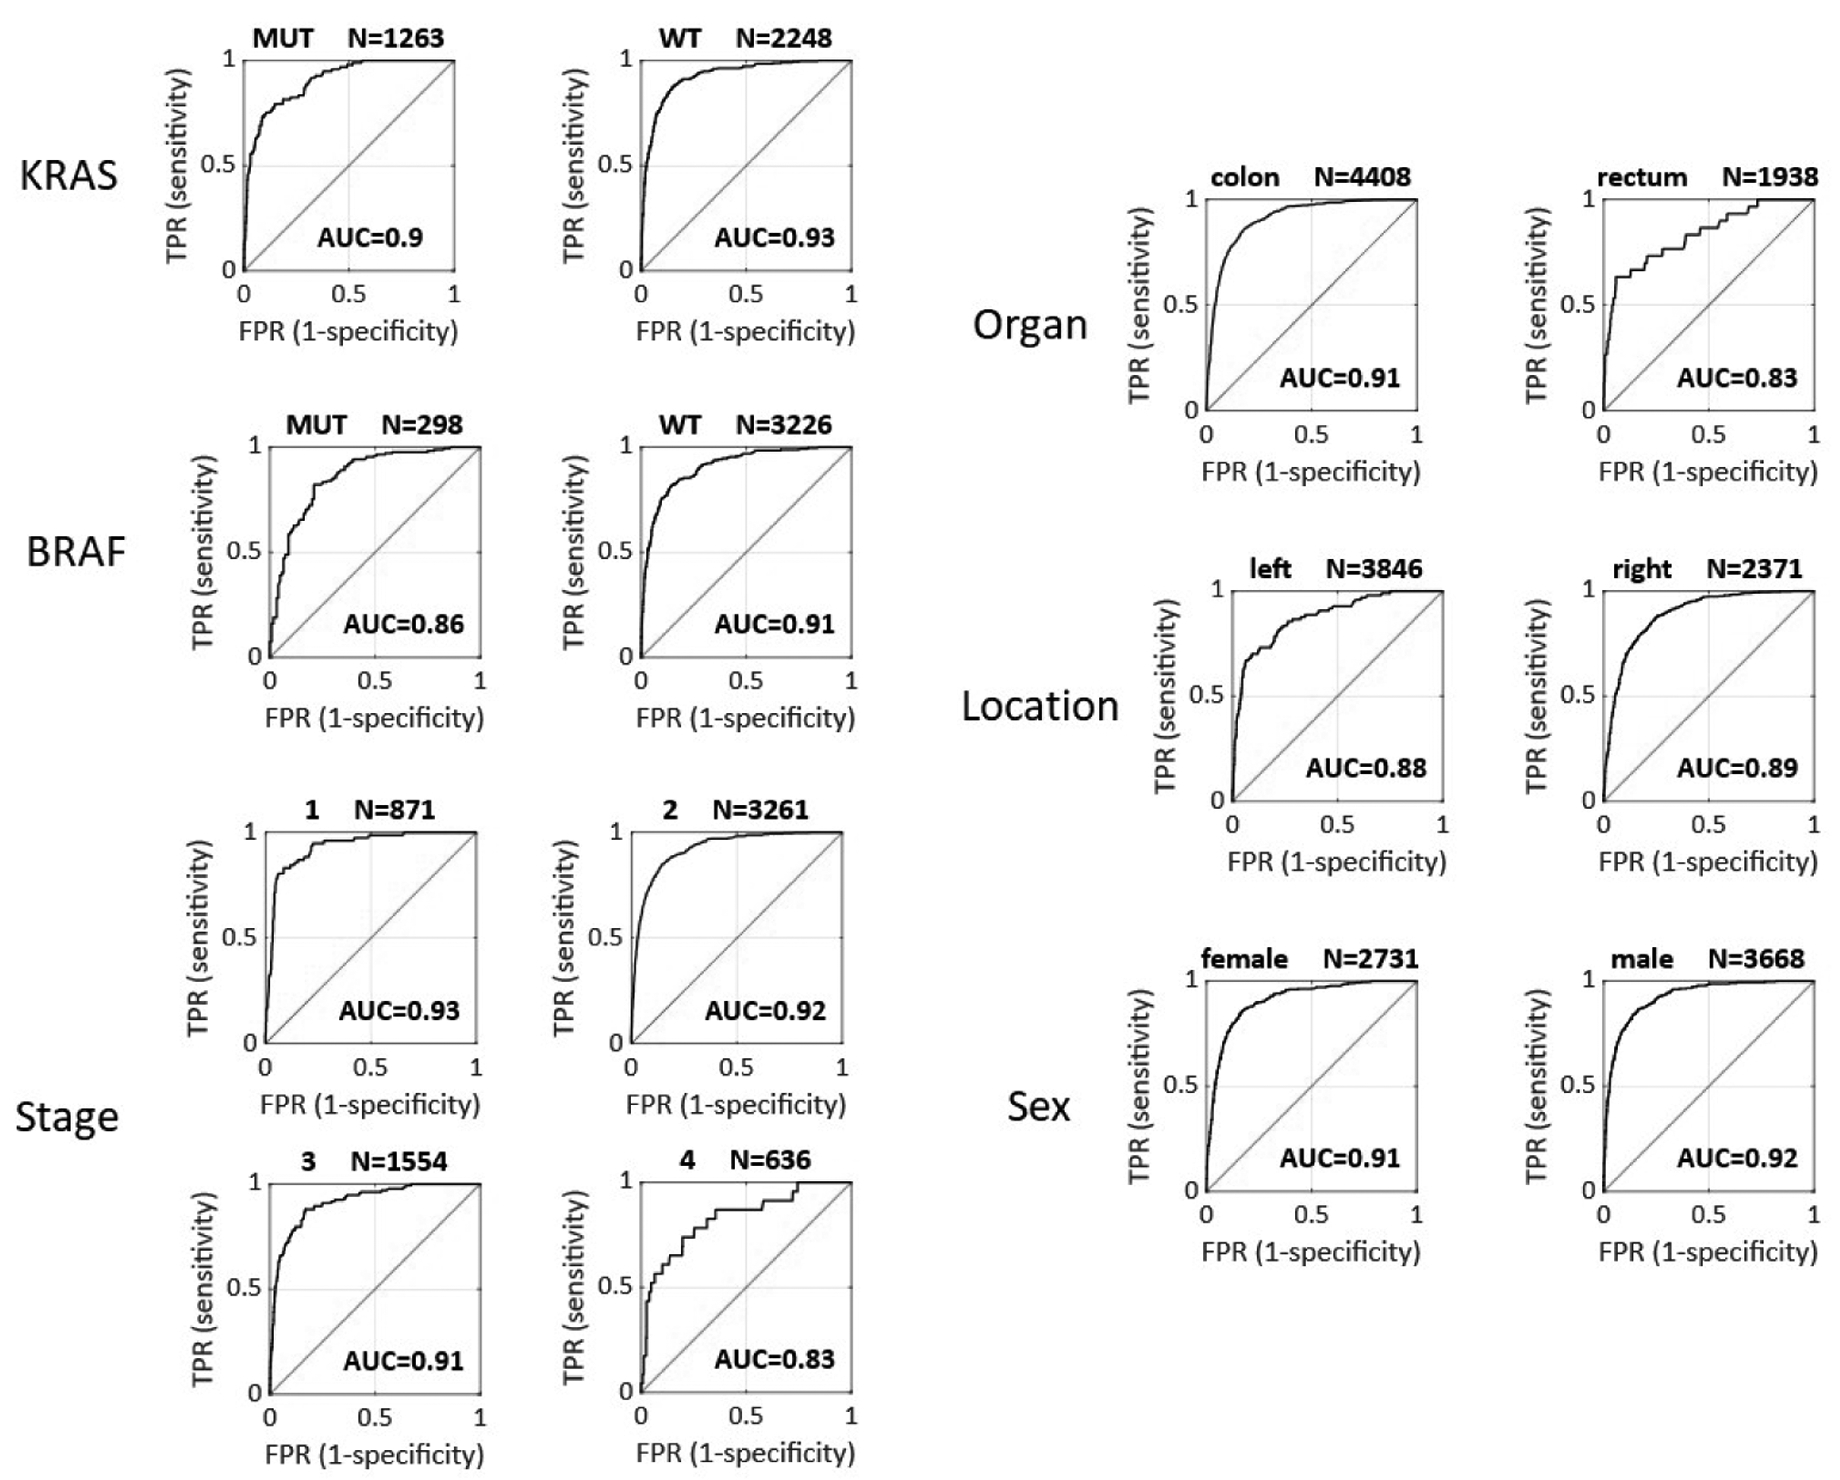
AUC = area under the receiver operating curve as shown in the image, TPR = true positive rate, FPR = false positive rate, WT = wild type, MUT = mutated.
Application of the deep learning system to biopsy samples
As additional exploratory endpoints, we tested if a deep learning system trained on histological images from surgical resections can predict MSI and dMMR status of images from endoscopic biopsy tissue. Biopsy samples include technical artifacts (fragmented tissue and small tissue area, Suppl. Figure 12a) as well as biological artifacts (they are sampled from luminal portions of the tumor only). We acquired endoscopic biopsy samples from n=1557 patients in the YCR-BCIP-BIOPSY study and tested the resection-trained classifier (experiment #5 in Table S6). We found that AUROC was reduced to 0.78 [0.75, 0.81] (Suppl. Figure 12b) in this experiment. In a three-fold cross-validated experiment on all n=1531 patients in the YCR-BCIP-BIOPSY cohort, MSI and dMMR detection performance was restored to an AUROC of 0.89 [0.88, 0.91] (experiment #6 in Table S5). These data suggest that MSI and dMMR testing on biopsies requires a classifier trained on biopsies.
Color normalization improves external test performance
As previous studies have pointed to a benefit of color-normalizing histology images before quantitative analysis29, the main experiments in this study were repeated on color-normalized image tiles. Native (non-normalized) image tiles (Figure 4A) were subjectively more diverse in terms of staining hue and intensity than normalized tiles (Figure 4B). Repeating MSI and dMMR prediction by three-fold cross-validation on the full international cohort with color-normalized tiles (experiment #2N in Table S5), we found that color normalization modestly improves specificity at pre-defined sensitivity levels: Specificity was 57% at 99% sensitivity in experiment #2N, as opposed to specificity of 38% at 99% sensitivity in the corresponding non-normalized experiment (#2). However, this increase in specificity did not result in a higher AUROC overall (Table S5). To test if color normalization improves external test performance of MSI and dMMR predictors, we repeated experiment #4 (train on full international cohort, external test on YCR-BCIP-RESECT) after color normalization (experiment #4N). In this case, AUROC did improve (no normalization in #4: AUROC 0.95 [0.92, 0.96], color normalization in #4N: AUROC 0.96 [0.93, 0.98]). This slight increase in AUROC translated into a higher specificity at predefined sensitivity levels, reaching 58% specificity at 99% sensitivity (Table S5). These data show that color normalization can further improve classifier performance and improves generalizability of deep learning-based inference of MSI and dMMR status.
Figure 4: Effect of color normalization on classifier performance.
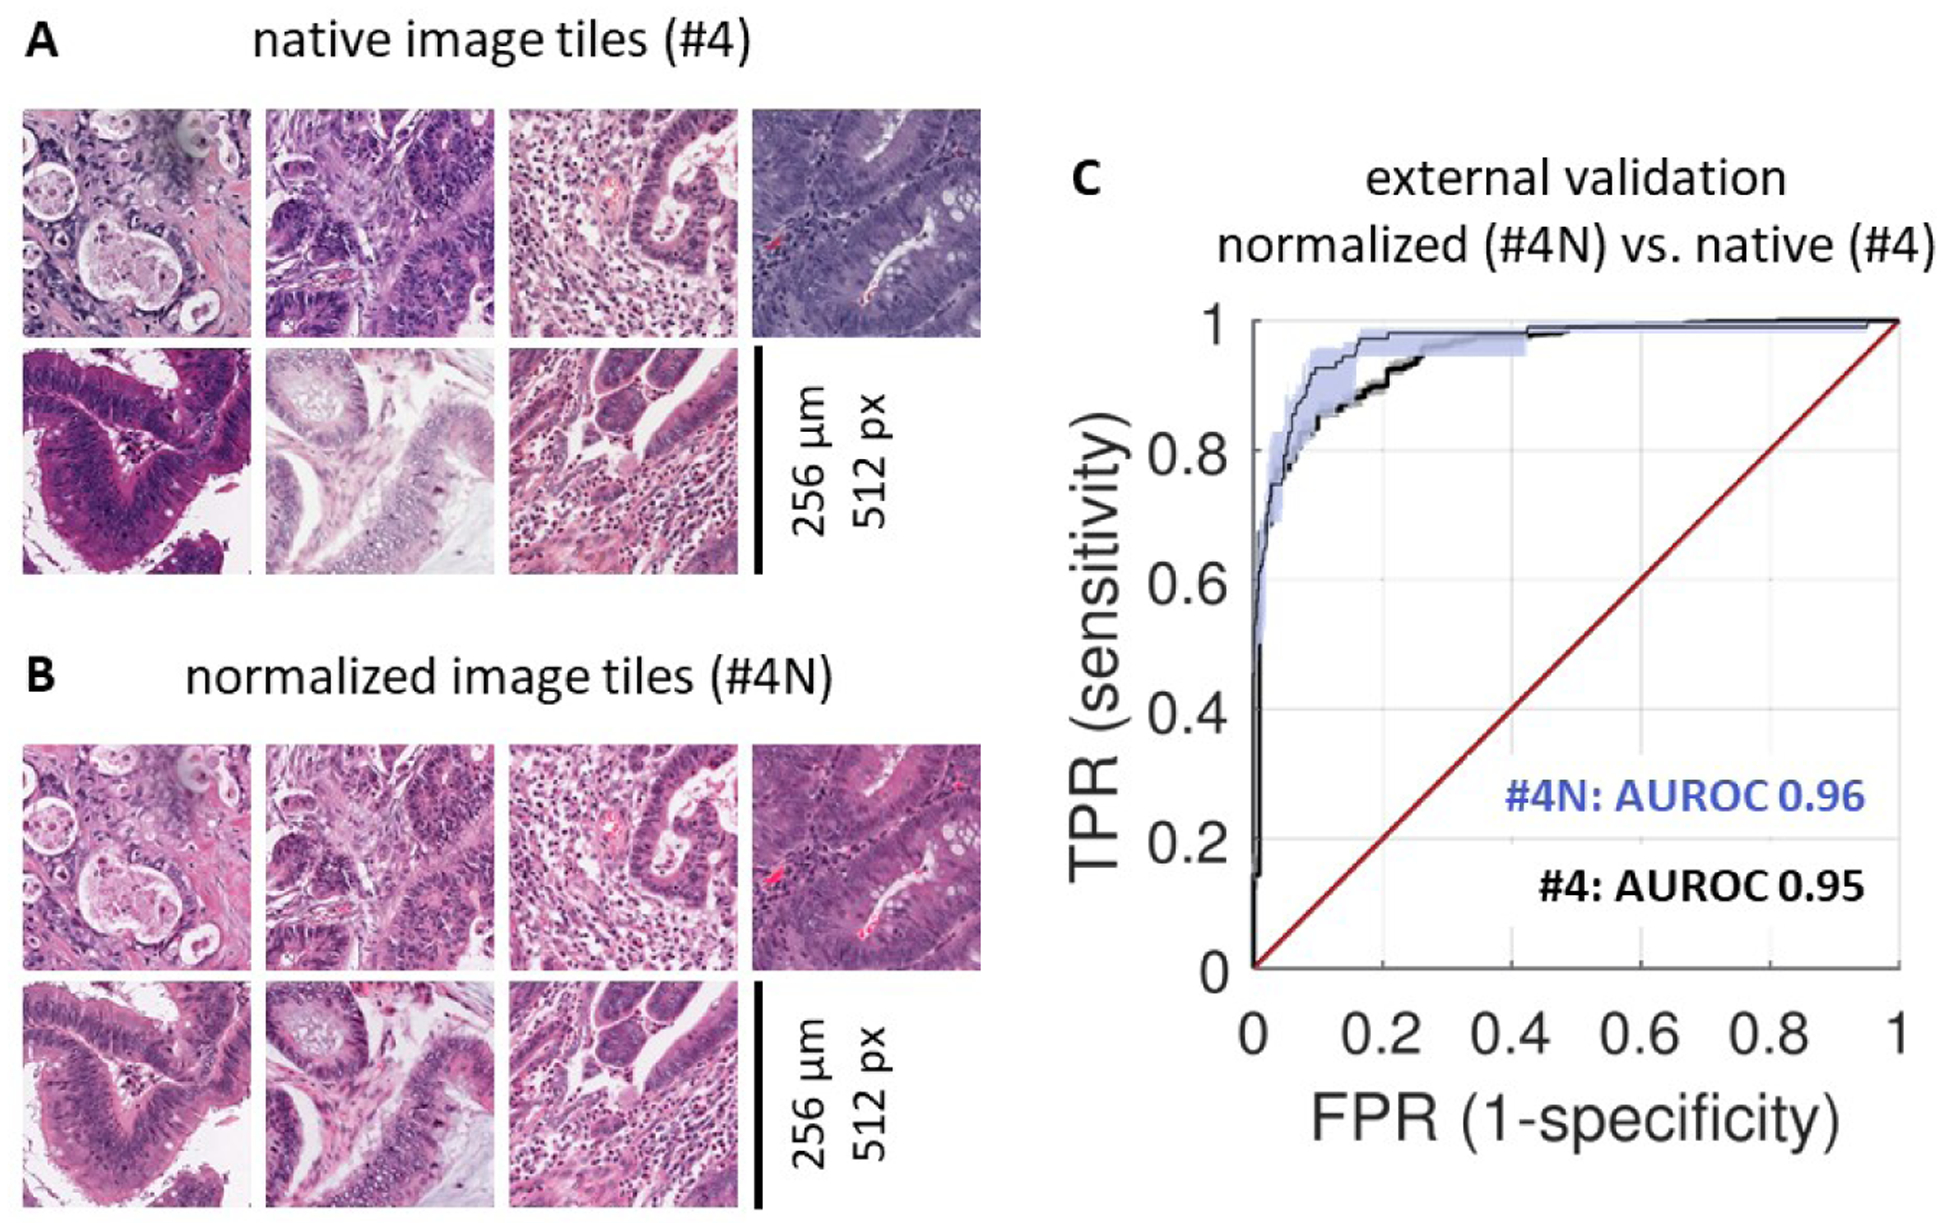
(A) A representative set of tiles from the MSIDETECT study. (B) The same tiles after color normalization. (C) Classifier performance on an external test set (YCR-BCIP-RESECT, n=771 patients) improves after color-normalizing training and test sets. Experiment #4N is with color normalization, experiment #4 is without color normalization. AUROC: area under the receiver operating curve, TPR: true positive rate, FPR: false positive rate.
Discussion
A clinical-grade deep learning-based molecular biomarker in cancer
Analysing more than 8000 CRC patients in an international consortium, we demonstrate that deep learning can reliably detect MSI and dMMR tumors based on routine H&E histology alone. In an external validation cohort, the deep learning MSI and dMMR detector performed with similar characteristics to gold standard tests12, reaching clinical-grade performance. As shown in previous studies16 it can be assumed that this deep learning-based method can be cheaper and faster than routine laboratory assays and therefore has the potential to improve clinical diagnostic workflows. Our data show that classifier performance in surgical specimens remains robust even when the classifier is applied to external cohorts, but performance is lower in biopsy samples where tissue areas are much smaller than those of surgically resected specimens. This highlights the need to perform thorough large-scale evaluation of deep learning-based biomarkers in each intended use case. Deep learning histology biomarkers such as the MSI and dMMR detection system can be made understandable by visualization of prediction maps (Figure 3a–i) or by visualizing highly scoring image tiles (Suppl. Figure 13a–b). Together, these approaches show that the deep learning system yielded plausible predictions. For example, high MSI or dMMR scores were assigned to poorly differentiated tumor tissue (Suppl. Figure 13a) while high MSS or pMMR scores were assigned to well-differentiated areas. Interestingly, the spatial patterns of tile-level predictions showed varying degrees of heterogeneity: In all analyzed true positive MSI and dMMR cases in the YCR-BCIP-RESECT validation cohort, we found a homogeneously strong prediction of MSI and dMMR as shown in Figure 3a and d. In contrast, predictions in true MSS and pMMR cases were more heterogeneous. Necrotic, poorly differentiated or immune-infiltrated areas tended to be falsely predicted to be MSI or dMMR (Figure 3c and f). However, as patient-level predictions reflected overall scores in the full tumor area, most true MSS and pMMR patients were correctly predicted after pooling tile-level predictions, despite some degree of tile-level heterogeneity.
Figure 3: Prediction map in the external test cohort YCR-BCIP-RESECT.
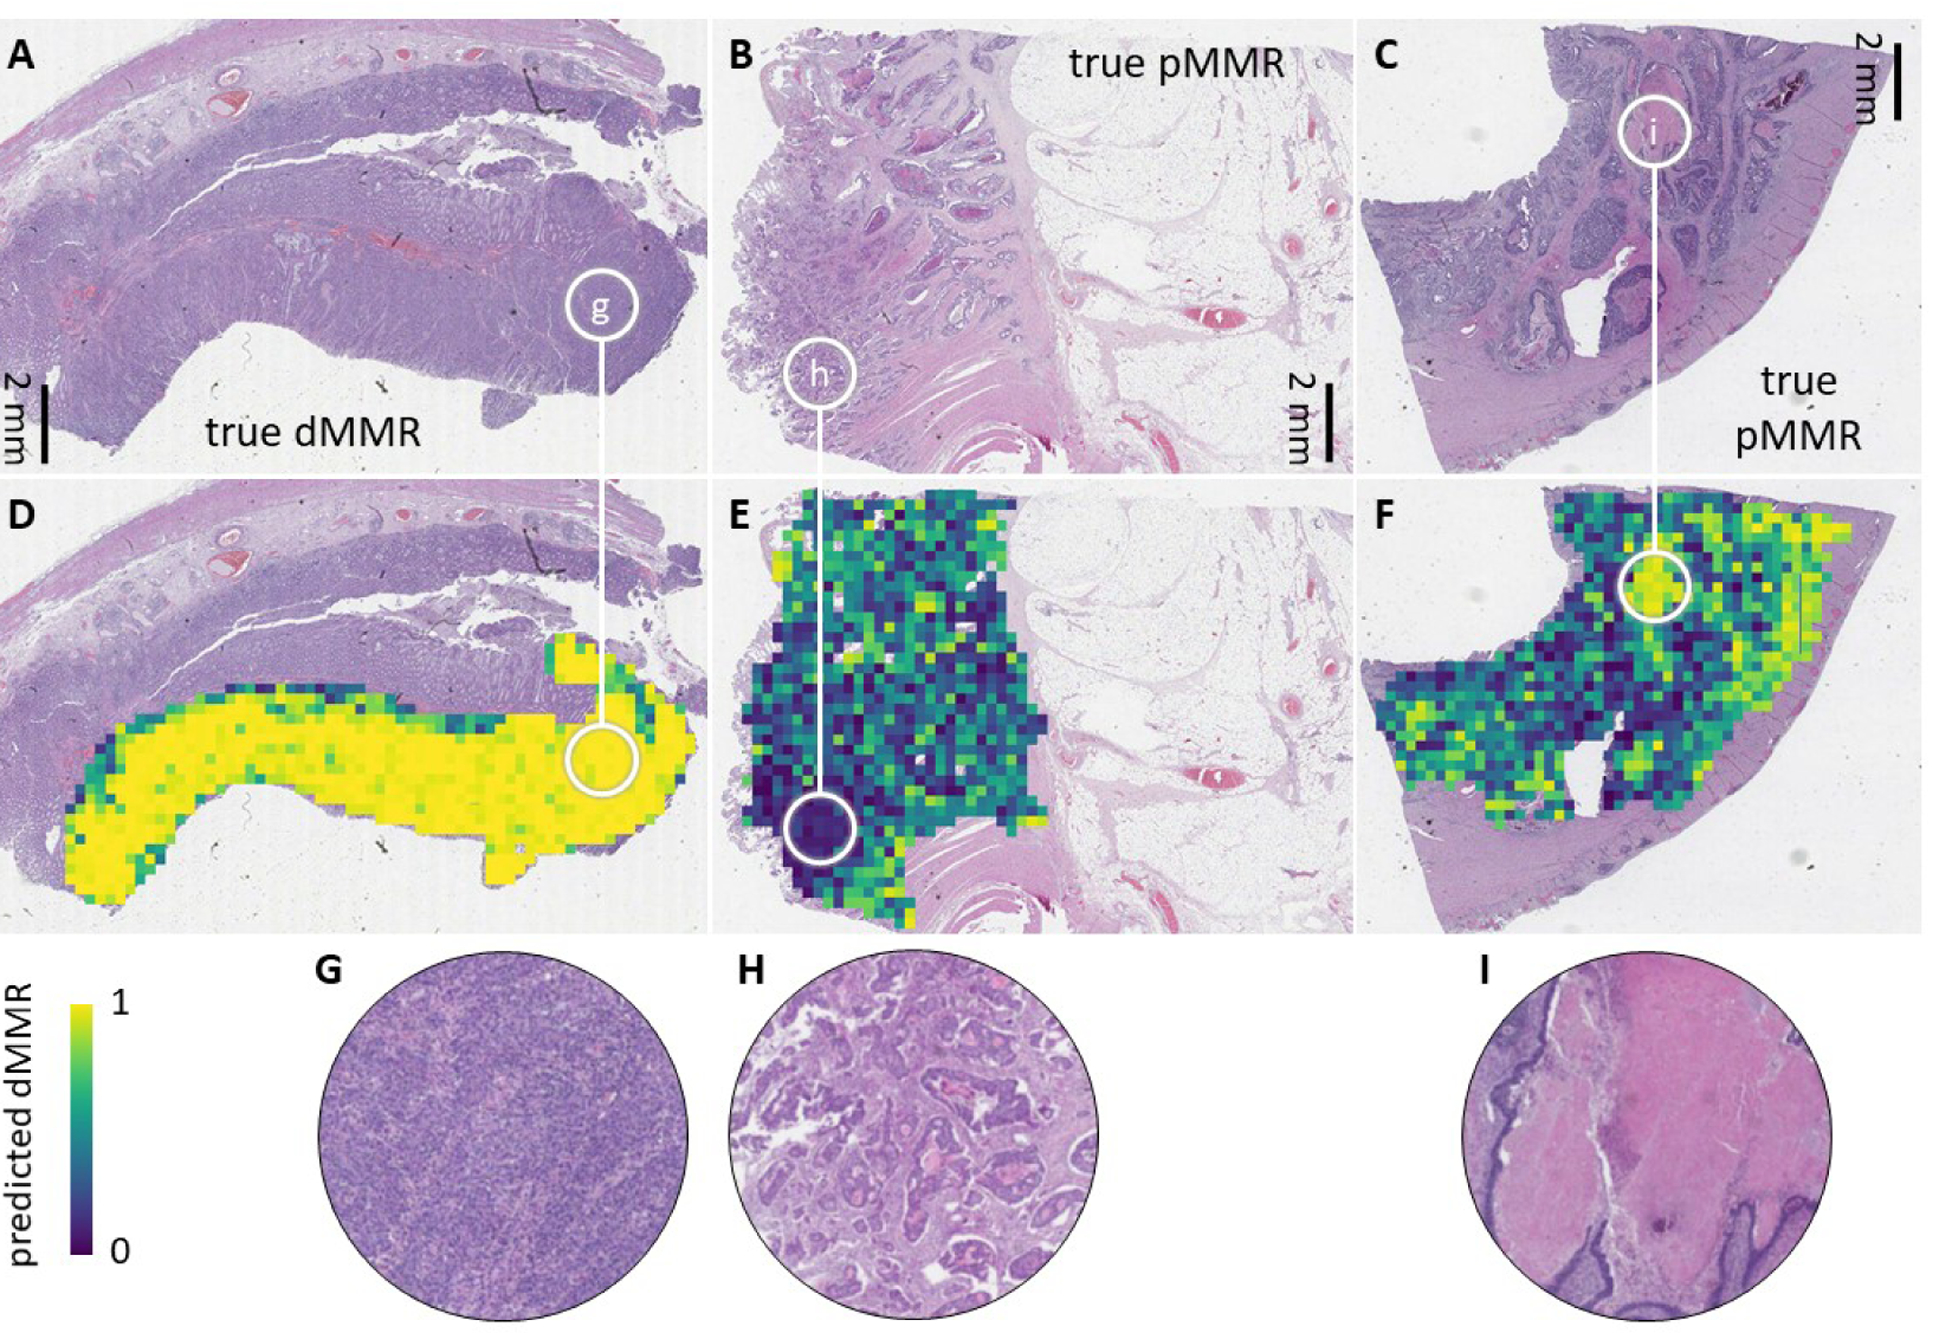
(A-C) Representative images from the YCR-BCIP-RESECT test cohort labeled with immunohistochemically defined mismatch repair (MMR) status. (D-F) Corresponding deep learning prediction maps. The edge length of each prediction tile is 256 μm. (G-I) Higher magnification of regions highlighted in a-e. True MSI or dMMR patients were strongly and homogeneously predicted to be MSI or dMMR (such as the patient shown in A). True MSS or pMMR patients were overall predicted to be MSS or pMMR (such as the patients in B and C), but a pronounced heterogeneity was observed in necrotic areas, poorly differentiated areas and immune-infiltrated tumor areas at the invasive edge.
Clinical application: pre-screening or definitive testing
In this study, diagnostic performance was stable across multiple clinically relevant subgroups, except for lower-than-average performance in rectal cancer patients, possibly due to neoadjuvant pre-treatment of some of these patients. In summary, this study defines a thoroughly validated deep learning system for genotyping CRC based on histology images alone, which could be used in clinical settings after regulatory approval. By varying the operating threshold, sensitivity and specificity of this test can be changed according to the clinical workflow this test is embedded in: High-sensitivity deep learning assays could be used to pre-screen patients and could trigger additional genetic testing in case of positive predictions. Even with imperfect specificity, such classifiers could speed up the diagnostic workflow and provide immediate cost-savings, especially in the context of universal MSI and dMMR testing as recommended by clinical guidelines. Recent discussions and calculations on cost-effectiveness of systematic MSI or dMMR testing in CRC patients33 should incorporate deep-learning-based assays among the other strategies in the future. Alternatively, deep learning biomarkers such as the method presented in this study could be used for definitive testing in the clinic, especially in healthcare settings in which limited resources are currently prohibitive for universal molecular biology tests. Further studies are needed to determine optimal operating thresholds for specific patient populations and clinical settings. In addition, clinical deployment will require prospective validation and regulatory approval. Ultimately, this method should rapidly identify MSS and pMMR cases with high certainty and identify high risk MSI, dMMR and possible LS cases for confirmation by other tests. This could substantially reduce molecular testing load in clinical workflows and enable direct, universal low-cost MSI and dMMR testing from ubiquitously available routine material. Technical improvements could conceivably further improve performance and open up new clinical applications. In this study, we explored color normalization as a way of reducing heterogeneity in staining intensity and hue between patient cohorts. This intervention (experiment #4N in Table S5) modestly improved performance, increasing specificity from 51% to 58% at 99% sensitivity in an external validation cohort. The deep learning system and the source codes used in this study have been publicly released, enabling other researchers to independently validate and, potentially, further improve its performance.
Limitations
A limitation to our experimental workflow is that the ground truth labels used to train the deep learning system are imperfect. In the MSIDETECT group, clinical routine assays were used to assess MSI or dMMR status and these assays have a non-zero error rate. Correspondingly, classifier performance could suffer from noisy labels in the training data. On the other hand, test cases flagged as “false positive” could be true MSI or dMMR cases that were missed by the clinical gold standard test. Ultimately, it is conceivable that deep learning assays can outperform classical genetic or molecular tests in terms of predictive and prognostic performance, but testing this hypothesis would require large cohorts with clinical end point data and/or deep genetic characterization. In particular, the deep learning classifier could potentially detect rare genetic aberrations with MSI-like morphology, but again, lack of large training cohorts for these rare features currently precludes deeper investigation of this aspect. Another potential limitation of this study is the performance in patient groups of potential clinical interest that were not analyzed in the subgroup analysis, such as hereditary versus sporadic MSI and dMMR cases or different ethnic backgrounds. This is due to the lack of available clinical data in the utilized patient cohorts and future studies are needed to investigate the stability of deep learning-based prediction in these and further sub-populations.
Interestingly, when we analyzed the per-patient predictions of MSI status in the external test set (YCR-BCIP-RESECT), we found an outlier among the “false negative” predictions: patient #441999 had a very low “predicted MSI probability” of less than 15%, while all other “true MSI” patients had MSI probability scores more than 40%. We went back to the original histology slide of patient #441999 and noticed that a technical artifact had resulted in a blurred image, which was only visible at high magnification and had thus gone undetected in the manual quality check. This shows that an improved quality control at multiple magnification levels could increase sensitivity of the deep learning assay maintaining a high specificity.
Finally, a possible practical challenge in further validation and future integration of the DL methods in a clinical workflow is the current lack of regular installation of slide scanners in hospitals. However, in the United Kingdom and other countries, large academic consortia are currently implementing nation-wide digital pathology workflows. This trend can be expected to further accelerate and will be supported by clinically useful applications of deep learning technology, especially after regulatory approval of such tools34. Still, initially it is probably more realistic to establish central testing facilities that are equipped with slide scanners and further hardware needed for deep learning applications. In this setting smaller hospitals and medical centers would not be confronted with high fixed costs but only with expenses and work that come with the distribution of H&E glass slides to central testing facilities.
Context: multicenter validation of deep learning biomarkers
Recent years have seen a surge of deep learning methods in digital pathology, but previous large-scale studies are limited to simple image analysis tasks such as tumor detection35 and do not extend to scenarios of molecular biomarker detection. Smaller proof-of-concept studies have shown that deep learning can detect a range of molecular biomarkers directly from routine histology, including multiple clinically relevant oncogenes17–19. However, these classifiers were not validated in large multicenter cohorts and cannot be readily generalized beyond the training set. The present study is the first international collaborative effort to validate such a deep learning-based molecular biomarker. It identifies the need for very large series, training on a variety of sample types e.g. resection and biopsy and different populations. The high performance in this particular use case yields a tool of immediate clinical applicability and provides a blueprint for the emerging class of deep-learning-based molecular tests in oncology, with the potential to broadly improve workflows in precision oncology worldwide.
Supplementary Material
What you need to know.
Background and context:
Microsatellite instability (MSI) and mismatch-repair deficiency (dMMR) in colorectal tumors are used to select treatment for patients. Deep learning can detect MSI and dMMR in tumor samples on routine histology slides faster and cheaper than molecular assays.
New findings:
We developed a deep-learning system that detects colorectal tumor specimens with MSI using hematoxylin and eosin-stained slides; it detected tissues with MSI with an area under the receiver operating characteristic curve of 0.95 in a large, international validation cohort.
Limitations:
This system requires further validation before it can be used routinely in the clinic.
Impact:
This system might be used for high-throughput, low-cost evaluation of colorectal tissue specimens.
Acknowledgements
The authors are grateful to all investigators and contributing pathologists from the TCGA study (more information on http://portal.gdc.cancer.gov), the Rainbow-TMA consortium in the Netherlands (listed in Table S6), the DACHS consortium in Germany, the QUASAR consortium and the YCR-BCIP consortium in the United Kingdom. Collection and testing of the YCR-BCIP cases was funded by Yorkshire Cancer Research L386 and L394 as part of previous studies. PQ is an NIHR Senior Investigator.
Grant support / funding: This study was primarily funded by the authors’ academic institutions. These authors are supported by additional grants: P.B.: German Research Foundation (DFG; SFB/TRR57, SFB/TRR219, BO3755/3–1, and BO3755/6–1), the German Federal Ministry of Education and Research (BMBF: STOP-FSGS-01GM1901A) and the German Federal Ministry of Economic Affairs and Energy (BMWi: EMPAIA project). A.T.P.: NIH/NIDCR (#K08-DE026500), Institutional Research Grant (#IRG-16-222-56) from the American Cancer Society, Cancer Research Foundation Research Grant, and the University of Chicago Medicine Comprehensive Cancer Center Support Grant (#P30-CA14599). T.L.: Horizon 2020 through the European Research Council (ERC) Consolidator Grant PhaseControl (771083), a Mildred-Scheel-Endowed Professorship from the German Cancer Aid (Deutsche Krebshilfe), the German Research Foundation (DFG) (SFB CRC1382/P01, SFB-TRR57/P06, LU 1360/3–1), the Ernst-Jung-Foundation Hamburg and the IZKF (interdisciplinary center of clinical research) at RWTH Aachen. J.N.K.: RWTH University Aachen (START 201-691906).
Abbreviations:
- MSI
microsatellite instability
- dMMR
deficient mismatch repair
- pMMR
proficient mismatch repair
- CRC
colorectal cancer
- H&E
hematoxylin and eosin
- AUROC
area under the receiver operating curve
- AUPRC
area under the precision-recall curve
- LS
Lynch syndrome
Footnotes
Publisher's Disclaimer: This is a PDF file of an unedited manuscript that has been accepted for publication. As a service to our customers we are providing this early version of the manuscript. The manuscript will undergo copyediting, typesetting, and review of the resulting proof before it is published in its final form. Please note that during the production process errors may be discovered which could affect the content, and all legal disclaimers that apply to the journal pertain.
Disclosures: JNK has an informal, unpaid advisory role at Pathomix (Heidelberg, Germany) which does not relate to this research. JNK declares no other relationships or competing interests. All other authors declare no competing interests.
Transcript Profiling: Not applicable
Writing Assistance: Not applicable
References
- 1.Luchini C, Bibeau F, Ligtenberg MJL, et al. ESMO recommendations on microsatellite instability testing for immunotherapy in cancer, and its relationship with PD-1/PD-L1 expression and tumour mutational burden: a systematic review-based approach. Ann Oncol 2019;30:1232–1243. [DOI] [PubMed] [Google Scholar]
- 2.Kather JN, Halama N, Jaeger D. Genomics and emerging biomarkers for immunotherapy of colorectal cancer. Semin Cancer Biol 2018;52:189–197. [DOI] [PubMed] [Google Scholar]
- 3.Boland CR, Goel A. Microsatellite instability in colorectal cancer. Gastroenterology 2010;138:2073–2087.e3. [DOI] [PMC free article] [PubMed] [Google Scholar]
- 4.Anon. Molecular testing strategies for Lynch syndrome in people with colorectal cancer - NICE Guidance. Available at: https://www.nice.org.uk/guidance/dg27/chapter/1-Recommendations [Accessed November 13, 2019].
- 5.Stjepanovic N, Moreira L, Carneiro F, et al. Hereditary gastrointestinal cancers: ESMO Clinical Practice Guidelines for diagnosis, treatment and follow-up†. Ann Oncol 2019;30:1558–1571. [DOI] [PubMed] [Google Scholar]
- 6.Boland CR, Thibodeau SN, Hamilton SR, et al. A National Cancer Institute Workshop on Microsatellite Instability for cancer detection and familial predisposition: development of international criteria for the determination of microsatellite instability in colorectal cancer. Cancer Res 1998;58:5248–5257. [PubMed] [Google Scholar]
- 7.Kawakami H, Zaanan A, Sinicrope FA. Microsatellite instability testing and its role in the management of colorectal cancer. Curr Treat Options Oncol 2015;16:30. [DOI] [PMC free article] [PubMed] [Google Scholar]
- 8.Snowsill T, Coelho H, Huxley N, et al. Molecular testing for Lynch syndrome in people with colorectal cancer: systematic reviews and economic evaluation. Health Technol Assess 2017;21:1–238. [DOI] [PMC free article] [PubMed] [Google Scholar]
- 9.Evrard C, Tachon G, Randrian V, et al. Microsatellite Instability: Diagnosis, Heterogeneity, Discordance, and Clinical Impact in Colorectal Cancer. Cancers 2019;11 Available at: 10.3390/cancers11101567. [DOI] [PMC free article] [PubMed] [Google Scholar]
- 10.Anon. 4 Evidence | Molecular testing strategies for Lynch syndrome in people with colorectal cancer | Guidance | NICE. Available at: https://www.nice.org.uk/guidance/dg27/chapter/4-Evidence [Accessed April 30, 2020].
- 11.Poynter JN, Siegmund KD, Weisenberger DJ, et al. Molecular characterization of MSI-H colorectal cancer by MLHI promoter methylation, immunohistochemistry, and mismatch repair germline mutation screening. Cancer Epidemiol Biomarkers Prev 2008;17:3208–3215. [DOI] [PMC free article] [PubMed] [Google Scholar]
- 12.Barnetson RA, Tenesa A, Farrington SM, et al. Identification and survival of carriers of mutations in DNA mismatch-repair genes in colon cancer. N Engl J Med 2006;354:2751–2763. [DOI] [PubMed] [Google Scholar]
- 13.Limburg PJ, Harmsen WS, Chen HH, et al. Prevalence of alterations in DNA mismatch repair genes in patients with young-onset colorectal cancer. Clin Gastroenterol Hepatol 2011;9:497–502. [DOI] [PMC free article] [PubMed] [Google Scholar]
- 14.De Smedt L, Lemahieu J, Palmans S, et al. Microsatellite instable vs stable colon carcinomas: analysis of tumour heterogeneity, inflammation and angiogenesis. Br J Cancer 2015;113:500–509. [DOI] [PMC free article] [PubMed] [Google Scholar]
- 15.Greenson JK, Huang S-C, Herron C, et al. Pathologic predictors of microsatellite instability in colorectal cancer. Am J Surg Pathol 2009;33:126–133. [DOI] [PMC free article] [PubMed] [Google Scholar]
- 16.Kather JN, Pearson AT, Halama N, et al. Deep learning can predict microsatellite instability directly from histology in gastrointestinal cancer. Nat Med 2019;25:1054–1056. [DOI] [PMC free article] [PubMed] [Google Scholar]
- 17.Kather JN, Heij LR, Grabsch HI, et al. Pan-cancer image-based detection of clinically actionable genetic alterations. bioRxiv 2019:833756 Available at: https://www.biorxiv.org/content/10.1101/833756v1 [Accessed November 25, 2019]. [Google Scholar]
- 18.Fu Y, Jung AW, Torne RV, et al. Pan-cancer computational histopathology reveals mutations, tumor composition and prognosis. bioRxiv 2019:813543 Available at: https://www.biorxiv.org/content/10.1101/813543v1 [Accessed October 27, 2019]. [DOI] [PubMed] [Google Scholar]
- 19.Schmauch B, Romagnoni A, Pronier E, et al. Transcriptomic learning for digital pathology. bioRxiv 2019:760173 Available at: https://www.biorxiv.org/content/10.1101/760173v1 [Accessed September 11, 2019]. [Google Scholar]
- 20.Cancer Genome Atlas Network. Comprehensive molecular characterization of human colon and rectal cancer. Nature 2012;487:330–337. [DOI] [PMC free article] [PubMed] [Google Scholar]
- 21.Amitay EL, Carr PR, Jansen L, et al. Association of Aspirin and Nonsteroidal Anti-Inflammatory Drugs With Colorectal Cancer Risk by Molecular Subtypes. J Natl Cancer Inst 2019;111:475–483. [DOI] [PubMed] [Google Scholar]
- 22.Brenner H, Chang-Claude J, Seiler CM, et al. Does a negative screening colonoscopy ever need to be repeated? Gut 2006;55:1145–1150. [DOI] [PMC free article] [PubMed] [Google Scholar]
- 23.QUASAR Collaborative Group. Adjuvant chemotherapy versus observation in patients with colorectal cancer: a randomised study. Lancet 2007;370:2020–2029. [DOI] [PubMed] [Google Scholar]
- 24.van den Brandt PA. Molecular pathological epidemiology of lifestyle factors and colorectal and renal cell cancer risk. Maastricht Pathology 2018. 11th Joint Meeting of the British Division of the International Academy of Pathology and the Pathological Society of Great Britain & Ireland, 19–22 June 2018. J Pathol 2018;246 Suppl 1:S1–S46. [DOI] [PubMed] [Google Scholar]
- 25.van den Brandt PA, Goldbohm RA, Veer P van ‘t, et al. A large-scale prospective cohort study on diet and cancer in The Netherlands. J Clin Epidemiol 1990;43:285–295. [DOI] [PubMed] [Google Scholar]
- 26.Taylor J, Wright P, Rossington H, et al. Regional multidisciplinary team intervention programme to improve colorectal cancer outcomes: study protocol for the Yorkshire Cancer Research Bowel Cancer Improvement Programme (YCR BCIP). BMJ Open 2019;9:e030618. [DOI] [PMC free article] [PubMed] [Google Scholar]
- 27.Hoffmeister M, Bläker H, Kloor M, et al. Body mass index and microsatellite instability in colorectal cancer: a population-based study. Cancer Epidemiol Biomarkers Prev 2013;22:2303–2311. [DOI] [PubMed] [Google Scholar]
- 28.Bankhead P, Loughrey MB, Fernández JA, et al. QuPath: Open source software for digital pathology image analysis. Sci Rep 2017;7:16878. [DOI] [PMC free article] [PubMed] [Google Scholar]
- 29.Macenko M, Niethammer M, Marron JS, et al. A method for normalizing histology slides for quantitative analysis. In: 2009. IEEE International Symposium on Biomedical Imaging: From Nano to Macro.; 2009:1107–1110. [Google Scholar]
- 30.Kather JN, Krisam J, Charoentong P, et al. Predicting survival from colorectal cancer histology slides using deep learning: A retrospective multicenter study. PLoS Med 2019;16:e1002730. [DOI] [PMC free article] [PubMed] [Google Scholar]
- 31.Salem ME, Weinberg BA, Xiu J, et al. Comparative molecular analyses of left-sided colon, right-sided colon, and rectal cancers. Oncotarget 2017;8:86356–86368. [DOI] [PMC free article] [PubMed] [Google Scholar]
- 32.Lochhead P, Kuchiba A, Imamura Y, et al. Microsatellite instability and BRAF mutation testing in colorectal cancer prognostication. J Natl Cancer Inst 2013;105:1151–1156. [DOI] [PMC free article] [PubMed] [Google Scholar]
- 33.Kang Y-J, Killen J, Caruana M, et al. The predicted impact and cost-effectiveness of systematic testing of people with incident colorectal cancer for Lynch syndrome. Med J Aust 2020;212:72–81. [DOI] [PMC free article] [PubMed] [Google Scholar]
- 34.Anon. Paige. Available at: https://paige.ai/ [Accessed April 2, 2020]. [Google Scholar]
- 35.Campanella G, Hanna MG, Geneslaw L, et al. Clinical-grade computational pathology using weakly supervised deep learning on whole slide images. Nat Med 2019;25:1301–1309. [DOI] [PMC free article] [PubMed] [Google Scholar]
- 36.Liu Y, Sethi NS, Hinoue T, et al. Comparative Molecular Analysis of Gastrointestinal Adenocarcinomas. Cancer Cell 2018;33:721–735.e8. [DOI] [PMC free article] [PubMed] [Google Scholar]
Associated Data
This section collects any data citations, data availability statements, or supplementary materials included in this article.