

Abstract
Foxp3+ regulatory T (Treg) cells expressing the interleukin (IL)-33 receptor ST2 mediate tissue repair in response to IL-33. Whether Treg cells also respond to the alarmin IL-33 to regulate specific aspects of the immune response is not known. Here we describe an unexpected function of ST2+ Treg cells in suppressing the innate immune response in the lung to environmental allergens without altering the adaptive immune response. Following allergen exposure, ST2+ Treg cells were activated by IL-33 to suppress IL-17-producing γδ T cells. ST2 signaling in Treg cells induced Ebi3, a component of the heterodimeric cytokine IL-35 that was required for Treg cell-mediated suppression of γδ T cells. This response resulted in less eosinophil-attracting chemokines and reduced eosinophil recruitment into the lung, which was beneficial to the host in reducing inflammation induced by allergen. Thus, we define a fundamental role for ST2+ Treg cells in the lung as a negative regulator of the early innate γδ T cell response to mucosal injury.
Introduction
CD4+Foxp3+ regulatory T (Treg) cells protect the host from deleterious inflammation and promote tissue homeostasis and repair. Congenital deficiency or acute deletion of Foxp3 results in autoimmune responses to self-antigens, characterized by immune-mediated damage to mucosal organs, such as the lung and gut, and inflammation of the skin and endocrine organs1, 2. Treg cells also play a critical role in restraining immune responses to non-self antigens, such as to the commensal microbiota, allergens and pathogens, preventing over-exuberant immune responses and tissue injury3. More recently, Treg cells have also been shown to promote restoration of organ function after injury through production of the epidermal growth factor amphiregulin4, 5.
To accomplish these multiple roles in immune suppression and tissue repair, Foxp3+ Treg cells express a range of effector molecules and are phenotypically heterogeneous3, 6, 7. Indeed, Treg cells have been classified in many ways, including their intrathymic or extrathymic origin and their preference for homing to lymphoid or non-lymphoid tissues3, 8. Foxp3+ Treg cells have also been described to co-opt the canonical lineage defining transcription factors associated with CD4+ T helper 1 (TH1), TH2, TH17, and follicular helper (TFH) differentiation to impart functional and homing specificity matched to the ongoing immune response3, 9, 10, 11, 12, 13. Recently, a population of Treg cells that expresses the TH2-associated transcription factor GATA-3 and the interleukin (IL)-33 receptor Il1rl1 (ST2) has been identified in non-lymphoid tissues where they mediate tissue repair in response to IL-33 by producing amphiregulin4, 5, 14, 15.
IL-33 is a cytokine in the IL-1 family expressed in epithelial cells at barrier surfaces where it functions as an alarmin in response to tissue injury and inflammation16, 17. While initial studies focused on the role of IL-33 in promoting TH2 immunity by activating a wide range of immune cells involved in type 2 responses, such as mast cells, basophils, group 2 innate lymphoid cells (ILC2) and TH2 cells18, 19, it is now appreciated that IL-33 also promotes Treg cell-mediated tissue protection. IL-33 signaling in Treg cells during influenza virus infection induces the production of amphiregulin, which is critical for reducing lung damage and mediating repair without altering the antiviral immune response5. Following muscle injury, deletion of ST2 in Treg cells impairs their accumulation in the injured muscle and their ability to facilitate muscle regeneration14. Whether ST2 signaling in Treg cells is also important for Treg cell regulation of specific aspects of the immune response is not known. Since the IL-33–ST2 pathway promotes type 2 effector responses, we evaluated the role of ST2 in regulating Treg cell function during a type 2 immune response in murine models of allergic pulmonary inflammation. Here we describe an unexpected function of ST2+ Treg cells in suppressing the γδ T cell and innate immune response in the lung to environmental allergens without altering the adaptive immune response.
Results
ST2+ Treg cells expand in the lung after aeroallergen exposure.
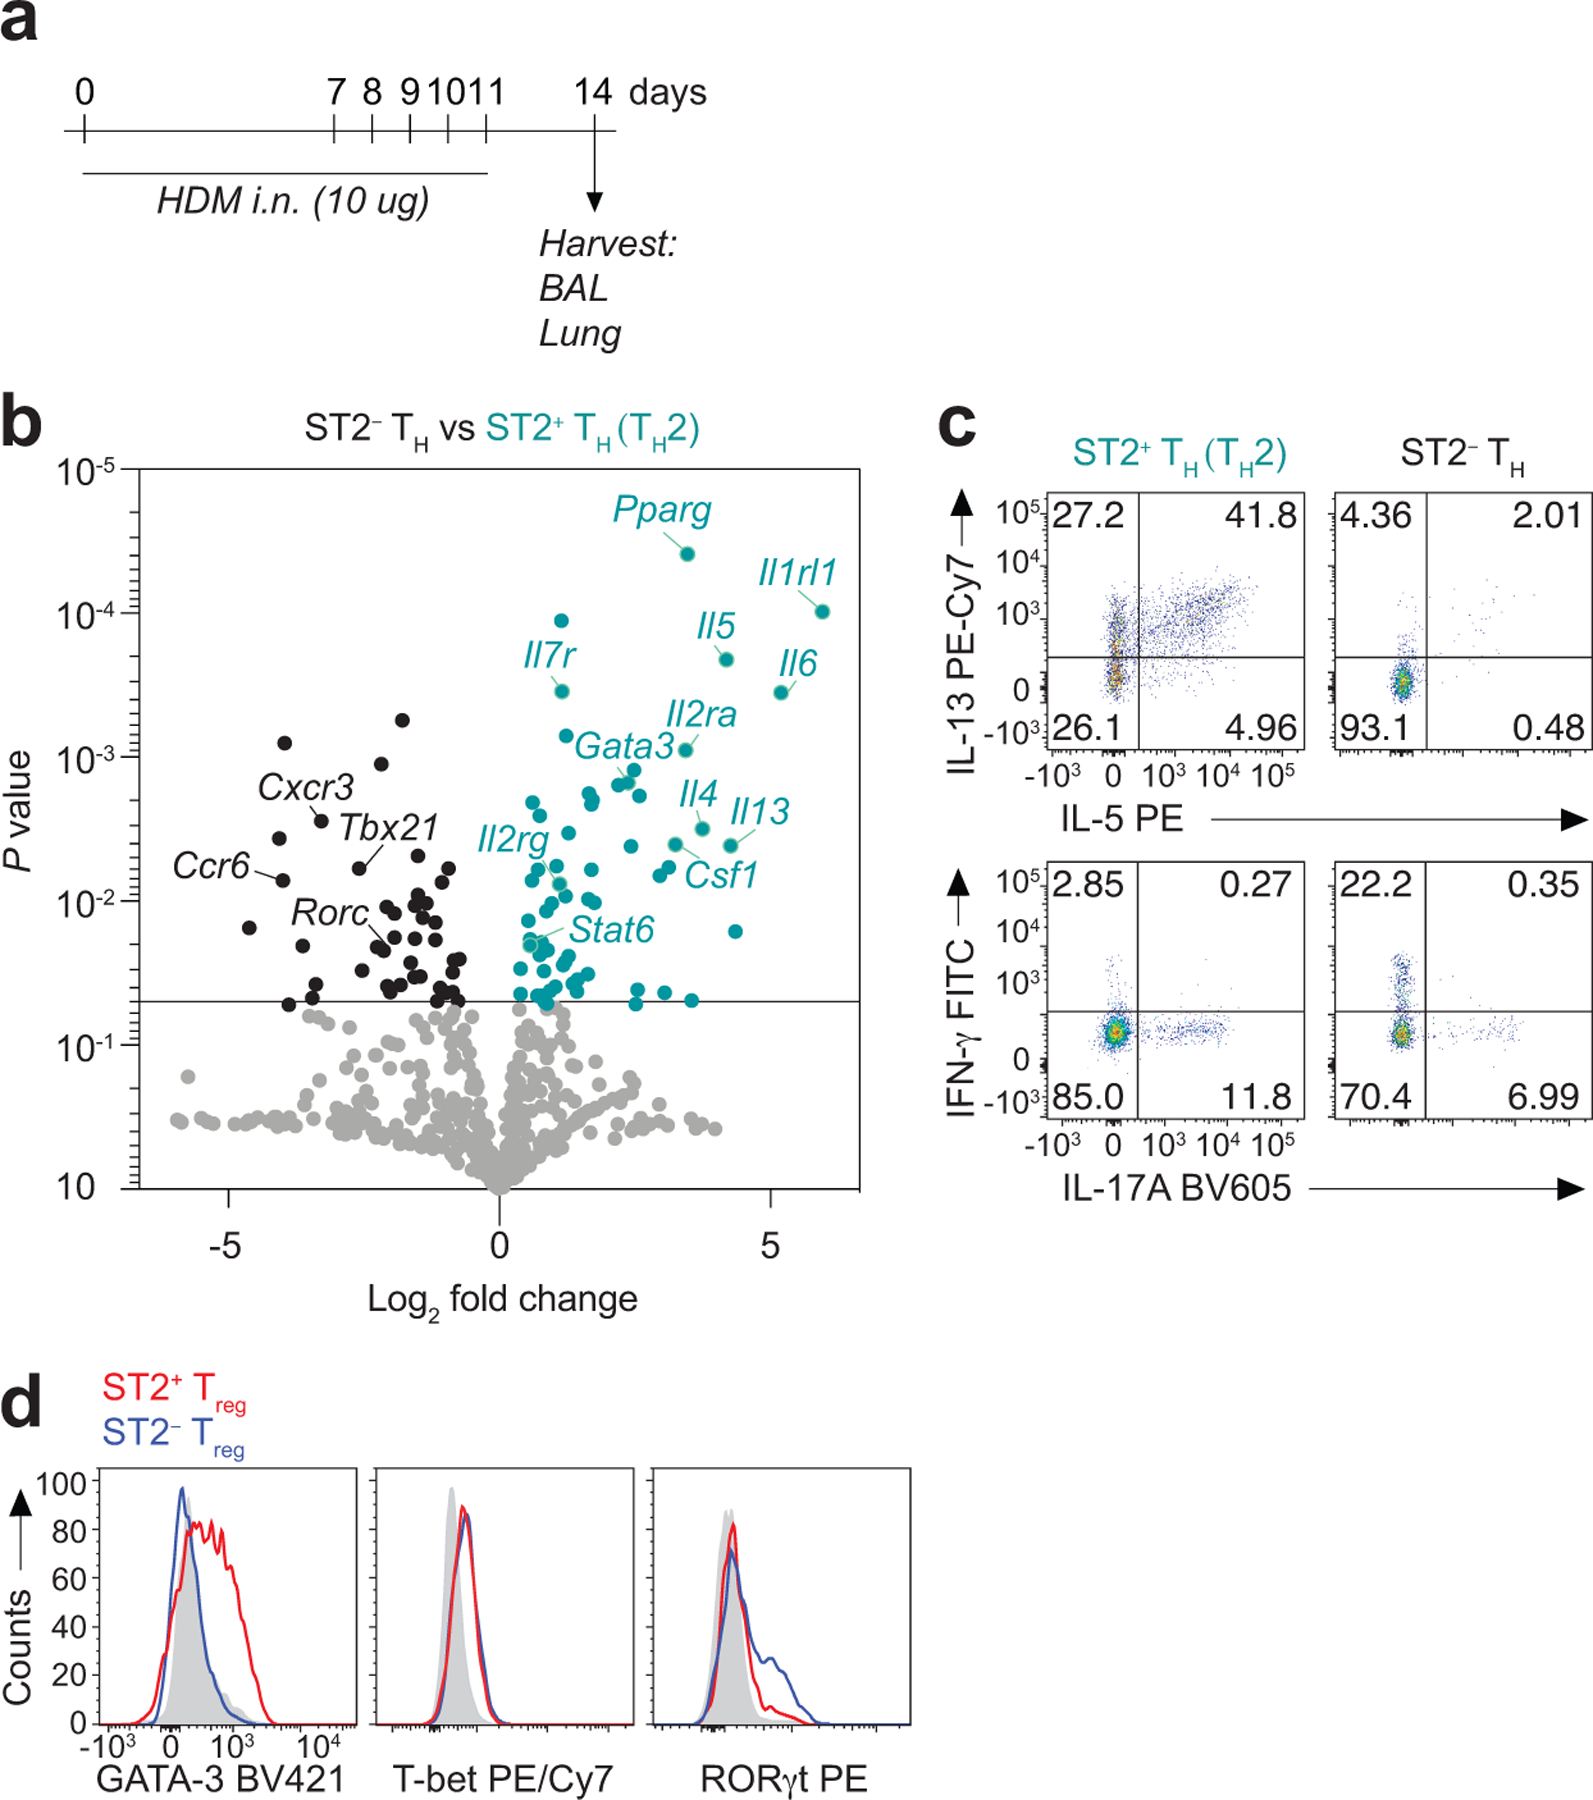
Environmental allergens induce the rapid release of endogenous danger signals from the airway epithelium, including the innate cytokine IL-3316, 20. Given that ST2 is expressed on Treg cells located in parenchymal tissues where they are poised to respond to mucosal injury5, 15, 21, we sought to determine whether ST2 signaling in Treg cells modulates their function and the outcome of type 2 immune responses. We used house dust mite (HDM)-induced allergic pulmonary inflammation as a model of type 2 immune response and respiratory mucosal injury. HDM extract was administered intranasally on days 0 and 7–11 and tissue was analyzed on day 14 (Extended Data Fig. 1a). To examine the tissue CD4+ T cell response to allergen, we used intravenous (i.v.) anti-CD45 antibody administration22 and bronchoalveolar lavage (BAL) to discriminate cells in the lung vascular (CD45 i.v. labeled cells) versus lung parenchyma (CD45 i.v. unlabeled cells) (Fig. 1a) and airways (BAL) of mice after HDM exposure. HDM induced a robust increase in ST2+Foxp3+ and ST2+Foxp3− CD4+ T cells in the lung parenchyma and airways compared with the lung vasculature (Fig. 1b,c). ST2+Foxp3−CD4+ T cells in the lung parenchyma and airways were TH2 cells as they highly expressed genes associated with terminally differentiated TH2 effector cells23, including the transcription factors Gata3 and Stat6, the surface receptors Il7r, Il1rl1, Il2rg, Il2ra, and the cytokines Il4, Il5, Il13, Il6 and Csf1, compared with ST2−Foxp3−CD4+ T cells (ST2− TH cells) (Extended Data Fig. 1b). ST2+Foxp3−CD4+ T cells (TH2 cells) also produced high amounts of IL-5 and IL-13 protein compared with ST2− TH cells (Extended Data Fig. 1c). In contrast, cells in the ST2− TH cell population highly expressed the TH1- and TH17-associated transcription factors Tbx21 and Rorc and the chemokine receptors Cxcr3 and Ccr6, and produced high levels of interferon-γ (IFN-γ) and similarly low amounts of IL-17A compared with TH2 cells (Extended Data Fig. 1b,c). Treg cells induced in the lung parenchyma and airways during HDM exposure also consisted of two distinct populations based on ST2 expression (Fig. 1b,c). ST2+ Treg cells in the lung expressed high levels of GATA-3, as previously reported for ST2+ Treg cells in other tissues15, 21, while ST2− Treg cells expressed higher levels of RORγt (Extended Data Fig. 1d). T-bet was not significantly expressed in either the ST2+ or ST2− Treg cell subsets (Extended Data Fig. 1d). Interestingly, while ST2− Treg cells accumulated in the lung and airways with similar kinetics of TH2 cells following HDM exposure with the most pronounced increase observed on day 14, ST2+ Treg cells began to accumulate earlier on day 10 in the lung and BAL (Fig. 1b,c). We also investigated the Treg cell response in the airways and peripheral blood of HDM or cat dander allergic human subjects following bronchoscopic segmental HDM or cat dander allergen challenge, respectively (Extended Data Fig. 2). Like in mice, aeroallergen exposure in allergic subjects induced an increase in ST2+ Treg cells in the airways but not in peripheral blood 24 h after bronchoscopic segmental allergen challenge (Fig. 1d,e). Thus, in both mice and humans, ST2+ Treg cells rapidly increased in the lung and airways but not in the blood after aeroallergen exposure, suggesting the signal for activation of ST2+ Treg cells is generated within the lung.
Figure 1. ST2+ Treg cells expand rapidly in the lung and airways of mice and humans after aeroallergen exposure.

a-d, Foxp3YFPcre mice were left untreated (Naive) or were treated with HDM i.n. on days 0 and 7–11 and analyzed on days 10 and/or 14. a, Gating strategy for flow cytometric analysis of CD4+ T cells in the lung vasculature that were labeled with anti-CD45 antibody given intravenously (CD45 i.v. labeled cells) or in the lung parenchyma (CD45 i.v. unlabeled cells). b,c, Representative flow cytometry for Foxp3 and ST2 in CD4+ T cells (b) and numbers of ST2+ Treg cells (red), ST2− Treg cells (blue) and TH2 (Foxp3−ST2+) cells (green) (c) in the lung vasculature, lung parenchyma, and bronchoalveolar lavage (BAL). Data represent one experiment (day 0 n = 3 mice; day 10 n = 4 mice; day 14 n = 4 mice) of two independent experiments in panels (b,c). Unpaired two-tailed t test with Holm-Sidak correction for multiple comparisons was used for statistical analysis in panel (c). P values between ST2+ and ST2− Treg cells are shown. d,e, HDM or cat dander allergic human subjects (n = 11) underwent bronchoscopic segmental allergen challenge (SAC) with HDM or cat dander, respectively, and BAL and blood were collected before (Pre-SAC) and 24 h after segmental allergen (Post-SAC) or diluent (Post-Diluent) challenge. d, Representative flow cytometry for Foxp3 and ST2 in CD4+ T cells (left) and percentage of ST2+ Treg cells (right) from BAL (orange) and blood (black) pre- and post-SAC. Each symbol represents one subject. Repeated measures (RM) two-way ANOVA with Sidak’s multiple comparisons test was used for statistical analysis. e, Number of ST2+ Treg cells recovered from pre-SAC, Post-Diluent and Post-SAC BAL. Each symbol represents one subject. RM one-way ANOVA with Tukey’s multiple comparisons test was used for statistical analysis. Error bars denote mean ± s.d. P values are indicated in the figure.
ST2+ Treg cells respond to IL-33 but not directly to allergen.
To determine whether ST2+ Treg cells were responding to HDM-specific T cell antigen receptor (TCR) signaling, we utilized the MHC class II I-Ab:Der p 1117–127 (I-A(b):Derp1) tetramer specific for the immunodominant CD4+ T cell epitope of HDM24. We did not detect HDM-specific ST2+ Treg cells but did find a population of ST2− Treg cells as well as TH2 and ST2− TH cells in the lung that were positive for the HDM-specific tetramer (Fig. 2a). We then utilized parabiosis experiments to examine whether allergen priming was required for ST2+ Treg cell expansion in the lung in response to HDM challenge. In these experiments, CD45.2+ mice were treated with HDM and rested for 3–4 weeks to generate a memory response. HDM-treated CD45.2+ mice (memory parabiont) were then conjoined with congenic CD45.1+ naive mice (naive parabiont) and rested for 4–5 weeks to establish a shared circulation. Forty-eight to seventy-two hours after a single intranasal administration of HDM to both mice of the parabiotic pair, we found an equal frequency of ST2+ Treg cells derived from naive (CD45.1) and memory (CD45.2) mice within the lung parenchyma of both parabionts (Fig. 2b). In contrast, lung TH2 cells originated overwhelmingly from the memory parabiont (CD45.2), and predominantly accumulated in the lungs of the memory parabionts after HDM challenge (Fig. 2b). These data suggest that the ST2+ Treg cell response within the lung parenchyma following HDM exposure did not require prior exposure to this allergen, whereas HDM memory was required for rapid expansion of TH2 cells. These conclusions are consistent with our findings using the HDM-specific tetramer that suggested that unlike TH2 cells, ST2+ Treg cells were responding to stimuli other than HDM antigens.
Figure 2. ST2+ Treg cells respond to IL-33 but not directly to allergen peptide.
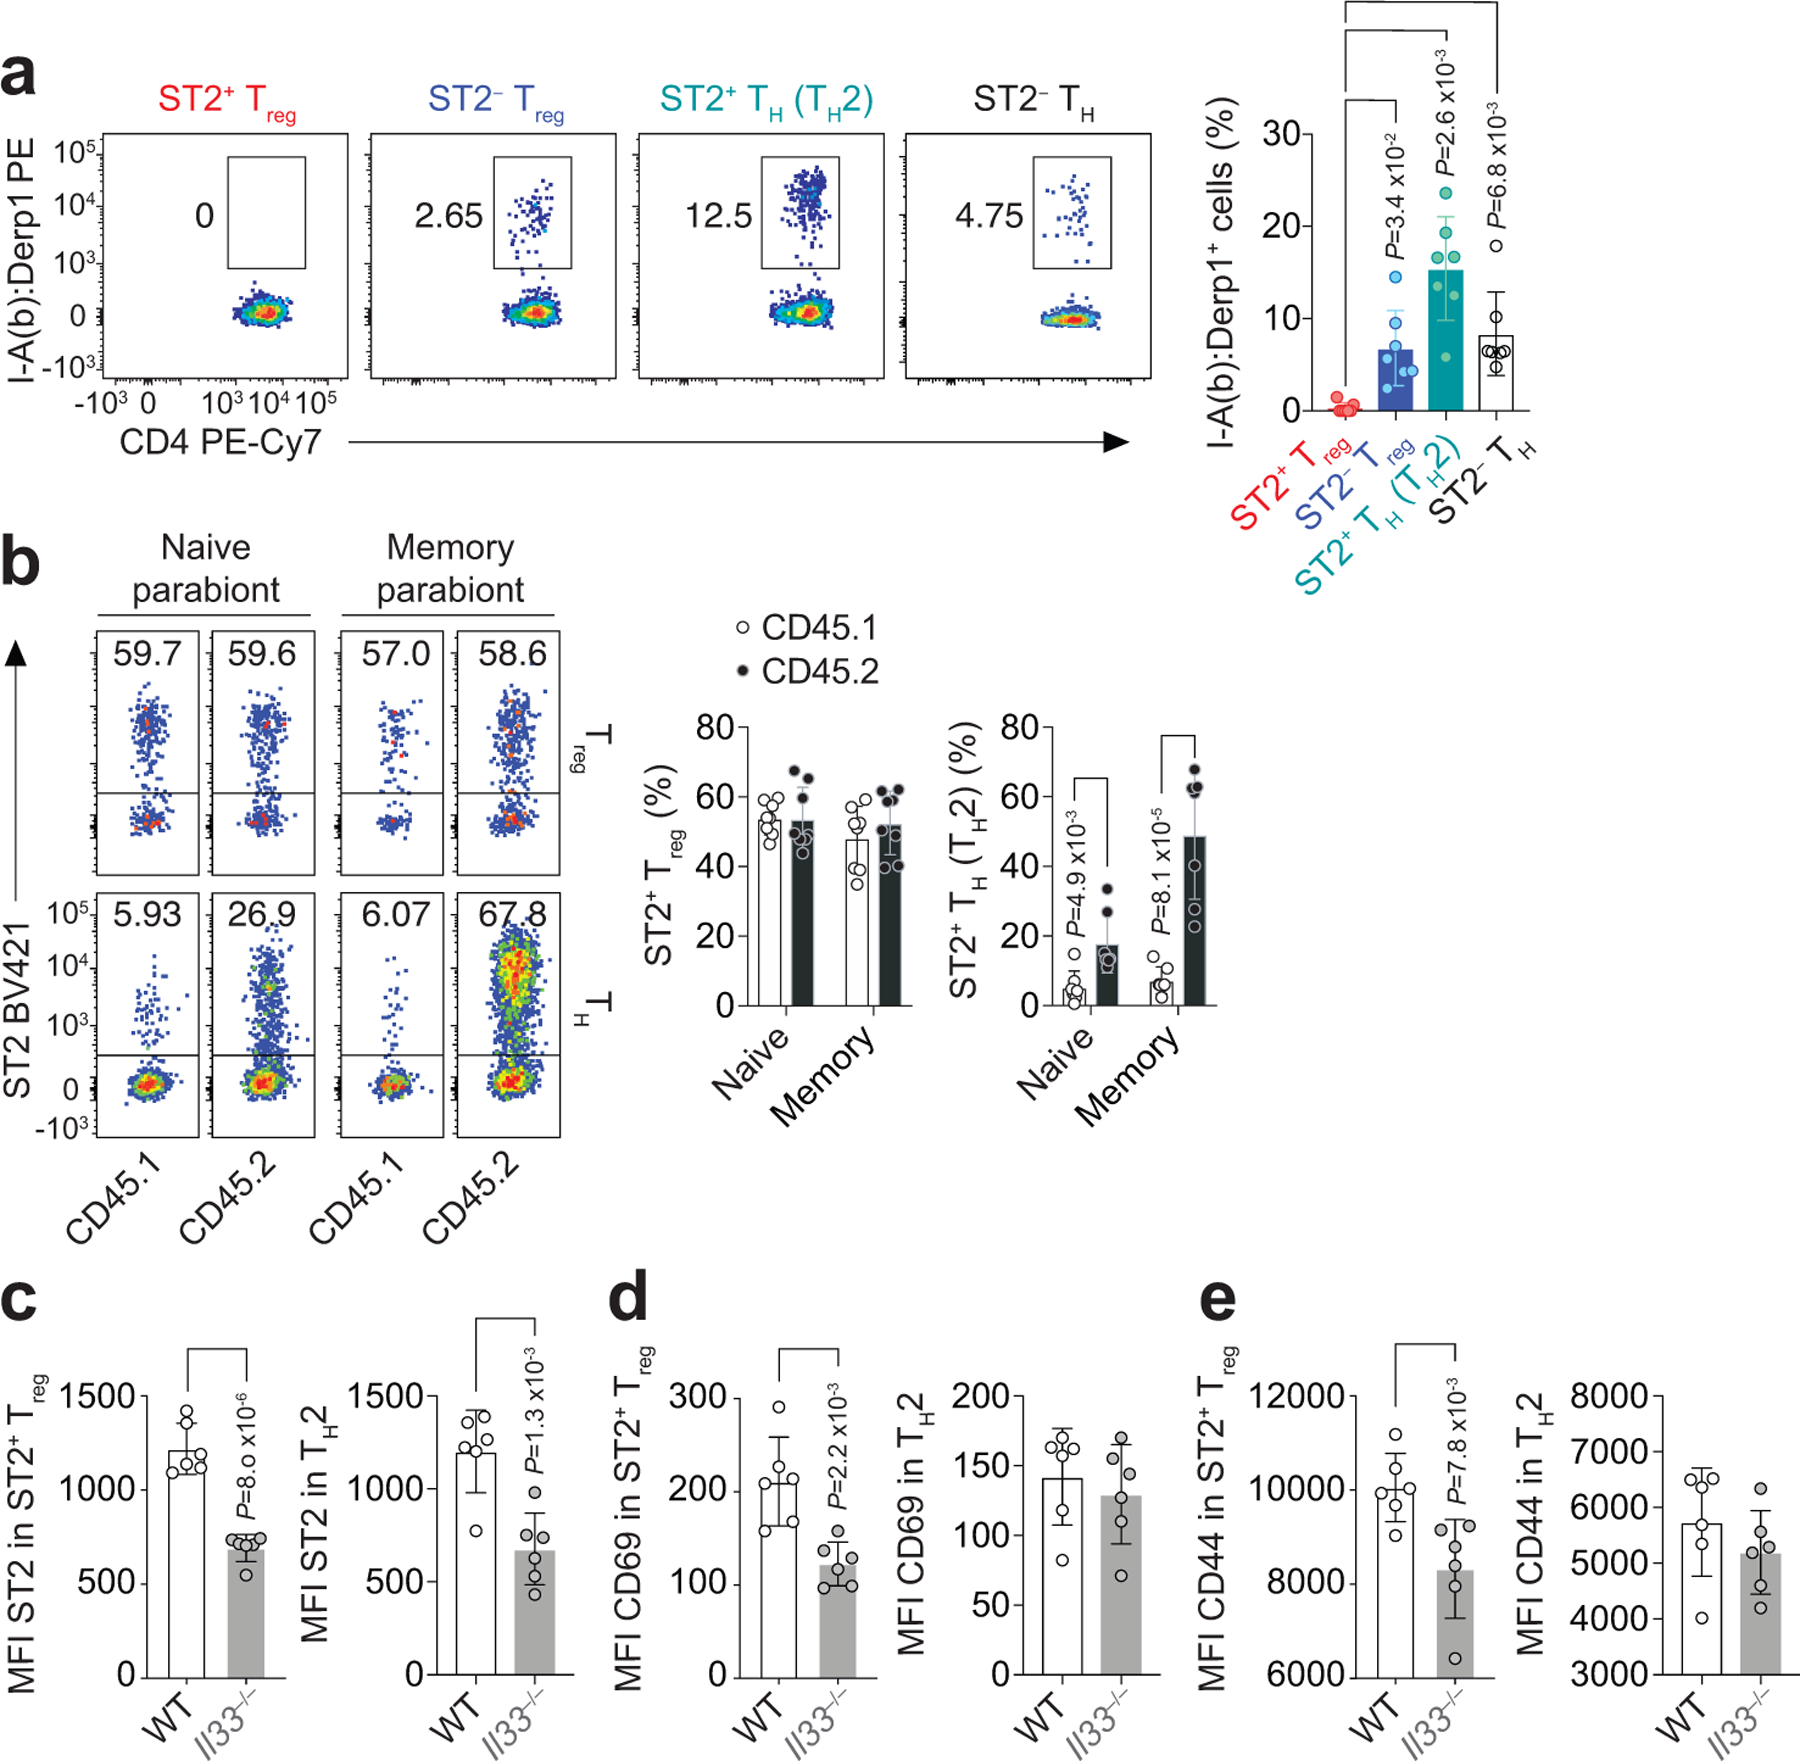
a, Foxp3YFPcre mice were treated with HDM i.n. on days 0 and 7–11 and analyzed on day 14. Representative flow cytometry for MHC class II I-Ab:Der p 1117–127 (I-A(b):Derp1) tetramer (left) and percentage of tetramer-specific CD4+ T cell populations (right) from lungs after tetramer-based cell enrichment. Data pooled from seven independent experiments. Each symbol represents a pool of n = 2 mice per experiment. Ordinary one-way ANOVA with Tukey’s multiple comparisons test was used for statistical analysis in panel (a, right). b, Representative flow cytometry for ST2 on CD45.1 and CD45.2 CD4+Foxp3+ (Treg) and CD4+Foxp3− (TH) cells in the lung parenchyma (left) and percentage of lung ST2+ Treg cells and ST2+Foxp3− (TH2) cells over total CD4+Foxp3+ Treg and CD4+Foxp3− TH cells, respectively (right). Data pooled from three independent experiments (n = 8 parabiontic pairs from the three experiments). Each symbol represents one mouse. Unpaired two-tailed t test with Holm-Sidak correction for multiple comparisons was used for statistical analysis in panel (b, right). c-e, Wild-type (WT) and Il33−/− mice were treated with HDM i.n. on days 0 and 7–11 and analyzed on day 10. Mean fluorescence intensity (MFI) of ST2 (c), CD69 (d), and CD44 (e) on ST2+ Treg and TH2 cells isolated from lung parenchyma. Data represent one experiment with n = 6 mice per group of two independent experiments in panels (c-e). Unpaired two-tailed t test was used for statistical analysis in panels (c-e). Error bars denote mean ± s.d. P values are indicated in the figure.
To address whether ST2+ Treg cells were responding to IL-33 during HDM exposure, we exposed wild-type and IL-33-deficient (Il33−/−) mice to HDM and compared the ST2+ Treg and TH2 cell response in the lung parenchyma three days after initiating HDM challenges (on day 10), when the number of ST2+ Treg cells began to increase substantially in the lungs. At this time point, Il33−/− mice had reduced percentages of ST2+ Treg and TH2 cells in the lungs compared to wild-type mice (Extended Data Fig. 3a,b). We also observed less ST2 on the surface of both ST2+ Treg and TH2 cell populations isolated from the lungs of Il33−/− mice compared with wild-type mice (Fig. 2c and Extended Data Fig. 3c), consistent with an IL-33–ST2 positive feedback loop as has been previously described25. Notably, ST2+ Treg but not TH2 cells from Il33−/− mice had diminished expression of CD69 and CD44 compared with wild-type mice on day 10 after HDM challenges (Fig. 2d,e and Extended Data Fig. 3c), indicating impaired activation of ST2+ Treg cells but not TH2 cells in the lung in the absence of IL-33. This observation is consistent with our finding that TH2 cells recognize allergen peptides but ST2+ Treg cells do not.
Treg cell-specific deletion of ST2 increases γδ T cells in the lung in response to HDM.
To directly assess the role of IL-33 signaling in Treg cells in vivo, we crossed Il1rl1fl/fl mice with Foxp3YFPcre mice to conditionally delete ST2 from Treg cells (Il1rl1fl/flFoxp3YFPcre). Il1rl1fl/flFoxp3YFPcre mice had no alteration in the percentage of Foxp3+ Treg cells, CD8+ or CD4+ T cells in the thymus or peripheral lymphoid organs and had no changes in CD4+ T cell activation measured by levels of CD44 and CD62L compared with Il1rl1fl/+Foxp3YFPcre and Il1rl1+/+Foxp3YFPcre (Foxp3YFPcre) littermate control mice (Extended Data Fig. 4a–c). As expected, Treg cells did not express ST2 in Il1rl1fl/flFoxp3YFPcre mice while TH2 cells did, indicating no leakiness of Foxp3-Cre mediated deletion in non-Treg cells (Fig. 3a). Intriguingly, selective ablation of ST2 in Treg cells did not result in significant reduction in total Treg cell numbers in the lung at baseline or in response to HDM (Fig. 3a,b). We also did not detect any significant difference in the numbers of TH2 cells or the percentages of IL-5, IL-13, IFN-γ or IL-17A producing CD4+ TH cells in the lung between Il1rl1fl/flFoxp3YFPcre mice and Foxp3YFPcre littermates before or after HDM exposure (Fig. 3a,c,d and Extended Data Fig. 5a,b), indicating that overall TH cell activation was unaffected by the lack of ST2 signaling in Treg cells.
Figure 3. Treg cell-specific deletion of ST2 increases γδ T cells in the lung in response to HDM.
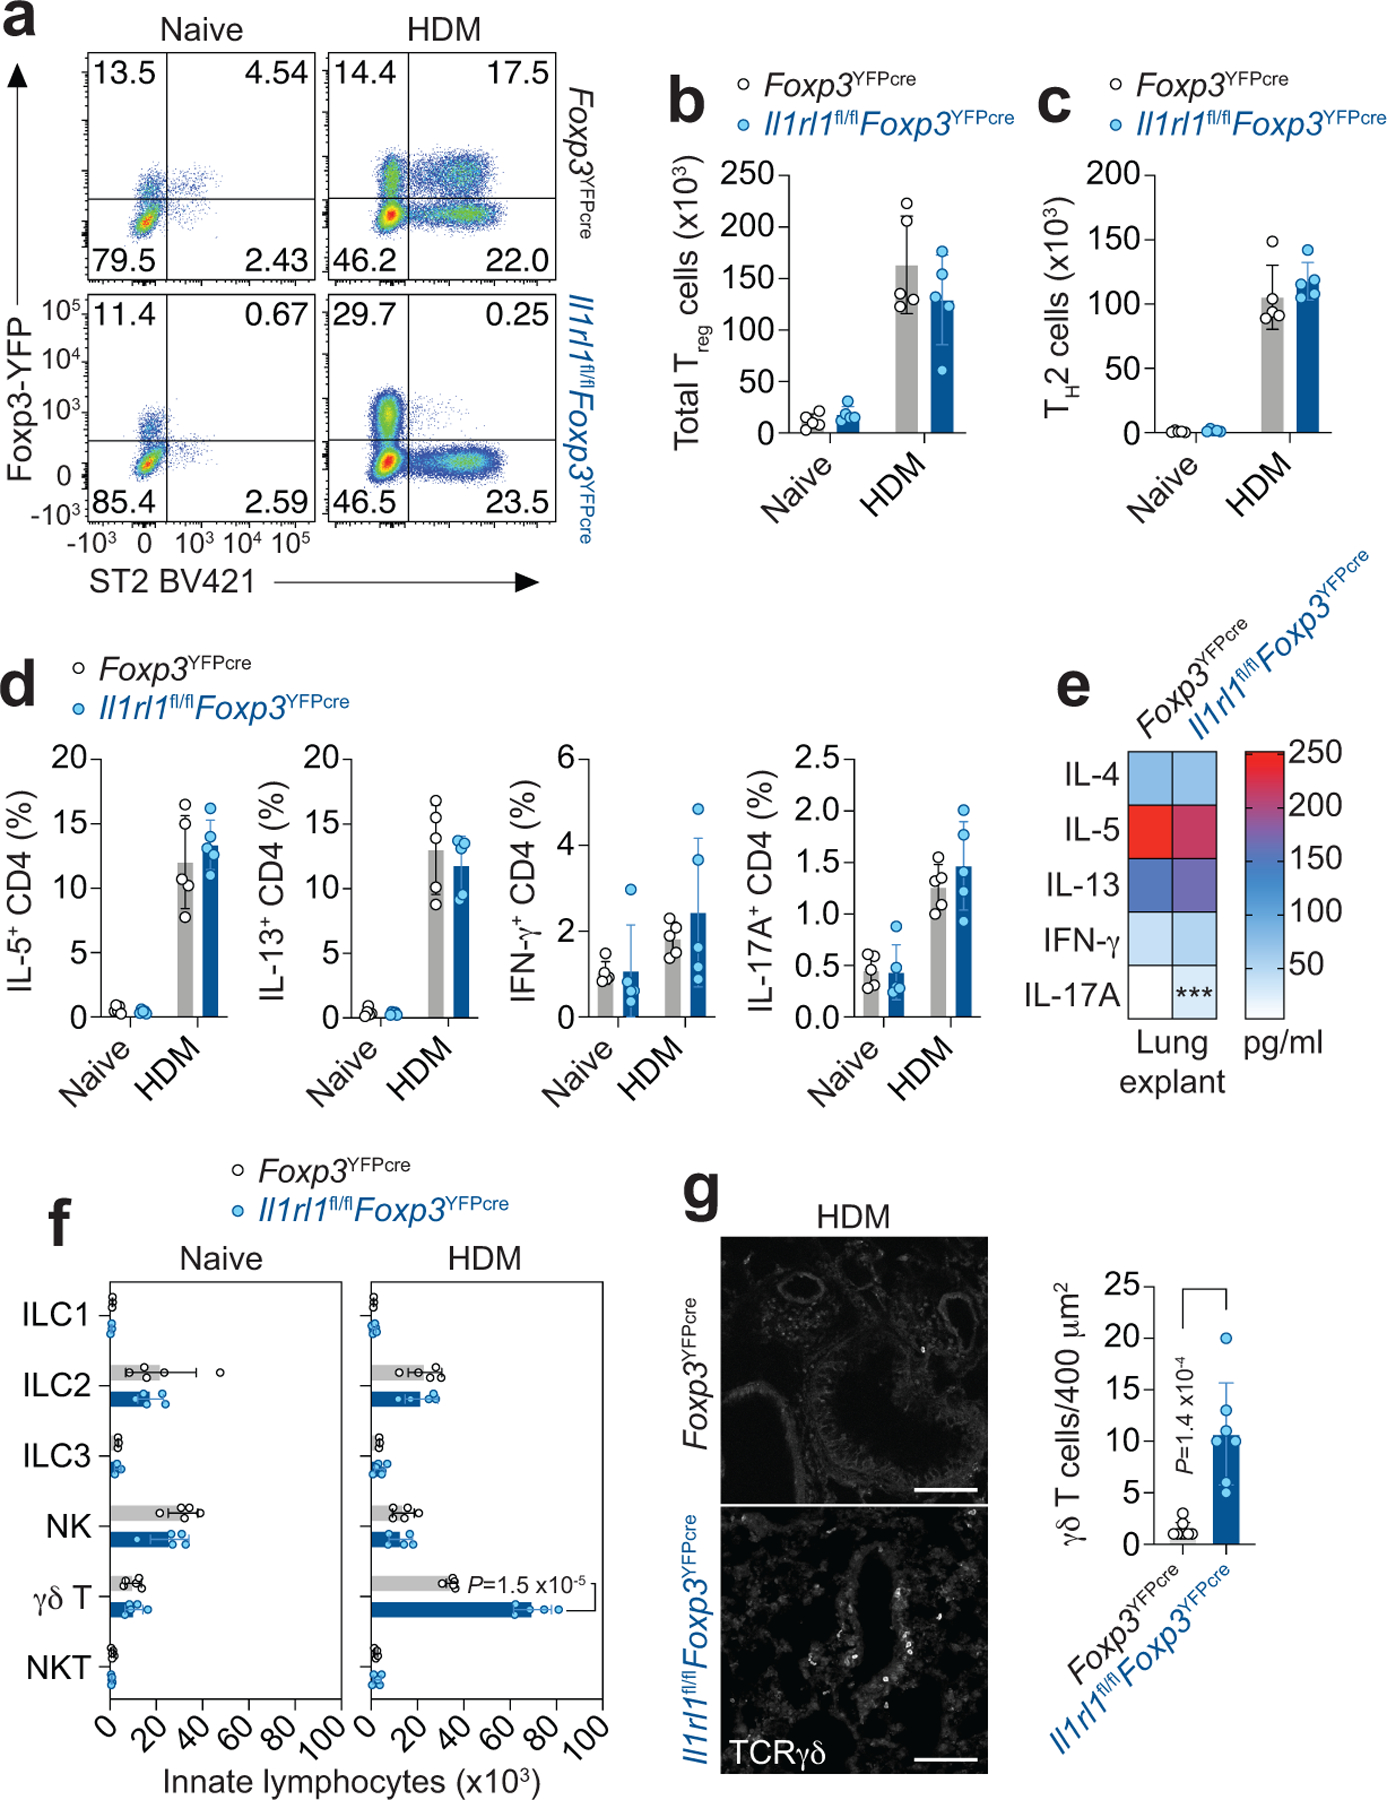
a-g, Il1rl1fl/flFoxp3YFPcre mice and Foxp3YFPcre littermate controls were left untreated (Naive) or were treated with HDM i.n. on days 0 and 7–11 and analyzed on day 14. a, Representative flow cytometry for Foxp3 and ST2 in CD4+ T cells from lung parenchyma. b,c, Number of total Treg (b) and TH2 (Foxp3−ST2+) cells (c) in the indicated groups. d, Percentage of lung CD4+Foxp3− T helper (TH) cells expressing IL-5, IL-13, IFN-γ, or IL-17A. Data represent one experiment with n = 5 mice per group of two independent experiments in panels (b-d). Unpaired two-tailed t test with Holm-Sidak correction for multiple comparisons was used for statistical analysis in panels (b-d). No statistical difference was found. e, Lung explants from HDM-treated mice were re-stimulated ex vivo with HDM and the indicated cytokines measured in culture supernatants 72 h later by ELISA. Data are presented as heatmap from one experiment with n = 4 mice per group of two independent experiments. Unpaired two-tailed t test was used for statistical analysis. *** P = 0.000897. f, Number of different innate lymphocytes in the lung parenchyma. Data represent one experiment with n = 5 mice per group of three independent experiments. Unpaired two-tailed t test with Holm-Sidak correction for multiple comparisons was used for statistical analysis. g, Representative confocal microscopy images of γδ T cells identified with an anti-TCRγδ mAb (left), and quantification of total γδ T cells/400 μm2 area (right) in lung sections from three HDM-treated Il1rl1fl/flFoxp3YFPcre mice (n = 7 lung sections) and three HDM-treated Foxp3YFPcre littermate controls (n = 8 lung sections). Each symbol represents the analysis of one lung section. Scale bars, 100 μm. Unpaired two-tailed t test was used for statistical analysis in panel (g, right). Error bars denote mean ± s.d. P values are indicated in the figure or otherwise indicated in the legend.
To further investigate the immune response in the lung to HDM, we examined the release of inflammatory cytokines in lung explant cultures isolated from naive and HDM-treated Il1rl1fl/flFoxp3YFPcre and Foxp3YFPcre mice upon ex vivo HDM stimulation (Fig. 3e and Extended Data Fig. 5c). Despite similar induction of type 2 cytokines and IFN-γ in lung explant cultures isolated from HDM-treated Il1rl1fl/flFoxp3YFPcre and Foxp3YFPcre mice compared with naive counterparts, IL-17A release was increased only in lung explant cultures isolated from HDM-treated Il1rl1fl/flFoxp3YFPcre mice (Fig. 3e and Extended Data Fig. 5c). We then explored the lung innate lymphocyte compartment of naive and HDM-treated Il1rl1fl/flFoxp3YFPcre and Foxp3YFPcre mice to identify the source of increased IL-17A (Extended Data Fig. 6a). There was no difference in ILC1, ILC2, ILC3, natural killer (NK), NKT or γδ T cells in the lung parenchyma between Il1rl1fl/flFoxp3YFPcre and Foxp3YFPcre littermate control mice at baseline (Fig. 3f and Extended Data Fig. 6b–g). However, Il1rl1fl/flFoxp3YFPcre mice had a very specific and marked increase in γδ T cells in the lung parenchyma after HDM exposure compared with Foxp3YFPcre littermate control mice with no change in other innate lymphocytes analyzed (Fig. 3f), which was most apparent around the airways (Fig. 3g). These data indicate γδ T cells as the source of increased IL-17A seen in the lungs of HDM-treated Il1rl1fl/flFoxp3YFPcre mice.
IL-33–ST2 signaling in Treg cells restrains γδ T cell activation and function.
Treg and γδ T cells were localized in the peribronchovascular region of the lung in both Il1rl1fl/flFoxp3YFPcre and Foxp3YFPcre littermate control mice after HDM exposure (Fig. 4a). However, Treg cells in the lungs of Foxp3YFPcre mice were in closer proximity to γδ T cells compared to Il1rl1fl/flFoxp3YFPcre mice (Fig. 4b). Indeed, we found a higher proportion of Treg cells within 25 μm of γδ T cells in the lungs of Foxp3YFPcre mice while in the lungs of Il1rl1fl/flFoxp3YFPcre mice, a higher proportion of Treg cells was found at a distance greater than 100 μm from γδ T cells (Fig. 4c). Interestingly, γδ T cells in the lung of Il1rl1fl/flFoxp3YFPcre mice displayed a more highly activated phenotype after HDM exposure characterized by increased cell surface expression of CD69 and inducible T-cell costimulator (ICOS) (Fig. 4d), and increased intracellular IL-17A staining (Fig. 4e,f). IL-33-deficient mice or IL-33 blockade in wild-type mice also led to increased γδ T cell activation and increased numbers of IL-17A-producing γδ T cells in the lungs on day 10 following HDM exposure (Fig. 4g–n). Thus, these data revealed an essential role of IL-33–ST2 signaling in Treg cells in restraining γδ T cell IL-17 response in the lung.
Figure 4. IL-33–ST2 signaling in Treg cells restrains γδ T cell activation and function.

a-f, Il1rl1fl/flFoxp3YFPcre mice and Foxp3YFPcre littermate controls were left untreated (Naive) or were treated with HDM i.n. on days 0 and 7–11 and analyzed on day 14. a, Representative images of lung sections stained for CD4 (red), YFP (Foxp3, green) and TCRγδ (blue). Data are representative images of lungs from three HDM-treated mice of each strain. White arrowhead indicates the Treg – γδ T cell interaction. Scale bars, 100 μm. b, Quantification of the distance between each Treg and γδ T cells (Treg – γδ T cell interaction for Foxp3YFPcre n = 101 and for Il1rl1fl/flFoxp3YFPcre n = 475) in eight different lung sections analyzed from three HDM-treated mice of each strain. Unpaired two-tailed t test was used for statistical analysis. c, Percentage of Treg cells within the indicated distance (μm) of each γδ T cell. Each symbol represents pooled data from analysis of one lung section (n = 8 lung sections) from three HDM-treated mice of each strain. Unpaired two-tailed t test with Holm-Sidak correction for multiple comparisons was used for statistical analysis. d, Representative histograms showing CD69 and ICOS expression on CD3+TCRγδ+ (γδ T) cells from the lung parenchyma of Foxp3YFPcre (black) or Il1rl1fl/flFoxp3YFPcre mice (blue). Isotype control is shown in gray. Numbers within histogram are mean ± s.d. of fluorescence intensity (MFI) for each markers of the indicated strain. Data represent one experiment with n = 3 mice per group of two independent experiments. Unpaired two-tailed t test was used for statistical analysis. **P=0.0018 and ***P=0.00012. e,f, Representative flow cytometry for IL-17A and IFN-γ in γδ T cells (e) and numbers of IL-17A+ γδ T cells (f) from the lung parenchyma. Data represent one experiment with n = 5 mice per group of three independent experiments in panels (e,f). Unpaired two-tailed t test with Holm-Sidak correction for multiple comparisons was used for statistical analysis in panel (f). g-j, WT and Il33−/− mice were treated with HDM i.n. on days 0 and 7–9 and analyzed on day 10. g,h, Representative histogram (g) and MFI (h) of CD69 expression in lung γδ T cells. i,j, Representative flow cytometry for IL-17A and IFN-γ in γδ T cells (i) and number of IL-17A+ γδ T cells (j) from lung parenchyma. Data represent one experiment with n = 6 mice per group of two independent experiments in panels (g-j). Unpaired two-tailed t test was used for statistical analysis in panels (h,j). k-n, HDM-exposed Foxp3YFPcre mice were treated daily with soluble ST2 IgG-Fc fusion protein (sST2-Fc) to block IL-33 signaling or isotype control (IgG2a) i.v. during the allergen challenges (day 7–9) and analyzed on day 10. k,l, Representative histogram (k) and MFI (l) of CD69 expression in lung γδ T cells. m,n, Representative flow cytometry for IL-17A and IFN-γ in γδ T cells (m) and number of IL-17A+ γδ T cells (n) from lung parenchyma. Data represent one experiment with n = 5 mice per group of two independent experiments in panels (k-n). Unpaired two-tailed t test was used for statistical analysis in panels (l,n). Error bars denote mean ± s.d. P values are indicated in the figure or otherwise indicated in the legend.
γδ T cells mediate exacerbated allergic pulmonary inflammation.
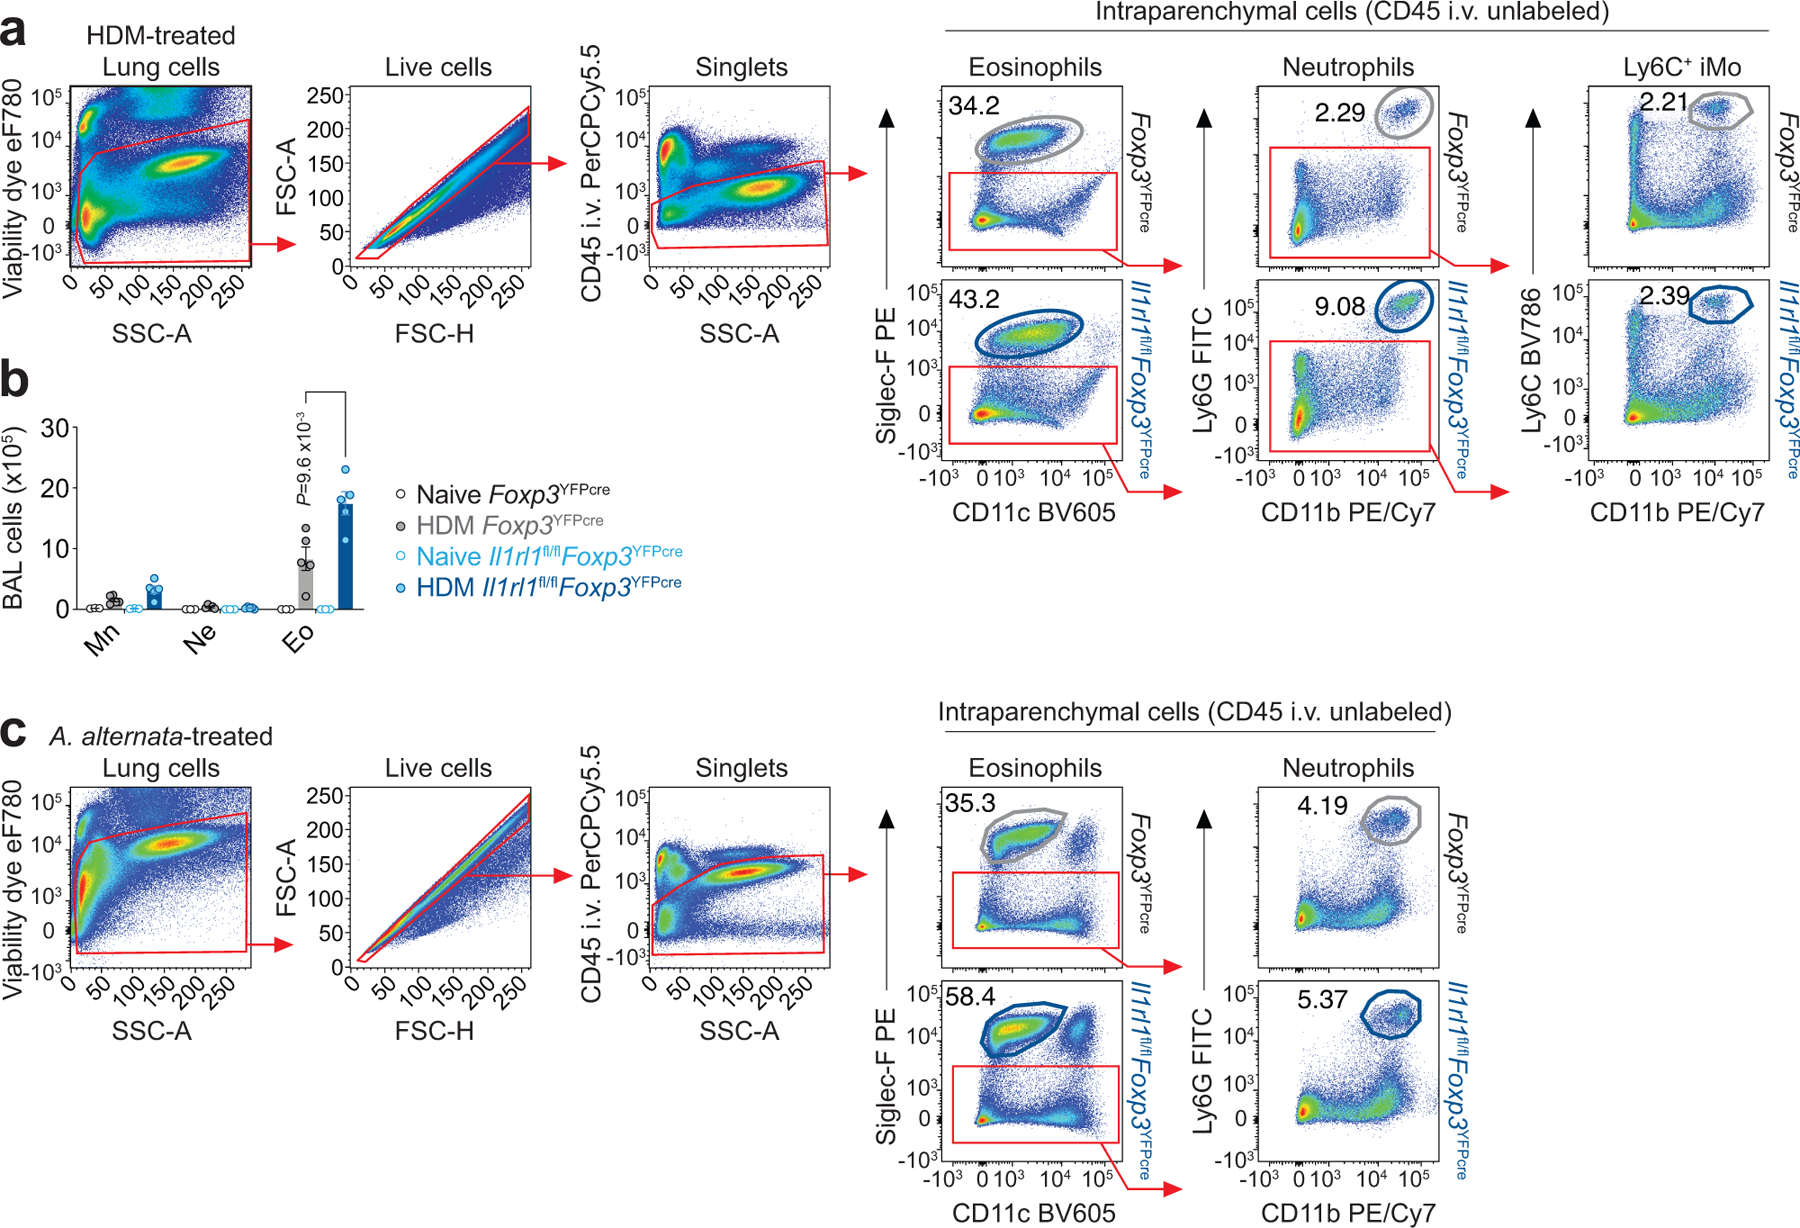
To determine whether the lack of ST2 signaling in Treg cells affects lung inflammation, we evaluated lung pathology and inflammatory cell infiltrates in the lung parenchyma and airways of naive and HDM-treated Il1rl1fl/flFoxp3YFPcre and Foxp3YFPcre littermate control mice. Treg cell-specific deletion of ST2 did not lead to spontaneous lung inflammation as measured by lung histopathology or number of leukocytes recovered from the lung (Fig. 5a,b,d). However, following HDM exposure, there was a marked increase in lung inflammation in Il1rl1fl/flFoxp3YFPcre mice compared with Foxp3YFPcre littermate controls (Fig 5a,b). The increased lung inflammation seen in Il1rl1fl/flFoxp3YFPcre mice was predominantly due to an influx of eosinophils and a smaller influx of neutrophils but not Ly6C+ inflammatory monocytes into the lung parenchyma (Fig. 5d and Extended Data Fig. 7a) and an influx of eosinophils into the airways (Extended Data Fig. 7b). Interestingly, despite increased lung inflammation, Periodic Acid-Schiff (PAS) staining of mucus production by goblet cells in the airway epithelium and lung mucin-5AC (Muc5ac) mRNA expression, which are both induced by IL-1326, were unaffected in Il1rl1fl/flFoxp3YFPcre mice (Fig. 5a,c).
Figure 5. γδ T cells mediate exacerbated allergic pulmonary inflammation in mice lacking ST2 in Treg cells.

a-g, Mouse strains indicated in different colors were left untreated (Naive) or were treated with HDM i.n. on days 0 and 7–11 and analyzed on day 14. a, Histopathology of lung sections stained for H&E and periodic acid-Schiff (PAS). Scale bars, 100 μm. b, Inflammation score. c, Mucus score (left) and RT-qPCR analysis of Muc5ac mRNA levels relative to β2 microglobulin (β2M) in total lung (right). Data represent one experiment with n = 5 mice per group in panels (a,b,c left) and one experiment (Foxp3YFPcre Naive n = 4; Foxp3YFPcre HDM n = 6; Il1rl1fl/flFoxp3YFPcre Naive n = 3; Il1rl1fl/flFoxp3YFPcre HDM n = 6) in panel (c right) of two independent experiments. d, Number of eosinophils (CD11c−Siglec-F+), neutrophils (Siglec-F−CD11b+Ly6G+) and Ly6C+ inflammatory monocytes (Siglec-F−CD11b+Ly6C+) in lung parenchyma. Data represent one experiment with n = 5 mice per group of three independent experiments. Unpaired two-tailed t test with Holm-Sidak correction for multiple comparisons was used for statistical analysis in panels (b-d). e, Representative flow cytometry for CD4 and TCRγδ in CD3+ T cells from lung parenchyma of HDM-treated mice. f, Number of γδ T cells from lung parenchyma of HDM-treated mice. g, Number of eosinophils and neutrophils in lung parenchyma. Data pooled from three independent experiments (Foxp3YFPcre n = 11; Il1rl1fl/flFoxp3YFPcre n = 12; Il1rl1fl/flFoxp3YFPcreTcrd−/− n = 11 mice from the three experiments) in panels (f,g). Ordinary one-way ANOVA with Tukey’s multiple comparisons test was used for statistical analysis in panels (f,g). h-k, Il1rl1fl/flFoxp3YFPcre mice and Foxp3YFPcre littermate controls were treated with A. alternata i.n. on days 0, 1 and 17–19 and analyzed on day 20. h, Representative flow cytometry for CD4 and TCRγδ in CD3+ T cells (top) and for IL-17A and IFN-γ in γδ T cells (bottom) from lung parenchyma. i, Number of lung IL-17A+ γδ T cells. j, Representative histogram of CD69 expression in lung γδ T cells. Numbers within histogram are mean ± s.d. of fluorescence intensity of CD69 for the indicated strain. ***P = 0.00086. k, Number of eosinophils and neutrophils in lung parenchyma. Data pooled from two independent experiments (Foxp3YFPcre n = 13; Il1rl1fl/flFoxp3YFPcre n = 7 mice from the two experiments) in panels (i,k) or represent one experiment (Foxp3YFPcre n = 7; Il1rl1fl/flFoxp3YFPcre n = 4 mice) of two independent experiments in panel (j). Unpaired two-tailed t test was used for statistical analysis in panels (i-k). Error bars denote mean ± s.d. P values are indicated in the figure or otherwise indicated in the legend.
Since IL-17-producing γδ T cells were increased in the lung of Il1rl1fl/flFoxp3YFPcre mice after HDM exposure, we hypothesized that these innate lymphocytes directed the increased inflammation observed in the lung and airways of HDM-treated Il1rl1fl/flFoxp3YFPcre mice. To test this, we crossed Il1rl1fl/flFoxp3YFPcre mice with TCR delta chain-deficient mice to delete γδ T cells (Il1rl1fl/flFoxp3YFPcreTcrd−/−) and stimulated them with HDM. As expected, the increase in γδ T cells seen in the lungs of Il1rl1fl/flFoxp3YFPcre mice compared with Foxp3YFPcre littermate controls following HDM exposure was completely abrogated in Il1rl1fl/flFoxp3YFPcreTcrd−/− mice (Fig. 5e,f). Notably, γδ T cell deficiency in Il1rl1fl/flFoxp3YFPcreTcrd−/− mice resulted in diminished lung eosinophil and neutrophil infiltration compared with Il1rl1fl/flFoxp3YFPcre mice (Fig. 5g), demonstrating that γδ T cells were responsible for the increased allergic pulmonary inflammation in mice lacking ST2 signaling in Treg cells.
To investigate whether this ST2-dependent Treg cell-mediated suppression of IL-17+ γδ T cells and innate inflammatory responses in the lung to HDM extends to other environmental allergens, we used another model of type 2 allergic pulmonary inflammation induced by the fungus Alternaria alternata (A. alternata)27. In this model, Il1rl1fl/flFoxp3YFPcre mice and Foxp3YFPcre littermate controls were exposed intranasally to A. alternata extract on days 0, 1 and 17–19 and the lungs were analyzed on day 20. We found that, similar to HDM, exposure to A. alternata led to increased γδ T cells expressing IL-17 (Fig. 5h,i) and CD69 (Fig. 5j), and increased eosinophils (Fig. 5k and Extended Data Fig. 7c) in the lungs of Il1rl1fl/flFoxp3YFPcre mice compared with Foxp3YFPcre littermate controls. We did not detect a difference in the small number of neutrophils in the lungs on day 20 (Fig. 5k and Extended Data Fig. 7c), which may be due to different kinetics of neutrophil infiltration into the lungs in response to A. alternata compared with HDM. Altogether, these data reveal an essential role of ST2 signaling in Treg cells in restraining IL-17+ γδ T cells and eosinophilic inflammation in the lung to common environmental allergens.
IL-17 blockade decreases eosinophil recruitment into the lung.
To investigate how the γδ T cell IL-17 response increases eosinophilic inflammation, we examined chemokine expression in the lungs of naive and HDM-treated Il1rl1fl/flFoxp3YFPcre and Foxp3YFPcre mice. This analysis revealed that mRNA for the eosinophil-attracting chemokines Ccl11 and Ccl24 was increased in the lungs of Il1rl1fl/flFoxp3YFPcre mice compared with Foxp3YFPcre mice after HDM exposure, while the transcripts for the TH2 cell-attracting CCR4 chemokine ligands Ccl17 and Ccl22 and the CCR8 chemokine ligands Ccl8 and Ccl1 were comparable between strains before and after HDM exposure (Fig. 6a). There was a corresponding increase in CCL11 and CCL24 protein abundance in lung homogenates from HDM-treated Il1rl1fl/flFoxp3YFPcre mice compared with Foxp3YFPcre mice (Fig. 6b).
Figure 6. IL-17 blockade decreases eosinophil-attracting chemokine production and eosinophil recruitment into the lung.

a,b, Il1rl1fl/flFoxp3YFPcre mice and Foxp3YFPcre littermate controls were left untreated (Naive) or were treated with HDM i.n. on days 0 and 7–11 and analyzed on day 14. a, Levels of the indicated lung chemokine mRNA relative to β2 microglobulin (β2M) determined by RT-qPCR. Data pooled from two independent experiments (Foxp3YFPcre Naive n = 6; Foxp3YFPcre HDM n = 6; Il1rl1fl/flFoxp3YFPcre Naive n = 6; Il1rl1fl/flFoxp3YFPcre HDM n = 8 mice from the two experiments). b, Levels of CCL11 and CCL24 protein in lung homogenates. Data represent one experiment (Foxp3YFPcre Naive n = 3; Foxp3YFPcre HDM n = 4; Il1rl1fl/flFoxp3YFPcre Naive n = 3; Il1rl1fl/flFoxp3YFPcre HDM n = 5 mice) of two independent experiments. Unpaired two-tailed t test with Holm-Sidak correction for multiple comparisons was used for statistical analysis in panels (a,b). c-e, HDM-exposed Il1rl1fl/flFoxp3YFPcre mice were treated daily with anti-IL-17A blocking mAb or isotype control (IgG2a) i.n. during the allergen challenges (day 7–11) and analyzed on day 14. c, Lung Ccl11 and Ccl24 mRNA levels relative to β2M determined by RT-qPCR. d, Number of eosinophils (CD11c−Siglec-F+) and neutrophils (Siglec-F−CD11b+Ly6G+) in lung parenchyma. e, Quantification of cell differential counts in BAL. Mn - Mononuclear cells; Ne - Neutrophils; Eo - Eosinophils. Data pooled from two independent experiments (IgG2a n = 8; anti-IL-17A n = 9 mice from the two experiments) in panels (c-e). Unpaired two-tailed t test was used for statistical analysis in panels (c,d) and unpaired two-tailed t test with Holm-Sidak correction for multiple comparisons was used for statistical analysis in panel (e). Error bars denote mean ± s.d. P values are indicated in the figure.
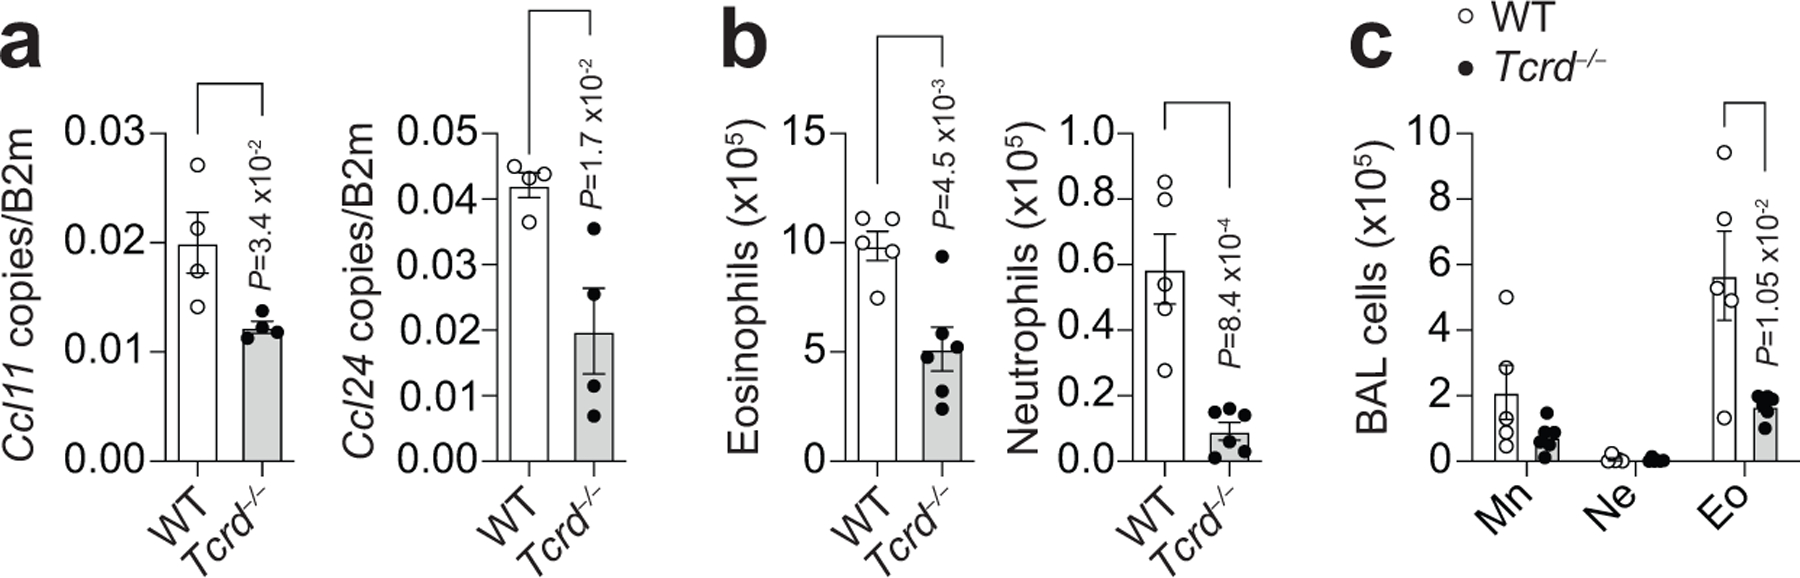
To determine whether IL-17 mediated the increased eosinophil and neutrophil recruitment into the lung and airways of Il1rl1fl/flFoxp3YFPcre mice exposed to HDM, we administered IL-17A blocking antibody intranasally during HDM challenges. We found that IL-17A blockade decreased lung expression of Ccl11 and Ccl24 (Fig. 6c) and inhibited the recruitment of eosinophils and neutrophils into the lung parenchyma and airways (Fig. 6d,e) of Il1rl1fl/flFoxp3YFPcre mice. Consistent with γδ T cells being the source of IL-17A driving CCL11 and CCL24 induction and eosinophil recruitment, we found that HDM-treated Tcrd−/− mice had reduced lung Ccl11 and Ccl24 mRNA levels compared to HDM-treated wild-type mice (Extended Data Fig. 8a–c). Altogether, these data demonstrate that the γδ T cell response in the lung to HDM exposure potentiates pulmonary eosinophilia through IL-17-induced chemokine production.
ST2+ Treg cell-derived Ebi3 suppresses the γδ T cell IL-17 response.
We next explored the pathways activated in ST2+ Treg cells that would allow them to specifically regulate IL-17-producing γδ T cells during the HDM-induced allergic response. We used a NanoString set of 561 immune related genes to compare the mRNA expression profiles of ST2+ and ST2− Treg cells from the lungs of HDM-treated mice. We found that ST2+ Treg cells highly expressed the transcription factors Gata3 and Pparg, the chemokine receptor Ccr8, and the activation markers Icosl, Il2ra (CD25) and Pdcd1 (PD-1), compared to ST2− Treg cells, which, in contrast, expressed the transcription factor Rorc (Fig. 7a). Another gene differentially expressed in ST2+ Treg cells was the Epstein-Barr virus-induced gene 3 (Ebi3), which codes for a subunit of the heterodimeric cytokines IL-35 and IL-2728, 29 (Fig. 7a). Reverse transcription quantitative PCR (RT-qPCR) analysis confirmed increased Ebi3 expression in ST2+ Treg cells compared with ST2− Treg cells (Fig. 7b). Further, ST2+ but not ST2− Treg cells expressed mRNA for the IL-12p35 (Il12a) subunit of IL-35, albeit at lower levels than Ebi3, which has been previously noted for Treg cells28, 30 (Fig. 7b). In contrast, ST2+ and ST2− Treg cells did not express mRNA for the IL-27p38 (Il27) subunit of IL-27 (Fig. 7b). These data suggest that ST2+ Treg cells are capable of secreting the Ebi3-IL-12p35 heterodimeric cytokine IL-35 but not the Ebi3-IL-27p38 heterodimeric cytokine IL-27.
Figure 7. ST2+ Treg cell-derived Ebi3 is required to suppress γδ T cell IL-17 responses in the lung.

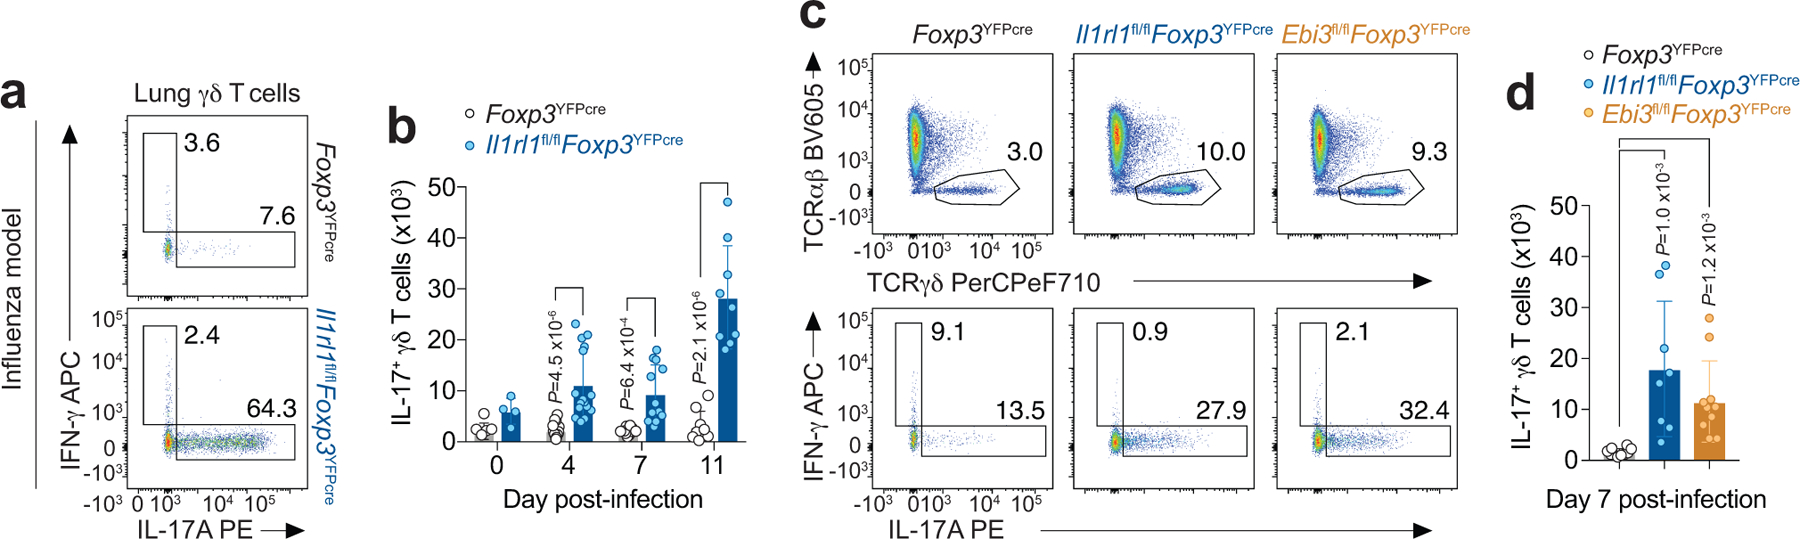
a-c, Foxp3YFPcre mice were treated with HDM i.n. on days 0 and 7–11 and analyzed on day 14. a, NanoString analysis of comparative gene expression between flow sort-purified ST2+ and ST2− Treg cell populations isolated from lung parenchyma. Data are presented as volcano plot from three independent experiments of pooled mice (n = 7 per experiment). Unpaired two-taile t test with Holm-Sidak correction for multiple comparisons was used to obtain the P values. b, RT-qPCR analysis of Ebi3, Il12a (IL-12p35) and Il27 (IL-27p28) in flow sort-purified ST2+ and ST2− Treg cell populations from lung parenchyma. Data pooled from four independent experiments. Each symbol represents a pool of n = 7 mice per experiment. Unpaired two-tailed t test was used for statistical analysis. c, Representative histogram of IL-17RB (IL-25R) expression on ST2+ Treg cells (red) and ST2− Treg cells (blue) from lung parenchyma. Isotype control is shown in gray. Data represent one experiment with n = 3 mice per group of two independent experiments. d, Flow sort-purified splenic ST2+ Treg cells from naive Foxp3YFPcre mice were stimulated in vitro with the indicated stimuli and RT-qPCR analysis of Ebi3 and Il12a performed 72 h later. Data are triplicates of pooled mice (n = 4) and represent one of two independent experiments. Ordinary one-way ANOVA with Tukey’s multiple comparisons test was used for statistical analysis. e, Flow sort-purified splenic Treg cells from naive Foxp3YFPcre mice (WT Treg), Il1rl1fl/flFoxp3YFPcre mice (Il1rl1−/− Treg), or from Ebi3fl/flFoxp3YFPcre mice (Ebi3−/− Treg) were stimulated in vitro as indicated and Ebi3 and IL-12p35 levels determined by ELISA 72 h later. Data are triplicates of pooled mice (n = 3) and represent one of two independent experiments. Unpaired two-tailed t test with Holm-Sidak correction for multiple comparisons was used for statistical analysis in panel (e). f-i, Foxp3YFPcre, Il1rl1fl/flFoxp3YFPcre and Ebi3fl/flFoxp3YFPcre mice were treated with HDM i.n. on days 0 and 7–11 and analyzed on day 14. f, Representative flow cytometry for IL-17A and IFN-γ in γδ T cells from lung parenchyma. g, Number of lung IL-17A+ γδ T cells. h, Number of eosinophils (CD11c−Siglec-F+) and neutrophils (Siglec-F−CD11b+Ly6G+) in lung parenchyma. i, Quantification of cell differential counts in BAL. Mn - Mononuclear cells; Ne - Neutrophils; Eo - Eosinophils. Data pooled from two independent experiments (Foxp3YFPcre n = 7; Il1rl1fl/flFoxp3YFPcre n = 9; Ebi3fl/flFoxp3YFPcre n = 7 mice from the two experiments) in panels (g-i). Ordinary one-way ANOVA with Tukey’s multiple comparisons test was used for statistical analysis in panels (g,h) and unpaired two-tailed t test with Holm-Sidak correction for multiple comparisons was used for statistical analysis in panel (i). Error bars denote mean ± s.d. P values are indicated in the figure.
ST2+ but not ST2− Treg cells in the lung expressed both mRNA (Il17rb) and surface protein (IL-17RB) for the receptor of the epithelial-derived cytokine IL-25 (IL-25R) (Fig. 7a,c), indicating that ST2+ Treg cells are poised to respond to IL-33 and IL-25 released from the epithelium in response to stress and injury31. We therefore sought to determine whether these innate cytokines could modulate the expression of Ebi3 and Il12a in ST2+ Treg cells. To test this, we sorted splenic ST2+ Treg cells and stimulated them with IL-33, IL-25 or both, and compared them to ST2+ Treg cells stimulated through the TCR using anti-CD3 and anti-CD28 antibodies. We found that IL-33 upregulated both Ebi3 and Il12a in splenic ST2+ Treg cells while IL-25 only upregulated Ebi3, which was maximally induced by a combination of IL-25 and IL-33 (Fig. 7d). Of note, TCR stimulation did not increase the expression of Ebi3 or Il12a and, instead, inhibited the expression of these subunits when stimulated in the presence of IL-33 and IL-25 (Fig. 7d). We did not detect Il27 expression in any condition tested. Further, ST2+ Treg cells likely produce the IL-35 heterodimer in response to IL-33 as we detected increased Ebi3 and IL-12p35 protein levels only in culture supernatants from wild-type Treg cells but not from Il1rl1−/− or Ebi3−/− Treg cells stimulated with IL-33 in vitro (Fig. 7e).
To determine whether Ebi3 was required for Treg cell-mediated suppression of the γδ T cell response in the lung following allergen exposure, we used Ebi3fl/flFoxp3YFPcre mice that have a specific deletion of Ebi3 in Treg cells. We found that Ebi3fl/flFoxp3YFPcre mice had a strikingly similar response to HDM compared with Il1rl1fl/flFoxp3YFPcre mice, showing a very specific increase in the numbers of IL-17-producing γδ T cells (Fig. 7f,g) and increased recruitment of eosinophils and neutrophils into the lung and airways (Fig. 7h,i). These data demonstrate that ST2 signaling in Treg cells induces Ebi3, which is required for ST2+ Treg cell-mediated suppression of IL-17-producing γδ T cells in the lung.
IL-35 suppresses γδ T cell IL-17 responses in the lung induced by HDM.
Since Ebi3 and IL-12p35 were upregulated in lung ST2+ Treg cells from HDM-treated mice, and are both components of the inhibitory cytokine IL-3528, we postulated that IL-35 production by ST2+ Treg cells mediated the suppression of γδ T cells. To address whether γδ T cells were a cellular target of IL-35 in the lung, we assessed mRNA abundance for the two chains of the IL-35 receptor (IL-35R), Il6st and Il12rb228, 29, on sorted innate and adaptive lymphocytes from the lung of HDM-treated mice. We found that the mRNA for both Il6st and Il12rb2 were highly expressed in γδ T cells and ILCs but were absent or markedly lower in Treg cells (Fig. 8a). TH effector cells also expressed abundant Il6st mRNA but had very low expression of Il12rb2 (Fig. 8a). In addition, exogenous IL-35 protein efficiently suppressed lung γδ T cell production of IL-17A upon TCRγδ activation ex vivo (Fig. 8b), demonstrating that IL-35 can directly suppress γδ T cell function. Indeed, treatment of Foxp3YFPcre mice during HDM challenges with a monoclonal antibody (mAb) that specifically neutralizes IL-3528 resulted in an increased γδ T cell IL-17 response and increased eosinophil and neutrophil recruitment into the lung compared with mice treated with an IgG2b isotype control (Fig. 8c–f). In contrast, mice treated with a mAb that specifically neutralizes IL-27 during HDM challenges had no change in IL-17+ γδ T cells and eosinophils in the lungs but had a small increase in neutrophils (Fig. 8c–f). These data implicate IL-35 as a cytokine released from ST2+ Treg cells after IL-33 stimulation that restrains the γδ T cell response in the lung to allergen exposure. However, we do not rule out the possibility that Ebi3 may be secreted as a homodimer or paired with a yet uncharacterized factor that functions as an inhibitory molecule.
Figure 8. IL-35 suppresses γδ T cell IL-17 responses in the lung induced by HDM.
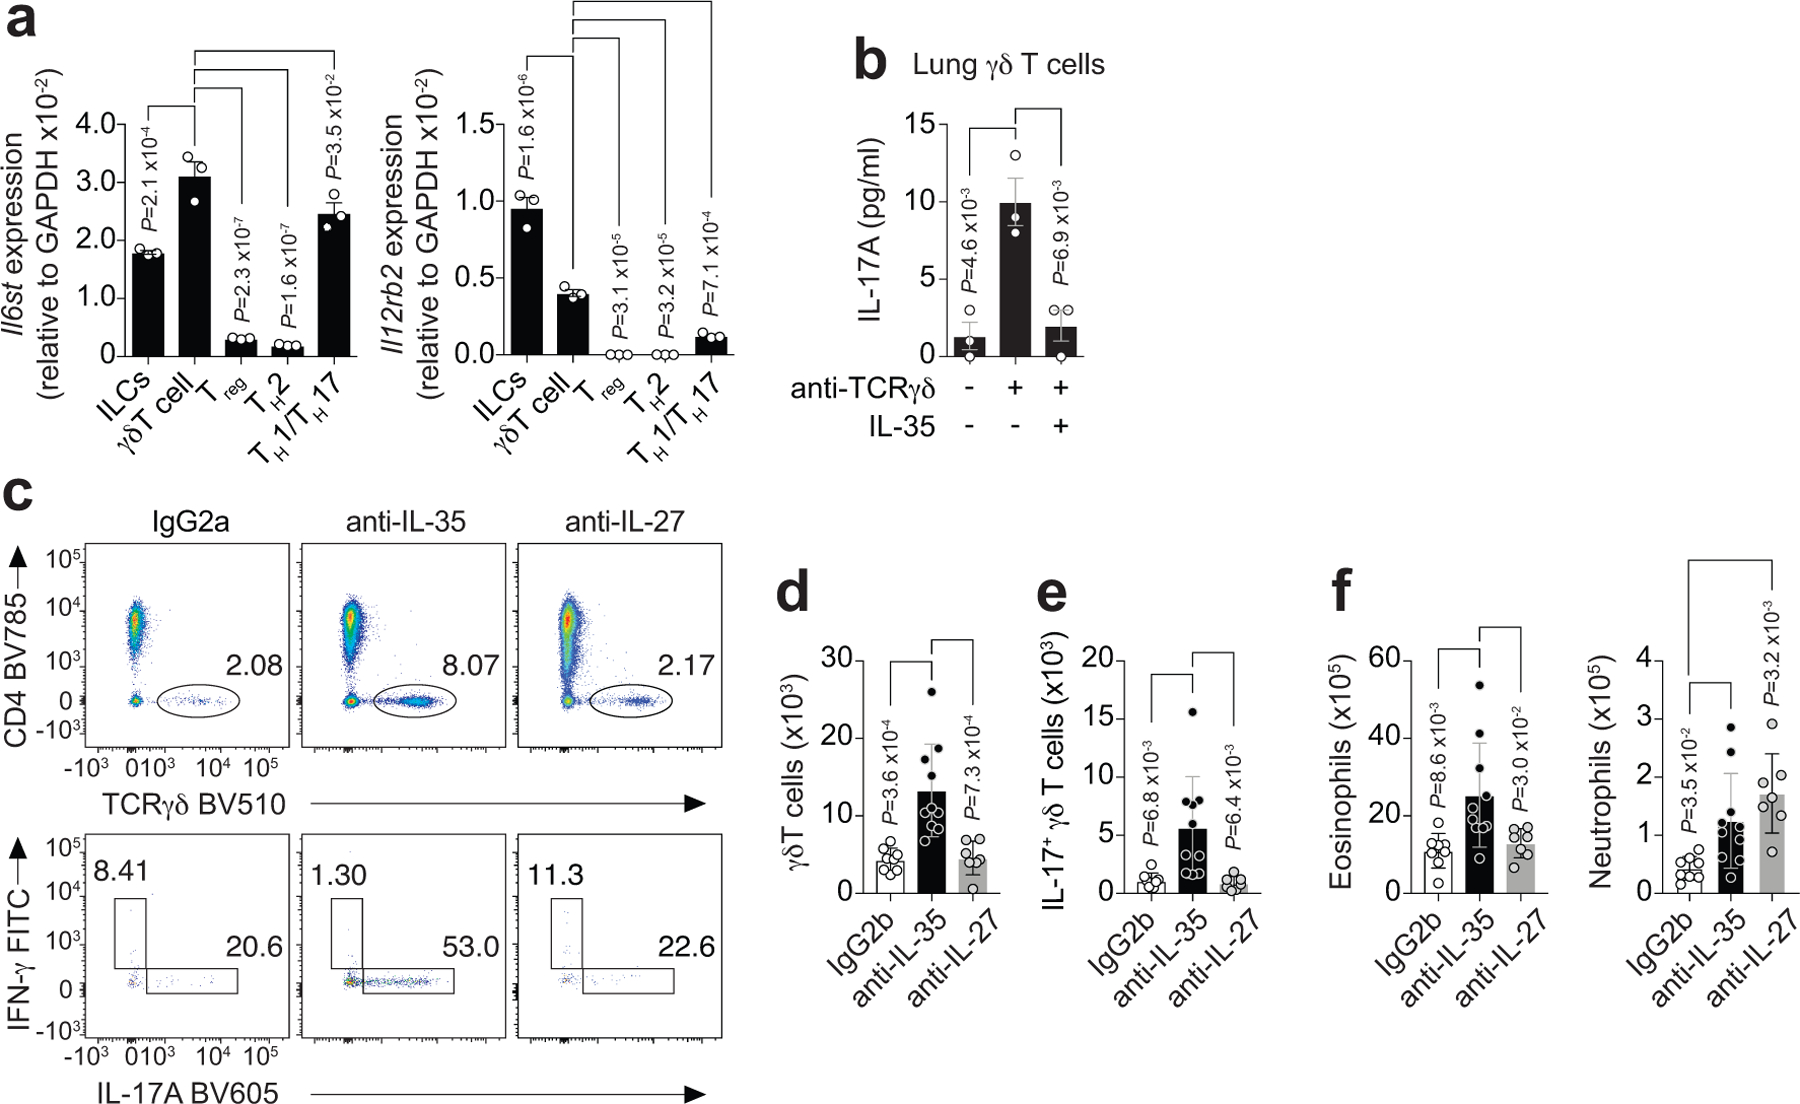
a, RT-qPCR analysis of Il6st (left) and Il12rb2 (right), the two chains of the IL-35 receptor, in flow sort-purified lymphocytes from lung parenchyma of HDM-treated Foxp3YFPcre mice. Data pooled from three independent experiments. Each symbol represents a pool of n = 4 mice per experiment. b, Flow sort-purified lung γδ T cells from HDM-treated Foxp3YFPcre mice were stimulated in vitro as indicated and IL-17A protein levels determined by ELISA 72 h later. Data are triplicates of a pool of n = 4 mice and represent one of two independent experiments. Ordinary one-way ANOVA with Tukey’s multiple comparisons test was used for statistical analysis in panels (a,b). c-f, HDM-exposed Foxp3YFPcre mice were treated with mAbs that specifically neutralize IL-35 or IL-27, or with a mAb isotype control (IgG2b) i.p. on days 6 and 11 and analyzed on day 14. c, Representative flow cytometry for CD4 and TCRγδ in CD3+ T cells (top) and for IL-17A and IFN-γ in γδ T cells (bottom) from lung parenchyma. d, Number of total lung γδ T cells. e, Number of lung IL-17A+ γδ T cells. f, Number of eosinophils (CD11c−Siglec-F+) and neutrophils (Siglec-F−CD11b+Ly6G+) in lung parenchyma. Data pooled from two independent experiments (IgG2b n = 8; anti-IL-35 n = 10; anti-IL-27 n = 7 mice from the two experiments) in panels (d-f). Ordinary one-way ANOVA with Tukey’s multiple comparisons test was used for statistical analysis in panels (d-f). Error bars denote mean ± s.d. P values are indicated in the figure.
To determine whether the immunoregulatory function of ST2+ Treg cells in suppressing IL-17+ γδ T cells in the lung is a general response to respiratory mucosal injury to exogenous insults, we used influenza virus infection as a model of pulmonary epithelial injury that leads to a very different type of adaptive immune response. We found that ST2 signaling in Treg cells was also essential for suppressing IL-17+ γδ T cell responses in the lung during the course of influenza infection (Extended Data Fig. 9a,b). In addition, mice with a Treg cell-specific deletion of Ebi3 had a very similar increase in IL-17-producing γδ T cells in the lung in response to influenza infection compared with mice with a Treg cell-specific deletion of ST2 (Extended Data Fig. 9c,d). Altogether, our data demonstrate that during allergy and infection, ST2+ Treg cells produce Ebi3 to suppress IL-17+ γδ T cells in the lung, indicating a general mechanism whereby ST2+ Treg cells restrain innate γδ T cell responses to respiratory mucosal injury.
Discussion
We have uncovered a new fundamental function of ST2+ Treg cells as a suppressor of the early innate immune response to pulmonary mucosal injury. Aeroallergen exposure induced a rapid expansion of ST2+ Treg cells in the lung and airways of mice and humans. HDM-specific tetramer analysis in mice revealed that endogenous ST2+ Treg cells do not recognize the Derp1117–127 allergen peptide and parabiosis studies showed that allergen priming is not required for ST2+ Treg cell accumulation in the lung after HDM challenges. Instead, the early activation and rapid increase in ST2+ Treg cells in the lung was dependent on IL-33 and ST2 signaling. These data demonstrate that ST2+ Treg cells respond to tissue damage caused by environmental allergens, and not necessarily to the allergen itself. ST2+ (GATA-3+) Treg cells in non-lymphoid tissues express helios and neuropilin-14, 11, 32, two markers of thymus-derived Treg cells33, 34, and constitute a clonally expanded population after tissue injury with a TCR repertoire distinct from Treg cells in the spleen4. Our finding that Treg cells accumulate normally in the lungs of Il1rl1fl/flFoxp3YFPcre mice later in the HDM model, when lung inflammation peaks, despite the lack of ST2 in Treg cells, underscores the possibility that ST2+ Treg cells are also responding to self-antigens generated by lung damage after HDM challenges, in addition to IL-33.
Il1rl1fl/flFoxp3YFPcre mice developed a more robust γδ T cell IL-17 response in the lung and more severe pulmonary eosinophilia in response to the common environmental allergens HDM and A. alternata compared to Foxp3YFPcre mice. Unexpectedly, this increase in allergic pulmonary inflammation was not due to increased type 2 cytokines in the lungs or enhanced function of adaptive and innate immune cells involved in TH2 immunity, such as TH2 cells or ILC2s35. Increased IL-17 levels have been associated with the severity of asthma in humans and mice36, 37, 38, and mice deficient in γδ T cells or IL-17R have revealed an important role for this pathway for allergic type 2 responses39, 40. Although the role of γδ T cells and IL-17 in promoting neutrophilic inflammation is well defined, their contribution to airway eosinophilia remains unclear40, 41, 42, 43. We found that the γδ T cell IL-17 response mediated increased lung expression of the eosinophil-attracting chemokines CCL11 and CCL24, which have been well described to drive eosinophil recruitment into the lung44, and likely drive the increased eosinophil recruitment seen in Il1rl1fl/flFoxp3YFPcre mice. The cell type(s) in the lung responding to γδ T cell-derived IL-17A and releasing CCL11 and CCL24 is not known. However, data from single-cell RNA-seq analysis of the murine lung suggests that stromal cells and epithelial cells express the IL-17A receptor chains Il17rc and Il17ra and thus could potentially respond to IL-17A and secrete CCL11 and CCL2445. Airway smooth muscle cells are another potential source of eosinophil-attracting chemokines as IL-17A induces the production of CCL11 in smooth muscle cells isolated from human bronchial tissue46.
Transcriptional analysis of ST2+ and ST2− Treg cells in the lung of mice exposed to HDM showed that the Ebi3, a component of the immunoregulatory cytokines IL-35 and IL-2729, is highly expressed in ST2+ Treg cells. Ebi3 was essential for ST2+ Treg cell-mediated suppression of IL-17-producing γδ T cells given that mice with a Treg cell-specific deletion of Ebi3 exhibited a phenotype very similar to Il1rl1fl/flFoxp3YFPcre mice in response to HDM. A similar mechanism operated in response to influenza infection, demonstrating that ST2+ Treg cell-mediated suppression of IL-17-producing γδ T cells is a common tissue Treg cell response to lung injury. IL-35 blockade, but not IL-27 blockade, also led to increased γδ T cell IL-17 response and increased eosinophil recruitment into the lung after HDM exposure. These data implicate IL-35 as the potential immunoregulatory cytokine released by ST2+ Treg cells that mediates this process. This link is further strengthened by our finding that the IL-35 (but not IL-27) subunits were induced in Treg cells by IL-33, and that IL-35 protein was sufficient to inhibit IL-17A production by lung γδ T cells. Thus, in addition to promoting tissue repair following injury via the release of amphiregulin4, 5, ST2+ Treg cells activated by IL-33 at barrier sites also protect the tissue by restraining exuberant γδ T cell IL-17 responses. Treg cells were in closer proximity to γδ T cells in the lungs of Foxp3YFPcre mice compared to Il1rl1fl/flFoxp3YFPcre mice. This may also partly explain the increased efficacy of Treg cells in Foxp3YFPcre mice to suppress the γδ T cell IL-17 response. The failure of ST2-deficient Treg cells to approximate γδ T cells in the lungs of HDM-treated mice may relate to our finding that CCR8 was expressed in ST2+ but not ST2− Treg cells in the HDM model as IL-17-producing γδ T cells also express CCR847, 48.
Finally, production of IL-17 by γδ T cells has been reported to act upon lung epithelium and adipose tissue stromal cells to enhance the production of IL-33, which in turn elicits ST2+ Treg cell expansion and production of amphiregulin to promote tissue repair49, 50. Coupled with our new findings, these studies suggest the existence of a classic negative feedback loop, whereby IL-17 production by γδ T cells enhances production of IL-33 by tissue structural cells49, 50, which then activates ST2+ Treg cells to directly suppress IL-17-producing γδ T cells, thereby shutting off IL-33 production. These findings suggest that IL-33 is tightly regulated in the tissue by ST2+ Treg cells. Thus, while IL-33 rapidly activates immune cells, such as ILC2s, to induce type 2 immunity, it also activates ST2+ Treg cells to confer tissue protection by inducing amphiregulin and by restraining γδ T cell IL-17 responses and thus the further production of IL-33 by lung epithelial cells.
Our results identify a novel fundamental function of ST2+ Treg cells in restraining innate immune responses to respiratory mucosal insults, which should be considered as IL-33–ST2 pathway inhibitors enter clinical trials. Even though ST2+ Treg cells highly express GATA-3, they do not recognize the allergen epitope and do not suppress allergen-specific TH2 cell responses. Instead, lung ST2+ Treg cells are activated by innate cytokines to produce Ebi3, which was required for the suppression of innate γδ T cell IL-17 responses in the lung to mucosal injury. The ability of tissue ST2+ Treg cells to rapidly respond to epithelial cell-derived cytokines may represent a general mechanism by which innate immune-mediated damage to self at barrier surfaces is kept in check.
Methods
Mice
C57BL/6J (wild-type), B6.129P2-Tcrdtm1Mom/J (Tcrd−/−)51 and B6.129(Cg)-Foxp3tm4(YFP/icre)Ayr/J (Foxp3YFPre)52 mice were obtained from The Jackson Laboratory. Il33−/− mice53 were provided by L. Wu (Vanderbilt University, Nashville, TN). Il1rl1fl/fl mice54 were obtained from R. Lee (Brigham and Women’s Hospital, Boston, MA) and crossed with Foxp3YFPCre mice to generate Il1rl1fl/flFoxp3YFPCre mice and Foxp3YFPCre littermate controls. Il1rl1fl/flFoxp3YFPCre mice were also crossed with Tcrd−/− mice to generate Il1rl1fl/flFoxp3YFPCreTcrd−/− mice. Ebi3fl/fl mice were crossed with Foxp3YFPcre to generate Ebi3fl/flFoxp3YFPcre mice55. All mice analyzed were age-matched (6–12 weeks old) and male and female mice were randomly assigned to each experimental group. All mice were bred and maintained in specific-pathogen-free conditions at the animal facility of the Massachusetts General Hospital and used under a study protocol approved by Massachusetts General Hospital Subcommittee on Research Animal Care.
Mouse treatments
To induce allergic pulmonary inflammation to HDM, mice were anesthetized with intraperitoneal (i.p.) injection of Ketamine/Xylazine (Patterson Veterinary) and sensitized intranasally (i.n.) with 10 μg HDM (Dermatophagoides pteronyssinus extracts, Greer Laboratories) in 30 μl of sterile PBS on day 0 and subsequently challenged with 10 μg of HDM i.n. on days 7–11. Three days after the last challenge on day 14, the lungs and bronchoalveolar lavage (BAL) fluid were collected. Where indicated, mice were treated i.n. with 5 μg anti-IL-17A blocking mAb (clone 17F3, Bioxcell) on days 7–11, treated i.v with 10 μg sST2-Fc (Catalog # 1004-MR-050, R&D Systems) on days 7–9, or treated i.p. with 100 μg of a mAb (clone V1.4C4.22) that specifically neutralizes IL-3555 or 100 μg of a mAb (Catalog # AF1834, R&D Systems) that specifically neutralizes IL-27 on days 7 and 11. To induce allergic pulmonary inflammation to A. alternata, mice were anesthetized i.p. with Ketamine/Xylazine and challenged with 50 μg A. alternata extract (Alternaria alternata extracts, Greer Laboratories) in 30 μl of sterile PBS on days 0, 1 and 17–19. The lungs were harvested on day 20 for analysis. Influenza A/Puerto Rico 8/1934 (PR8) H1N1 strain was obtained from Charles River (Cat# 10100374), aliquoted and stored in liquid nitrogen. Mice were anesthetized i.p. with Ketamine/Xylazine (Patterson Veterinary) and intranasally infected with 100 egg infectious doses (EID50)/gram of mouse (corresponding to a 0.3 lethal dose 50 (LD50)). The lungs were harvested on days 4, 7 and 11 post-infection for analysis.
Parabiosis surgery
CD45.2+ C57BL/6J mice were exposed to HDM and rested for 3–4 weeks to generate a memory response. Then, HDM-treated memory CD45.2+ C57BL/6J mice and naive CD45.1+ C57BL/6J mice underwent hair removal along opposite lateral flanks with the use of hair clippers and depilatory cream. Skin was then wiped clean of fur with 70% alcohol prep pads and betadine solution. Mirrored incisions were then made on the lateral aspects of both mice. 4.0 sutures were placed around the olecranon joints as well as the knees joints of both mice to secure the upper and lower extremities, respectively. Dorsal and ventral skin was approximated with the use of 4.0 sutures and surgical staples to conjoin the mice. At the end of the surgery, mice received subcutaneous enrofloxacin antibiotic as well as buprenorphine and flunixin for pain control. Enrofloxacin antibiotic was subsequently administered via drinking water for 2 weeks. Subcutaneous buprenorphine and flunixin was administered as needed every 12 h for 48 h. Recirculation was assessed in peripheral blood 4–5 weeks after surgery. Both mice in the parabiont pair were subsequently challenged with 10 μg of HDM i.n. and the lungs were collected 2–3 days later.
Intravascular staining and leukocyte preparation
Mice were anesthetized i.p. with Ketamine/Xylazine (Patterson Veterinary) and subsequently injected intravenously with 3 μg of CD45 (30-F11, BioLegend) monoclonal antibodies through the retro-orbital sinus56. After 3 min, the trachea was exposed, cannulated and bronchoalveolar lavage was performed by infusing three 1 ml washes of cold PBS with 0.12% 2 mm EDTA. Cell differential counts for BAL were determined by enumerating mononuclear cells, neutrophils, and eosinophils on cytocentrifuge preparations as previously described57. Lung lobes were then removed, minced with scissors and digested at 37 °C for 20 min in digestion buffer (0.52 U/ml Liberase TM [Roche] and 60 U/ml DNase I [Roche] in RPMI 1640 [Cellgro]). Lung tissue was then strained through a 70-μm filter and subjected to RBC lysis with Red Blood Cell Lysing Buffer Hybri-Max (Sigma-Aldrich) to generate a single-cell suspension. Lung leukocyte enrichment was performed by using a 30% Percoll gradient. Secondary lymphoid organs were harvested from the same mice as indicated and mechanically dissociated through a 70-μm filter and subjected to RBC lysis to generate a single-cell suspension.
Flow cytometry and cell sorting
Single cells were incubated with anti-mouse CD16/32 (93, TruStain fcX, BioLegend) at a 1:100 dilution to block Fc receptors. Staining was performed with Fixable Viability Dye eF780 (eBioscience) at a 1:1000 dilution, to identify dead cells, and the following fluorochrome-conjugated anti-mouse monoclonal antibodies (mAbs) all at a 1:100 dilution: CD4-BV785 (GK1.5), CD4-APC (GK1.5), CD4-PE/Cy7 (GK1.5), CD4-AF594 (RM4–5), CD69-PE (H1.2F3), CD69-APC (H1.2F3), CD69-PE/Cy7 (H1.2F3), ST2-APC (DIH9), TCRαβ-BV421 (H57–597), TCRαβ-BV605 (H57–597), CD127-BV605 (A7R34), NK1.1-BV711 (PK136), NK1.1-FITC (PK136), TCRγδ-BV510 (GL3), TCRγδ-AF647 (GL3), Ly-6G-FITC (1A8), Ly6C-BV785 (HK1.4), Lineage-FITC (CD3/Gr-1/CD11b/CD45R(B220)/Ter-119), CD45-PerCP/Cy5.5 (30-F11), CD11c-BV605 (N418), IFN-γ-FITC (XMG1.2), IFN-γ-APC (XMG1.2), IL-17A-BV605 (TC11–18H10.1), T-bet-PE/Cy7 (4B10), IL-5-PE (TRFK5), ICOS-APC (7E.17G9), GATA3-BV421 (16E10A23), (all from BioLegend); Foxp3-APC (FJK-16s), Foxp3-AF488 (FJK-16s), RORγt-PE (B2D), IL-13-PE/Cy7 (eBio13A), IL-17A-PE (eBio17B7), TCRγδ-PerCP/eF710 (eBioGL3) (all from eBioscience); IL-33R-BV421 (U29–93), CD3e-BUV395 (145–2C11), Siglec-F-PE (E50–2440), CD11b-BUV395 (M1/70), CD11b-PE/Cy7 (M1/70), GATA3-PE-CF594 (L50–823) (all from BD Biosciences). Human cells were incubated with human Fc block (BD Biosciences) at a 1:100 dilution and then stained with Fixable Viability Dye eF780 (eBioscience) at a 1:1000 dilution and the following fluorochrome-conjugated anti-human mAbs all at a 1:100 dilution: CD4-Pacific Blue (OKT4), CD25-PE/Cy7 (M-A251), CD127-PE (A019D5) (all from BioLegend); Foxp3-APC (236A/E7, eBioscience), hST2-FITC (B4E6, MD Biosciences). Flow cytometric analysis was performed using a BD LSRFortessa X-20 flow cytometer (BD Biosciences) and FlowJo software (Tree Star). Intracellular staining was performed using eBioscience Fixation Permeabilization buffers. For cytokine staining lymphocytes were stimulated with 10 ng/ml phorbol 12-myristate-13-acetate (PMA) and 500 ng/ml ionomycin (Sigma) for 4 h in the presence of 1 μl/ml protein transport inhibitor containing brefeldin A (GolgiPlug, BD Biosciences) at 37 °C, 5% CO2. FACSAria II or FACSAria Fusion (BD Biosciences) was used for cell sorting. Cells were checked for purity (> 95%) of sorted populations after flow cytometry assisted cell sorting.
Peptide-MHCII tetramer staining
Biotinylated MHC class II I-Ab molecules containing the covalently attached Der p 1 117–127 (CQIYPPNVNKI) epitope (nonamer core plus two N-terminal flanking amino acids) were made as previously described58. Monomers were tetramerized with streptavidin-PE or streptavidin-APC (Prozyme). Single-cell suspensions were stained with I-Ab:Der p 1117–127 (I-A(b):Derp1) tetramer conjugated to APC or PE for 1 h at 20–22 °C. Cells were then washed and incubated with anti-APC or anti-PE microbeads (Miltenyi Biotec) for 30 min. Tetramer-positive cells were enriched as previously described59 and surface stained with anti-mouse mAbs. Cells were then washed and subjected to surface staining and viability dye.
Lung explant culture, homogenate and in vitro assays
The lungs were removed, cut into pieces using scissors into 24-well flat-bottom plates in 1 ml of RPMI 1640 media (Cellgro) supplemented with 10% (v/v) heat-inactivated fetal bovine serum (FBS, Sigma), 50 μM 2- mercaptoethanol, 2 mM Glutamax (Gibco), 5 mM HEPES pH 7.0, 1 mM sodium pyruvate, 0.1 mM non-essential amino acids, 100 U/mL penicillin-streptomycin (all from Lonza) and stimulated with 25 μg/ml HDM (Greer Laboratories) for 72 h at 37°C, 5% CO2. The cytokine IL-4, IL-5, IFN-γ (BioLegend), IL-13 and IL-17A (eBioscience) levels in culture supernatant were measured by enzyme-linked immunosorbent assay (ELISA) according to the manufacturer’s instructions. For lung homogenate, the whole lung was snap-frozen on dry ice and stored at −80 °C. The snap-frozen lung was homogenized in 2 ml of RIPA buffer (Sigma-Aldrich) containing 0.01% protease and phosphatase inhibitor cocktail (Thermo Scientific) using a gentleMACS dissociator (M Tubes, Miltenyi Bipotec). The lung lysate was placed on ice for 30 min and the tissue and cell debris removed by centrifugation at 19,000 × g for 20 min at 4°C. The supernatant was collected for analysis of CCL11 and CCL24 by ELISA (Thermo Scientific) according to the manufacturer’s instructions. Flow sort-purified splenic Treg cells were stimulated in vitro with IL-2 (10 ng/ml) and/or IL-33 (100 ng/ml), IL-25 (100 ng/ml), and plate-bound anti-CD3 (2 μg/ml, 145–2C11 BioLegend) plus soluble ant-CD28 (2 μg/ml, 37.51 BioLegend) for 72 h for RT-qPCR analysis. For IL-35 suppression assay, flow sort-purified lung γδ T cells were stimulated in vitro with 2 μg/ml plate-bound anti-TCRγδ (GL3, BioLegend) without or with 100 ng/ml IL-35 (Adipogen: IL-35 [mouse]:Fc [human] (recombinant protein), cat # CHI-MF-11135) for 72 h, and the IL-17A cytokine level in culture supernatant measured by ELISA.
RT-qPCR and NanoString nCounter gene expression
RNA was extracted using RNeasy Mini kit (Qiagen) and cDNA was reverse-transcribed using SuperScript III First Strand (Invitrogen) following manufacturer’s guidelines. Reverse transcription quantitative PCR (RT-qPCR) reactions were performed using TaqMan Gene Expression Assays and normalized to Gapdh abundance. All primers and probes were from Applied Biosystems as follows: Gapdh, Mm99999915_g1; Ebi3, Mm00469294_m1; Il27, Mm00461162_m1; Il12a, Mm00434165_m1; Il6st, Mm00439665_m1; Il12rb2, Mm00434200. Alternatively, RT-qPCR reactions were performed on a LightCycler 96 (v1.1, Roche) using FastStart Essential DNA Green Master (Roche) and normalized to B2m using the following primers: Ccl11, 5′-TCCACAGCGCTTCTATTCCTG-3′ (forward) and 5′-GGAGCCTGGGTGAGCCA-3′ (reverse); Ccl24, 5′-ATTCTGTGACCATCCCCTCAT-3′ (forward) and 5′-TGTATGTGCCTCTGAACCCAC-3′ (reverse); Ccl17, 5′-CAGGGATGCCATCGTGTTTC-3′ (forward) and 5′-CACCAATCTGATGGCCTTCTT-3′ (reverse); Ccl22, 5′-TACATCCGTCACCCTCTGCC-3′ (forward) and 5′-CGGTTATCAAAACAACGCCAG-3′ (reverse); Muc5ac, 5′-CAGGACTCTCTGAAATCGTACCA-3′ (forward) and 5′-GAAGGCTCGTACCACAGGG-3′ (reverse); B2m, 5′-CCCGTTCTTCAGCATTTGGA-3′ (forward) and 5′-CCGAACATACTGAACTGCTACGTAA-3′ (reverse). Results are presented as copies per B2m. For NanoString gene expression, total RNA was hybridized onto nCounter Mouse Immunology cartridges on the nCounter Prep Station according to the manufacturer’s instructions. Hybridized cartridges were read with the nCounter Digital Analyzer and analyzed by nSolver analysis software (v3.0, NanoString Technologies). Data are presented as volcano plot.
Histology and confocal immunofluorescence
For histologic analysis, lung samples were fixed in buffered 10% formalin solution. Paraffin-embedded sections were cut (5 mm) and stained with hematoxylin and eosin (H&E) or periodic acid-Schiff (PAS). Inflammation was scored on a scale of 0–5 in a blinded fashion by pathologist in the pathology core at Harvard Medical School. All images are shown at 200× magnification. Scale bars = 100 μm. For confocal microscopy, lungs were fixed at 20–22 °C for 2–3 h in periodate-lysine-paraformaldehyde fixative. Organs then were placed sequentially in 10%, 20% and 30% sucrose (wt/vol) in PBS for cryoprotection, then embedded in optimum cutting temperature (OCT) compound (Tissue-Tek) and frozen in 2-methybutane over liquid nitrogen. A Cryostat (Microm HM 505 E, GMI) was used to generate 10–15 mm sections, which were kept at −20 °C. On the day of staining, sections were thawed, rehydrated in PBS for 20 min at 20–22 °C, blocked in PBS containing 0.1% (vol/vol) Tween-20 and 5% (vol/vol) Normal Goat Serum (Jackson Immunoresearch), and were stained with monoclonal antibodies anti-TCRγδ Alexa Fluor 647 (clone RM4–5, BioLegend) and anti-CD4 Alexa Fluor 594 (clone RM4–5, BioLegend), and with anti-GFP rabbit polyclonal antibody Alexa Fluor 488 (ThermoFisher). Antibody was diluted in PBS containing 0.1% (w/v) Saponin and allowed to incubate overnight at 4 °C. All slides were mounted in Prolong Gold to prevent fading of staining. A Zeiss LSM confocal microscope was used to acquire images that were generated by collecting consecutive scans with 1 laser line active per scan to prevent excitation crosstalk. Imaris image analysis software v.8.3.1 and the MATLAB program (R2016b) were used to quantitate the number of γδ T cells within a 400 μm2 area of stained lung sections, and the nearest distance between Treg cells and γδ T cells in the peribronchovascular region of the lung.
Human studies
Study design:
Aeroallergen allergic subjects were recruited via advertisement in the Massachusetts General Hospital outpatient clinics and around the Boston metropolitan area. Interested volunteers were screened for eligibility with a full medical history, baseline spirometry and methacholine challenge, and allergen skin testing. Detailed inclusion and exclusion criteria as well as the study protocol are provided in the Extended Data Fig. 2. Subjects gave their written informed voluntary consent before testing and sample collection and also consented to allow publication of the results of this study devoid of all subject identifiers. Eligible subjects underwent segmental allergen challenge (SAC) and collection of BAL fluid before and after allergen challenge for analysis. The study was approved by the Partners HealthCare Institutional Review Board.
Allergen skin testing:
Standardized allergen extract for cat dander (Cat) and Dermatophagoides pteronyssinus (DP) were purchased from Greer Laboratories. Aeroallergen allergic subjects had a positive skin prick test to either cat hair or dust mite extract. The threshold level of allergen sensitivity was determined by skin prick test titration using serial threefold dilutions of extract60. The lowest extract concentration eliciting a positive skin prick test (3-mm wheal diameter) was used as the allergen concentration for SAC in allergic subjects.
Segmental allergen challenge (SAC):
SAC was performed as previously described61, 62. Briefly, a prechallenge BAL was obtained from the lingula using 4 × 30 ml aliquots of normal saline. Diluent (2 ml) was then administered to the anterior segment of the right upper lobe followed by administration of allergen (2 ml) to the lateral segment of the right middle lobe. BAL samples were obtained from the diluent- and allergen-challenged lung segments 24 h later.
Statistical analysis
All statistical analyses were performed using GraphPad Prism software (v8.2.1, Prism). Statistical parameters are reported in the figure legends but generally P value was determined by unpaired two-tailed Student’s t test when comparing two data sets or unpaired two-tailed t test with Holm-Sidak correction for multiple comparisons. Ordinary one-way analysis of variance (ANOVA) with Tukey’s multiple comparisons test was used to analyze multiple sets of data. Repeated measures (RM) one-way ANOVA with Geisser-Greenhouse correction and Tukey’s multiple comparisons test and (RM) two-way ANOVA with Geisser-Greenhouse correction and Sidak’s multiple comparisons test was used for analysis of human data. P value is expressed in absolute value and indicated in each data figure or specified in the figure legend. No statistical method was used to predetermine sample size. The number of mice used in each experiment to reach statistical significance was determined on the basis of preliminary data. No animals were excluded from the analyses. No blinding was used, unless otherwise stated. Data met assumptions of statistical methods used and variance was similar between groups that were statistically compared.
Extended Data
Extended Data Fig. 1. Profiling ST2-expressing Treg and TH cells in the lungs of HDM-treated mice.
a-d, Foxp3YFPcre mice were treated with HDM i.n. on days 0 and 7–11 and analyzed on day 14. a, Schematic of experimental design. b, NanoString analysis of gene expression comparison between flow sort-purified CD4+Foxp3− T helper (TH) cells expressing ST2 (TH2) or not (ST2− TH) from lung parenchyma. Data are presented as volcano plot from three independent experiments of pooled mice (n = 7 mice per experiment). Unpaired two-tailed t test with Holm-Sidak correction for multiple comparisons was used to obtain the P values. c, Representative flow cytometry plots for IL-13 and IL-5 (top), and for IL-17A and IFN-γ (bottom) in TH2 and ST2− TH cells from lung parenchyma. d, Representative histograms showing the expression of the indicated transcription factors in ST2+ Treg cells (red) or ST2− Treg cells (blue) from lung parenchyma. Isotype control is shown in gray.
Extended Data Fig. 2. Subject characteristics.
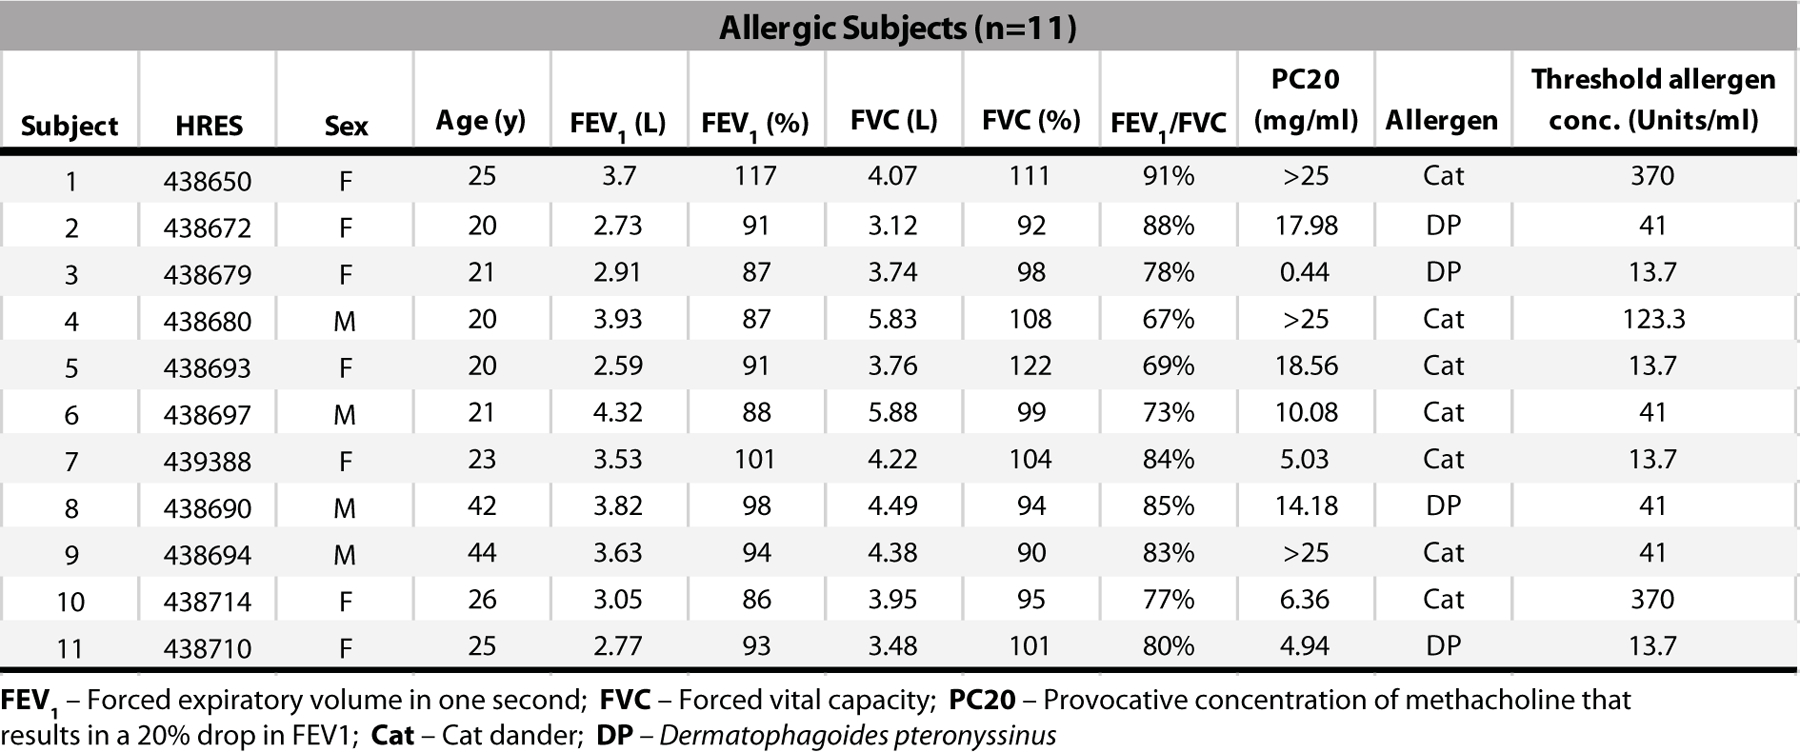
Aeroallergen-allergic human subjects screened for eligibility with a full medical history, baseline spirometry, methacholine challenge, and allergen skin testing to confirm allergy to either cat dander or Dermatophagoides pteronyssinus)(DP). The threshold level of allergen sensitivity was determined by skin prick test titration using serial threefold dilutions of allergen extract.
Extended Data Fig. 3. IL-33 activates ST2+ Treg cells in the lung after HDM exposure.

a-c, Wild-type (WT) and Il33−/− mice were treated with HDM i.n. on days 0 and 7–11 and analyzed on day 10. a, Representative flow cytometry for Foxp3 and ST2 in CD4+ T cells from lung parenchyma. b, Percentage of ST2+ Treg cells, ST2− Treg cells, and TH2 (Foxp3−ST2+) cells in the lung. c, Representative histograms showing the expression of the indicated surface markers in ST2+ Treg and TH2 cells from the lung parenchyma of WT (black) and Il33−/− (gray) mice. Data represent one experiment with n = 6 mice per group of two independent experiments in panels (a-c). Unpaired two-tailed t test was used for statistical analysis in panel (b). Error bars denote mean ± s.d. P values are indicated in the figure.
Extended Data Fig. 4. Treg cell-specific deletion of ST2 does not result in systemic alterations in the number or activation of T cells.
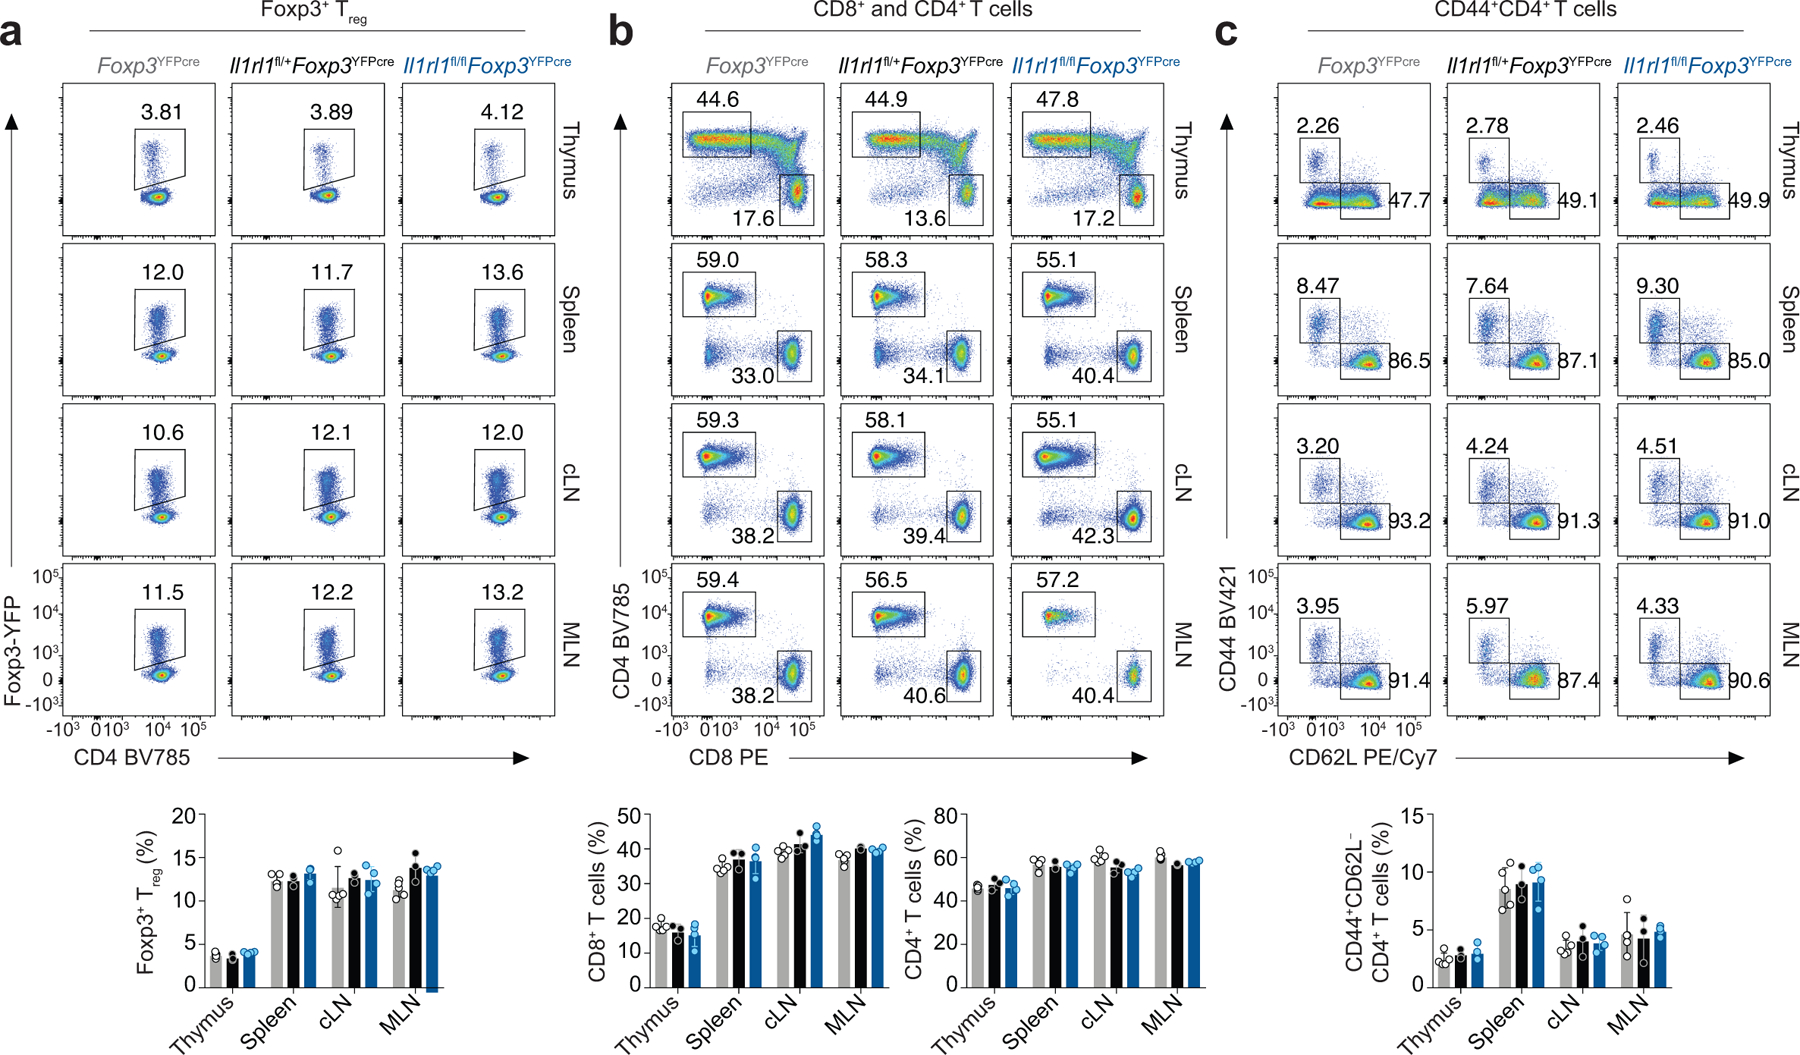
Thymus, spleen, cervical lymph nodes (cLN) and mesenteric lymph nodes (MLN) were harvested from naive Il1rl1fl/flFoxp3YFPcre mice, Il1rl1fl/+Foxp3YFPcre mice, and Il1rl1+/+Foxp3YFPcre (Foxp3YFPcre) littermate control mice for flow cytometric analysis. a, Representative flow cytometry for Foxp3 and CD4 in CD4+ T cells (top) and percentage of Foxp3+ Treg cells (bottom) from the indicated tissues. b, Representative flow cytometry for CD8 and CD4 in CD3+ T cells (top) and percentage of CD8+ T cells and CD4+ T cells (bottom) from the indicated tissues. c, Representative flow cytometry for CD44 and CD62L in CD4+ T cells (top) and percentage of CD44+CD4+ T cells (bottom) from the indicated tissues. Data represent one experiment (Foxp3YFPcre n = 5; Il1rl1fl/+Foxp3YFPcre n = 3; Il1rl1fl/flFoxp3YFPcre n = 4 mice per group) of two independent experiments in panels (a-c). Unpaired two-tailed t test with Holm-Sidak correction for multiple comparisons was used for statistical analysis in panels (a-c bottom). No statistical difference was found. Error bars denote mean ± s.d.
Extended Data Fig. 5. Immune response in the lung to HDM in mice with a Treg cell-specific deletion of ST2.
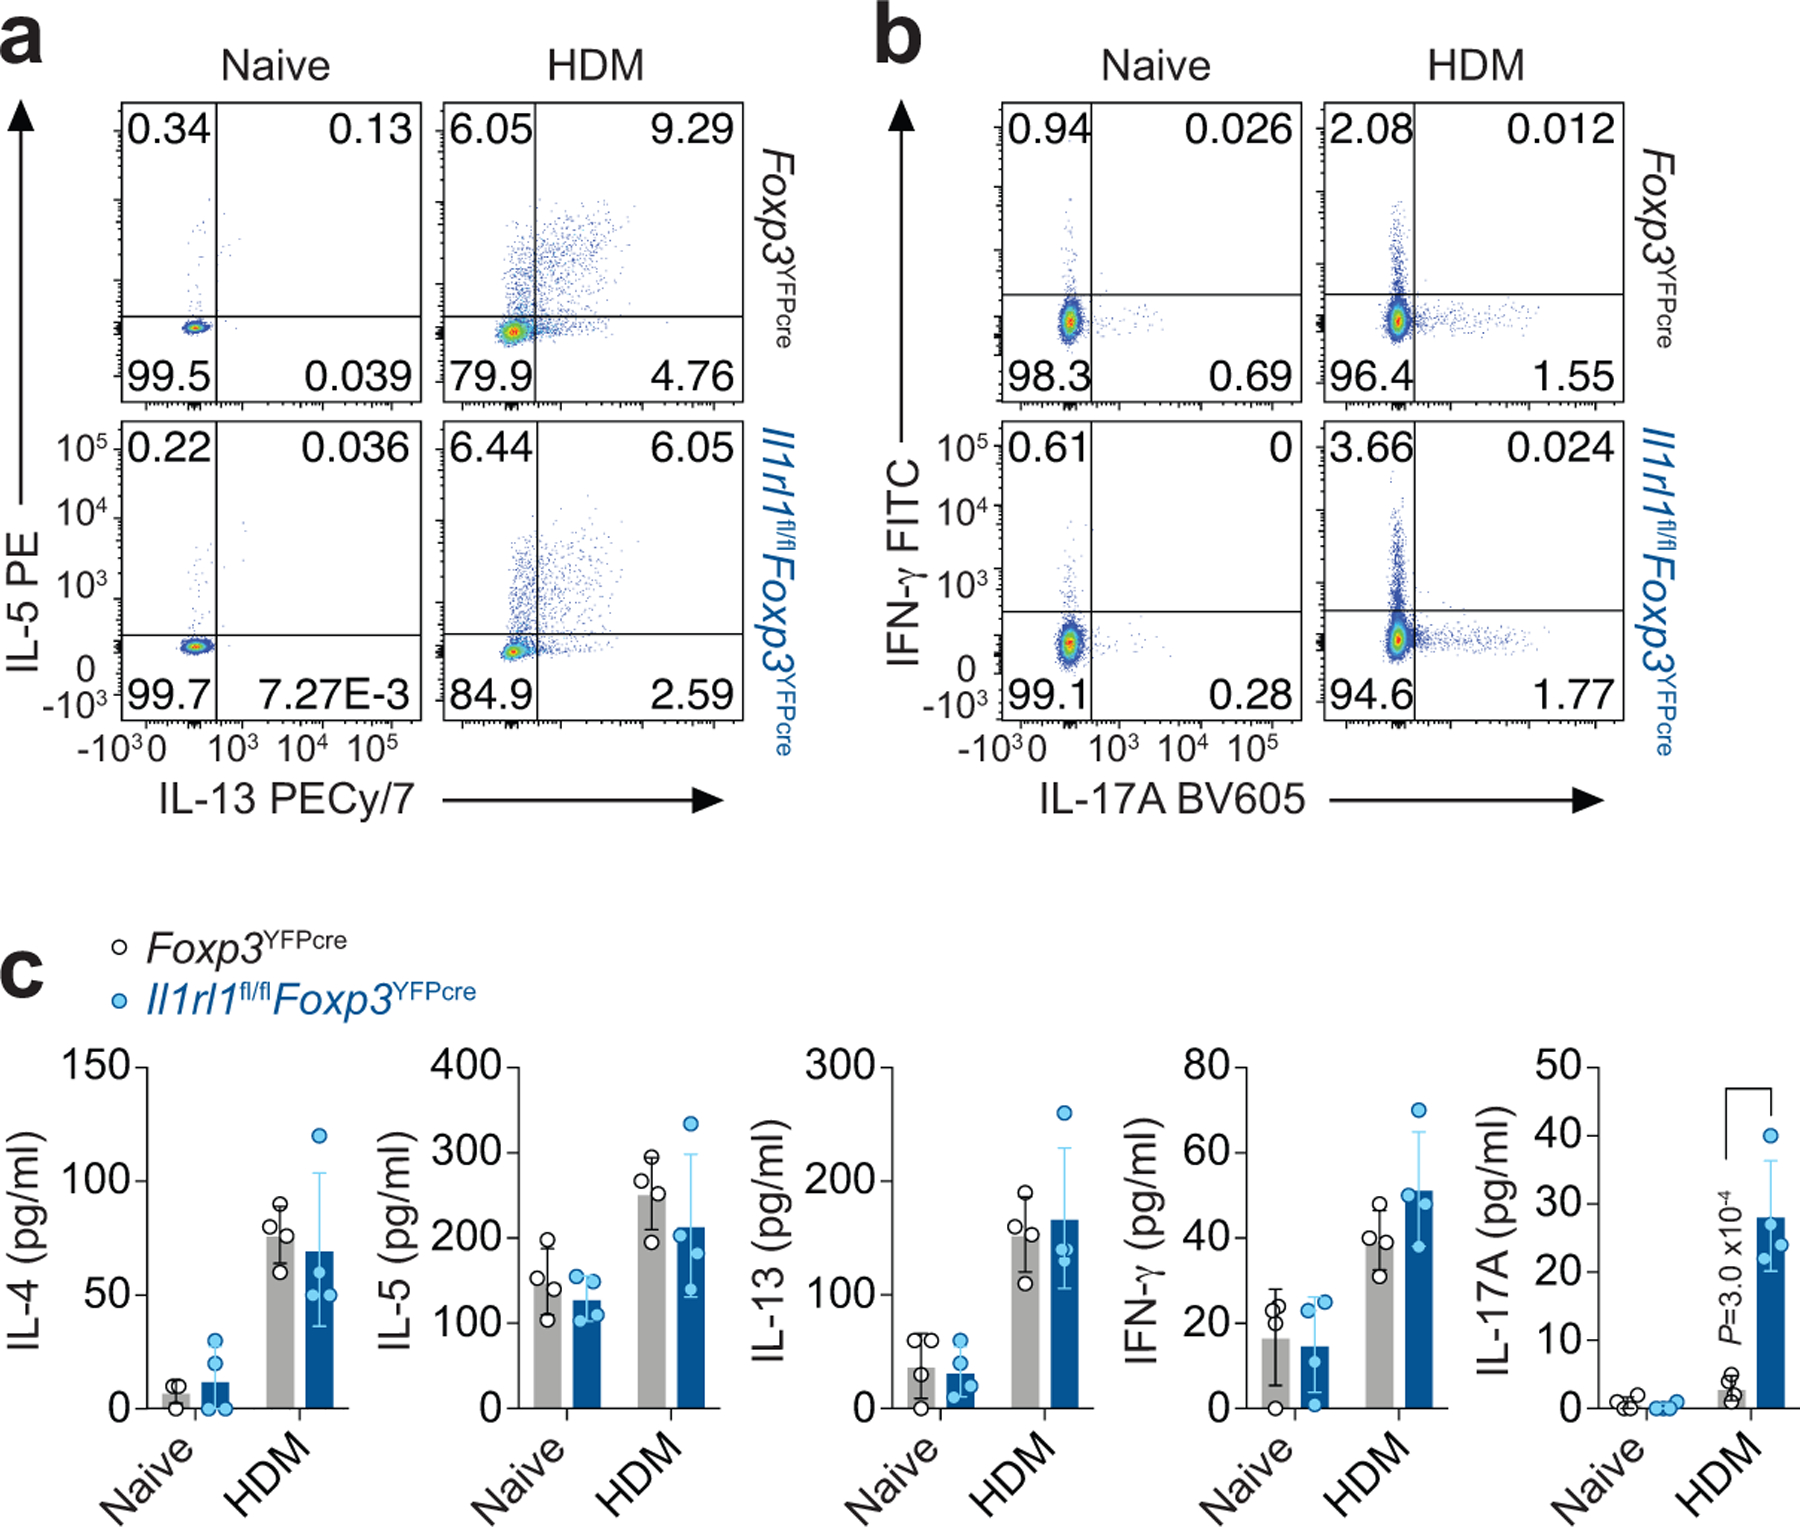
a-c, Il1rl1fl/flFoxp3YFPcre mice and Foxp3YFPcre littermate controls were left untreated (Naive) or were treated with HDM i.n. on days 0 and 7–11 and analyzed on day 14. a,b, Representative flow cytometry for IL-13 and IL-5 (a) and for IFN-γ and IL-17A (b) in CD4+Foxp3− (TH) cells from lung parenchyma. Data represent one experiment with n = 5 mice per group of two independent experiments in panels (a,b). c, Lung explants from Naive and HDM-treated mice were re-stimulated ex vivo with HDM and the indicated cytokines measured in culture supernatants 72 h later by ELISA. Data represent one experiment with n = 4 mice per group of two independent experiments. Unpaired two-tailed t test with Holm-Sidak correction for multiple comparisons was used for statistical analysis. Error bars denote mean ± s.d. P values are indicated in the figure.
Extended Data Fig. 6. Innate lymphocyte response in the lung to HDM.
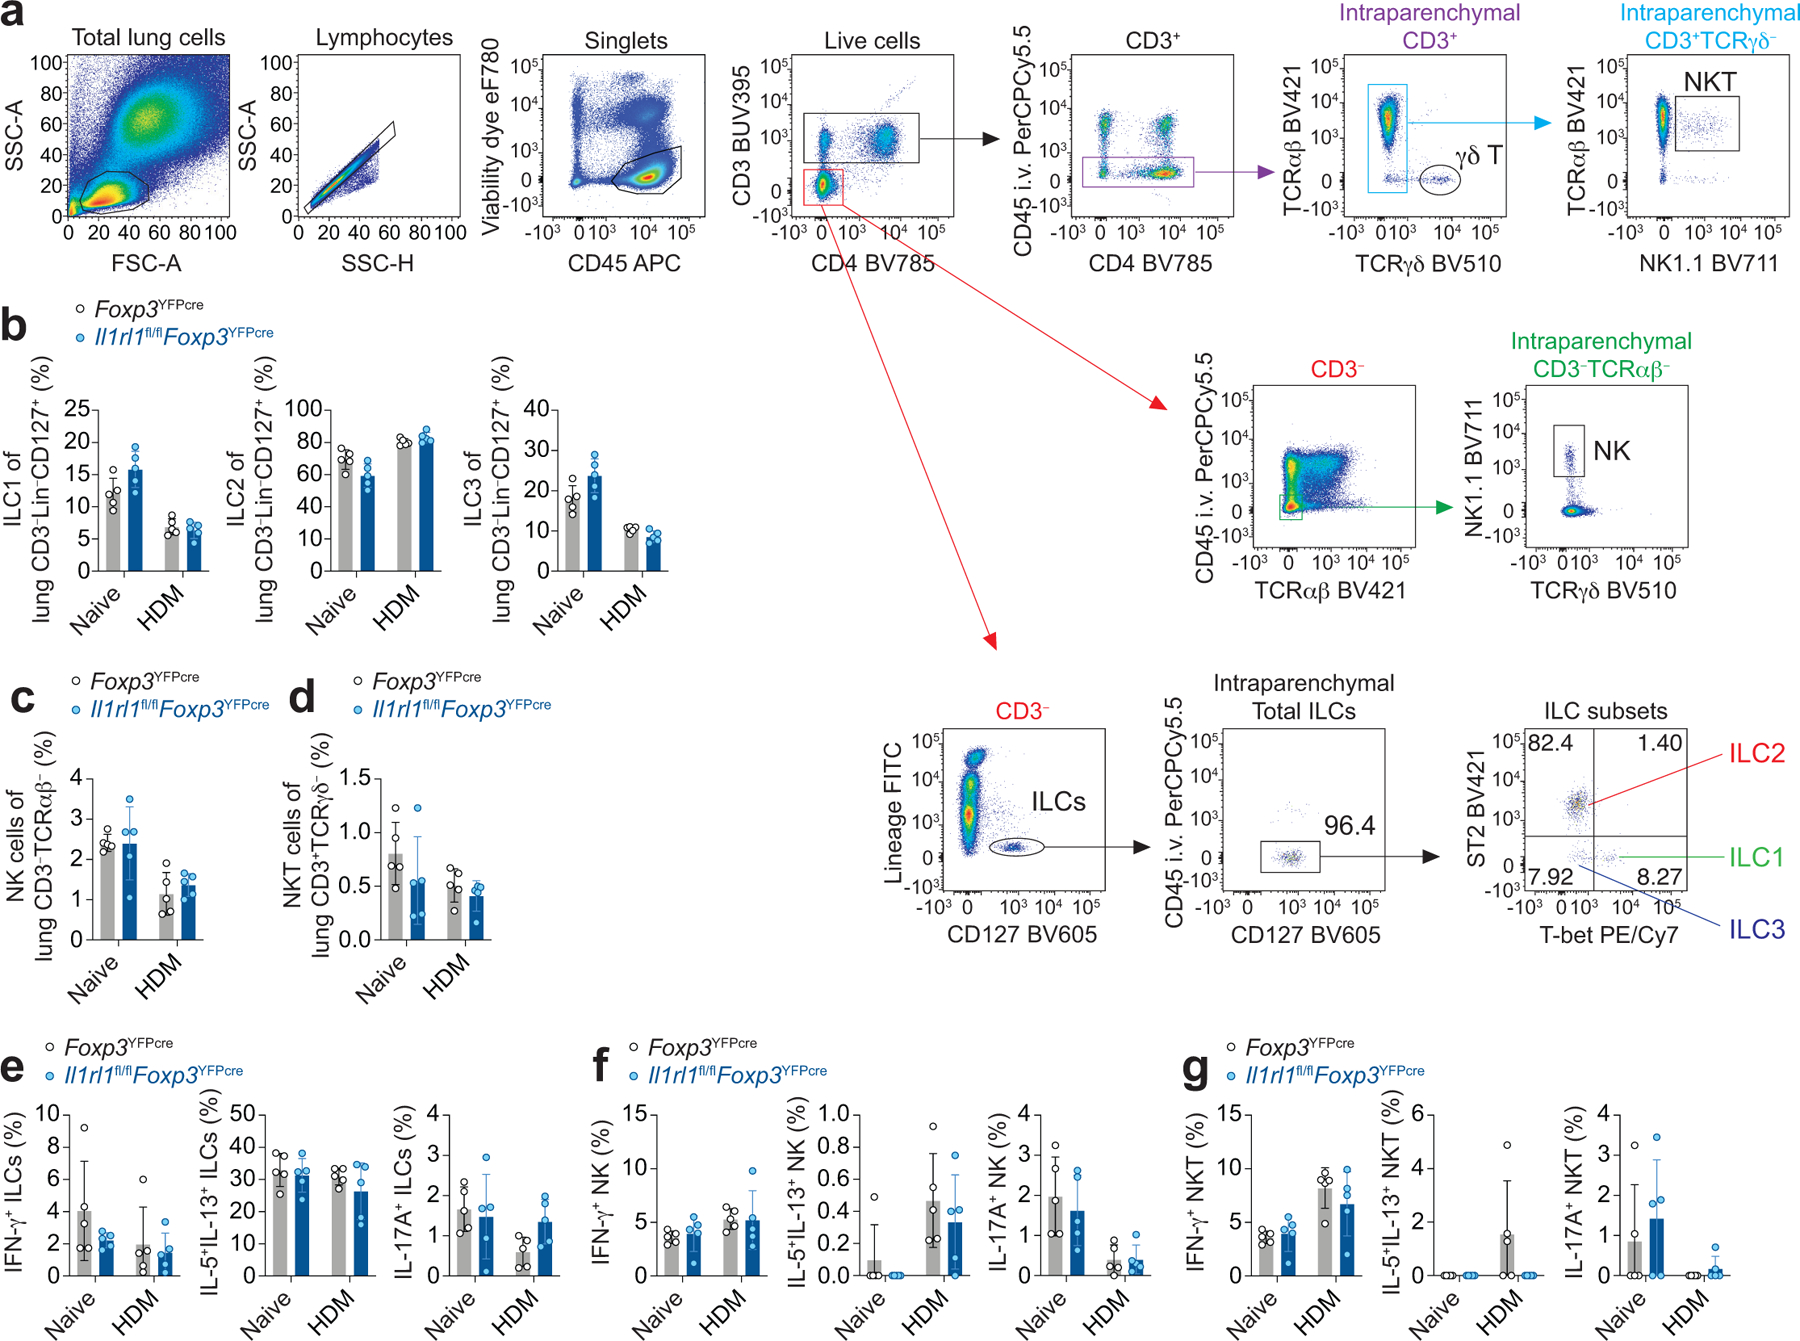
a-g, Il1rl1fl/flFoxp3YFPcre mice and Foxp3YFPcre littermate controls were left untreated (Naive) or were treated with HDM i.n. on days 0 and 7–11 and analyzed on day 14. a, Gating strategy for flow cytometric analysis of innate lymphocytes in lung parenchyma. b-d, Percentage of ILC1 (T-bet+), ILC2 (ST2+), and ILC3 (ST2−T-bet−) of CD3−Lin−CD127+ cells (b), percentage of natural killer (NK) cells of CD3−TCRαβ− cells (c), and percentage of NKT cells of CD3+TCRγδ− cells (d) in the lung parenchyma. e-g, Percentage of lung ILCs (e), NK (f), and NKT cells (g) expressing IL-13 and IL-5, IFN-γ, or IL-17A. Data represent one experiment with n = 5 mice per group of three independent experiments in panels (b-g). Unpaired two-tailed t test with Holm-Sidak correction for multiple comparisons was used for statistical analysis in panels (b-g). No statistical difference was found. Error bars denote mean ± s.d.
Extended Data Fig. 7. Lung and airway inflammatory response to HDM and A. alternata in mice with a Treg cell-specific deletion of ST2.
a,b, Il1rl1fl/flFoxp3YFPcre mice and Foxp3YFPcre littermate controls were left untreated (Naive) or were treated with HDM i.n. on days 0 and 7–11 and analyzed on day 14. a, Gating strategy for flow cytometric analysis of eosinophils (CD11c−Siglec-F+), neutrophils (Siglec-F−CD11b+Ly6G+), and Ly6C+ inflammatory monocytes (Ly6C+ iMo, Siglec-F−CD11b+Ly6C+) in the lung parenchyma of HDM-treated mice. b, Quantification of cell differential counts in BAL. Mn - Mononuclear cells; Ne - Neutrophils; Eo - Eosinophils. Data represent one experiment (Foxp3YFPcre Naive n = 3; Foxp3YFPcre HDM n = 5; Il1rl1fl/flFoxp3YFPcre Naive n = 3; Il1rl1fl/flFoxp3YFPcre HDM n = 5 mice per group) of two independent experiments. Unpaired two-tailed t test with Holm-Sidak correction for multiple comparisons was used for statistical analysis. c, Il1rl1fl/flFoxp3YFPcre mice and Foxp3YFPcre littermate controls were treated with A. alternata i.n. on days 0, 1 and 17–19 and analyzed on day 20. Gating strategy for flow cytometric analysis of eosinophils and neutrophils in the lung parenchyma of A. alternata-treated mice. Error bars denote mean ± s.d. P values are indicated in the figure.
Extended Data Fig. 8. Decreased lung CCL11 and CCL24 and allergic pulmonary inflammation in γδ T cell-deficient mice.
a-c, TCRγδ-deficient (Tcrd−/−) and WT mice were treated with HDM i.n. on days 0 and 7–11 and analyzed on day 14. a, Lung Ccl11 and Ccl24 mRNA levels relative to β2M determined by RT-qPCR. Data represent one experiment with n = 4 mice per group of two independent experiments. b, Number of eosinophils (CD11c−Siglec-F+) and neutrophils (Siglec-F−CD11b+Ly6G+) in lung parenchyma. c, Quantification of cell differential counts in BAL. Mn - Mononuclear cells; Ne - Neutrophils; Eo - Eosinophils. Data represent one experiment (WT n = 5; Tcrd−/− n = 6 mice per group) of two independent experiments in panels (b,c). Unpaired two-tailed t test was used for statistical analysis in panels (a,b) and unpaired two-tailed t test with Holm-Sidak correction for multiple comparisons was used for statistical analysis in panel (c). Error bars denote mean ± s.d. P values are indicated in the figure.
Extended Data Fig. 9. ST2+ Treg cell-derived Ebi3 suppresses γδ T cell responses in the lung to influenza infection.
a-d, Foxp3YFPcre, Il1rl1fl/flFoxp3YFPcre and Ebi3fl/flFoxp3YFPcre mice were infected with PR8 influenza and lungs were harvested for flow cytometry analysis in the indicated time points. a, Representative flow cytometry for IL-17A and IFN-γ in γδ T cells from lung parenchyma on day 11 post-infection. b, Number of IL-17A+ γδ T cells in the lung over the course of infection. Data pooled from two independent experiments (day 0: Foxp3YFPcre n = 5 and Il1rl1fl/flFoxp3YFPcre n = 4; day 4: Foxp3YFPcre n = 18 and Il1rl1fl/flFoxp3YFPcre n = 16; day 7: Foxp3YFPcre n = 10 and Il1rl1fl/flFoxp3YFPcre n = 12; day 11: Foxp3YFPcre n = 9 and Il1rl1fl/flFoxp3YFPcre n = 9 mice from the two experiments in each time point). Unpaired two-tailed t test with Holm-Sidak correction for multiple comparisons was used for statistical analysis in panel (b). c, Representative flow cytometry for TCRαβ and TCRγδ in CD3+ T cells (top) and for IL-17A and IFN-γ in γδ T cells (bottom) from lung parenchyma on day 7 post-infection. d, Number of lung IL-17A+ γδ T cells. Data pooled from two independent experiments (Foxp3YFPcre n = 10; Il1rl1fl/flFoxp3YFPcre n = 8; Ebi3fl/flFoxp3YFPcre n = 10 mice from the two experiments) in panel (d). Ordinary one-way ANOVA with Tukey’s multiple comparisons test was used for statistical analysis in panel (d). Error bars denote mean ± s.d. P values are indicated in the figure.
Acknowledgements
We thank R. Lee for providing Il1rl1fl/fl mice and L. Wu for providing Il33−/− mice. This work was supported by grants from National Institutes of Health to A.D.L. (R01AI040618, U19AI095261, T32HL116275), J.W.G. (K08AI125816), and R.A.R. (K08 HL140173), and from National Council of Scientific Development and Technology to L.D.F (CNPq, 237062/2012-7).
Footnotes
Competing Interests
The authors declare no competing interests.
Reporting Summary
Further information on research design is available in the Nature Research Reporting Summary linked to this article.
Data availability
The data generated or analyzed to support the findings of this study are available from the corresponding author upon request without restrictions. Source data for NanoString are included with the manuscript as a Source Data File.
References (main text only)
- 1.Brunkow ME et al. Disruption of a new forkhead/winged-helix protein, scurfin, results in the fatal lymphoproliferative disorder of the scurfy mouse. Nat Genet 27, 68–73 (2001). [DOI] [PubMed] [Google Scholar]
- 2.Kim JM, Rasmussen JP & Rudensky AY Regulatory T cells prevent catastrophic autoimmunity throughout the lifespan of mice. Nat Immunol 8, 191–197 (2007). [DOI] [PubMed] [Google Scholar]
- 3.Campbell DJ & Koch MA Phenotypical and functional specialization of FOXP3+ regulatory T cells. Nat Rev Immunol 11, 119–130 (2011). [DOI] [PMC free article] [PubMed] [Google Scholar]
- 4.Burzyn D et al. A special population of regulatory T cells potentiates muscle repair. Cell 155, 1282–1295 (2013). [DOI] [PMC free article] [PubMed] [Google Scholar]
- 5.Arpaia N et al. A Distinct Function of Regulatory T Cells in Tissue Protection. Cell 162, 1078–1089 (2015). [DOI] [PMC free article] [PubMed] [Google Scholar]
- 6.Josefowicz SZ, Lu LF & Rudensky AY Regulatory T cells: mechanisms of differentiation and function. Annu Rev Immunol 30, 531–564 (2012). [DOI] [PMC free article] [PubMed] [Google Scholar]
- 7.Panduro M, Benoist C & Mathis D Tissue Tregs. Annu Rev Immunol 34, 609–633 (2016). [DOI] [PMC free article] [PubMed] [Google Scholar]
- 8.Curotto de Lafaille MA & Lafaille JJ Natural and adaptive foxp3+ regulatory T cells: more of the same or a division of labor? Immunity 30, 626–635 (2009). [DOI] [PubMed] [Google Scholar]
- 9.Fang D & Zhu J Dynamic balance between master transcription factors determines the fates and functions of CD4 T cell and innate lymphoid cell subsets. J Exp Med 214, 1861–1876 (2017). [DOI] [PMC free article] [PubMed] [Google Scholar]
- 10.Koch MA et al. The transcription factor T-bet controls regulatory T cell homeostasis and function during type 1 inflammation. Nat Immunol 10, 595–602 (2009). [DOI] [PMC free article] [PubMed] [Google Scholar]
- 11.Sefik E et al. MUCOSAL IMMUNOLOGY. Individual intestinal symbionts induce a distinct population of RORgamma(+) regulatory T cells. Science 349, 993–997 (2015). [DOI] [PMC free article] [PubMed] [Google Scholar]
- 12.Xu M et al. c-MAF-dependent regulatory T cells mediate immunological tolerance to a gut pathobiont. Nature 554, 373–377 (2018). [DOI] [PMC free article] [PubMed] [Google Scholar]
- 13.Levine AG et al. Stability and function of regulatory T cells expressing the transcription factor T-bet. Nature 546, 421–425 (2017). [DOI] [PMC free article] [PubMed] [Google Scholar]
- 14.Kuswanto W et al. Poor Repair of Skeletal Muscle in Aging Mice Reflects a Defect in Local, Interleukin-33-Dependent Accumulation of Regulatory T Cells. Immunity 44, 355–367 (2016). [DOI] [PMC free article] [PubMed] [Google Scholar]
- 15.Schiering C et al. The alarmin IL-33 promotes regulatory T-cell function in the intestine. Nature 513, 564–568 (2014). [DOI] [PMC free article] [PubMed] [Google Scholar]
- 16.Liew FY, Girard JP & Turnquist HR Interleukin-33 in health and disease. Nat Rev Immunol 16, 676–689 (2016). [DOI] [PubMed] [Google Scholar]
- 17.Martin NT & Martin MU Interleukin 33 is a guardian of barriers and a local alarmin. Nat Immunol 17, 122–131 (2016). [DOI] [PubMed] [Google Scholar]
- 18.Guo L et al. Innate immunological function of TH2 cells in vivo. Nat Immunol 16, 1051–1059 (2015). [DOI] [PMC free article] [PubMed] [Google Scholar]
- 19.Molofsky AB, Savage AK & Locksley RM Interleukin-33 in Tissue Homeostasis, Injury, and Inflammation. Immunity 42, 1005–1019 (2015). [DOI] [PMC free article] [PubMed] [Google Scholar]
- 20.Cayrol C et al. Environmental allergens induce allergic inflammation through proteolytic maturation of IL-33. Nat Immunol 19, 375–385 (2018). [DOI] [PubMed] [Google Scholar]
- 21.Delacher M et al. Genome-wide DNA-methylation landscape defines specialization of regulatory T cells in tissues. Nat Immunol 18, 1160–1172 (2017). [DOI] [PMC free article] [PubMed] [Google Scholar]
- 22.Galkina E et al. Preferential migration of effector CD8+ T cells into the interstitium of the normal lung. J Clin Invest 115, 3473–3483 (2005). [DOI] [PMC free article] [PubMed] [Google Scholar]
- 23.Van Dyken SJ et al. A tissue checkpoint regulates type 2 immunity. Nat Immunol 17, 1381–1387 (2016). [DOI] [PMC free article] [PubMed] [Google Scholar]
- 24.Hondowicz BD et al. Interleukin-2-Dependent Allergen-Specific Tissue-Resident Memory Cells Drive Asthma. Immunity 44, 155–166 (2016). [DOI] [PMC free article] [PubMed] [Google Scholar]
- 25.Guo L et al. IL-1 family members and STAT activators induce cytokine production by Th2, Th17, and Th1 cells. Proc Natl Acad Sci U S A 106, 13463–13468 (2009). [DOI] [PMC free article] [PubMed] [Google Scholar]
- 26.Kuperman DA et al. Direct effects of interleukin-13 on epithelial cells cause airway hyperreactivity and mucus overproduction in asthma. Nat Med 8, 885–889 (2002). [DOI] [PubMed] [Google Scholar]
- 27.Valladao AC, Frevert CW, Koch LK, Campbell DJ & Ziegler SF STAT6 Regulates the Development of Eosinophilic versus Neutrophilic Asthma in Response to Alternaria alternata. J Immunol 197, 4541–4551 (2016). [DOI] [PMC free article] [PubMed] [Google Scholar]
- 28.Collison LW et al. The inhibitory cytokine IL-35 contributes to regulatory T-cell function. Nature 450, 566–569 (2007). [DOI] [PubMed] [Google Scholar]
- 29.Vignali DA & Kuchroo VK IL-12 family cytokines: immunological playmakers. Nat Immunol 13, 722–728 (2012). [DOI] [PMC free article] [PubMed] [Google Scholar]
- 30.Whitehead GS et al. IL-35 production by inducible costimulator (ICOS)-positive regulatory T cells reverses established IL-17-dependent allergic airways disease. J Allergy Clin Immunol 129, 207–215 e201–205 (2012). [DOI] [PMC free article] [PubMed] [Google Scholar]
- 31.Saenz SA, Taylor BC & Artis D Welcome to the neighborhood: epithelial cell-derived cytokines license innate and adaptive immune responses at mucosal sites. Immunol Rev 226, 172–190 (2008). [DOI] [PMC free article] [PubMed] [Google Scholar]
- 32.Ohnmacht C et al. MUCOSAL IMMUNOLOGY. The microbiota regulates type 2 immunity through RORgammat(+) T cells. Science 349, 989–993 (2015). [DOI] [PubMed] [Google Scholar]
- 33.Thornton AM et al. Expression of Helios, an Ikaros transcription factor family member, differentiates thymic-derived from peripherally induced Foxp3+ T regulatory cells. J Immunol 184, 3433–3441 (2010). [DOI] [PMC free article] [PubMed] [Google Scholar]
- 34.Weiss JM et al. Neuropilin 1 is expressed on thymus-derived natural regulatory T cells, but not mucosa-generated induced Foxp3+ T reg cells. J Exp Med 209, 1723–1742, S1721 (2012). [DOI] [PMC free article] [PubMed] [Google Scholar]
- 35.Halim TY et al. Group 2 innate lymphoid cells are critical for the initiation of adaptive T helper 2 cell-mediated allergic lung inflammation. Immunity 40, 425–435 (2014). [DOI] [PMC free article] [PubMed] [Google Scholar]
- 36.Chesne J et al. IL-17 in severe asthma. Where do we stand? Am J Respir Crit Care Med 190, 1094–1101 (2014). [DOI] [PubMed] [Google Scholar]
- 37.Nakae S et al. Antigen-specific T cell sensitization is impaired in IL-17-deficient mice, causing suppression of allergic cellular and humoral responses. Immunity 17, 375–387 (2002). [DOI] [PubMed] [Google Scholar]
- 38.Al-Ramli W et al. T(H)17-associated cytokines (IL-17A and IL-17F) in severe asthma. J Allergy Clin Immunol 123, 1185–1187 (2009). [DOI] [PubMed] [Google Scholar]
- 39.Zuany-Amorim C et al. Requirement for gammadelta T cells in allergic airway inflammation. Science 280, 1265–1267 (1998). [DOI] [PubMed] [Google Scholar]
- 40.Schnyder-Candrian S et al. Interleukin-17 is a negative regulator of established allergic asthma. J Exp Med 203, 2715–2725 (2006). [DOI] [PMC free article] [PubMed] [Google Scholar]
- 41.Hellings PW et al. Interleukin-17 orchestrates the granulocyte influx into airways after allergen inhalation in a mouse model of allergic asthma. Am J Respir Cell Mol Biol 28, 42–50 (2003). [DOI] [PubMed] [Google Scholar]
- 42.Chenuet P et al. Neutralization of either IL-17A or IL-17F is sufficient to inhibit house dust mite induced allergic asthma in mice. Clin Sci (Lond) 131, 2533–2548 (2017). [DOI] [PubMed] [Google Scholar]
- 43.Murdoch JR & Lloyd CM Resolution of allergic airway inflammation and airway hyperreactivity is mediated by IL-17-producing {gamma}{delta}T cells. Am J Respir Crit Care Med 182, 464–476 (2010). [DOI] [PMC free article] [PubMed] [Google Scholar]
- 44.Fulkerson PC et al. A central regulatory role for eosinophils and the eotaxin/CCR3 axis in chronic experimental allergic airway inflammation. Proc Natl Acad Sci U S A 103, 16418–16423 (2006). [DOI] [PMC free article] [PubMed] [Google Scholar]
- 45.Raredon MSB et al. Single-cell connectomic analysis of adult mammalian lungs. Sci Adv 5, eaaw3851 (2019). [DOI] [PMC free article] [PubMed] [Google Scholar]
- 46.Saleh A, Shan L, Halayko AJ, Kung S & Gounni AS Critical role for STAT3 in IL-17A-mediated CCL11 expression in human airway smooth muscle cells. J Immunol 182, 3357–3365 (2009). [DOI] [PubMed] [Google Scholar]
- 47.Severa M et al. The transcriptional repressor BLIMP1 curbs host defenses by suppressing expression of the chemokine CCL8. J Immunol 192, 2291–2304 (2014). [DOI] [PMC free article] [PubMed] [Google Scholar]
- 48.Ebert LM, Meuter S & Moser B Homing and function of human skin gammadelta T cells and NK cells: relevance for tumor surveillance. J Immunol 176, 4331–4336 (2006). [DOI] [PubMed] [Google Scholar]
- 49.Kohlgruber AC et al. gammadelta T cells producing interleukin-17A regulate adipose regulatory T cell homeostasis and thermogenesis. Nat Immunol 19, 464–474 (2018). [DOI] [PMC free article] [PubMed] [Google Scholar]
- 50.Guo XJ et al. Lung gammadelta T Cells Mediate Protective Responses during Neonatal Influenza Infection that Are Associated with Type 2 Immunity. Immunity 49, 531–544 e536 (2018). [DOI] [PMC free article] [PubMed] [Google Scholar]
References (methods only)
- 51.Itohara S et al. T cell receptor delta gene mutant mice: independent generation of alpha beta T cells and programmed rearrangements of gamma delta TCR genes. Cell 72, 337–348 (1993). [DOI] [PubMed] [Google Scholar]
- 52.Rubtsov YP et al. Regulatory T cell-derived interleukin-10 limits inflammation at environmental interfaces. Immunity 28, 546–558 (2008). [DOI] [PubMed] [Google Scholar]
- 53.Oboki K et al. IL-33 is a crucial amplifier of innate rather than acquired immunity. Proc Natl Acad Sci U S A 107, 18581–18586 (2010). [DOI] [PMC free article] [PubMed] [Google Scholar]
- 54.Chen WY, Hong J, Gannon J, Kakkar R & Lee RT Myocardial pressure overload induces systemic inflammation through endothelial cell IL-33. Proc Natl Acad Sci U S A 112, 7249–7254 (2015). [DOI] [PMC free article] [PubMed] [Google Scholar]
- 55.Turnis ME et al. Interleukin-35 Limits Anti-Tumor Immunity. Immunity 44, 316–329 (2016). [DOI] [PMC free article] [PubMed] [Google Scholar]
- 56.Anderson KG et al. Intravascular staining for discrimination of vascular and tissue leukocytes. Nat Protoc 9, 209–222 (2014). [DOI] [PMC free article] [PubMed] [Google Scholar]
- 57.Faustino L et al. Regulatory T cells migrate to airways via CCR4 and attenuate the severity of airway allergic inflammation. J Immunol 190, 2614–2621 (2013). [DOI] [PubMed] [Google Scholar]
- 58.Moon JJ et al. Naive CD4(+) T cell frequency varies for different epitopes and predicts repertoire diversity and response magnitude. Immunity 27, 203–213 (2007). [DOI] [PMC free article] [PubMed] [Google Scholar]
- 59.Legoux FP & Moon JJ Peptide:MHC tetramer-based enrichment of epitope-specific T cells. J Vis Exp (2012). [DOI] [PMC free article] [PubMed] [Google Scholar]
- 60.Lilly CM et al. Eotaxin expression after segmental allergen challenge in subjects with atopic asthma. Am J Respir Crit Care Med 163, 1669–1675 (2001). [DOI] [PubMed] [Google Scholar]
- 61.Thomas SY, Banerji A, Medoff BD, Lilly CM & Luster AD Multiple chemokine receptors, including CCR6 and CXCR3, regulate antigen-induced T cell homing to the human asthmatic airway. J Immunol 179, 1901–1912 (2007). [DOI] [PubMed] [Google Scholar]
- 62.Cho JL et al. Allergic asthma is distinguished by sensitivity of allergen-specific CD4+ T cells and airway structural cells to type 2 inflammation. Sci Transl Med 8, 359ra132 (2016). [DOI] [PMC free article] [PubMed] [Google Scholar]