

Abstract
T follicular helper (Tfh) cells are critical in adaptive immune responses to pathogens and vaccines; however, what drives initiation of their developmental program remains unclear. Studies suggest a T cell antigen receptor (TCR)-dependent mechanism may be responsible for the earliest Tfh-fate decision, but a critical aspect of the TCR has been overlooked: tonic TCR signaling. We hypothesized tonic signaling influences early Tfh cell development. Here, two murine TCR-transgenic CD4+ T cells, LLO56 and LLO118, that recognize the same antigenic-pMHC but experience disparate strengths of tonic signaling, revealed low tonic signaling promotes Tfh cell differentiation. Polyclonal T cells paralleled these findings, with naive Nur77 expression distinguishing Tfh potential. Two mouse lines were also generated to both increase and decrease tonic signaling strength, directly establishing an inverse relationship between tonic signaling strength and Tfh development. Our findings elucidate a central role for tonic TCR signaling in early Tfh-lineage decisions.
INTRODUCTION
Naive CD4+ T cells are responsible for coordinating discrete adaptive immune responses to a diverse array of pathogens. Classically, they accomplish this duty by differentiating into one of the major CD4+ T effector (Teff) cell subsets in response to specific classes of pathogens: T helper (Th) 1, Th2, and Th17. Additionally, naive CD4+ T cells differentiate into T follicular helper (Tfh) cells to mediate T-dependent B cell responses. Tfh cells are critical to initiate and maintain germinal center (GC) reactions, supplying GC B cells with the cytokines and co-stimulatory molecules necessary for somatic hypermutation and affinity maturation of antibodies1, 2, 3.
Tfh cell differentiation requires a progression through developmental stages that are dependent upon many factors, but initial commitment to the Tfh-lineage is determined during the naive T cell priming event4. A bifurcation of CD4+ T cells into Tfh and Teff cells can be detected as soon as 48 hours post-activation in vivo5, 6, 7 and 8 hours post-activation in vitro8. While external cues sustain Tfh-lineage development, the nearly immediate Tfh versus Teff fate polarization post-activation implies a strong role for a cell intrinsic factor as the initial determinant of Tfh outcome. Many groups have studied the possibility that TCR avidity for antigenic-pMHC is instructing early Tfh fate decisions8, 9, 10, 11, 12, 13, 14; however, the field has been contentious in its findings. Some studies suggest strong TCR avidity for antigenic-pMHC promotes Tfh development8, 9, 10, others have concluded the opposite11, 12, and still others have found no effect13, 14. We wondered whether another TCR-dependent element of T cells was complicating these findings: basal, peripheral TCR signaling in response to self-pMHC (tonic signaling).
After positive selection, mature CD4+ T cells exit the thymus and circulate in the periphery where they survey pMHC, which, in the absence of an immune challenge, will be occupied by self-peptide. Tonic signaling does not propagate canonical T cell activation; yet, these weaker TCR interactions still affect basal signaling, gene expression, and metabolic activity15, 16, 17, 18, 19, 20, 21, 22, 23. Multiple markers (including CD524 and Nur7725, 26) have informed us of a broad spectrum of tonic signaling strengths experienced by the diverse repertoire of TCRs in a polyclonal population, and recent work suggests tonic signaling may be responsible for discretely tuning individual CD4+ T cell responses to foreign antigen15, 27, 28. The focus of these studies, however, was on the Teff cell population. We questioned whether strength of tonic signaling could influence Tfh differentiation. Prior evidence points to a possible connection between tonic signaling strength and the ability of T cells to support B cell responses in vivo18, 29, but there has been no direct interrogation of the role tonic signaling plays in Tfh-fate. Here, we address this question by utilizing a combination of TCRtg models and polyclonal CD4+ T cell analyses to unveil an inverse relationship between the strength of tonic TCR signaling and Tfh development.
RESULTS
Tonic signaling strength distinguishes Tfh development in the LLO model
To explore how tonic signaling strength may affect Tfh development, we utilized the LLO CD4+ TCRtg system as a way to model the behavior of high and low tonic signaling cells responding to the same antigenic-peptide. LLO56 and LLO118 recognize the same immunodominant epitope (LLO190-205/I-Ab, hereafter referred to as LLOp) from Lm with equal affinities, but LLO56 exhibits stronger homeostatic tonic signaling than LLO11816, 30. Using an attenuated actA mutant strain of Lm (actA-Lm) that drives Tfh responses to the immunodominant LLO epitope31, we characterized the kinetics of Tfh development within the two LLO T cell populations during a primary immune response in vivo. B6 mice received a co-injection of naive LLO56 and LLO118 cells the day prior to infection with actA-Lm, and splenocytes were harvested and analyzed by flow cytometry on days 4, 7, and 10 post-infection. Teff, pre-Tfh, and Tfh cell populations were analyzed within the activated (CD44hi) CD4+ T cell population based on surface expression of PD-1 and CXCR531 (Fig. 1a and Supplemental Fig. 1). We observed striking differences in the ability of the LLO T cells to generate a CXCR5hi/PD-1hi Tfh subset, with an apparent extreme deficiency by LLO56 (Fig. 1a,b). In the LLO118 population, a Tfh subset appeared as early as d4 post-infection, peaked at d7, and was drastically reduced by d10. In contrast, the LLO56 population had a barely-detectable Tfh subset at all time-points post-infection (Fig. 1b). Total LLO118 cell numbers were significantly greater than LLO56 (Fig. 1c), consistent with previous observations28, 30. This resulted in a severe total Tfh number contrast between the two LLO T cell populations throughout the primary immune response (Fig. 1d).
Figure 1. High and low tonic signaling cells (LLO56 and LLO118, respectively) generate equivalent Th1 immune responses, but differ in their ability to produce a Tfh population.
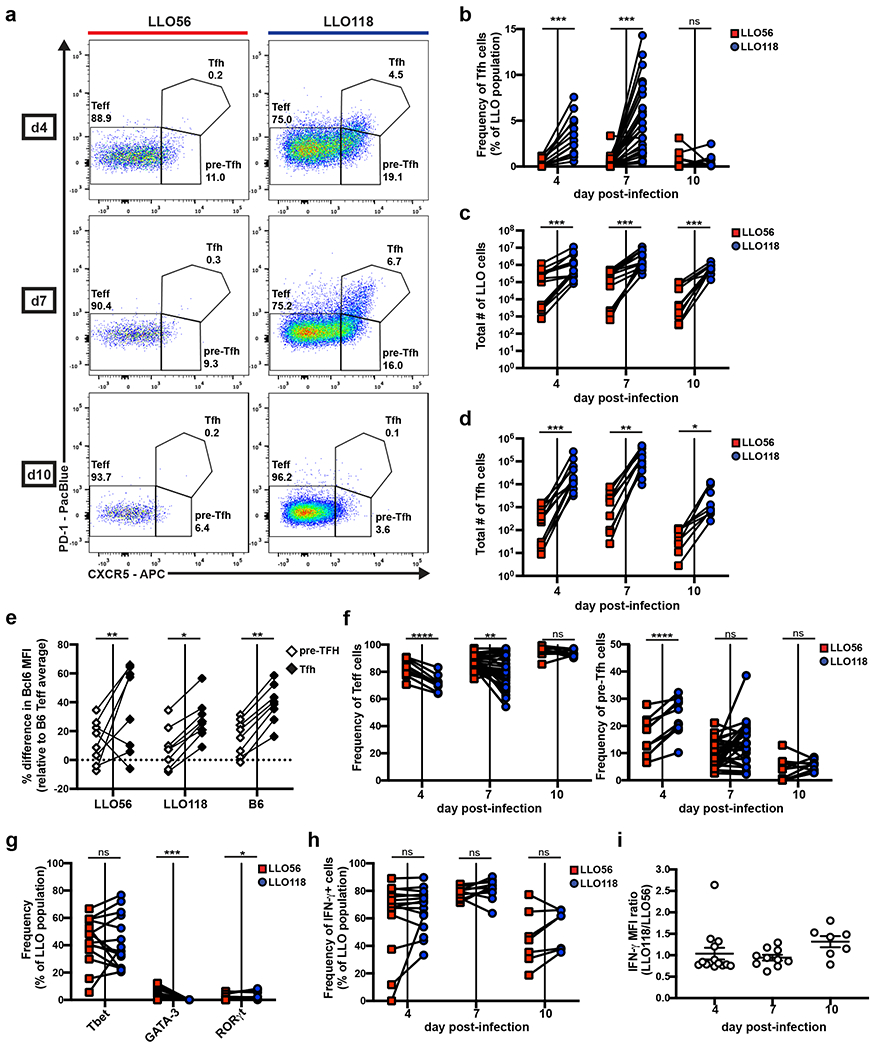
20,000-100,000 naive LLO56 and LLO118 cells were co-transferred into recipient B6 mice and then infected with actA-Lm the following day. Spleens were harvested on the indicated days post-infection for flow cytometry analysis of the activated LLO T cell populations (Supplemental Fig.1). Data collected from each individual recipient mouse are paired. a, Representative flow plots depicting Teff, pre-Tfh, and Tfh PD-1/CXCR5 gating strategies. Numbers shown are the frequency of each subset within the activated LLO parent population. b, Quantification of the frequency of Tfh cells. Three independent experiments for day 4 (n=13), eight for day 7 (n=31), and two for day 10 (n=10). c, Total numbers of activated LLO T cells. Three independent experiments for days 4 (n=13) and 7 (n=14), two for day 10 (n=10). d, Total numbers of LLO Tfh cells from the same experiments as in (c). e, Percentage difference in Bcl6 MFI of the paired pre-Tfh and Tfh subsets for each genotype relative to the average B6 Teff subset at day 7 post-infection. Data are from the same experiments as in (c) and exclude mice with no LLO56 Tfh generation. f, The frequency of Teff and pre-Tfh cells from the same experiments as in (b). g, LLO T cells were assessed for Tbet, GATA-3, and RORγt expression via intracellular staining at day 7 post-infection. Three independent experiments (n=14) are shown. h, Splenocytes were stimulated with PMA and ionomycin before intracellular cytokine staining was performed to assess frequency and i, MFI of IFN-γ expression in the activated LLO populations. Three independent experiments for days 4 (n=15) and 7 (n=14) and two for day 10 (n=7). MFI data shows the mean ± SEM. ****p < 0.0001, ***p < 0.001, **p < 0.01, *p < 0.05. Paired t test or Wilcoxon matched-pairs signed rank test for nonnormally distributed data (b-d, f-h). Two-way ANOVA using tukey’s multiple comparisons test for comparison of subsets across genotypes and Sidak’s multiple comparisons test for comparisons among subsets within each genotype (e). One-way ANOVA analysis (i).
To validate our Tfh gating strategy, we analyzed Bcl6 expression in the Teff, pre-Tfh, and Tfh cellular subsets for the LLO and B6 CD4+ T cell populations. Bcl6 is the Tfh cell lineage-defining transcription factor32, 33, 34, and pre-Tfh cells express an intermediate amount compared to Teff cells31. We found that Bcl6 followed the expected pattern of expression within each genotype (Teff < pre-Tfh < Tfh), while expression in each distinct cellular subset did not differ across genotypes (LLO56 = LLO118 = B6) (Fig. 1e), confirming PD-1/CXCR5 gating accurately represents the Tfh cells present in the LLO populations.
Given the antagonistic nature of Tfh versus Teff fate decisions, we wanted to know if LLO56 had a commensurate increase in the Teff cellular compartment compared to LLO118. At days 4 and 7 post-infection, there was indeed a greater frequency of Teff cells in the LLO56 population compared to LLO118 (Fig.1f), and LLO56 also had a lower frequency of pre-Tfh cells than LLO118 (Fig. 1f). Given the reduced Tfh frequency in the LLO56 population was not accompanied by an increase in the pre-Tfh compartment, but rather by an increase in the Teff cell subset, we concluded there is differential skewing of Teff versus Tfh fate decisions between the two LLO T cells. Thus, the LLO T cells can be distinguished by both their experienced strength of tonic signaling and their ability to make an early commitment to the Tfh-lineage.
Both LLO T cells generate a dominant Th1 effector response against actA-Lm
We further characterized the Teff subsets of the LLO T cells to determine if tonic signaling was associated with differences in the entire T helper (Th) cell response or if it was selective to Tfh outcome. We activated LLO T cells in vivo as before and analyzed them on day 7 post-infection for expression of the three classic Th subset master transcription factors: Tbet (Th1), GATA-3 (Th2), and RORγt (Th17)35. Roughly 40% of both LLO T cell populations were expressing Tbet at this time-point (Fig. 1g), displaying an equally dominant Th1 effector phenotype in their response to actA-Lm. Flow cytometry analysis also revealed no differences in the frequency of IFN-γ producing cells between the two LLO populations (Fig. 1h), and IFN-γMFI was also nearly equivalent (Fig. 1i). These data suggest strength of tonic signaling does not affect the quality of Th1 effector responses.
LLO56 and LLO118 have qualitatively distinct Tfh effector profiles
Although not as robust as in the LLO118 population, LLO56 still generated a pre-Tfh subset despite their terminal Tfh differentiation deficiency, so we questioned whether the LLO pre-Tfh subsets were similar and whether both LLO genotypes were capable of performing Tfh effector functions. As early as day 4 post-infection, the LLO56 population had a greatly reduced frequency of ICOS+ cells in their Teff and pre-Tfh compartments when compared to LLO118, although expression of ICOS in the Tfh subset remained consistent between the two LLO T cells (Fig. 2a). Flow cytometry analysis of CD40L revealed an enhanced frequency of CD40L+ cells in the LLO56 pre-Tfh population at day 4 post-infection and in the LLO56 Teff cell population at day 7 post-infection (Fig. 2b). These data suggest LLO56 may be unable to terminally differentiate into the Tfh population due to an early defect in ICOS signaling at the Teff and pre-Tfh phases; however, LLO56 may still support early B cell responses at the T-B border through CD40L co-stimulation.
Figure 2. LLO56 and LLO118 have distinct Tfh effector qualities.
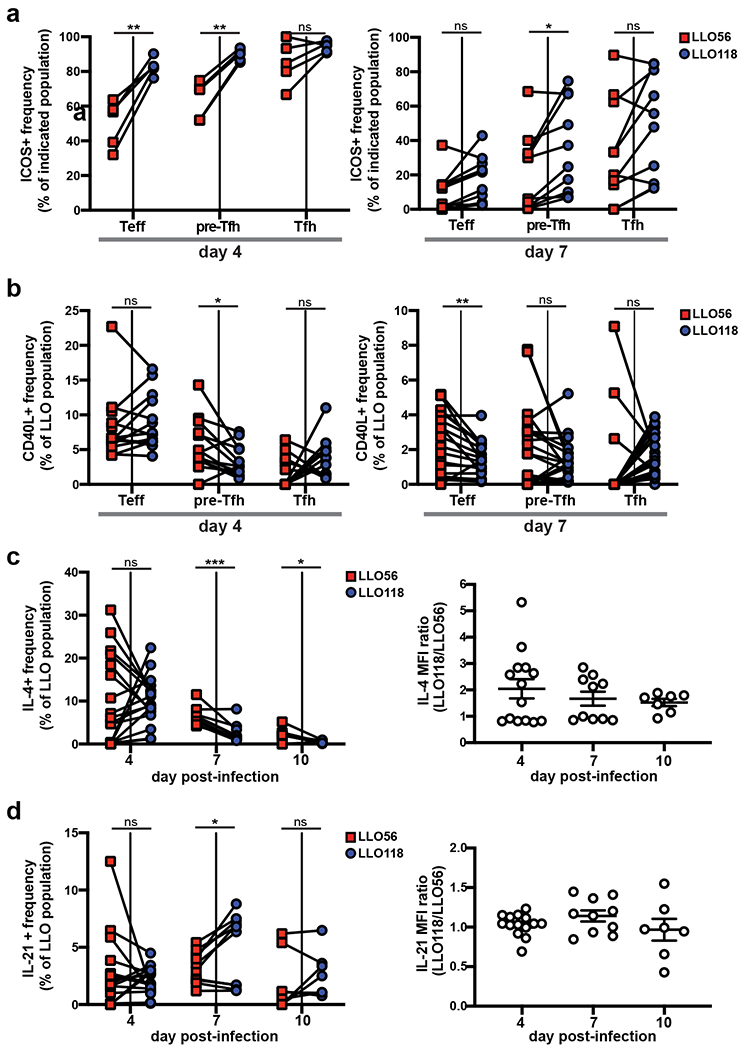
100,000 naive CD4+ T cells of each LLO genotype were co-transferred into recipient B6 mice and infected with actA-Lm the following day. Spleens were harvested post-infection for flow cytometry. a, Frequencies of ICOS+ cells and b, CD40L+ cells in the Teff, pre-Tfh, and Tfh subsets of the LLO populations. Data points from individual recipient mice are paired. Three independent experiments for both days 4 (n=15) and 7 (n=14). c, On the indicated day post-infection, splenocytes were harvested and stimulated with PMA and ionomycin before intracellular cytokine staining was performed. The frequency of cytokine producing cells as well as cytokine MFI, given as a ratio of LLO118/LLO56 for each recipient mouse, are shown for IL-4 and d, IL-21. For both (c) and (d), three independent experiments were performed for day 4 (n=14) and two for days 7 (n=10) and 10 (n=7). MFI data show the mean ± SEM. ***p < 0.001, **p < 0.01, *p < 0.05. Two-way ANOVA or tukey’s multiple comparisons test (a). Paired t test or Wilcoxon matched-pairs signed rank test for nonnormally distributed data (b-d). One-way ANOVA analysis (MFI data for c, d).
Analysis of the LLO T cell populations for production of two critical Tfh effector cytokines, IL-4 and IL-21, revealed a greater percentage of the LLO56 population was capable of producing IL-4 at days 7 and 10 post-infection, although LLO118 cells had a higher per cell production of IL-4, as assessed by MFI (Fig. 2c). IL-21 results contrasted this, as LLO118 cells could produce more IL-21 as a population at day 7 post-infection with no differences in MFI expression between the two LLO T cells (Fig. 2d). These findings suggest differences in Tfh effector qualities between the two LLO T cells.
Development of NP-LLOLT-N to utilize in a cognate LLO T cell:B cell-help model
We sought to examine direct effects the LLO Tfh cells have on the humoral immune response, so we developed a hapten-carrier LLO T cell:B cell-help model. We conjugated the LLO protein to 4-hydroxy-3-nitrophenyl acetyl (NP), which would allow us to assess the NP-specific B cell response as a readout of linked antigen recognition with the LLO T cells. For the conjugation, we utilized a mutated version of LLO, named LLOLT, that abrogates the cytotoxicity of the wildtype protein36. Importantly, the complete activation of LLO56 is dependent upon two flanking residues in the 190-205 epitope (P10 and P11) 30, and P11, a lysine (203), could be conjugated by the NP-OSu ester (Supplemental Fig. 2a). In vitro T cell stimulation assays confirmed NP-LLOLT did not activate LLO56 cells optimally (Supplemental Fig. 2b). We identified potential amino acid substitutions at residue 203 that could ablate NP conjugation while maintaining recognition by LLO56 T cells. Mutating K203 to an asparagine recovered activation effectivity of the haptenated protein to near wildtype LLOLT levels (Supplemental Fig. 2b). Immunizations with NP-LLOLT-N confirmed LLO56 cells could be activated by the hapten conjugate in vivo, and this method elicited the same Tfh outcome as the acute systemic infection had (Supplemental Fig. 2c and Fig. 1a).
Only low tonic signaling cells (LLO118) are able to support long-lived, high-affinity antibody production
To analyze direct effects the LLO T cells had on B cells and the resulting humoral response, we transferred either 3,000 LLO56 or 3,000 LLO118 cells into Tcra−/− recipients one day before immunizing recipient mice with NP-LLOLT-N: this method ensures the only CD4+ T cells able to assist B cells in the immune response are either LLO56 or LLO118. Immunization resulted in similar LLO Tfh differentiation patterns as the actA-Lm infection method, where LLO56 cells had a significantly lower Tfh frequency and total number of Tfh cells than LLO118 (Fig. 3a–c). At day 7 post-immunization, there were also fewer NP+-GC B cells in recipient mice that had received transfers of LLO56 cells (Fig. 3d and Supplementary Fig. 3a for gating strategy). Fluorescence imaging of whole spleen sections supported these results. We detected GCs at d7 post-immunization (Fig. 3e), and quantification of the total number of GCs/spleen volume revealed significant differences in GC abundance between LLO56- and LLO118-assisted recipients at d7 and d10 post-immunization (Fig. 3f). Tcra−/− mice that had received no T cells but were still immunized served as a control to determine the baseline effect of adjuvant plus protein (Supplementary Fig. 3b).
Figure 3. Low tonic signaling cells (LLO118) support long-lived, high-affinity antibody production, while high tonic signaling cells (LLO56) do not.
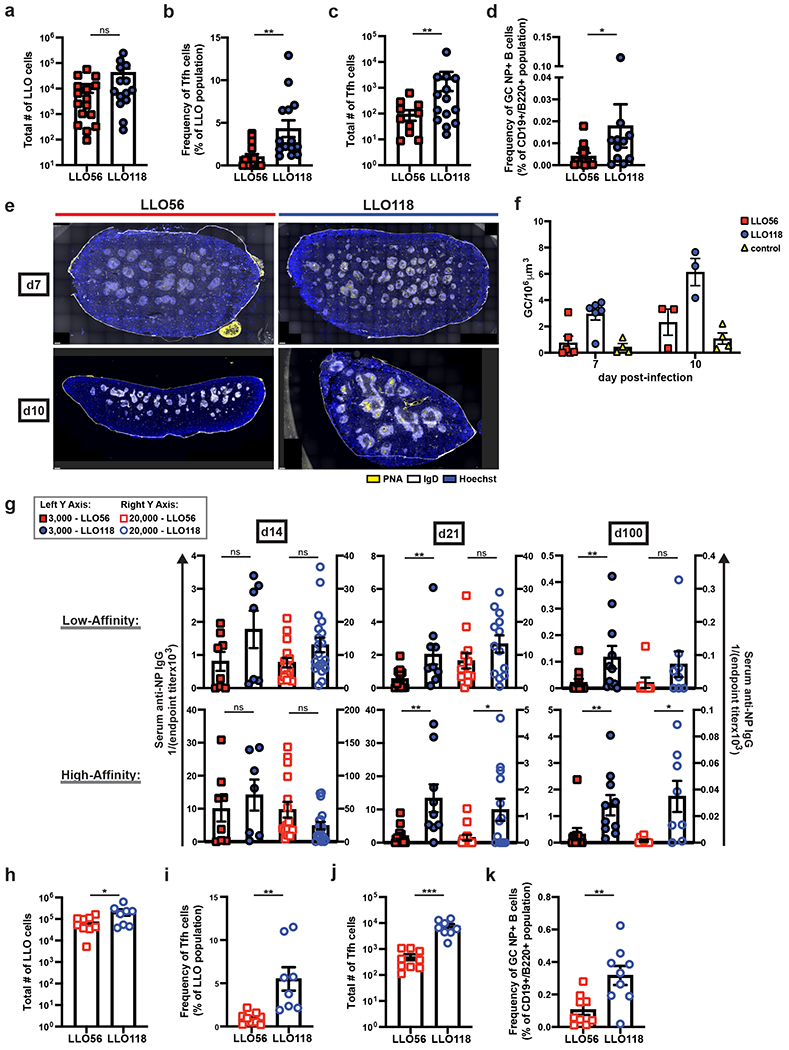
3,000 LLO56 or LLO118 cells were transferred into recipient Tcra−/− mice and immunized one day later with NP-LLOLT-N. On day 7 post-immunization, splenocytes were analyzed by flow cytometry for a, total number of activated LLO T cells, b, Tfh cell frequency of the LLO T cell populations, c, total number of LLO Tfh cells, and d, frequency of GC, NP+-B cells (see Supplemental Fig. 3a for gating) Six independent experiments (n=16 for LLO56 and n=14 for LLO118). e, 3000 LLO56 or LLO118 cells were transferred and activated as in (a). Spleens were harvested post-immunization for immunohistochemistry analysis. GC staining: PNA (yellow), IgD (white), and Hoechst (blue). Representative images are shown for three independent experiments at day 7 (n=6 for LLO56 and LLO118, n=4 for controls) and two at d10 (n=3 for LLO56 and LLO118, n=4 for controls). Scale bars (bottom left corners) = 300μm. Controls are Tcra−/− mice that were immunized with NP-LLOLT-N but had received no prior T cell transfers (representative images in Supplemental Fig. 3b). f, For images obtained in (e), quantification of the number of GCs is shown. GCs were manually counted in a blinded manner and then normalized to spleen volume. Two sections per individual mouse were averaged. g, Tcra−/− mice receiving either 3,000 (data represented by the left Y axis) or 20,000 (data represented by the right Y axis) LLO56 or LLO118 cells were immunized with NP-LLOLT-N, and serum was collected on days 14, 21, and 100 post-immunization. Endpoint titers were determined with serum from Tcra−/− mice that had received LLO T cell transfers but were immunized with unconjugated protein, LLOLT-N. High- and low-affinity antibodies were determined by coating ELISA plates with NP(2)-BSA and NP(28)-BSA, respectively. For 3,000 cell transfers, data represent three independent experiments for all time-points [(d14: n=8 for LLO56, n=7 for LLO118), (d21: n=11 for LLO56, n=9 for LLO118), (d100: n=10 for both LLO genotypes)]. For 20,000 cell transfers, four independent experiments for day 14 (n=16 for LLO56, n=19 for LLO118), three for d21 (n=13 for both LLO genotypes), and two for day 100 (n=8 for both LLO genotypes). h, 20,000 LLO56 or LLO118 cells were transferred and activated as in (a). On day 7 post-immunization, splenocytes were analyzed by flow cytometry for the total number of activated LLO T cells, i, frequency of Tfh cells within the LLO populations, j, total number of LLO Tfh cells, and k, frequency of NP+ GC B cells. Three independent experiments (n=9). All data represent mean ± SEM. ***p < 0.001, **p < 0.01, *p < 0.05. Unpaired t test or Mann-Whitney test for nonnormally distributed data (a-d, g-k). One-way ANOVA (f).
The success of sustained GC reactions can be measured by the development of long-lived, isotype-switched, antigen-specific plasma cells37; therefore, we chose to further assess the effects LLO T cells had on B cell responses by analyzing serum anti-NP IgG endpoint titers. Endpoint titers were calculated with control serum from Tcra−/− mice that had received LLO T cell transfers but were immunized with the unconjugated, LLOLT-N protein38. At day 14 post-immunization, there was no observed difference in the ability of LLO56 or LLO118 to assist antibody production; however, by day 21 post-immunization, LLO118-assisted B cells were able to produce isotype-switched, high- and low-affinity antibodies, while LLO56-assisted B cells had severely impaired antibody production with up to a 7-fold reduction in endpoint titers at days 21 and 100 post-immunization (Fig. 3g). Most notably, high-affinity antibody production at d100 post-immunization was apparent in the LLO118-assisted mice but was nearly undetectable in the LLO56-assisted mice (Fig. 3g).
To determine if the effects on humoral outcome were dependent on the quality or quantity of the LLO Tfh cells, we transferred a supra-physiological amount of LLO T cells prior to immunization. When 20,000 initial LLO T cells were transferred, we recovered nearly 10-fold as many LLO56 cells at day 7 post-immunization than we had with the 3,000 initial cell transfer amounts (Fig. 3h). This led to a near 10-fold increase in the total number of LLO56 Tfh cells as well, since LLO56 Tfh frequencies remained consistent at both cell transfer amounts (Fig. 3i,j), which increased the total number of LLO56 Tfh cells to a nearly equivalent number as the LLO118 Tfh cells in the 3,000 cell transfer model. Despite this, LLO56 were still unable to assist the generation of GC B cells and isotype-switched, long-lived, high-affinity antibody production (Fig. 3g,k). Given these data, we conclude that not only do LLO56 and LLO118 differ in their ability to differentiate into Tfh cells, but the few Tfh cells that LLO56 do generate are qualitatively distinct from LLO118 Tfh cells.
Disparate Tfh outcome between the LLO T cells is independent of IL-2 signaling
Previous data has shown increased IL-2 production in LLO56 cells compared to LLO11816. It is well-established that IL-2 signaling inhibits Tfh development31, prompting us to wonder if IL-2 signaling was inhibiting Tfh differentiation in LLO56 cells. A recent study, however, demonstrated the IL-2 producing population of CD4+ T cells shortly after activation actually had lower IL-2 signaling, as the IL-2 they generated acted in a paracrine fashion8. In T cells, IL-2 signaling occurs via the high-affinity IL-2Rα (CD25); therefore, we analyzed CD25 expression in the LLO T cells. In vitro analysis revealed a trend of increased CD25 expression in the LLO118 population at 2 and 4 hours post-activation, but these differences were not sustained (Fig. 4a,b). However, in vivo analysis showed an increased frequency of CD25+ cells as well as enhanced CD25 MFI in LLO118 Teff cells early after activation, demonstrating greater potential for IL-2 signaling in vivo despite their increased Tfh cell development (Fig. 4c). Therefore, we concluded IL-2 signaling through CD25 is not responsible for the inability of LLO56 to generate Tfh cells.
Figure 4. LLO56 Tfh impairment is independent of IL-2 signaling and cannot be rescued by increasing TCR activation strength.
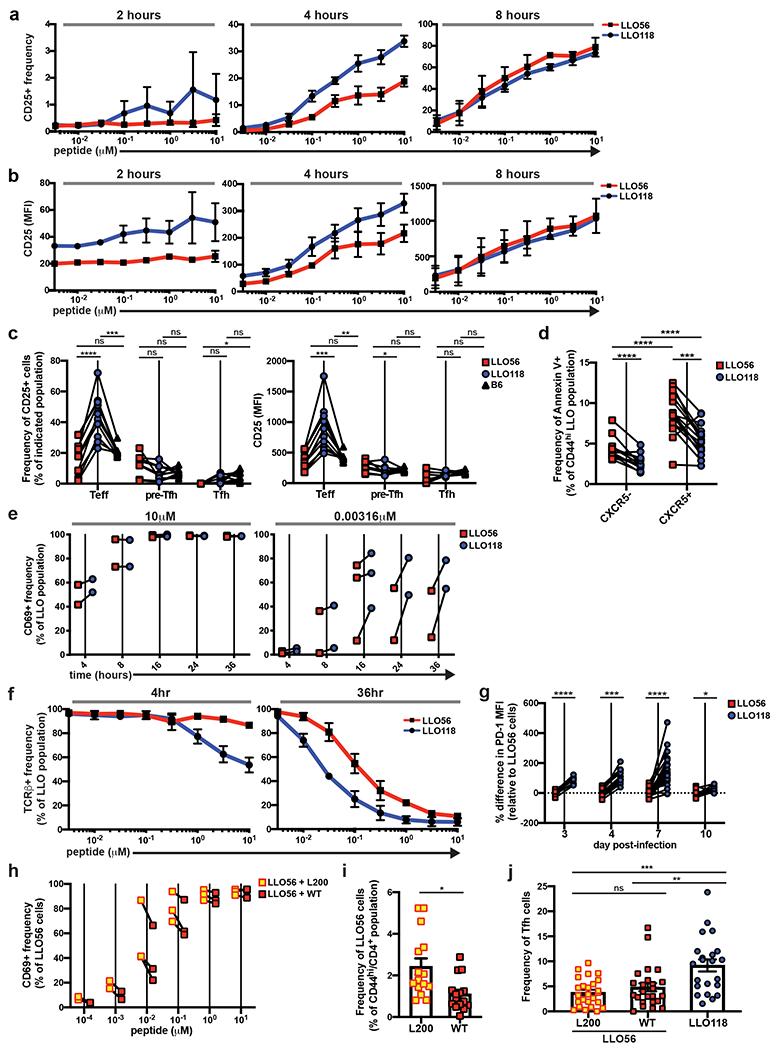
a, In vitro T cell stimulation assays with LLO T cells and LLOp to determine the frequency of CD25+ cells within the activated LLO T cell populations [live/single/dump−(I-A/I-E)/CD4+/CD69+], as well as b, the MFI of CD25 at 2-8 hours post-activation. Assay was performed in duplicate; two independent experiments. c, 100,000 naive LLO T cells were co-transferred into recipient B6 mice and infected with actA-Lm the following day. Splenocytes were analyzed on day 4 post-infection for CD25+ frequencies and MFI in the Teff, pre-Tfh, and Tfh subsets of the activated LLO populations. Two independent experiments (n=10). d, Annexin V staining in the CXCR5− and CXCR5+ subsets of activated LLO T cells at day 4 post-infection. Three independent experiments (n=15). e, In vitro T cell stimulation assays with LLO T cells and LLOp. T cells were harvested 4-36 hours post-activation and analyzed for the frequency of CD69+ cells in the LLO populations (live/single/dump−/CD4+). The highest (left graph, 10μM) and lowest (right graph, 0.00316 μM) peptide concentrations used for stimulation are shown. Data points are the duplicate averages and the paired LLO values are shown for each independent experiment (three for the 16 hour time-point and two for all others). f, In vitro LLO T cell stimulation assays with LLOp to assess TCRβ expression. Assay was performed in duplicate, and data are from two independent experiments. g, 20,000-100,000 naive LLO56 and LLO118 cells were co-transferred into recipient B6 mice and infected with actA-Lm the following day. Splenocytes were analyzed for expression of PD-1. Percentage differences in PD-1 MFI are shown relative to the average LLO56 PD-1 MFI for each time-point. Data are paired points from individual recipient mice; two independent experiments for day 3 (n=8), three for day 4 (n=13), 8 for day 7 (n=31), and two for day 10 (n=10). h, In vitro LLO56 T cell stimulation with either LLOp (referred to as WT) or LLOp with a point mutation of V➔L at residue 200 (referred to as L200). CD69+ frequency within the LLO56 population one day after stimulation. Assay was done in duplicate, and data points for LLO56 + WT and LLO56 + L200 are shown paired for each independent experiment: two for 10−3 and 10−4 μM concentrations, three for all other concentrations. i, j, 100,000-200,000 naive LLO56 were transferred into recipient B6 mice and then immunized with 10μM of either WT or L200 peptide. On day 7 post-immunization, splenocytes were analyzed for (i) frequency of activated LLO56 cells and (j) frequency of Tfh cells in the activated LLO56 cell population. LLO118 cells were also transferred into recipient B6 mice and immunized with WT peptide for Tfh analysis. In (i), only experiments with transfers of 100,000 cells are shown to keep expansion frequencies consistent (three independent experiments, n=15), and in (j) data are shown from all transfer amounts (six independent experiments, n=22 for LLO118 and n=25 for LLO56). All data represent mean ± SEM. ****p < 0.0001, ***p < 0.001, **p < 0.01, *p < 0.05. Unpaired t tests with correction for multiple comparisons using the Holm-Sidak method (a, b, e, f, h). Tukey’s multiple comparisons test (c). Paired t test or Wilcoxon matched-pairs signed rank test for nonnormally distributed data (d, g). Unpaired t test (i). Dunn’s multiple comparisons test (j).
Given the important role of IL-2 on T cell survival39 and previous findings demonstrating a stronger propensity for apoptosis in the LLO56 population when compared to LLO11830, we also questioned whether LLO56 pre-Tfh cells were dying at a greater rate than the LLO118 pre-Tfh cells. Annexin V staining of CXCR5+ LLO T cells at day 4 post-infection revealed a greater amount of early apoptosis present in the LLO56 pre-Tfh population (Fig. 4d); however, CXCR5− LLO56 cells also had greater Annexin V staining than LLO118 CXCR5− cells, and both LLO populations had increased apoptosis in CXCR5+ cells when compared to their CXCR5− counterparts (Fig. 4d). This suggests LLO56 cells are undergoing increased levels of apoptosis on a population-wide basis when compared to LLO118, and the defect in Tfh generation by LLO56 is not driven by pre-Tfh cell death.
Increasing TCR activation strength does not rescue Tfh developmental defects in the LLO56 population
Previous studies have connected strong TCR affinity for antigenic-pMHC to Tfh development8, 10. TCR affinity for LLOp does not vary between the two LLO T cells, as the LLO T cells’ TCRs have a nearly identical KD to LLOp16. However, the binding kinetics between the two LLO TCRs and LLOp are different16, and this could have effects on T cell activation strength40. CD69 expression of in vitro-activated LLO T cells revealed enhanced activation of LLO118 cells at the lowest concentration of stimulating peptide (Fig. 4e), and LLO118 cells also had a trend of increased TCRβ downregulation at the highest levels of stimulating peptide shortly after in vitro activation (Fig. 4f). Taken together, these findings suggest LLO118 T cells may be reacting to stimulating peptide more strongly than LLO56. In vivo experiments further supported these findings, as LLO118 cells had a significantly greater PD-1 MFI in their Teff subset throughout the course of the primary immune response (Fig. 4g). Collectively, we reasoned LLO118 cells experience enhanced TCR activation when compared to LLO56.
Importantly, TCR activation strength is not necessarily independent of tonic signaling. Previous studies have concluded that tonic signaling affects TCR responsiveness to antigenic-pMHC, although there is no clear consensus as to how tonic signaling tunes TCR sensitivity15, 16, 22, 28, 30, 41. Since LLO56 cells have weaker in vivo TCR activation than LLO118 cells, we set out to find an APL that would result in enhanced LLO56 activation to determine if we could generate an LLO56 Tfh response similar to that of LLO118. We tested a series of APLs that had been previously generated by our laboratory and focused on one that was particularly promising: LLOp with a V➔L point mutation at residue 200, named L200. For LLO56 cells stimulated in vitro, L200 consistently generated a greater CD69 response than wildtype LLOp (WT), although this did not reach a level of significance (Fig. 4h). Nonetheless, in vivo immunizations with the peptides revealed that LLO56 cells expanded much more robustly in response to L200 than to WT, indicating L200 is a stronger agonist in vivo (Fig. 4i). Despite the increase in LLO56 expansion, however, Tfh development between WT- and L200-activated cells was equivalent (Fig. 4j). Interestingly, when compared to the actA-Lm infection and protein immunization methods, the peptide immunization model appeared to elicit a stronger Tfh response in the LLO56 cells, which we determined to be commensurate with an increase in the LLO118 Tfh response as well. Thus, increasing activation strength through the use of APLs does not affect Tfh outcome in high tonic signaling cells, further suggesting that the potential for Tfh differentiation is pre-programmed under the naive state prior to recognition of cognate antigenic-pMHC.
Increasing basal TCR signaling in LLO118 cells inhibits Tfh development
We hypothesized strength of tonic signaling instructs early Tfh fate decisions, where low tonic signaling facilitates the Tfh developmental program and and high tonic signaling inhibits it. To test this, we took advantage of a knock-in mouse line with inducible expression of Scn5a (Fig. 5a), a pore forming component of a voltage-gated sodium channel which increases CD4+ TCR sensitivity to self-pMHC28, 42. To eliminate any possible effect on thymic selection, we bred the Scn5a expression mouse line to the Cd4-creErt2 strain (Fig. 5a). This endowed us with temporal control over the increase in TCR sensitivity to self-pMHC. After tamoxifen treatment of LLO118+Scn5a+Cd4-creErt2+ mice, we detected a GFP+ population of LLO118 cells indicating peripheral Scn5a expression (Fig. 5b). When compared to GFP− cells, GFP+ LLO118 cells had a significantly increased CD5 MFI and reduced Ly6C MFI, both of which reveal an increase in tonic signaling despite equivalent TCRβ expression (Fig. 5c–e).
Figure 5. Increasing basal TCR signaling in LLO118 cells inhibits Tfh development.
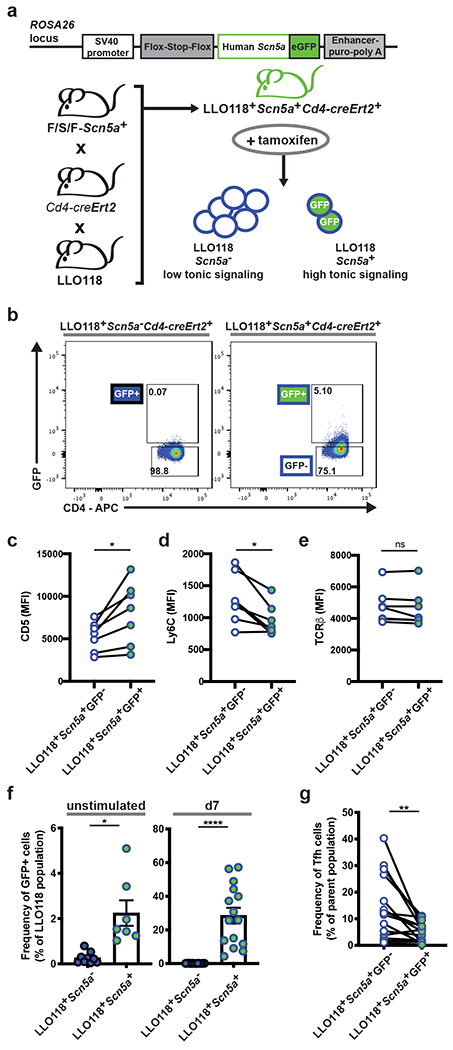
a, Outline of the Scn5a construct that was used to generate the F/S/F-Scn5a mouse, previously described28, and the breeding scheme of the LLO118+Scn5a+Cd4-creErt2+ line. Upon tamoxifen treatment, ectopic Scn5a expression in peripheral CD4+ T cells can be detected by GFP expression. b, Representative flow plots depicting GFP detection in CD4+ T cells from LLO118+Scn5a+Cd4-creErt2+ mice 7 days post-tamoxifen treatment. Both the LLO118+Scn5a+Cd4-creErt2+ mouse and its littermate control were treated with tamoxifen. c-e, Flow cytometry analysis of CD5, Ly6C, and TCRβ MFI in LLO118 GFP+ and GFP− T cells from LLO118+Scn5a+Cd4-creErt2+ mice 7 days post-tamoxifen treatment. Data points are the paired GFP+ and GFP− populations from individually treated mice; three independent experiments (n=7). f, Analysis of LLO118+Scn5a+Cd4-creErt2+ GFP+ T cell expansion during a primary immune response. LLO118+Scn5a+Cd4-creErt2+ and LLO118+Scn5a−Cd4-creErt2+ mice were treated with tamoxifen and 7 days later CD4+ T cells were enriched and transferred into Tcra−/− recipients. The following day, recipients were immunized with NP-LLOLT-N. Graphs show the frequency of GFP+ cells in the LLO118 populations immediately prior to the transfer (unstimulated, left graph) and 7 days post-immunization (d7, right graph). Three independent experiments (n=7 for LLO118+Scn5a+Cd4-creErt2+ and n=9 for LLO118+Scn5a−Cd4-creErt2+). Mean ± SEM are shown. g, In the same experiments as (f), in vivo-activated LLO118+Scn5a+Cd4-creErt2+ cells were also analyzed at day 7 post-immunization for the frequency of Tfh cells within the GFP+ and GFP− populations. ****p < 0.0001, **p < 0.01, *p < 0.05. Paired t test or Wilcoxon matched-pairs signed rank test for nonnormally distributed data (c-e, g). Unpaired t test or Mann-Whitney test for nonnormally distributed data (f).
To determine if increasing peripheral tonic signaling results in effects on Tfh development, we tamoxifen treated LLO118+Scn5a+Cd4-creErt2+ mice and then adoptively transferred the CD4+ T cells into recipients that were immunized with NP-LLOLT-N the following day. 7 days post-immunization, there was a robustly expanded GFP+ population of LLO118+Scn5a+Cd4-creErt2+ cells (Fig. 5f), and their Tfh development was greatly impaired when compared to their GFP− counterparts (Fig. 5g). These data reveal that Tfh differentiation can be directly inhibited by increasing peripheral sensitivity to self-pMHC in naive CD4+ T cells.
Strength of tonic signaling determines Tfh outcome in the polyclonal repertoire
To extend our findings to polyclonal CD4+ T cell responses, we required a robust cell sorting method because of the low clonal frequency of epitope specific T cells in a naive population. A genetic Nur77-GFP reporter mouse has been shown to offer the broadest range of tonic signaling detection in a polyclonal population22, 26, better facilitating our extensive sorting experiments. We confirmed that Nur77 expression was different between the two LLO T cells (Fig. 6a), and we then set out to utilize Nur77-GFP mice to test whether tonic signaling was deterministic of Tfh outcome in a polyclonal response. We sorted naive CD4+ T cells from Nur77-GFP mice into two groups representing the top and bottom 25% of Nur77-GFP expression, and then we transferred the high- and low-Nur77 expressing cells into recipient mice to be activated in vivo (Fig. 6b and Supplementary Fig. 4). Because of the limited number of LLO naive T cells in a polyclonal repertoire43, we utilized the LCMV infection model to generate a stronger polyclonal primary response44.
Figure 6. Nur77 expression distinguishes Tfh outcome in the polyclonal repertoire.
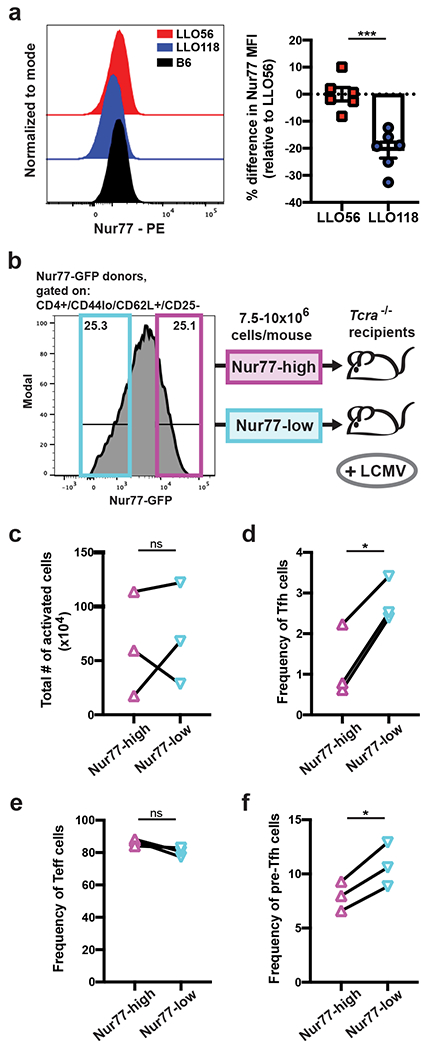
a, Naive LLO and B6 T cells (live/single/CD4+/CD44lo/CD62L+/CD25−) were assessed by intracellular staining for the expression of Nur77. Representative histograms are shown, and Nur77 MFI is quantified for the LLO populations by determining the percentage differences relative to the average LLO56 Nur77 MFI for each experiment. Two independent experiments (n=6). b, Depiction of the Nur77-sort experimental setup. Naive CD4+ T cells (gating in Supplemental Fig. 4) were sorted from Nur77-GFP donors into two populations: Nur77-high (top ~25% of GFP expression) and Nur77-low (lowest ~25% of GFP expression). 7.5-10x106 cells for each sorted population were transferred into individual Tcra−/− recipients, and one day later recipient mice were infected with LCMV-Armstrong. c, Following the experimental protocol in (b), recipient mice were harvested on day 7 post-infection, and splenocytes were analyzed for the total number of activated CD4+ T cells (live/single/CD4+/CD3+/GFP+/CD62Llo), d, the frequency of Tfh cells, e, frequency of Teff cells, and f, frequency of pre-Tfh cells within Nur77-high/low populations. Data points for (c-f) are the connected Nur77-high/low pairs from each independent experiment; three experiments total (n=3). All data represent mean ± SEM. ***p < 0.001, *p < 0.05. Unpaired t test (a). Paired t test (c-f).
When Nur77-high and Nur77-low cells were sorted, transferred, and activated in vivo, we observed a reduction in the frequency of Tfh cells generated by the Nur77-high population in comparison to their Nur77-low counterparts despite there being no consistent differences in the expansion of the two populations (Fig. 6c,d). Although the Nur77-high cells did not have a significant increase in their Teff cell compartment (Fig. 6e), they did have an observable reduction in their population of pre-Tfh cells, suggesting early Tfh developmental differences from the Nur77-low cells (Fig. 6f). These data support our hypothesis and signify the generalizable effects tonic signaling has on early Tfh-lineage commitment in the polyclonal CD4+ T cell population.
The H2-DMaf/fItgax-cre mouse line has decreased tonic signaling in polyclonal CD4+ T cells
Next, we sought a method to alter tonic signaling strength in polyclonal CD4+ T cells. As we have already demonstrated increased tonic signaling impairs Tfh development, we were particularly interested in utilizing an approach that decreased tonic signaling to test whether we could enhance Tfh differentiation. Therefore, we devised a method that allowed us to restrict the self-pMHC repertoire and reduce TCR:self-pMHC interactions. DM, an heterodimer composed of alpha and beta chains, is the protein responsible for facilitating the exchange of class II-associated invariant chain peptide (CLIP) for exogenous peptide on MHC-II molecules45. Previous studies have demonstrated mice deficient in DM (DMko) have a self-pMHC repertoire that is composed of essentially only CLIP bound to MHC-II46, 47. These complete DMko mice, however, also showed defects in presentation of antigenic-pMHC. We tested the ability of DMko APCs to present LLOp in vitro, and found when whole protein was the source of peptide, DMko APCs could not present LLOp to T cells; however, when exogenous peptide was the source, they were capable of presenting LLOp at a slightly reduced capacity (Fig. 7a). To develop a DM deletion strategy that would ensure reduction of self-pMHC presentation without greatly altering TCR:antigenic-pMHC interactions, we generated a conditional knockout allele of H2-DMa by using CRISPR/Cas9 technology to insert two loxP sites flanking the second exon of H2-DMa in B6 zygotes. We crossed this H2-DMaf/f mouse line to the Itgax-cre strain to delete H2-DMa selectively from CD11c+ APCs, a subset composed primarily of dendritic cells (DCs) (Fig. 7b). This would allow for reduced DC-mediated TCR:self-pMHC interactions without affecting B cell-mediated TCR:antigenic-pMHC interactions, as these are critical for Tfh formation.
Figure 7. Restricting the self-pMHC repertoire decreases tonic signaling and enhances Tfh development in polyclonal CD4+ T cells.
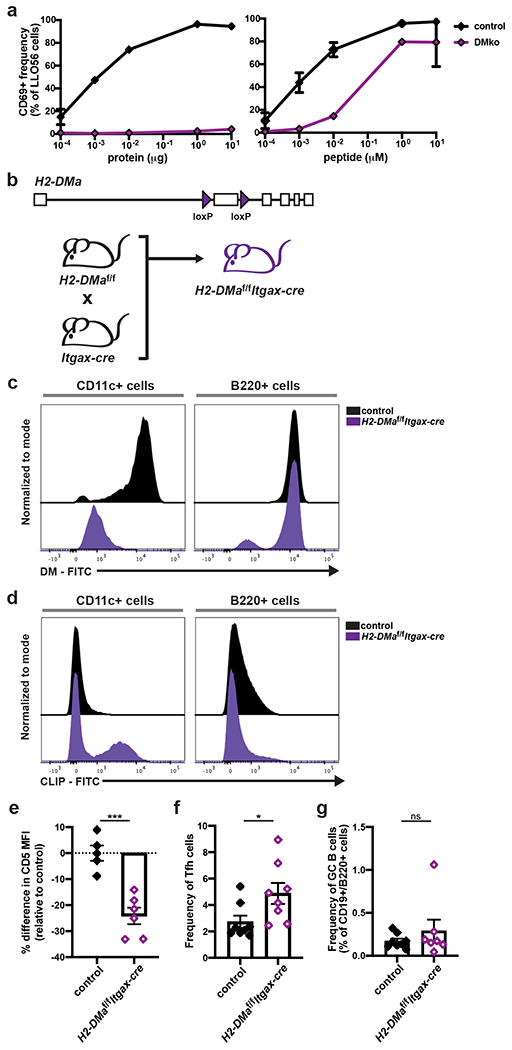
a, In vitro stimulation of LLO56 cells with either whole LLO protein or LLOp in the presence of BMDMs from control (B6) and DMko mice. LLO56 cells were harvested 18 hours post-activation and assessed for the frequency of CD69+ cells. Assays were performed in duplicate and representative graphs of three independent experiments are shown (n=3). b, Depiction of the generation of the H2-DMaf/fItgax-cre mouse line. c, Histograms depicting DM expression and d, CLIP bound to MHCII expression in the CD11c+ and B220+ cellular subsets of naive H2-DMaf/fItgax-cre mice and their littermate controls. Histograms are representative of two independent experiments (n=5 for the controls, n=6 for H2-DMaf/fItgax-cre). e, For the same mice analyzed in (c, d), CD5 expression in the naive CD4+ T cell population was also assessed, and the percentage differences in MFI are shown relative to the average control MFI for each experiment. f, H2-DMaf/fItgax-cre mice and their littermate controls were immunized directly with LLOp and splenocytes were assessed day 7 post-immunization for the frequency of Tfh cells in the activated, polyclonal CD4+ T cell populations. Two independent experiments (n=8). g, In the same experiments as (f), splenocytes were also analyzed for the frequency of GC B cells within the CD19+/B220+ population. All data represent mean ± SEM. *p < 0.05. Unpaired t test or Mann-Whitney test for nonnormally distributed data (e-g).
The H2-DMaf/fItgax-cre mouse resulted in successful DM deletion from the CD11c+ cell subset while mostly unaffecting DM expression in B cells (Fig. 7c). The absence of DM was associated with an expected increase in CLIP presentation within the CD11c+ population (Fig. 7d). Importantly, the restriction of self-pMHC presentation in the CD11c+ population was sufficient to cause polyclonal naive CD4+ T cells to reduce tonic signaling, as determined by lower expression of CD5 (Fig. 7e).
Reducing tonic signaling in polyclonal CD4+ T cells increases Tfh development
We employed the H2-DMaf/fItgax-cre mouse line to determine how decreasing tonic signaling affects Tfh development in diverse TCR repertoires. Since DMko APCs were not able to present peptide processed from whole protein but could present exogenous peptide (Fig. 7a), we immunized H2-DMaf/fItgax-cre mice and their littermate controls with LLOp. On day 7 post-immunization, we harvested splenocytes and analyzed them by flow cytometry for the presence of Tfh cells within the activated, CD4+ T cell population. We observed nearly twice as many Tfh cells present in H2-DMaf/fItgax-cre mice when compared to their littermate controls (Fig. 7f). However, the increase in Tfh cell development was not accompanied by a commensurate increase in GC B cells by day 7 post-immunization (Fig. 7g). Nevertheless, these data demonstrate that decreasing tonic signaling in a diverse polyclonal T cell population enhances Tfh outcome, further demonstrating the inverse relationship between tonic signaling strength and Tfh differentiation.
DISCUSSION
There is great interest in understanding the development of Tfh cells. Current evidence demonstrates a multistep process in the kinetics of canonical Tfh development with three general stages that are defined by distinct locations within secondary lymphoid organs and interactions with specific subsets of APCs. At each stage, a variety of factors affecting Tfh-lineage progression have been identified, including co-stimulatory molecules, cytokines, transcription factors, adhesion molecules, and homing cues. Still, a fundamental question remains elusive: why does a T cell initiate the Tfh developmental program rather than a Teff program? Many groups have investigated how strength of TCR:antigenic-pMHC interactions affects Tfh differentiation8, 9, 10, 11, 12, 13, 14. However, their results have been contentious. In this study, we interrogated another TCR-dependent factor for its contribution to Tfh-fate decisions: tonic TCR signaling via self-pMHC interactions. Our findings reveal that tonic signaling instructs the Tfh differentiation program, where strong tonic signaling inhibits it and weak tonic signaling promotes it.
We utilized two murine TCRtg CD4+ T cells, LLO56 and LLO118, that recognize the same immunodominant antigenic-pMHC but experience disparate strengths of tonic signaling, to reveal that low tonic signaling cells (LLO118) generate a Tfh response, while high tonic signaling cells (LLO56) do not. Polyclonal T cells paralleled these findings, with naive Nur77 expression distinguishing Tfh potential. We also generated two mouse lines to directly increase and decrease tonic signaling, LLO118+Scn5a+Cd4-creErt2+ and H2-DMaf/fItgax-cre, respectively. Both approaches affected Tfh development in support of our initial findings, establishing a direct link between tonic signaling and Tfh-fate decisions.
These results offer insight into the conflicting studies on the role of TCR affinity for antigenic-pMHC in Tfh development. Groups that concluded increasing TCR signal strength biases a Teff over Tfh response used experimental approaches that increased tonic signaling strength as well as TCR activation strength11, 12. This supports our data, as cells experiencing strong tonic signaling were skewed towards a Teff-fate in our study as well. Groups that found increasing TCR affinity for antigenic-pMHC promoted Tfh development utilized methods that relied on either TCRtg models9, 10 or tetramer-pMHC binding8, 10. Perhaps in low tonic signaling, Tfh-capable cells, increasing TCR signal strength plays a complementary role in the promotion of Tfh differentiation. For example, the 5cc.7 TCRtg T cells used by the McHeyzer-Williams group have a reported low tonic signaling profile41, which our results suggest would promote Tfh development. This hypothesis would also explain observations of increased tetramer-pMHC binding in the polyclonal Tfh compartment.
Delineation of the interplay between TCR activation strength and tonic signaling strength on Teff versus Tfh decisions will need to be interrogated in future studies. This will be technically challenging, as many ways of altering tonic signaling strength also affect TCR activation strength. Even in our current study, it is possible that expression of Scn5a is altering TCR activation in a way that is not observable through standard T cell activation read-outs. Similarly, despite utilizing peptide immunization, the absence of DM in the CD11c+ population may still be impacting antigen presentation at the initial priming step. This is why our current approach involved varied manipulations of tonic signaling strength and the sorting of unaltered cells based on tonic signaling strength. It will be highly advantageous for future studies to develop techniques that definitively separate the effects of tonic signaling and TCR activation strength.
Indeed, tonic signaling strength is most likely not the only determining factor in early Tfh-fate decisions; however, we propose that it does distinguish a naive CD4+ T cell’s Tfh potential. LLO56 appear to have an inhibition of the Tfh developmental program that is independent of the well-established IL-2/Blimp-1 axis of Bcl6 antagonism and TCR activation strength. Conversely, LLO118 appear endowed with Tfh potential such that CD25 must be upregulated in some daughter clones to override commitment to the Tfh lineage and produce Teff cells, a process that could involve input from other signals, such as TCR activation strength, cytokine signaling, or engagement of costimulatory molecules. This supposes a model of early Teff versus Tfh decisions whereby strong tonic signaling either directly obstructs Tfh or promotes Teff development, or weak tonic signaling either directly promotes Tfh or inhibits Teff development.
Since Tfh cells play a central role in the adaptive arm of immunity, this study offers tonic signaling as a potential new therapeutic target for many human-related concerns, including vaccines and autoimmunity2. In the case of subunit vaccines, the challenge will be whether we can preferentially target low tonic signaling cells to better design an efficacious vaccine. Also, if a therapeutic method was developed to decrease tonic signaling in CD4+ T cells, it could be administered prior to a vaccine injection to increase Tfh development and positively alter the humoral outcome. This could prove especially useful for people that would otherwise not generate a protective humoral response to the vaccine alone. Additionally, our findings may offer insights into the mechanism underlying the current use of FTY720 to treat autoimmune conditions, as FTY720 administration blocks egress of CD4+ T cells from self-pMHC rich areas and effectively increases tonic signaling. Indeed, this study highlights the need for consideration of tonic signaling in previous studies as well as future experimental designs.
METHODS
Mice
All mice were bred and housed in specific pathogen-free conditions of the animal facility at Washington University Medical Center. Animal facility housing has an ambient temperature of 72°F, 50-60% humidity, and a 6:00am-6:00pm light cycle. All use of laboratory animals was approved and carried out in accordance with the Washington University Division of Comparative Medicine guidelines. Initial generation of the LLO TCR transgenic mouse lines has been previously described by our laboratory30. LLO56 and LLO118 are maintained by breeding to a Rag1−/−, homozygous congenic marker (LLO56-Thy1.1; LLO118-Ly5.1) background. B6 (C57BL/6J, Stock No. 000664), Tcra−/− (B6.129S2-Tcratm1Mom/J, Stock No. 002116), Cd4-creErt2 [B6(129X1)-Tg(Cd4-cre/ERT2)11Gnri/J, Stock No. 022356], and Itgax-cre [B6.Cg-Tg(Itgax-cre01-1Reiz/J, Stock No. 008068] mice were all initially purchased from The Jackson Laboratory (Bar Harbor, ME) and subsequently maintained in our animal facility. To generate the LLO118+Scn5a−Cd4-creErt2+ line, LLO118 and Cd4-creErt2 were crossed to the F/S/F-Scn5a mouse line previously detailed28. To generate the H2-DMaf/f mouse line, CRISPR/Cas9 technology was used to insert two loxP sites flanking exon 2 of H2-DMa in B6 zygotes. The Nur77-GFP mouse strain [B6.FVB(Cg)-Tg(Nr4a1-EGFP)GY139Gsat/WeisMmucd, RRID:MMRRC_036737-UCD] was obtained from the Mutant Mouse Resource and Research Center at University of California, Davis, an NIH-funded strain repository, and was donated to the MMRRC by Arthur Weiss, M.D., Ph.D., University of California, San Francisco25. All mice were aged 6-12 weeks at the start of every experiment, and both sexes were used throughout the experiments. Sex and age matching and co-housing were done within experiments to the greatest extent possible.
Cell transfers, mouse infections, protein and peptide immunizations
For LLO56, LLO118, and LLO118+Scn5a+Cd4-creErt2+ transfer experiments, CD4+ T cells were enriched from spleen by negative selection using a CD4+ T Cell Isolation Kit (Miltenyi Biotec). Cells were then transferred iv into recipient mice, and 12-24 hours later the mice were either infected iv with 107 cfu of actA-deficient Listeria monocytogenes (strain DPL194248) or immunized as indicated. NP-conjugated protein immunizations were performed by ip injection of mice with 100μg of the conjugated protein in equal parts adjuvant aluminum hydroxide gel, Alhydrogel (InvivoGen). For peptide immunizations, mice were injected ip with 10μM peptide in 200μl of a 1:1 PBS:Alhydrogel mixture. For the Nur77-high/low and CD5-high/low transfers, CD4+ T cells were first negatively selected from spleen using a CD4+ T Cell Isolation Kit (Miltenyi Biotec) and then stained for CD4, CD44, CD62L, CD25, and CD5. Naive CD4+ T cells (CD4+/CD44lo/CD62L+/CD25−) in the top and bottom 25% of Nur77-GFP or CD5 expression were sorted using a BD FACSAriaII cytometer. 7.5-10x106 cells were injected iv into recipient mice (transferred amounts varied across experiments, not within). One day later, recipient mice were infected ip with 2x10⁵ PFU Armstrong strain LCMV49.
Flow cytometry
All samples were collected on BD FACS CantoII or BD LSR Fortessa cytometers (BD Biosciences) using FACS DIVA v8.0.1 software (BD Biosciences), and data were analyzed using FlowJo software v10.5.3 (Treestar). Gating strategies are described in figure legends. For all Tfh and GC B cell analysis experiments, 2.5 million lymphocyte events were acquired to ensure proper detection of rare populations. The following antibodies and reagents were used for flow cytometry analysis, all antibodies were used at 1:200 dilution unless otherwise specified: anti-CD44 [(FITC; clone IM7; Biolegend; cat. no. 103006), (PE; clone IM7; Biolegend; cat. no. 103008), (AlexaFluor 700; clone IM7; Biolegend; cat. no. 103026)], anti-CD62L [(FITC; clone MEL-14; Fisher Scientific; cat. no. BDB553150), (PE; clone MEL-14; Biolegend; cat. no. 104408), (PerCP-Cy5.5; clone MEL-14; Biolegend; cat. no. 104432), (APC; clone MEL-14; Biolegend; cat. no. 104412)], anti-CD4 [(FITC; clone RM4-5; Biolegend; cat. no. 100510), (PE; clone RM4-4; Biolegend; cat. no. 116006), (APC; clone RM4-5; Biolegend; cat. no. 116014), (eFluor 450; clone RM4-5; Fisher Scientific; cat. no. 501129511), (APC-Cy7; clone RM4-5; Biolegend; cat. no. 100526), (AlexaFluor 700; clone GK1.5; Biolegend; cat. no. 100430), (PE-Cy7; clone GK1.5; Fisher Scientific; cat. no. 501129609), (PerCP-Cy5.5; clone RM4-5; Fisher Scientific; cat. no. 5015746)], anti-TCRβ ( PerCP-Cy5.5; clone H57-597; Biolegend; cat. no. 109228), anti-CD3ε [(FITC; clone 145-2C11; Biolegend; cat. no. 100305), (PE-Cy7; clone 145-2C11; Biolegend; cat. no. 100320), (PE; 145-2C11; Biolegend; cat. no. 100308)], live/dead stain (violet; Life Technologies; cat. no. L34955; 1:1000 dilution), anti-CD45.1 [(PE-Cy7; clone A20; Fisher Scientific; cat. no. 501129620), (FITC; clone A20; Biolegend; cat. no. 110706), (PerCP-Cy5.5; clone A20; Fisher Scientific; cat. no. BDB560580)], anti-CD90.1 [(FITC; clone HIS51; Fisher Scientific; cat. no. BDB554894; 1:500 dilution), (PerCP-Cy5.5; clone HIS51; Fisher Scientific; cat. no. 501123735; 1:500 dilution), (eFluor 450; clone HIS51; eBioscience; cat. no. 48-0900-82; 1:500 dilution)], anti-CXCR5 (APC; clone 2G8; Fisher Scientific; cat. no. BDB560615; 1:50 dilution), anti-PD-1 (eFluor 450; clone J43; Fisher Scientific; cat. no. 501129091; 1:100 dilution), anti-ICOS (Biotin; clone 7E.17G9; BD Biosciences; cat. no. 552145; 1:100 dilution), anti-CD40L (PE; clone MR1; Fisher Scientific; cat. no. 12-1541-81), anti-CD69 [(FITC; clone H1.2F3; Biolegend; cat. no. 104506), (PE; clone H1.2F3; Biolegend; cat. no. 104508), (APC; clone H1.2F3; Biolegend; cat. no. 104514), (PE-Cy7; clone H1.2F3; Biolegend; cat. no. 104512)], anti-CD19 (APC-Cy7; clone 6D5; Biolegend; cat. no. 115530), anti-B220 [(eFluor 450; clone RA3-6B2; Fisher Scientific; cat. no. 501129551), (APC; clone RA3-6B2; Fisher Scientific; cat. no. 50-149-73), (PE; clone RA3-6B2; Biolegend; cat. no. 103208)], anti-Fas (PE-Cy7; clone JO2; Fisher Scientific; cat. no. BDB557653; 1:100 dilution), anti-GL7 (FITC; clone GL7; Biolegend; cat. no. 144604; 1:100 dilution), anti-IgD [(PE; clone 11-26c.2a; Biolegend; cat. no. 405705), (PerCP-Cy5.5; clone 11-26c.2a; Biolegend; cat. no. 405709)], NP-PE (Fisher Scientific; cat. no. NC1316967; 1:100 dilution), anti-CD25 [(FITC; clone PC61; Biolegend; cat. no. 102006), (eFluor 450; clone 3C7; Affymetrix; cat. no. 48-0253-82)], anti-CD5 [(PE-Cy7; clone 53-7.3; Biolegend; cat. no. 100622; 1:500 dilution), (PE; clone 53-7.3; Fisher Scientific; cat. no. BDB553022; 1:500 dilution)], anti-Ly6C (PacBlue; clone HK1.4; Biolegend; cat. no. 128013), anti-CLIP (FITC; clone 15G4; Santa Cruz Biotechnology; cat. no. sc-53946 FITC; 1:50 dilution), anti-CD11c (PE-Cy7; clone N418; Biolegend; cat. no. 117318), anti-CD16/CD32 Fc block (clone 93; Biolegend; cat. no. 101330; 1:100 dilution), anti-I-A/I-E (PE; clone M5/114.15.2; Biolegend; cat. no. 107629), and Streptavidin [(PE-Cy7; Biolegend; cat. no. 405206), (FITC; Fisher Scientific; cat. no. BDB554060)], Annexin V (PE; Biolegend; cat. no. 640908; 1:20 dilution), and 7-AAD (BD Pharmingen; cat. no. 5168981E; 1:20 dilution).
Annexin V and 7-AAD staining
Splenocytes were harvested and cell surface staining for 1x10⁶ cells was performed as usual. Cells were washed in PBS and then Annexin Buffer (140mM NaCl, 4mM KCl, 0.75mM MgCl2, 10mM HEPES). 100μL of Annexin V and 7-AAD staining master mix (1:20 dilutions of Annexin V and 7-AAD in Annexin Buffer plus 2.5mM CaCl2) was added to each sample to incubate for 15min at room temperature before adding 400μL of Annexin Buffer plus 2.5mM CaCl2. Samples were immediately analyzed after staining.
Intracellular FACS staining
For intracellular cytokine analysis, splenocytes were first stimulated with 1ng/ml PMA (Sigma-Aldrich) plus 1μg/ml ionomycin (Sigma-Aldrich) at 37° C for 30 min, followed by a 4 hr incubation with 2 μg/ml brefeldin A (Sigma-Aldrich). Splenocytes were then washed and stained for surface proteins, followed by fixation and permeabilization in accordance with the Foxp3/Transcription Factor Staining Buffer Kit (eBioscience). The Foxp3/Transcription Factor Staining Buffer Kit was also used after surface staining for all transcription factor staining and for intracellular staining of DM. The following antibodies were used for intracellular flow cytometry analysis: anti-Bcl6 (PE; clone BCL-DWN; Fisher Scientific; cat. no. 501122326; 1:100 dilution), anti-Tbet (PE; clone eBio4B10; Fisher Scientific; cat. no. 5010893), anti-GATA-3 (PE-Cy7; clone TWAJ; Fisher Scientific; cat. no. 501129305), anti-RORγt (BV421; clone Q31-378; BD Biosciences; cat. no. 562894), anti-IFN-γ (FITC; clone XMG1.2; Biolegend; cat. no. 505806), anti-IL-4 (Biotin; clone BVD6-24G2; BD Biosciences; cat. no. 554390; 1:100 dilution), anti-IL-21 (PE; clone FFA21; Fisher Scientific; cat. no. 5011172; 1:100 dilution), anti-H2-DM (clone 2E5a; Fisher Scientific; cat. no. 552405), anti-rat IgG1 (FITC; clone RG11/39.4; Fisher Scientific; cat. no. BDB553892), and anti-Nur77 (PE; clone 12.14; Fisher Scientific; cat. no. 5011028).
Protein and peptide generation
All peptides used in this study were purchased from Peptide 2.0 Inc., purified by reverse-phase high pressure liquid chromatography, and analyzed by mass-spectroscopy. A pET29b expression vector containing the His-tagged LLOLT sequence was provided by Dr. Emil Unanue (Washington University, St. Louis, MO)36. For generation of LLOLT-N, site-directed mutagenesis was used to change the lysine at position 203 to an asparagine (N). Mutated clones were confirmed by sequencing. LLOLT and LLOLT-N were expressed in BL21 (DE3) competent cells (ThermoFisher) and purified as previously described36. Protein purity was confirmed by SDS-PAGE. For conjugation of NP to LLOLT and LLOLT-N, 0.5mg of NP-OSu (LGC Biosearch Technologies) was added to 5mg of either LLOLT or LLOLT-N in 10 equal fractions over 20 minutes. The solution was then incubated at room temperature with rotations for 2 hours before being dialyzed into 0.1M NaHCO3, 145mM NaCl, pH 8.5. NP:LLOLT(-N) ratio was determined with the following extinction coefficients: LLOLT(-N) = 75750 M−1cm−1 and NP = 4230 M−1cm−1. Ratios of NP:LLOLT(-N) ranged from 5:1-10:1, and batches of NP-LLOLT(-N) were aliquoted and stored at -20°C to allow for continuity across experiments.
T cell stimulation assays
Bone marrow-derived macrophages (BMDM) were plated in a 96-well plate at 1x10⁵ cells per well in I-10 media (IMDM, 10% FBS, pen/strep, gentamycin, and 2-ME). BMDM were stimulated for the first 24 hr with IFN-γ (2000 U/ml) and then were washed with PBS and rested for another 24 hr in fresh I-10 media before T cell and antigen plating. To isolate CD4+ T cells from the spleen of LLO transgenic mice, a negative CD4+ selection kit (Miltenyi) was used, and 5x10⁵ CD4+ T cells were subsequently plated on top of the BMDMs along with the protein or peptide of interest. T cells were then harvested from the wells at various time-points post-plating for FACS analysis. Generally, cells were harvested 18-24 hr post-plating unless otherwise specified.
Microscopic imaging of germinal centers
Mice were sacrificed and perfused with ice-cold PBS. Spleens were harvested and snap frozen in OCT tissue-freezing solution and stored at -80°C. 8μm sections were cut, mounted to slides, and fixed with ice-cold acetone. Immediately prior to performing immunohistochemistry, sections were rehydrated and then blocked with 5% FCS. Reagents used to stain GCs were: IgD (PE, clone 11-26c.2a, Biolegend, 1:100 dilution) and PNA (fluorescein labeled, Vector Labs, 1:200 dilution). Hoechst (1:2,500 dilution) staining was then performed and slides were mounted with Fluoromount G. Fluorescent images were taken of the entire spleen sections using a fully automated, brightfield/fluorescence slide scanning system (AxioScan.Z1, ZEISS). Spleens were imaged at 40X. Images were stitched in Zen Software (Blue Edition) v3.1 (ZEISS) and then uploaded to Imaris Software v8.4 (Bitplane) for quantification of GCs, which were manually counted for each image and defined as dense areas (>50μm in diameter) of PNA staining within IgD+ follicles. Analysis was performed blinded, and two sections were averaged for each individual spleen value. Tcra−/− mice that received no T cell transfers but were immunized with NP-LLOLT-N were used as controls.
Anti-NP ELISAs
Serum collected from mice was aliquoted before storage at -70°C to ensure only one freeze-thaw cycle for all samples. The night before our ELISAs were performed, Immulon Two ELISA plates were coated with 5μg/ml of NP-BSA at either a 2:1 or 28:1 NP:BSA ratio, hereafter referred to as NP(2)-BSA or NP(28)-BSA (purchased from LGC Biosearch Technologies). To detect low-affinity antibodies, NP(28)-BSA was used, and to detect high-affinity antibodies, NP(2)-BSA was used. The next day, plates were washed and blocked with 0.5% BSA in PBS for 1 hr at RT. Plates were washed again and serum was added for 1 hr at RT. After another washing, an anti-mouse IgG-HRP antibody (Southern Biotech, cat. no. 1030-05) was added at 1:5,000 for 45 min at RT. Final washes were performed, One-Step Ultra TMB Substrate was added to each well for 2 minutes before adding H2SO4 and measuring A450. Endpoint titers were determined as previously described38. Control serum was generated from Tcra−/− mice that had received LLO cell transfers but were immunized with the unconjugated protein (LLOLT-N) instead of NP-LLOLT-N.
Tamoxifen Treatment for Cd4-creErt2 induction
Tamoxifen (Sigma-Aldrich) was suspended in corn oil (Sigma-Aldrich) at a concentration of 100mg/ml. Mice were orally gavaged for three consecutive days with 50μl of the tamoxifen solution for a total treatment of 5mg of tamoxifen per day. Efficiency was determined by monitoring GFP expression in the CD4+ T cell population of LLO118+Scn5a+Cd4-creErt2+ mice.
Statistical Analysis
The only experiments in which investigators were blinded to sample identity was during the analysis of microscopy images. In immunization experiments involving LLO T cell transfers into Tcra−/− recipients, samples were excluded from analysis if an LLO T cell population did not expand beyond background antibody staining levels, as determined by control mice that were immunized but did not receive LLO T cell transfers. All statistical analysis was performed using Prism v8.2.1 (GraphPad Software, Inc.), and statistical significance is indicated as follows: ****p < 0.0001, ***p < 0.001, **p < 0.01, *p < 0.05. Statistical tests used are stated in each figure legend and were two-tailed unless otherwise stated. Sample size and number of replicate experiments performed are also indicated in figure legends.
Supplementary Material
ACKNOWLEDGMENTS
We thank D. Kreamalmeyer for mouse breeding and care; D. Brinja and E. Lantelme for assistance with sorting by flow cytometry; D. Oakley and M. Shih of the Washington University Center for Cellular Imaging for assistance with AxioScan use and image analysis; W.L. Lo for insights on the manuscript; and M. White and the Genome Engineering and iPSC Center at Washington University for generation of the H2-DMaf/f mouse line. This work was supported by: National Institutes of Health Research Grants AI138393 (to J.M.B.), AI130152-01A1 (to T.E.), AI139875 (to T.E.), and AI139540 (to P.M.A); the Leukemia Lymphoma Society Scholar Award (to T.E.); and the Washington University Rheumatic Diseases Research Resource-Based Center, funded by NIH grant P30AR073752 (to P.M.A).
Footnotes
COMPETING INTERESTS
The authors declare no competing interests.
DATA AVAILABILITY
The data that support the findings of this study are available from the corresponding author upon reasonable request.
REFERENCES
- 1.Crotty S Follicular helper CD4 T cells (TFH). Annu Rev Immunol 29, 621–663 (2011). [DOI] [PubMed] [Google Scholar]
- 2.Crotty S T Follicular Helper Cell Biology: A Decade of Discovery and Diseases. Immunity 50, 1132–1148 (2019). [DOI] [PMC free article] [PubMed] [Google Scholar]
- 3.Vinuesa CG, Linterman MA, Yu D & MacLennan IC Follicular Helper T Cells. Annu Rev Immunol 34, 335–368 (2016). [DOI] [PubMed] [Google Scholar]
- 4.Webb LMC & Linterman MA Signals that drive T follicular helper cell formation. Immunology 152, 185–194 (2017). [DOI] [PMC free article] [PubMed] [Google Scholar]
- 5.Wu T et al. TCF1 Is Required for the T Follicular Helper Cell Response to Viral Infection. Cell Rep 12, 2099–2110 (2015). [DOI] [PMC free article] [PubMed] [Google Scholar]
- 6.Baumjohann D, Okada T & Ansel KM Cutting Edge: Distinct waves of BCL6 expression during T follicular helper cell development. J Immunol 187, 2089–2092 (2011). [DOI] [PubMed] [Google Scholar]
- 7.Choi YS et al. ICOS receptor instructs T follicular helper cell versus effector cell differentiation via induction of the transcriptional repressor Bcl6. Immunity 34, 932–946 (2011). [DOI] [PMC free article] [PubMed] [Google Scholar]
- 8.DiToro D et al. Differential IL-2 expression defines developmental fates of follicular versus nonfollicular helper T cells. Science 361 (2018). [DOI] [PMC free article] [PubMed] [Google Scholar]
- 9.Tubo NJ et al. Single naive CD4+ T cells from a diverse repertoire produce different effector cell types during infection. Cell 153, 785–796 (2013). [DOI] [PMC free article] [PubMed] [Google Scholar]
- 10.Fazilleau N, McHeyzer-Williams LJ, Rosen H & McHeyzer-Williams MG The function of follicular helper T cells is regulated by the strength of T cell antigen receptor binding. Nat Immunol 10, 375–384 (2009). [DOI] [PMC free article] [PubMed] [Google Scholar]
- 11.Krishnamoorthy V et al. The IRF4 Gene Regulatory Module Functions as a Read-Write Integrator to Dynamically Coordinate T Helper Cell Fate. Immunity 47, 481–497 e487 (2017). [DOI] [PMC free article] [PubMed] [Google Scholar]
- 12.Snook JP, Kim C & Williams MA TCR signal strength controls the differentiation of CD4(+) effector and memory T cells. Sci Immunol 3 (2018). [DOI] [PMC free article] [PubMed] [Google Scholar]
- 13.Keck S et al. Antigen affinity and antigen dose exert distinct influences on CD4 T-cell differentiation. Proc Natl Acad Sci U S A 111, 14852–14857 (2014). [DOI] [PMC free article] [PubMed] [Google Scholar]
- 14.Ploquin MJ, Eksmond U & Kassiotis G B cells and TCR avidity determine distinct functions of CD4+ T cells in retroviral infection. J Immunol 187, 3321–3330 (2011). [DOI] [PMC free article] [PubMed] [Google Scholar]
- 15.Stefanova I, Dorfman JR & Germain RN Self-recognition promotes the foreign antigen sensitivity of naive T lymphocytes. Nature 420, 429–434 (2002). [DOI] [PubMed] [Google Scholar]
- 16.Persaud SP, Parker CR, Lo WL, Weber KS & Allen PM Intrinsic CD4+ T cell sensitivity and response to a pathogen are set and sustained by avidity for thymic and peripheral complexes of self peptide and MHC. Nat Immunol 15, 266–274 (2014). [DOI] [PMC free article] [PubMed] [Google Scholar]
- 17.van Oers NS et al. Constitutive tyrosine phosphorylation of the T-cell receptor (TCR) zeta subunit: regulation of TCR-associated protein tyrosine kinase activity by TCR zeta. Mol Cell Biol 13, 5771–5780 (1993). [DOI] [PMC free article] [PubMed] [Google Scholar]
- 18.Daley SR et al. Rasgrp1 mutation increases naive T-cell CD44 expression and drives mTOR-dependent accumulation of Helios(+) T cells and autoantibodies. Elife 2, e01020 (2013). [DOI] [PMC free article] [PubMed] [Google Scholar]
- 19.van Oers NS, Killeen N & Weiss A ZAP-70 is constitutively associated with tyrosine-phosphorylated TCR zeta in murine thymocytes and lymph node T cells. Immunity 1, 675–685 (1994). [DOI] [PubMed] [Google Scholar]
- 20.Myers DR et al. Tonic LAT-HDAC7 Signals Sustain Nur77 and Irf4 Expression to Tune Naive CD4 T Cells. Cell Rep 19, 1558–1571 (2017). [DOI] [PMC free article] [PubMed] [Google Scholar]
- 21.Markegard E et al. Basal LAT-diacylglycerol-RasGRP1 signals in T cells maintain TCRalpha gene expression. PLoS One 6, e25540 (2011). [DOI] [PMC free article] [PubMed] [Google Scholar]
- 22.Zinzow-Kramer WM, Weiss A & Au-Yeung BB Adaptation by naive CD4(+) T cells to self-antigen-dependent TCR signaling induces functional heterogeneity and tolerance. Proc Natl Acad Sci U S A 116, 15160–15169 (2019). [DOI] [PMC free article] [PubMed] [Google Scholar]
- 23.Milam AAV et al. Tonic signaling inversely regulates the basal metabolism of CD4+ T cells. ImmunoHorizons Manuscript in Revision (2020). [DOI] [PMC free article] [PubMed] [Google Scholar]
- 24.Azzam HS et al. CD5 expression is developmentally regulated by T cell receptor (TCR) signals and TCR avidity. J Exp Med 188, 2301–2311 (1998). [DOI] [PMC free article] [PubMed] [Google Scholar]
- 25.Zikherman J, Parameswaran R & Weiss A Endogenous antigen tunes the responsiveness of naive B cells but not T cells. Nature 489, 160–164 (2012). [DOI] [PMC free article] [PubMed] [Google Scholar]
- 26.Moran AE et al. T cell receptor signal strength in Treg and iNKT cell development demonstrated by a novel fluorescent reporter mouse. J Exp Med 208, 1279–1289 (2011). [DOI] [PMC free article] [PubMed] [Google Scholar]
- 27.Bhandoola A et al. Peripheral expression of self-MHC-II influences the reactivity and self-tolerance of mature CD4(+) T cells: evidence from a lymphopenic T cell model. Immunity 17, 425–436 (2002). [DOI] [PubMed] [Google Scholar]
- 28.Viehmann Milam AA et al. Tuning T cell Signaling Sensitivity Alters the Behavior of CD4+ T Cells During an Immune Response. Journal of Immunology (2018). [DOI] [PMC free article] [PubMed] [Google Scholar]
- 29.McHeyzer-Williams LJ & McHeyzer-Williams MG Developmentally distinct Th cells control plasma cell production in vivo. Immunity 20, 231–242 (2004). [DOI] [PubMed] [Google Scholar]
- 30.Weber KS et al. Distinct CD4+ helper T cells involved in primary and secondary responses to infection. Proc Natl Acad Sci U S A 109, 9511–9516 (2012). [DOI] [PMC free article] [PubMed] [Google Scholar]
- 31.Pepper M, Pagan AJ, Igyarto BZ, Taylor JJ & Jenkins MK Opposing signals from the Bcl6 transcription factor and the interleukin-2 receptor generate T helper 1 central and effector memory cells. Immunity 35, 583–595 (2011). [DOI] [PMC free article] [PubMed] [Google Scholar]
- 32.Yu D et al. The transcriptional repressor Bcl-6 directs T follicular helper cell lineage commitment. Immunity 31, 457–468 (2009). [DOI] [PubMed] [Google Scholar]
- 33.Johnston RJ et al. Bcl6 and Blimp-1 are reciprocal and antagonistic regulators of T follicular helper cell differentiation. Science 325, 1006–1010 (2009). [DOI] [PMC free article] [PubMed] [Google Scholar]
- 34.Nurieva RI et al. Bcl6 mediates the development of T follicular helper cells. Science 325, 1001–1005 (2009). [DOI] [PMC free article] [PubMed] [Google Scholar]
- 35.Zhu J, Yamane H & Paul WE Differentiation of effector CD4 T cell populations (*). Annu Rev Immunol 28, 445–489 (2010). [DOI] [PMC free article] [PubMed] [Google Scholar]
- 36.Valderrama C, Clark A, Urano F, Unanue ER & Carrero JA Listeria monocytogenes induces an interferon-enhanced activation of the integrated stress response that is detrimental for resolution of infection in mice. Eur J Immunol 47, 830–840 (2017). [DOI] [PMC free article] [PubMed] [Google Scholar]
- 37.Good-Jacobson KL & Shlomchik MJ Plasticity and heterogeneity in the generation of memory B cells and long-lived plasma cells: the influence of germinal center interactions and dynamics. J Immunol 185, 3117–3125 (2010). [DOI] [PubMed] [Google Scholar]
- 38.Frey A, Di Canzio J & Zurakowski D A statistically defined endpoint titer determination method for immunoassays. J Immunol Methods 221, 35–41 (1998). [DOI] [PubMed] [Google Scholar]
- 39.Ahmed NN, Grimes HL, Bellacosa A, Chan TO & Tsichlis PN Transduction of interleukin-2 antiapoptotic and proliferative signals via Akt protein kinase. Proc Natl Acad Sci U S A 94, 3627–3632 (1997). [DOI] [PMC free article] [PubMed] [Google Scholar]
- 40.Govern CC, Paczosa MK, Chakraborty AK & Huseby ES Fast on-rates allow short dwell time ligands to activate T cells. Proc Natl Acad Sci U S A 107, 8724–8729 (2010). [DOI] [PMC free article] [PubMed] [Google Scholar]
- 41.Mandl JN, Monteiro JP, Vrisekoop N & Germain RN T cell-positive selection uses self-ligand binding strength to optimize repertoire recognition of foreign antigens. Immunity 38, 263–274 (2013). [DOI] [PMC free article] [PubMed] [Google Scholar]
- 42.Lo WL, Donermeyer DL & Allen PM A voltage-gated sodium channel is essential for the positive selection of CD4(+) T cells. Nat Immunol 13, 880–887 (2012). [DOI] [PMC free article] [PubMed] [Google Scholar]
- 43.Tubo NJ et al. Most microbe-specific naive CD4(+) T cells produce memory cells during infection. Science 351, 511–514 (2016). [DOI] [PMC free article] [PubMed] [Google Scholar]
- 44.Bocharov G, Argilaguet J & Meyerhans A Understanding Experimental LCMV Infection of Mice: The Role of Mathematical Models. J Immunol Res 2015, 739706 (2015). [DOI] [PMC free article] [PubMed] [Google Scholar]
- 45.Fung-Leung WP et al. Antigen presentation and T cell development in H2-M-deficient mice. Science 271, 1278–1281 (1996). [DOI] [PubMed] [Google Scholar]
- 46.Miyazaki T et al. Mice lacking H2-M complexes, enigmatic elements of the MHC class II peptide-loading pathway. Cell 84, 531–541 (1996). [DOI] [PubMed] [Google Scholar]
- 47.Martin WD et al. H2-M mutant mice are defective in the peptide loading of class II molecules, antigen presentation, and T cell repertoire selection. Cell 84, 543–550 (1996). [DOI] [PubMed] [Google Scholar]
- 48.Brundage RA, Smith GA, Camilli A, Theriot JA & Portnoy DA Expression and phosphorylation of the Listeria monocytogenes ActA protein in mammalian cells. Proc Natl Acad Sci U S A 90, 11890–11894 (1993). [DOI] [PMC free article] [PubMed] [Google Scholar]
- 49.Barber DL et al. Restoring function in exhausted CD8 T cells during chronic viral infection. Nature 439, 682–687 (2006). [DOI] [PubMed] [Google Scholar]
Associated Data
This section collects any data citations, data availability statements, or supplementary materials included in this article.