Abstract
Elucidating the mechanisms that sustain asthmatic inflammation is critical for precision therapies. We found that IL-6 and STAT3 transcription factor-dependent upregulation of Notch4 receptor on Iung tissue regulatory T (Treg) cells is necessary for allergens and particulate matter pollutants to promote airway inflammation. Notch4 subverted Treg cells into TH2 and TH17 effector T (Teff) cells by Wnt and Hippo pathway-dependent mechanisms. Wnt activation induced growth and differentiation factor 15 (GDF15) expression in Treg cells, which activated group 2 innate lymphoid cells (ILC2) to provide a feed-forward mechanism for aggravated inflammation. Notch4, Wnt and Hippo were upregulated on circulating Treg cells of asthmatics as a function of disease severity, in association with reduced Treg cell-mediated suppression. Our studies thus identify Notch4-mediated immune tolerance subversion as a fundamental mechanism that licenses tissue inflammation in asthma.
A hallmark of asthma is a chronic inflammatory process that is associated with airway hyper-responsiveness and tissue remodeling1, 2. The persistence of asthmatic inflammation in the face of countervailing immunoregulatory mechanisms that normally limit tissue damage suggests that the latter may become compromised3. In agreement with this premise, subversion of allergen-specific Foxp3+ T regulatory (Treg) cells, leading to the loss of their immune regulatory activity and their conversion into T helper type 2 (TH2) and type 17 (TH17) T effector (Teff)-like cells, has emerged as a key pathogenic mechanism3, 4, 5, 6. Elucidating the molecular mechanisms of Treg cell subversion in asthma and means of restoring their function would offer novel approaches to therapy.
Relevant to immune tolerance breakdown in allergic airway inflammation are recent studies on mechanisms by which air polluting ambient particulate matter (PM), and especially ultrafine particles (UFP), upregulate allergic airway inflammation7, 8. These particles are taken up by alveolar macrophages, where they activate the aryl hydrocarbon receptor to induce the expression of the Notch ligand Jagged1 (Jag1). In turn, Jag1 engages Notch receptors on CD4+ T cells to promote mixed TH2 and TH17 cell-dependent inflammation. Antibody-mediated inhibition of the Notch receptors pointed to Notch4 as the critical Notch receptor involved in this pathway8. The identity of the CD4+ T cell subpopulation(s) expressing Notch4, the signals that regulate its induction and its downstream effector pathways remained unknown. Here, we identify Notch4 as a master molecular switch that subverts lung tissue Treg cell function to promote allergic airway inflammation. Notch4 is mainly induced on allergen-specific induced (i)Treg cells in an allergen and interleukin-6 (IL-6)-dependent manner, and acts to disrupt their function by Wnt and Hippo pathway-dependent mechanisms. Importantly, Notch4 acts via the Wnt pathway to induce the expression in lung tissue Treg cells of the cytokine growth and differentiation factor 15 (GDF15). The latter is a cytokine previously implicated in metabolic adaption to inflammation9, 10, which we show here to upregulate allergic tissue inflammation by directly activating group 2 innate lymphoid cells (ILC2). These findings place Notch4 at the intersection of allergen and pollutant-driven airway inflammation and suggest novel intervention strategies targeting Notch4 to restore long-term immune tolerance in asthma and related disorders.
Results
Notch4 is inducibly expressed on Treg cells in allergic airway inflammation.
We determined by real time (RT-)PCR the identity of the Notch receptor species expressed in lung tissue Treg and Teff cells isolated from sham (PBS) and ovalbumin (OVA)-sensitized mice following their challenge with OVA, and from OVA-sensitized mice co-treated with intranasal UFP during the OVA challenge phase (OVA+UFP). Notch4 transcript expression was enriched in lung Treg cells at baseline as compared to Teff cells, and was sharply upregulated in OVA and especially OVA+UFP treated mice relative to Notch1–3 species (Fig. 1a). These results were corroborated by flow cytometric analysis of the expression of respective Notch receptors in Treg and Teff cells, which confirmed the differential upregulation of Notch4 on lung Treg cells in allergic airway inflammation (Fig. 1b,c; Extended Data Fig. 1).
Fig. 1. Notch4 expression on lung Treg cells in allergic airway inflammation.
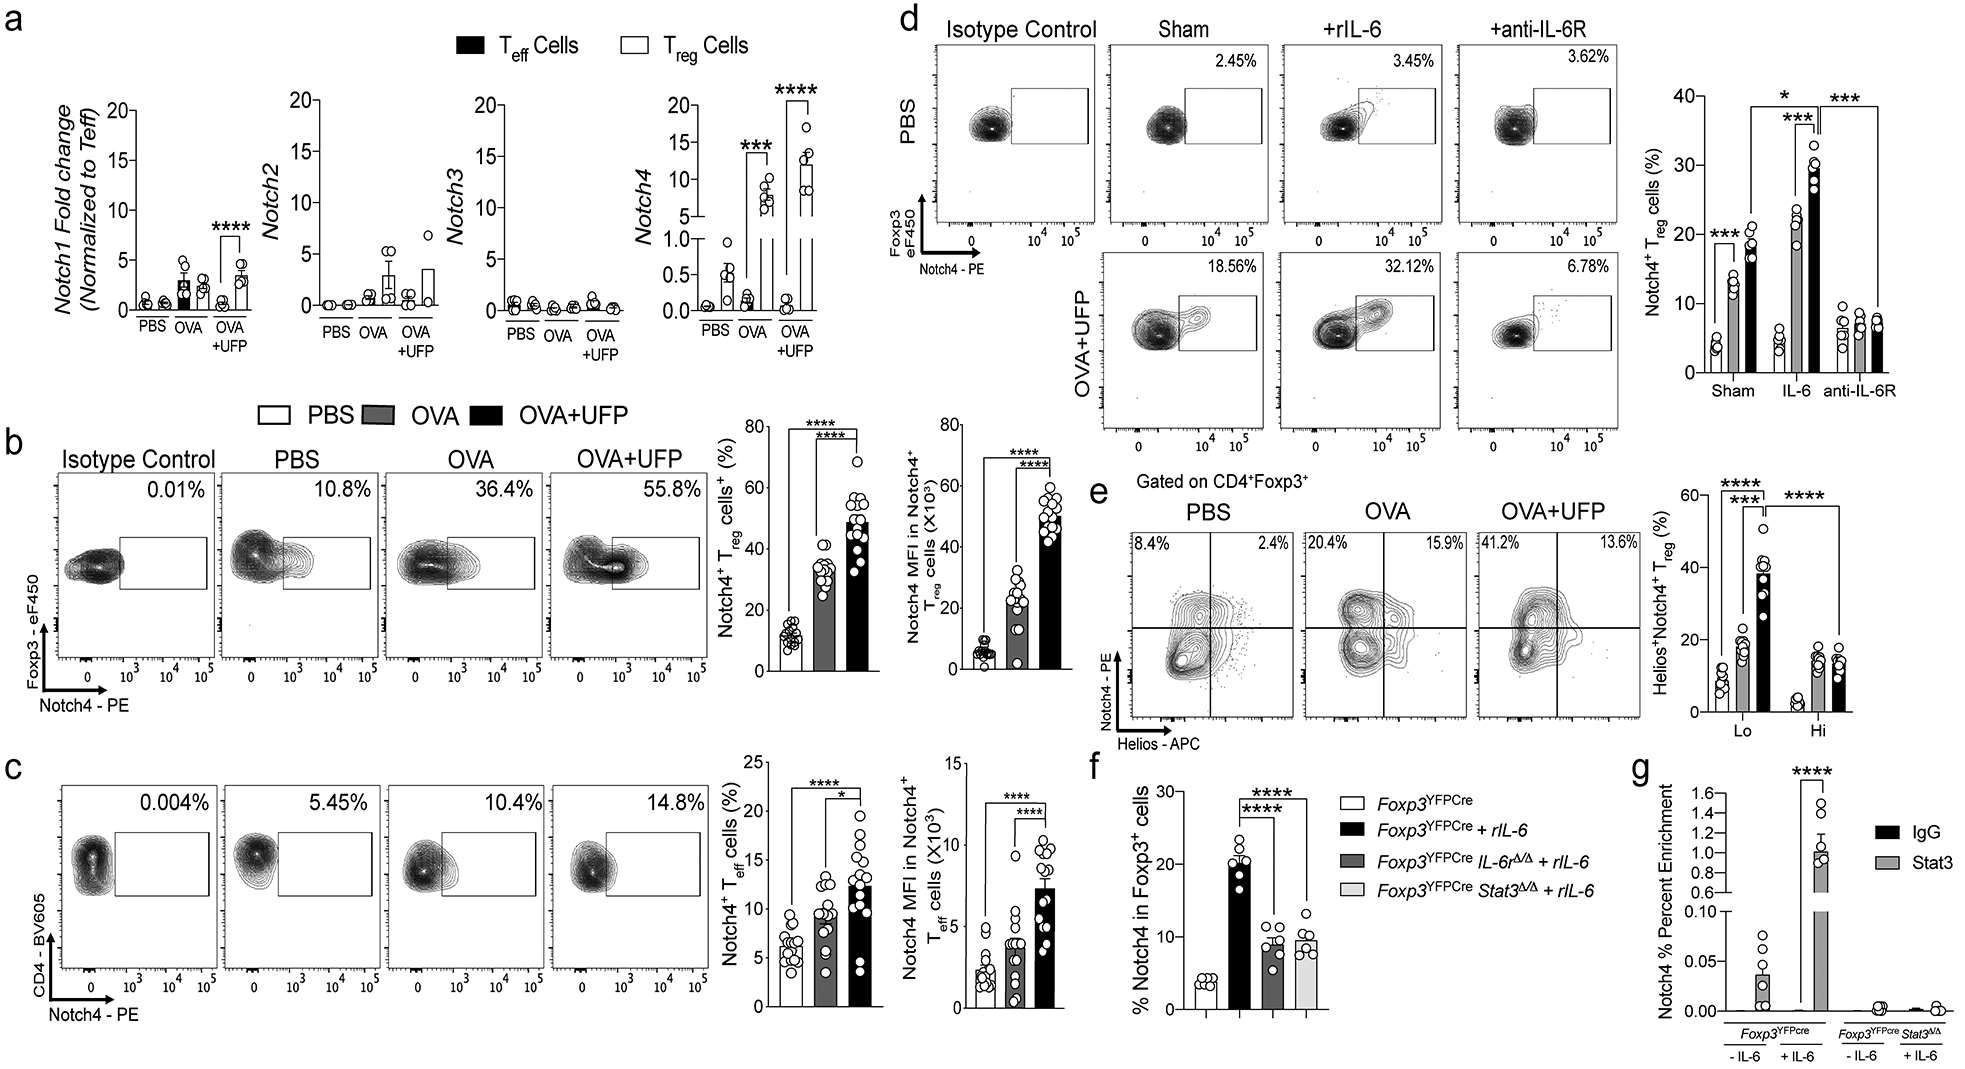
a, RT-PCR of Notch1-4 transcripts in lung Treg and Teff cells isolated from PBS, OVA and OVA+UFP mouse groups (n=5). b,c, Flow cytometric analysis, cell frequencies and mean fluorescence intensity (MFI) of Notch4 expression on lung Treg and Teff cells in the respective treated groups (n=15). d, Flow cytometric analysis and cell frequencies of Notch4 expression on OT-II+CD4+Foxp3+ T cells generated in co-cultures with sham or OVA323–339+UFP-pulsed alveolar macrophages without or with IL-6 or anti-IL-6R mAb (n=5). e, Flow cytometric analysis and cell frequencies of Notch4+Helios– and Helios+ lung Treg cells isolated from the respective treated groups (n=5). f, Flow cytometric analysis and cell frequencies of Notch4 expression on in vitro differentiated Treg cells derived from naive CD4+ T cells isolated from Foxp3YFPCre, Foxp3YFPCreIl6rΔ/Δ and Foxp3YFPCreStat3Δ/Δ mice and either untreated or treated with IL-6 (n=6). g, ChIP assays for the binding of STAT3 and control (IgG) antibodies to the Notch4 promoter in lung Treg cells of OVA+UFP-treated Foxp3YFPCre, and Foxp3YFPCreStat3Δ/Δ mice (n=6). Each symbol represents one mouse. Numbers in flow plots indicate percentages. Error bars indicate SEM. Statistical tests: One-way ANOVA with Dunnett’s post hoc analysis (b,c,f); two-way ANOVA with Sidak’s post hoc analysis (a,d,e,g). *P<0.05, ***P<0.001, ****P<0.0001. Data representative of two or three independent experiments.
To examine the signals driving the induction of Notch4 on iTreg cells, we employed an in vitro iTreg cell differentiation system in which naive CD4+ T cells expressing the OT-II T cell receptor (TCR), specific for the OVA323–339 peptide were incubated with OVA323–339-pulsed primary alveolar macrophages (AM)8. The latter cell type potently drives iTreg cell differentiation under non-inflammatory conditions, and at the same time critically promotes allergic airway inflammation by allergens and UFP by virtue of their inducible expression of Notch ligands, most notably Jag18. Results revealed a stepwise increase in Notch4 expression in differentiating iTreg cells in co-cultures with OVA323–339- and OVA323–339 +UFP-pulsed AM (Fig. 1d). Addition of IL-6 to the cell cultures, but not IL-1β, tumor necrosis factor (TNF), IL-25 and Thymic Stromal Lymphopoietin (TSLP), resulted in super-induction of Notch4 expression on differentiating iTreg cells in an antigen-dependent manner. IL-33 treatment did not induce Notch4 on its own, but augmented the expression of Notch4 induced by IL-6 (Fig. 1d; Extended Data Fig. 1). In contrast, treatment with an anti-IL-6 receptor (IL-6R) monoclonal antibody (mAb) suppressed Notch4 expression induced by OVA323–339- and OVA323–339 +UFP-pulsed AM. Notch4 differentially localized in the de novo induced lung Treg (iTreg) cells as evidenced by their lack of Helios expression (Helios– Treg cells) (Fig. 1e). Furthermore, in an antigen presenting cell-free system of in vitro iTreg cell differentiation by treatment of naive T cells with anti-CD3+anti-CD28 mAbs in the presence of transforming growth factor beta 1 (TGF-β1)11, addition of IL-6 to the cell culture induced Notch4 on differentiating Treg cells, which was attenuated by Treg cell-specific deletion of IL-6R alpha chain or the downstream transcription factor STAT3 using a Foxp3-driven Cre recombinase and floxed target alleles (Foxp3YFPCreIl6raΔ/Δ and Foxp3YFPCreStat3Δ/Δ, respectively) (Fig. 1f). Chromatin immunoprecipitation confirmed IL-6-dependent STAT3 binding to the Notch4 promoter in Treg cells, but not to those of Notch1, Notch2 or Notch3 (Fig. 1g; Extended Data Fig. 1). These results identified IL-6 is a key inducer of Notch4 expression on differentiating allergen-specific lung tissue iTreg cells.
Notch4 subverts Treg cell-mediated immune tolerance in allergic airway inflammation.
To elucidate the pathogenic role of inducible Notch4 expression on lung T cells in allergic airway inflammation, we employed CD4CreNotch4Δ/Δ mice, in which a floxed Notch4 allele is specifically deleted in all T cells (Extended Data Fig. 2a). Results showed that deletion of Notch4 in CD4+ T cells greatly attenuated airway inflammation induced in OVA-sensitized and challenged mice, without or with UFP treatment (Fig. 2a,b). Notch4 deletion largely suppressed the increase in airway hyper-responsiveness (AHR) induced by OVA, and its super induction by UFP co-treatment (Fig. 2c). Because Notch4 is preferentially induced in Treg cells in allergic airway inflammation, we employed Foxp3YFPCreNotch4Δ/Δ mice, in which the floxed Notch4 allele is specifically deleted in Treg but not in Teff cells, leading to the complete selective loss of Notch4 expression in the latter cells (Extended Data Fig. 2a,b). The attenuated allergic airway inflammation noted in CD4CreNotch4Δ/Δ mice was completely reproduced in Foxp3YFPCreNotch4Δ/Δ mice, indicating that the effect of Notch4 deletion is localized to Treg but not to Teff cells (Fig. 2a–c). Notch4 deletion in CD4+ T cells or specifically in Treg cells suppressed total and OVA-specific IgE responses, and T cell and eosinophil infiltration of lung tissues (Fig. 2d–g). Notch4 deletion also suppressed lung tissue TH2 and TH17 cell responses and reversed the destabilization of lung tissue Treg cells towards TH2 and TH17 cell-like phenotypes, while keeping the Teff and Treg cell IFN-γ response unaltered (Fig. 2h,i; Extended Data Fig. 2c).
Fig. 2. Notch4 expression on lung Treg cells licenses allergic airway inflammation.
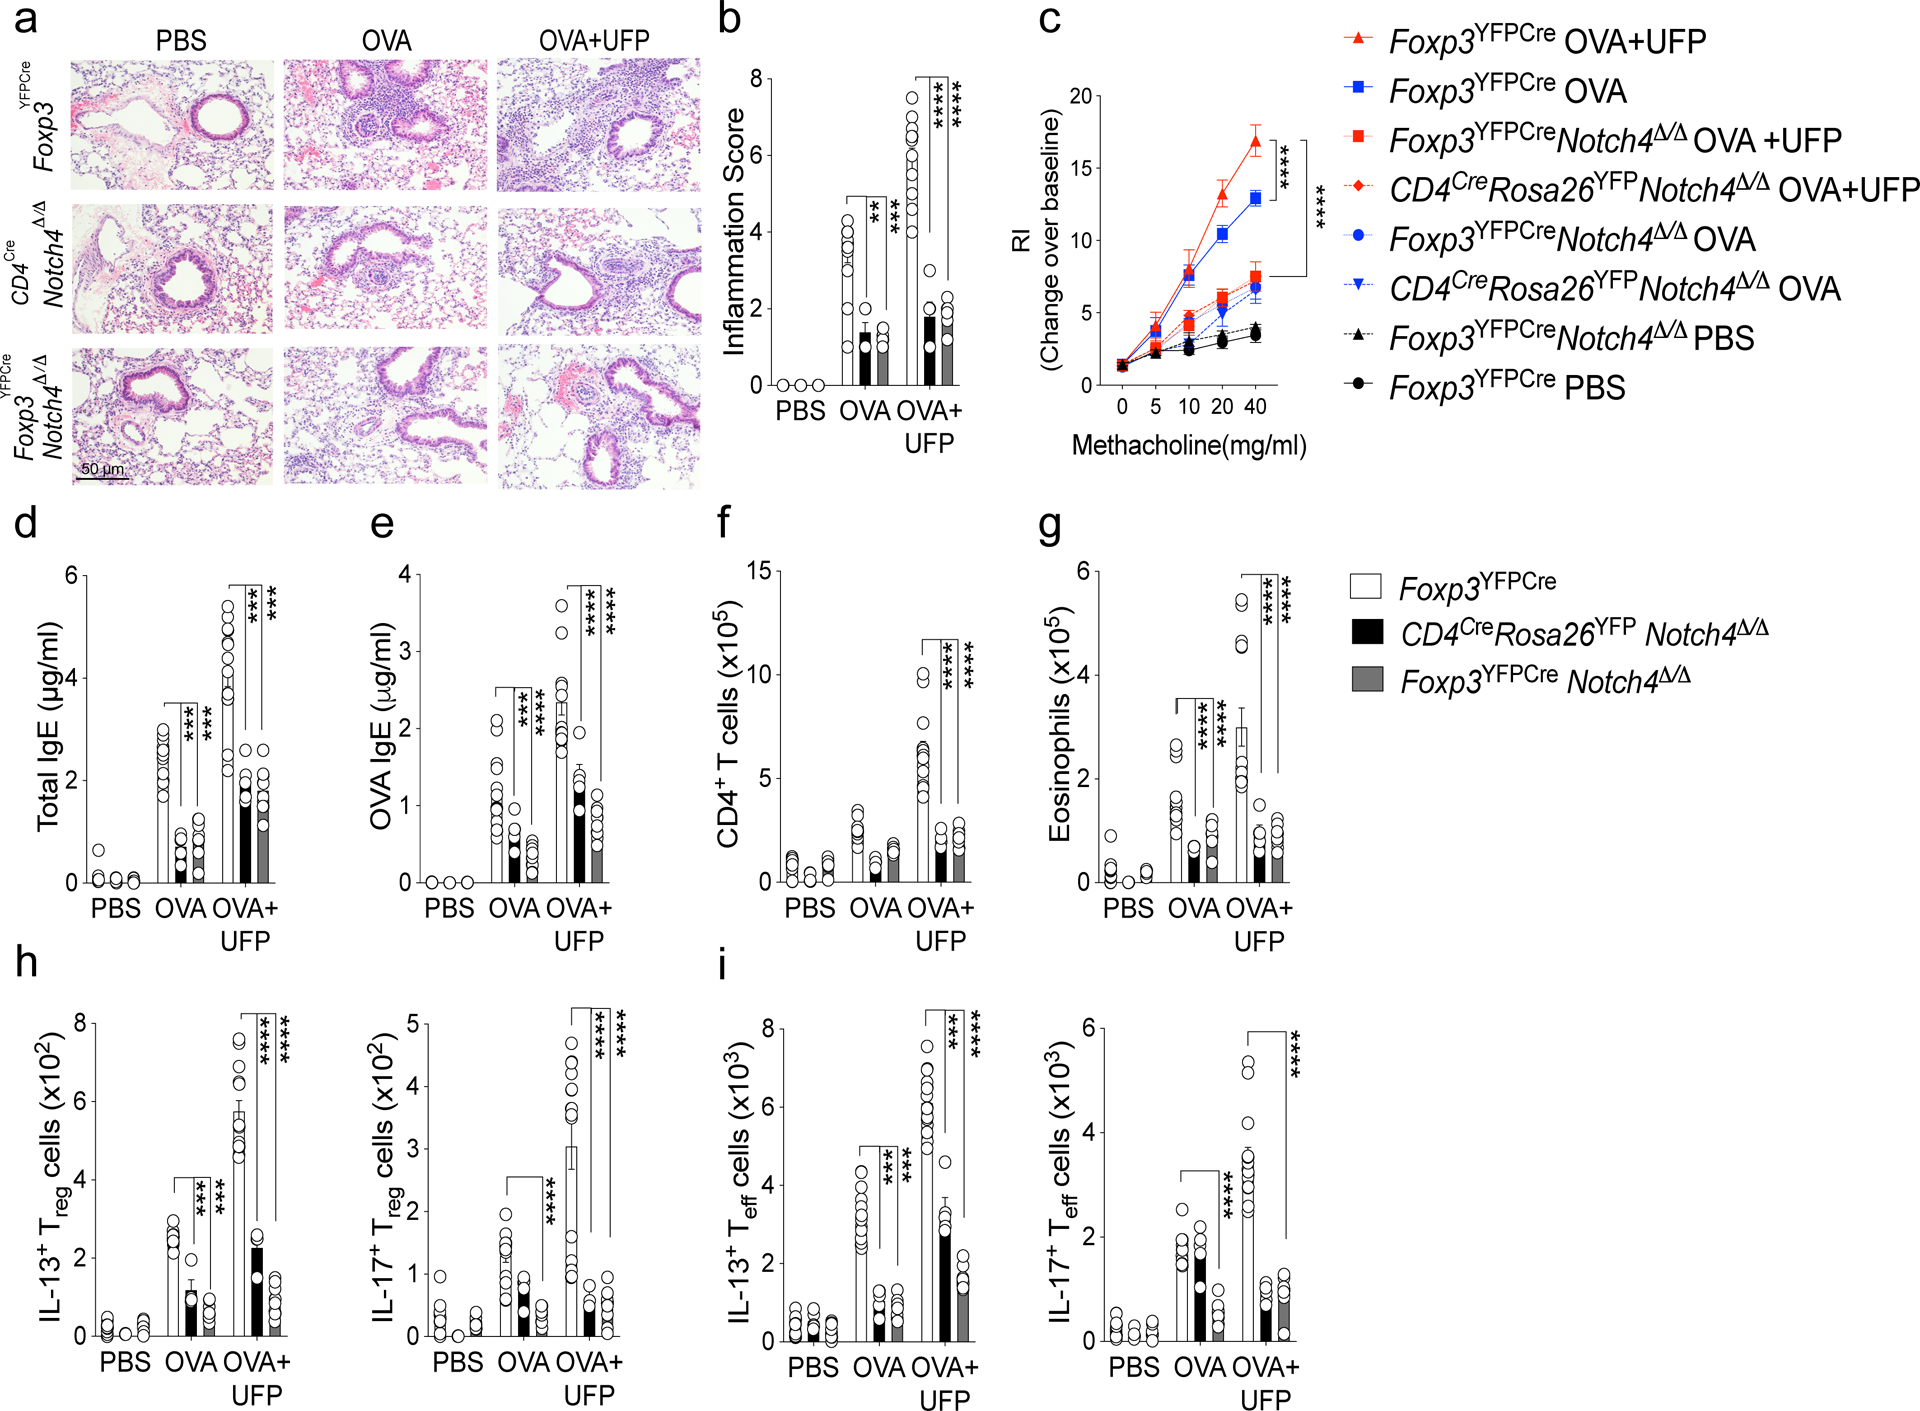
a, Representative PAS-stained sections of lung tissues isolated from Foxp3YFPCre, CD4CreNotch4Δ/Δ or Foxp3YFPCreNotch4Δ/Δ mice segregated into PBS, OVA or OVA+UFP-treated groups (200X magnification). b, Inflammation scores in the respective lung tissues. c, AHR in the respective mouse groups in response to methacholine. (d,e) serum total and OVA-specific IgE concentrations. f,g, absolute numbers of lung CD4+ T cells and eosinophils. (h,i) IL-13 and IL-17 expression in lung Foxp3+CD4+ Treg (h), and Foxp3–CD4+ Teff cells. (i). Each symbol represents an independent sample. Numbers in flow plots indicate percentages. Error bars indicate SEM. Statistical tests: two-way ANOVA with Sidak’s post hoc analysis (b-i). **P<0.01, ***P<0.001, ****P<0.0001. Data representative of two or three independent experiments. (White bars n=15), (black bars n=5) and (grey bars n=15).
To assess the disease suppressive capacities of allergen-specific iTreg cells that are lacking in Notch4 expression, we used an adoptive transfer model in which iTreg cells were derived in vitro from naive splenic CD4+ T cells of Foxp3YFPCre and Foxp3YFPCreNotch4Δ/Δ mice that concurrently expressed the OTII transgene. The cells were adoptively transferred into OVA-sensitized Foxp3YFPCre mice, which were then challenged with aerosolized OVA and analyzed (Extended Data Fig. 2e–f). OTII+ Notch4-deficient iTreg cells were superior to their Notch4-sufficient counterparts in suppressing the different attributes of OVA-induced airway inflammation, including AHR, tissue eosinophilia and lymphocytosis in the lungs of the recipient mice. They were also superior in suppressing IL-4, IL-13 and IL-17 expression in the recipient lung Teff and Treg cells.
The salutary effects of Notch4 deletion on allergic airway inflammation was fully reproduced by Treg cell-specific deletion of Pofut1, encoding an enzyme that mediates o-fucosylation of Notch receptors, a requisite event in their glycosylation modification that is essential to their function (Extended Data Fig. 3)12, 13. To determine the role of the canonical versus non-canonical pathways in mediating the effects of Notch signaling on Treg cells in airway inflammation, we examined the impact of Treg cell-specific deletion of Rbpj, encoding the canonical Notch adaptor RBPJ, on airway responses13, 14. Results revealed that Foxp3YFPCreRpbjΔ/Δmice exhibited decreased AHR and tissue eosinophilia in-between those of Foxp3YFPCrePofut1Δ/Δ and Foxp3YFPCre mice (Extended Data Fig. 3). However, whereas the TH2 cell responses were suppressed, the TH17 cell responses were unaffected, indicating that the latter proceeds by a Notch non-canonical pathway. In contrast, Treg cell-specific deletion of floxed Notch1 or Notch2 alleles, or global deletion of Notch3, had no impact on allergic airway inflammation (Extended Data Fig. 4).
The relationship between Notch4 expression in Treg cells and airway inflammation was also investigated by interrupting upstream pathways regulating its expression. Treg cell-specific deletion of Il6ra or Stat3 recapitulated the protective effect of Treg cell Notch4 deficiency. Both deletions attenuated OVA-induced allergic airway inflammation, with decreased AHR, airway eosinophilia, total and OVA specific IgE, and TH2 and TH17 cell responses (Extended Data Fig. 5).
Treg cell-specific Notch4 deletion was also found to be similarly protective across different aeroallergens. Thus, in a house-dust mite-induced model of allergic airway inflammation, it also suppressed airway inflammation and AHR, tissue eosinophilia and neutrophilia and TH2/TH17 cell responses (Extended Data Fig. 6). It was also protective in a chronic model of allergic airway inflammation in which, in addition to suppressing the inflammatory and allergic responses noted above, it also suppressed sub-epithelial collagen deposition, a hallmark of airway remodeling due to chronic inflammation (Extended Data Fig. 7)15. Altogether, these results highlighted the critical role of IL6-STAT3-dependent Notch4 signaling pathways in the destabilization and dysregulation of lung Treg cells in allergic airway inflammation.
Notch4 activates the Hippo and Wnt pathways to disrupt Treg cell functions.
To further investigate the mechanisms by which Notch4 disrupted Treg cell function, we analyzed the transcriptional profiles of Treg cells isolated from the lungs of sham and OVA+UFP treated Foxp3YFPCre and Foxp3YFPCreNotch4Δ/Δ mice. Results revealed a Notch4-dependent dysregulation of several pathways in OVA+UFP treated mice previously shown to impact Treg cell stability and/or function, with particularly prominent changes in the Hippo (Wwtr1, Yap1, Tead1, Tead2, Tead3, Tead 4, Foxo6)16, 17, and Wnt pathways (Ctnnb1, Serpine1, Fzd5,8,10 and Wnt4,5a,8a,9a,9b,11)18, 19 (Fig. 3a,b; Data set 1). Notch4-dependent upregulation of the Hippo and Wnt pathways was confirmed by flow cytometry, which revealed increased expression of the Hippo pathway effector Yap, encoded by Yap1, and the Wnt pathway β-catenin, encoded by Ctnnb1, in lung Treg cells in OVA and OVA+UFP-driven allergic airway inflammation. This increase was sharply downregulated upon Treg cell-specific Notch4 deletion (Fig. 3c,d). The regulation of the Hippo pathway by Notch4 was further investigated by analyzing the phosphorylation of the Hippo pathway intermediates Mob1 and Lats1 in lung Treg cells of sham and OVA+UFP treated Foxp3YFPCre and Foxp3YFPCreNotch4Δ/Δ mice. Notch4 deletion upregulated the phosphorylation of Mob1 and Lats1, which is consistent with dampening Hippo pathway activation by promoting Lats1/2 kinase-dependent proteolysis of the effector proteins Yap and Taz. These results indicate that Notch4 activates Hippo-dependent transcription by silencing its kinase cascade (Fig. 3e,f).
Fig. 3. Notch4-dependent transcriptional programs in lung Treg cells.
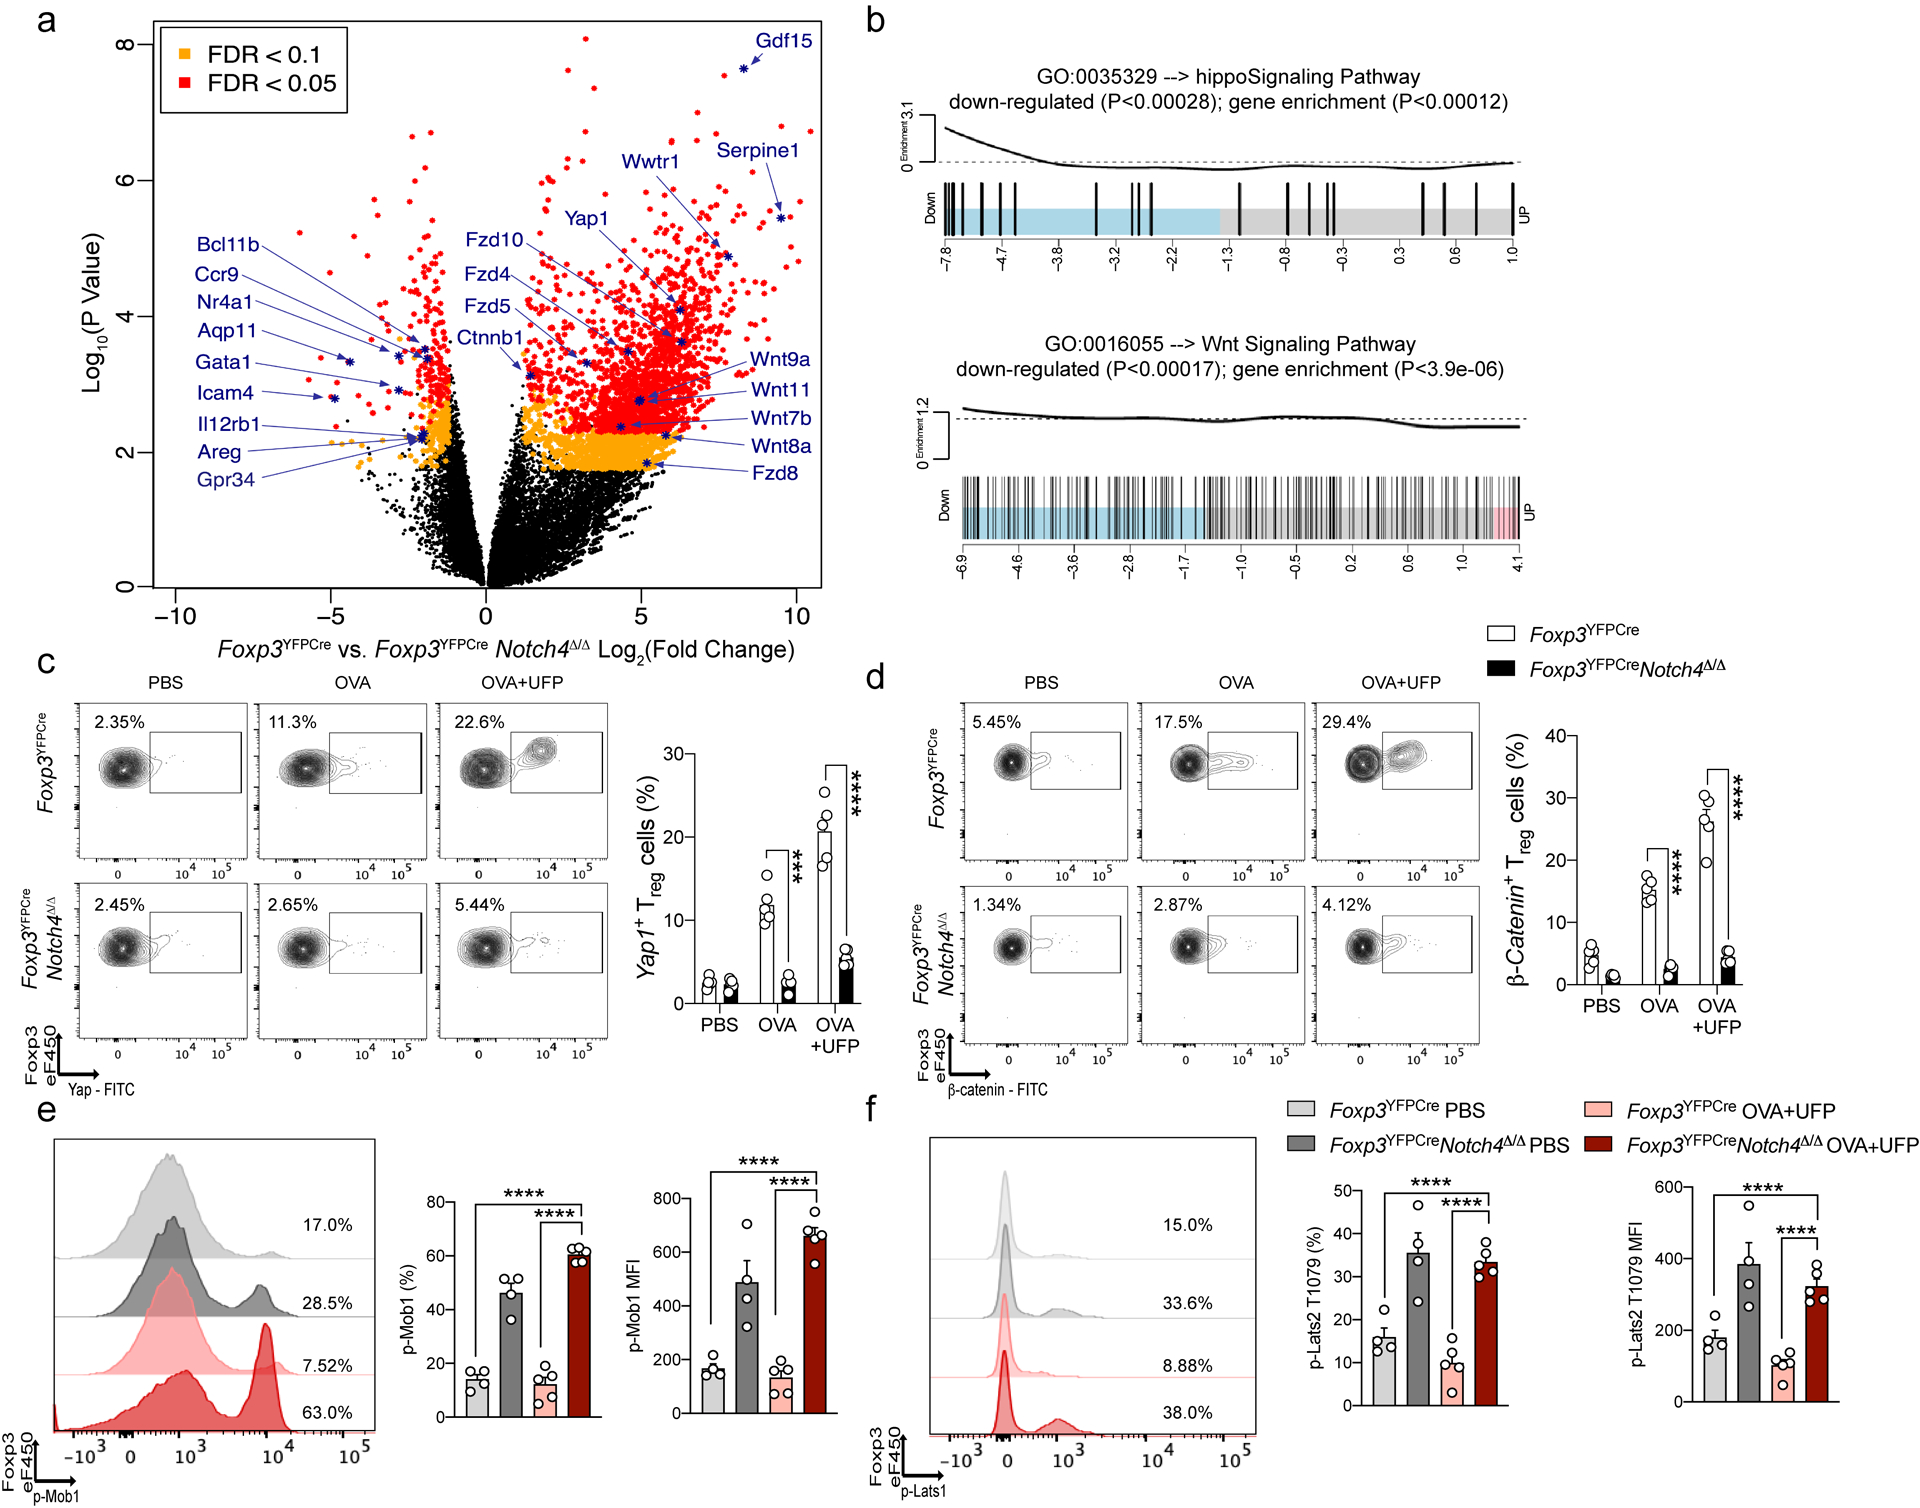
a, Volcano plot of differential gene expression in Foxp3YFPCre versus Foxp3YFPCreNotch4Δ/Δ Treg cells treated with OVA+UFP. FDR, false discovery rate; log2FC, log2(fold change). b, Enrichment pathway analysis of Hippo and Wnt pathways. c, Flow cytometric analysis and cell frequencies of Yap1 expression on lung Treg cells in the respective treated groups (n=5). d, Flow cytometric analysis and cell frequencies of β-Catenin expression on lung Treg cells in the respective treated groups (n=5). e, representative histogram, cell frequencies and MFI of phospho-Mob1 expression on lung Treg cells in the respective treated groups (light grey bar n= 4, dark grey bar n=4, light red bar n=5 and dark red bar n=4). f, representative histogram, cell frequencies and MFI of phospho-Lats1 T1079 expression on lung Treg cells in the respective treated groups (light grey bar n= 4, dark grey bar n=4, light red bar n=5 and dark red bar n=4). Each symbol represents an independent sample. Numbers in flow plots indicate percentages. Error bars indicate SEM. Statistical tests: two-way ANOVA with Sidak’s post hoc analysis (c,d); one-way ANOVA with Dunnett’s post hoc analysis (e,f). ***P<0.001, ****P<0.0001.
To determine the role of the Hippo and Wnt pathways in mediating Treg cell subversion by Notch4, we examined the consequences of Treg cell-specific deletion of genes encoding key components of the respective pathways on allergic airway inflammation induced by OVA+UFP. Combined Treg cell-specific deletion of Yap1 and Wwtr1, encoding the Hippo pathway transcriptional regulators Yap and Taz respectively20, partially attenuated inflammation and AHR, whereas Treg cell-specific deletion of Ctnnb1, encoding β-catenin21, largely recapitulated the effect of Treg cell-specific Notch4 deletion in suppressing those parameters, with neither deletion affecting Notch4 expression (Fig. 4a–h). Yap1 and Wwtr1 deletion suppressed TH17 and, to a lesser extent, TH2 cell responses in the airways while upregulating TH1 cell responses (Fig. 4a–d). In contrast, Ctnnb1 deletion profoundly suppressed the TH2 cell-like reprogramming of Notch4hi Treg cells and the airway conventional TH2 cell response but left the TH17 cell responses unaffected (Fig. 4e–h). Combined deletion of Yap1, Wwtr1 and Ctnnb1 in Treg cells reproduced the full effect of Notch4 deletion in suppressing allergic airway inflammation and TH2 and TH17 responses (Fig. 4i,j). These results indicated that the Hippo and Wnt pathways mediated distinct, complementary aspects of Notch4 signaling in disrupting immune tolerance in allergen and pollutant-induced allergic airway inflammation.
Fig. 4. Regulation of allergic airway inflammation by Notch4-dependent Hippo and Wnt pathway.
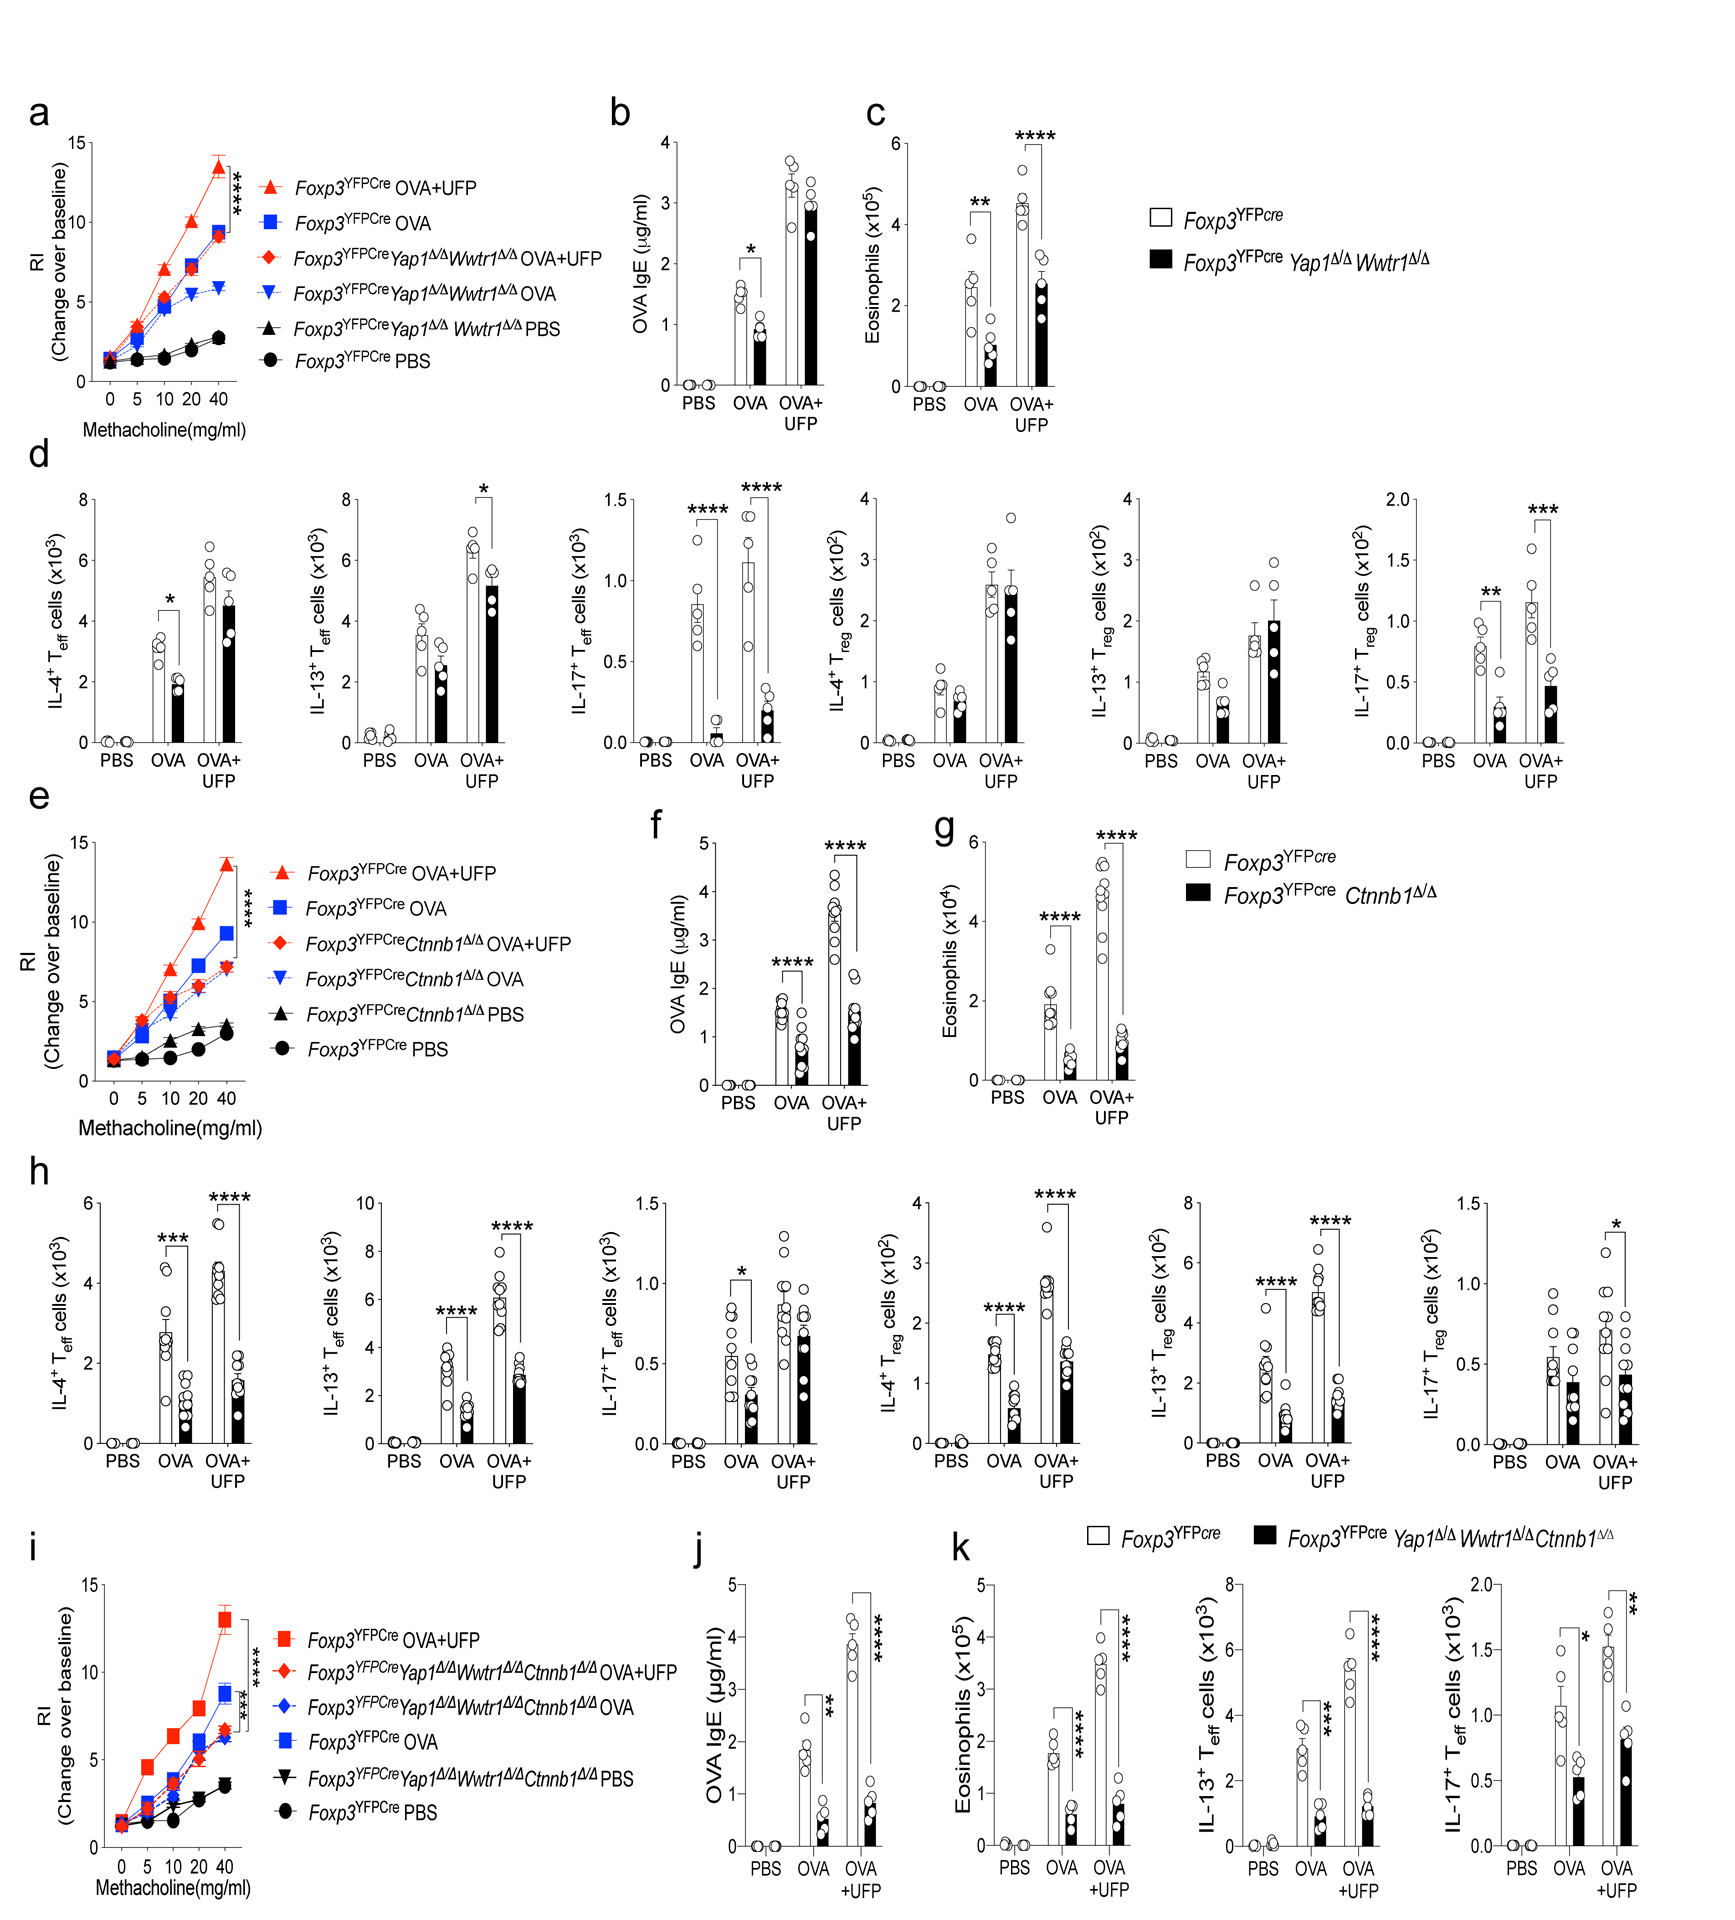
a,e,i, AHR in the respectively treated Foxp3YFPCreWwtr1Δ/ΔYap1Δ/Δ (a), Foxp3YFPCreCtnnb1Δ/Δ mice (e) and Foxp3YFPCreWwtr1Δ/ΔYap1Δ/ΔCtnnb1Δ/Δ (i) compared to control Foxp3YFPCre mice in response to methacholine (a, n=15, e, and i n=5). b,f, and j OVA specific IgE titers (b, n=15, f, and j n=5) (c,d, g,h, k) Absolute lung tissue eosinophils and IL-4+, IL-13+ and IL-17+ Teff and Treg cells in Foxp3YFPCreWwtr1Δ/ΔYap1Δ/Δ, Foxp3YFPCreCtnnb1Δ/Δ and Foxp3YFPCreWwtr1Δ/ΔYap1Δ/ΔCtnnb1Δ/Δ mice compared to control Foxp3YFPCre mice (c,d, n=15 g,h, k n=5). Each symbol represents an independent sample. Numbers in flow plots indicate percentages. Error bars indicate SEM. Statistical tests: two-way ANOVA with Sidak’s post hoc analysis (a-k). *P<0.05, **P<0.01, ***P<0.001, ****P<0.0001. Data representative of two or three independent experiments.
Notch4 promotes Treg cell destabilization towards TH2 and TH17 cell fates.
To determine whether Notch4 acted to destabilize lung Treg cells to give rise to Foxp3– TH2 and TH17 ex-Treg cells, we employed a lineage tracing approach using a Rosa26 Stop-flox EGFP reporter (R26EGFP) crossed to FoxpYFPCre. Foxp3YFPCreNotch4Δ/ΔR26EGFP and control Foxp3YFPCreR26EGFP mice were either sham or OVA sensitized and then challenged with aerosolized OVA without or with intranasal UFP treatment. Cytokine expression was examined in Treg (YFP+EGFP+), ex-Treg (YFP–EGFP+) and CD4+ Teff cells (YFP–EGFP–). The frequencies of YFP–EGFP+ ex-Treg cells were markedly increased in the lungs of Foxp3YFPCreR26EGFP OVA sensitized and challenged group, and were further increased in the OVA+UFP treated group, with the exTreg cells reaching up to a third of the total Treg lineage-derived (EGFP+) cells in the lung (Fig. 5a). In contrast, the ex-Treg cells were markedly decreased in the equivalent Foxp3YFPCreNotch4Δ/ΔR26EGFP groups, indicative of heightened Treg cell instability mediated by Notch4 (Fig. 5a). Approximately half of the ex-Treg cells were TH2 and TH17-skewed cells at a ratio of 3:1, with both being suppressed in Foxp3YFPCreNotch4Δ/ΔR26EGFP mice (Fig. 5b,c).
Fig. 5. Notch4 destabilizes Treg cell in a Hippo pathway-dependent manner.
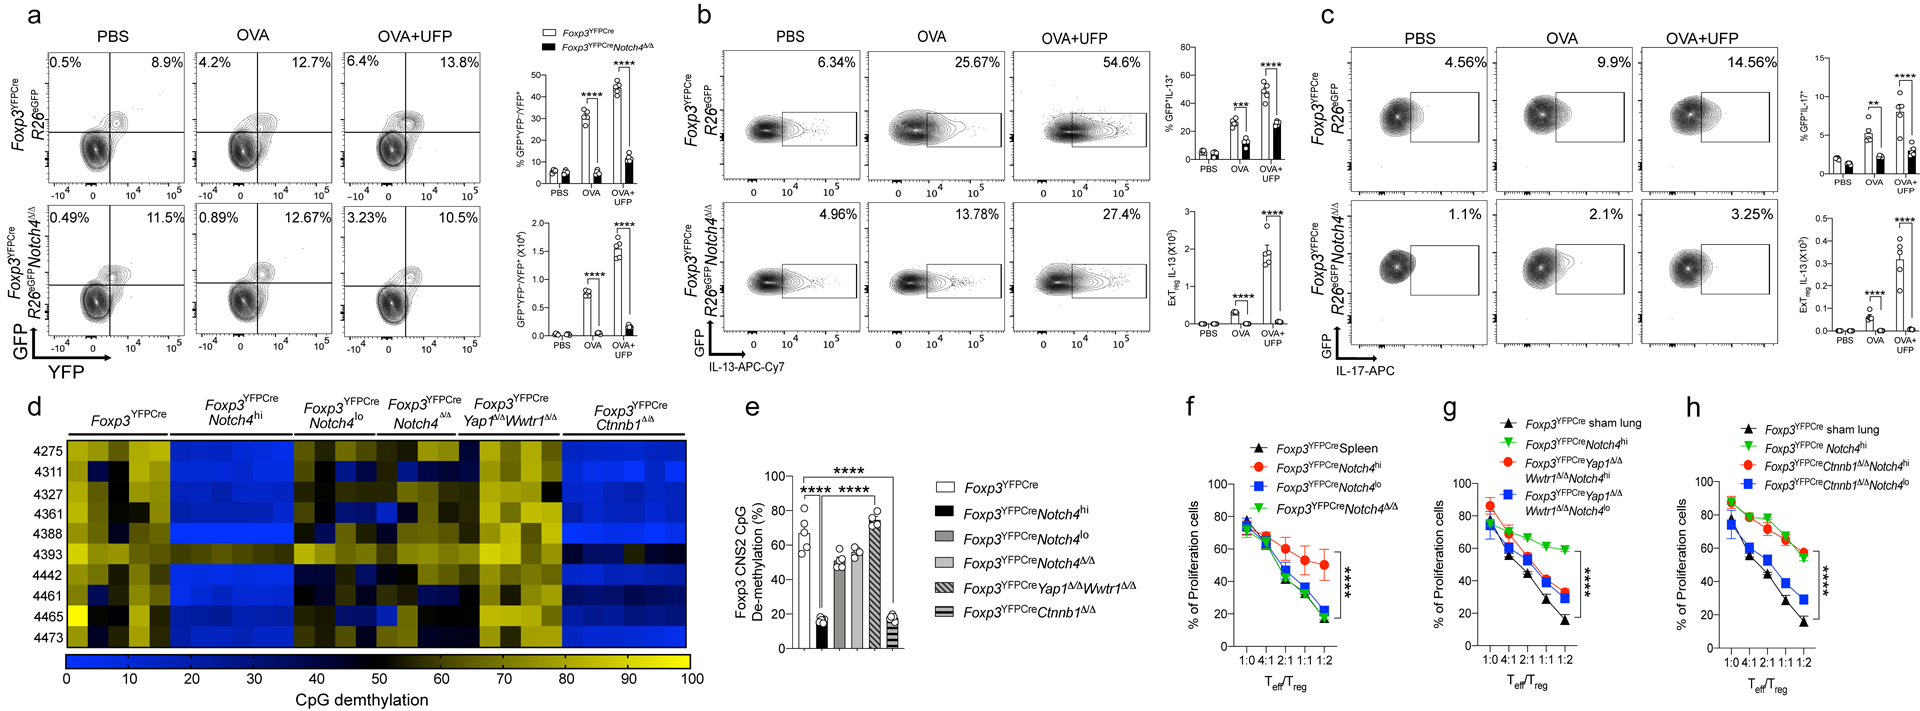
a, flow cytometric analysis and frequencies of exTreg (GFP+YFP–) cells, plotted as a fraction of exTreg to total Treg (GFP+) cells in lung tissue (n=5). b,c, Flow cytometric analysis and frequencies of IL-13 (n=5) (b) and IL-17 (n=5) (c) producing exTreg cells in lung tissues. d, Methylation status of CpG motifs of the foxp3 CNS2 region in Treg cells isolated from lung tissue of sham versus OVA+UFP–sensitized and challenged mice of the respectively indicated genotypes. Numbers on the left side indicate the position of the respective motifs. e, Global methylation status of Foxp3 CNS2 in the respective Treg cell populations (white bar n=5, black bar n=6, dark grey bar n=5, light grey bar n=4, grey line bar n=4 and grey line bar n=6). f-h, In vitro suppression of the proliferation of WT responder CD4+ T cells (Teff) by the respective Treg cell populations (panel f, black line n=3, red line n=6, blue line n=6, green line n=3), (panel g, black line n=3 , green line n=3, red line n=3, blue line n=3) and (panel h, black line n=3, green line n=3, red line n=3, blue line n=3). Each symbol represents an independent sample. Numbers in flow plots indicate percentages. Error bars indicate SEM. Statistical tests: two-way ANOVA with Sidak’s post hoc analysis (a-c) and (f-h); One-way ANOVA with Dunnett’s post hoc analysis (e), **P<0.01, ****P<0.0001. Data representative of two or three independent experiments.
To investigate the source of Notch4-mediated Treg cell instability, we further examined the epigenetic methylation signature of the Foxp3 CNS2 promoter region, which inversely affects Treg cell lineage stability22, 23. There was increased methylation of the CpG elements in the Foxp3 CNS2 of Treg cells isolated from the lungs of OVA+UFP-treated mice as compared to those of sham treated mice, which segregated with high but not low Notch4 expression (Notch4hi versus Notch4lo) (Fig. 5d,e). Increased CNS2 CpG methylation was also reversed upon Treg cell-specific deletion of Notch4 compared to that of total lung Treg cells of Foxp3YFPCre control mice. Combined Yap1 and Wwtr1 but not Ctnnb1 deletion fully reversed the increased methylation of the Foxp3 CNS2 in lung Treg cells of OVA/UFP-treated mice, indicating that the destabilization of Treg cells by Notch4 signaling was mediated by the Hippo but not by the Wnt pathway (Fig. 5d,e).
We also investigated the role of Notch4 expression in impairing Treg cell function by sorting out Notch4hi versus Notch4lo Treg cells from the lungs of Foxp3YFPCre OVA+UFP treated group as well as Treg cells from untreated control Foxp3YFPCre mice and examining these three groups of Treg cells for their suppressive capacity. Whereas the Notch4lo lung Treg cells from OVA+UFP treated mice were equivalent to control lung Treg cells in their capacity to inhibit in vitro T cell proliferation, the suppressive function of Notch4hi lung Treg cells was profoundly impaired (Fig. 5f). Combined Yap1 and Wwtr1 but not Ctnnb1 deletion fully restored the in vitro suppressive function of Notch4hi Treg cells, consistent with the impact of the respective pathways on CNS2 demethylation (Fig. 5g,h). Overall, these results indicated that Notch4 induced Treg cell instability and TH2 and TH17-cell-like reprogramming in the context of allergic airway inflammation, and that this destabilization was associated with epigenetic methylation at the Foxp3 CNS2 locus mediated by the Hippo pathway.
A Treg cell Notch4-Wnt-GDF15 pathway promotes ILC2 expansion and activation.
ILC2 play a key role in allergic airway inflammation by virtue of copious secretion of type 2 cytokines, most prominently IL-1324. Total ILC2 as well as IL-13-expressing ILC2 were sharply increased in OVA and especially OVA+UFP-treated mice but were dramatically reduced upon deletion of Notch4 in Treg cells (Fig. 6a). The effect of Treg cell-specific Notch4 deletion on ILC2 expansion and activation was reproduced by Ctnnb1 but not Yap1 and Wwtr1 Treg cell-specific deletion (Fig. 6a). In vitro studies revealed that Notch4hi Treg cells derived from OVA+UFP-treated Foxp3YFPCre mice failed to suppress the upregulation of IL-13 expression in ILC2 derived from the inflamed lungs of the same mice (Fig. 6b). In contrast, Notch4lo lung Treg cells derived from the OVA+UFP-treated Foxp3YFPCre mice or Notch4-deficient Treg cells derived from OVA+UFP-treated Foxp3YFPCreNotch4Δ/Δ mice potently suppressed IL-13 expression, as did treatment of Notch4hi Treg cells with an anti-Notch4 mAb (Fig. 6b). Further analysis revealed that Treg cell-specific Ctnnb1 but not Yap and Taz deletion restored the ILC2 suppressive function of Notch4hi Treg cells, thus implicating the Wnt pathway in the failure of ILC2 regulation (Fig. 6c).
Fig. 6. Notch4 promotes ILC2 activation via a GDF15-dependent mechanism.
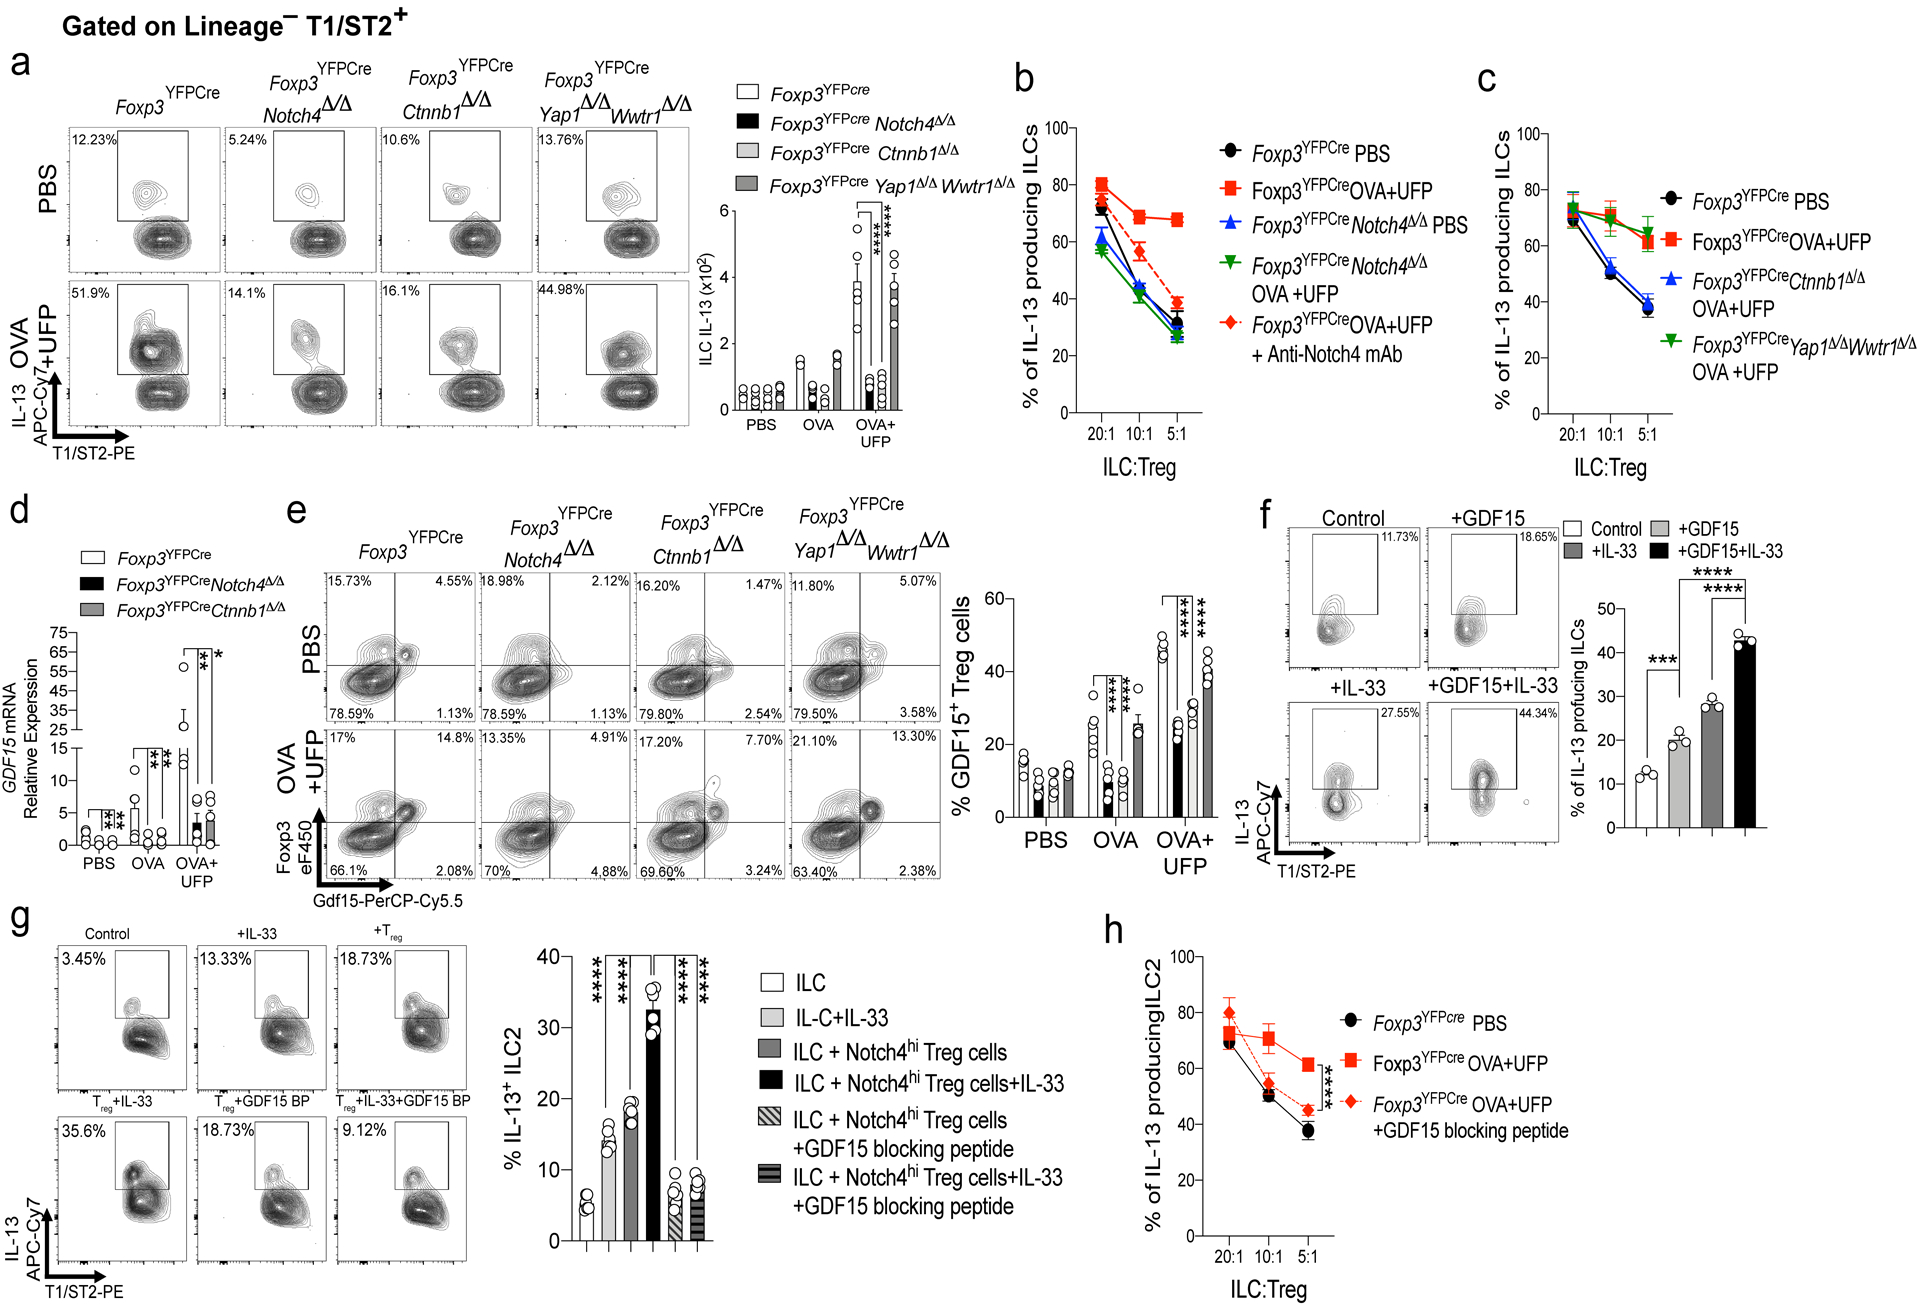
a, flow cytometric analysis and frequencies of IL13+ ILC2 (Lineage–T1/ST2+ cells) in mice of respective genotypes treated as indicated (n=5). b,c, In vitro suppression assays using ILC2 from OVA+UFP-treated Foxp3YFPCre mice and lung Treg cells of the respective genotypes, treated as indicated (n=4) . d, GDF15 transcripts in Treg cells of Foxp3YFPCre, Foxp3YFPCreNotch4Δ/Δ and Foxp3YFPCreCtnnb1Δ/Δ (n=5). e, flow cytometric analysis and frequencies of GDF15+ lung Treg cells in the respective mouse genotypes treated as indicated (n=5). f, flow cytometric analysis and frequencies of IL-13 induced in naive ILC2 stimulated with IL-33, GDF15 or both (n=3). g, IL-13 expression in naive ILC2 incubated with Notch4hi Treg cells from OVA+UFP treated mice without or with blocking GDF15 peptide (n=6). h, In vitro suppression assays using lung Treg cells and ILC2 isolated from OVA+UFP-treated Foxp3YFPCre mice and incubated without or with GDF15 blocking peptide (n=4). Each symbol represents an independent sample. Numbers in flow plots indicate percentages. Error bars indicate SEM. Statistical tests: two-way ANOVA with Sidak’s post hoc analysis (a-e,h); One-way ANOVA with Dunnett’s post hoc analysis (f,g). *P<0.05, **P<0.01, ***P<0.001, ****P<0.0001. Data representative of two or three independent experiments.
RNA-seq analysis identified Gdf15 transcripts to be highly enriched in lung Treg cells of OVA+UFP-treated Foxp3YFPCre mice. (Fig. 3a). Consistent with this finding, transcripts encoding the cytokine GDF15 were highly induced in Notch4hi lung Treg cell in a β-catenin-dependent manner (Fig. 6d). Flow cytometric analysis confirmed that Treg cells were the primary source of GDF15 in the inflamed lungs of OVA and OVA+UFP treated mice, whereas GDF15 was sharply downregulated in Notch4- and β-catenin-deficient, but not Yap/Taz-deficient, Treg cells (Fig. 6e). Addition of recombinant GDF15 to in vitro cultures of ILC2 derived from naive mice upregulated IL-13 expression alone and especially in synergy with IL-33 (Fig. 6f). Furthermore, the in vitro co-culture of GDF15-expressing Notch4hi Treg cells, isolated from lungs of OVA+UFP-treated mice, with naive ILC2 cells upregulated the expression of IL-13 in the latter, an effect that was reversed by the addition of a GDF15 blocking peptide (Fig. 6g). Addition of GDF15 blocking peptide restored the ILC2 suppressive function of lung Treg cells of OVA+UFP-treated mice, consistent with the critical role of the Wnt-GDF15 axis in the failure of ILC2 regulation (Fig. 6h).
The contribution of GDF15 to the allergic airway inflammatory response was explored by intra-tracheal instillation of recombinant GDF15 in OVA+UFP-treated Foxp3YFPCreNotch4Δ/Δ mice, which resulted in the upregulation of AHR and tissue inflammation, as well as the increased expression of IL-4 and IL-13 in Teff cells (Fig. 7a–c). Reciprocally, instillation of the GDF15 blocking peptide suppressed the aforementioned changes in OVA+UFP treated Foxp3YFPCre mice (Fig. 7d–f). The essential role of ILC2-derived IL-13 in mediating the effects of GDF15 on airway inflammation was established by specifically deleting an Il4-Il13 gene cassette in ILC2 using a Rora-driven Cre recombinase (RoraCreIl4Δ/ΔIl13Δ/Δ). ILC2-specific deletion of Il4-Il13 reduced OVA+UFP-driven airway inflammation, and abrogated the capacity of GDF15 to further upregulate it. GDF15 treatment did not affect the expression of IL-13 in Teff cells neither in control RoraCre mice nor in RoraCreIl4Δ/ΔIl13Δ/Δ (Fig. 7g,h). Overall, these findings confirmed that Notch4 expression abrogated the capacity of lung Treg cells to suppress ILC2 and activated a Treg cell-intrinsic Wnt-GDF15 axis that promoted ILC2 activation.
Fig. 7. GDF15 regulates ILC2 response in airway inflammation.
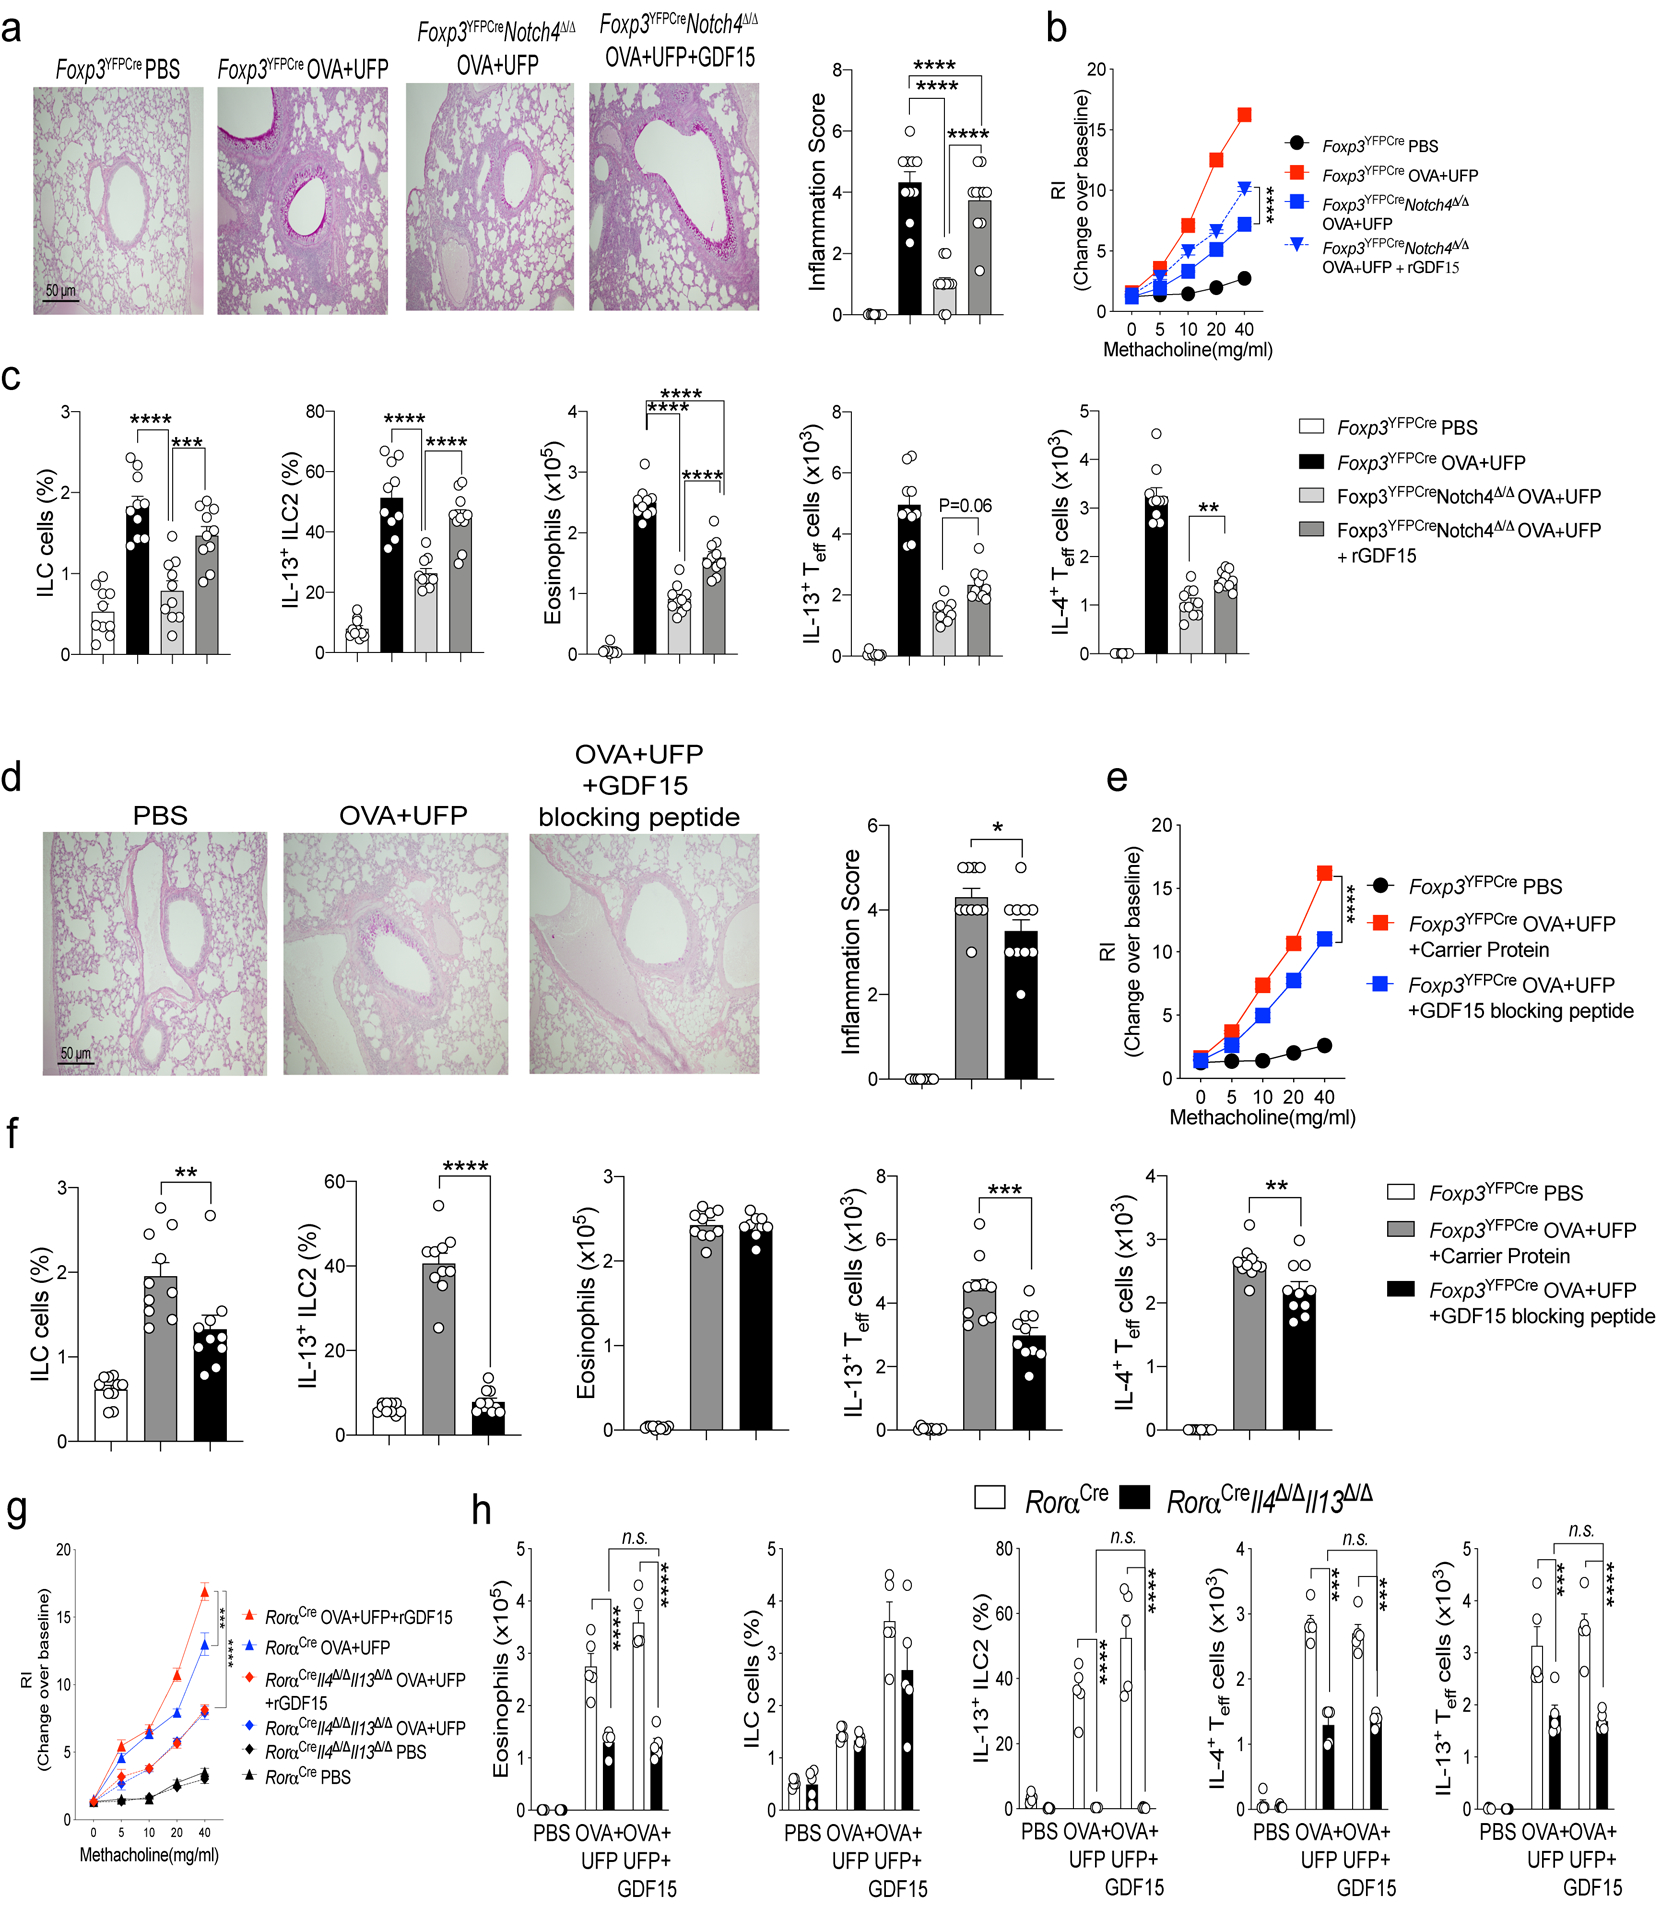
a,d, Representative PAS-stained sections of lung tissues isolated from Foxp3YFPCre and Foxp3YFPCreNotch4Δ/Δ with either PBS or OVA+UFP, the latter either alone or supplemented with GDF15 or GDF15 blocking peptide, as indicated (200X magnification), Inflammation score for the respective mouse groups (n=10). b,e, AHR in Foxp3YFPCre and Foxp3YFPCreNotch4Δ/Δ treated as indicated (n=10). c, f, Frequencies and absolute numbers of ILC2, eosinophils, IL-4, and IL-13, expression in lung Foxp3–CD4+ Teff cells in the respective groups (n=10) g, AHR in RoraCre and RoraCreIl4/Il13Δ/Δ treated as indicated (n=5). h, Frequencies and absolute numbers of eosinophils, ILC2, IL-4, and IL-13, expression in lung Foxp3–CD4+ Teff cells in the respective groups (n=5). Error bars indicate SEM. Statistical tests. One-way ANOVA with Dunnett’s post hoc analysis. (a,c,d,f), two-way ANOVA with Sidak’s post hoc analysis (b,e,g,h); *P<0.05, **P<0.01, ***P<0.001, ****P<0.0001. Data representative of two or three independent experiments.
Treg cell Notch4 expression segregates with disease severity in asthmatics.
To determine the relevance of the Notch4 signaling pathways in human subjects with asthma, we analyzed the expression of Notch4 on peripheral blood mononuclear cells (PBMC) of asthmatic and control subjects (demographics, disease severity classification of asthmatic subjects are described in Supplementary Table 1. Results revealed that asthmatics had elevated frequencies of circulating Notch4hi Treg cells, with both the cell frequencies and expression intensity progressively increasing as a function of asthma severity, reaching up to 50% of circulating Treg cells in severe asthmatics (Fig. 8a). In contrast, Notch4 expression on circulating CD4+ Teff cells was low and remained relatively low as a function of asthma severity (Fig. 8b). Increased expression of Notch4 in circulating Treg cells of asthmatics was found independent of the atopic status of patients (Extended Data Fig. 8). Also, expression of Notch1–3 on Treg and Teff cells was not increased in asthmatics as compared to control subjects (Extended Data Fig. 8). Subjects with other allergic diseases expressed Notch4 on their circulating Treg cells at levels that were either similar to those of controls (e.g food allergy) or equivalent to those of mild asthmatics (e.g. eczema without or with food allergy).
Fig. 8. Notch4 expression on circulating Treg cells segregates with asthma severity.
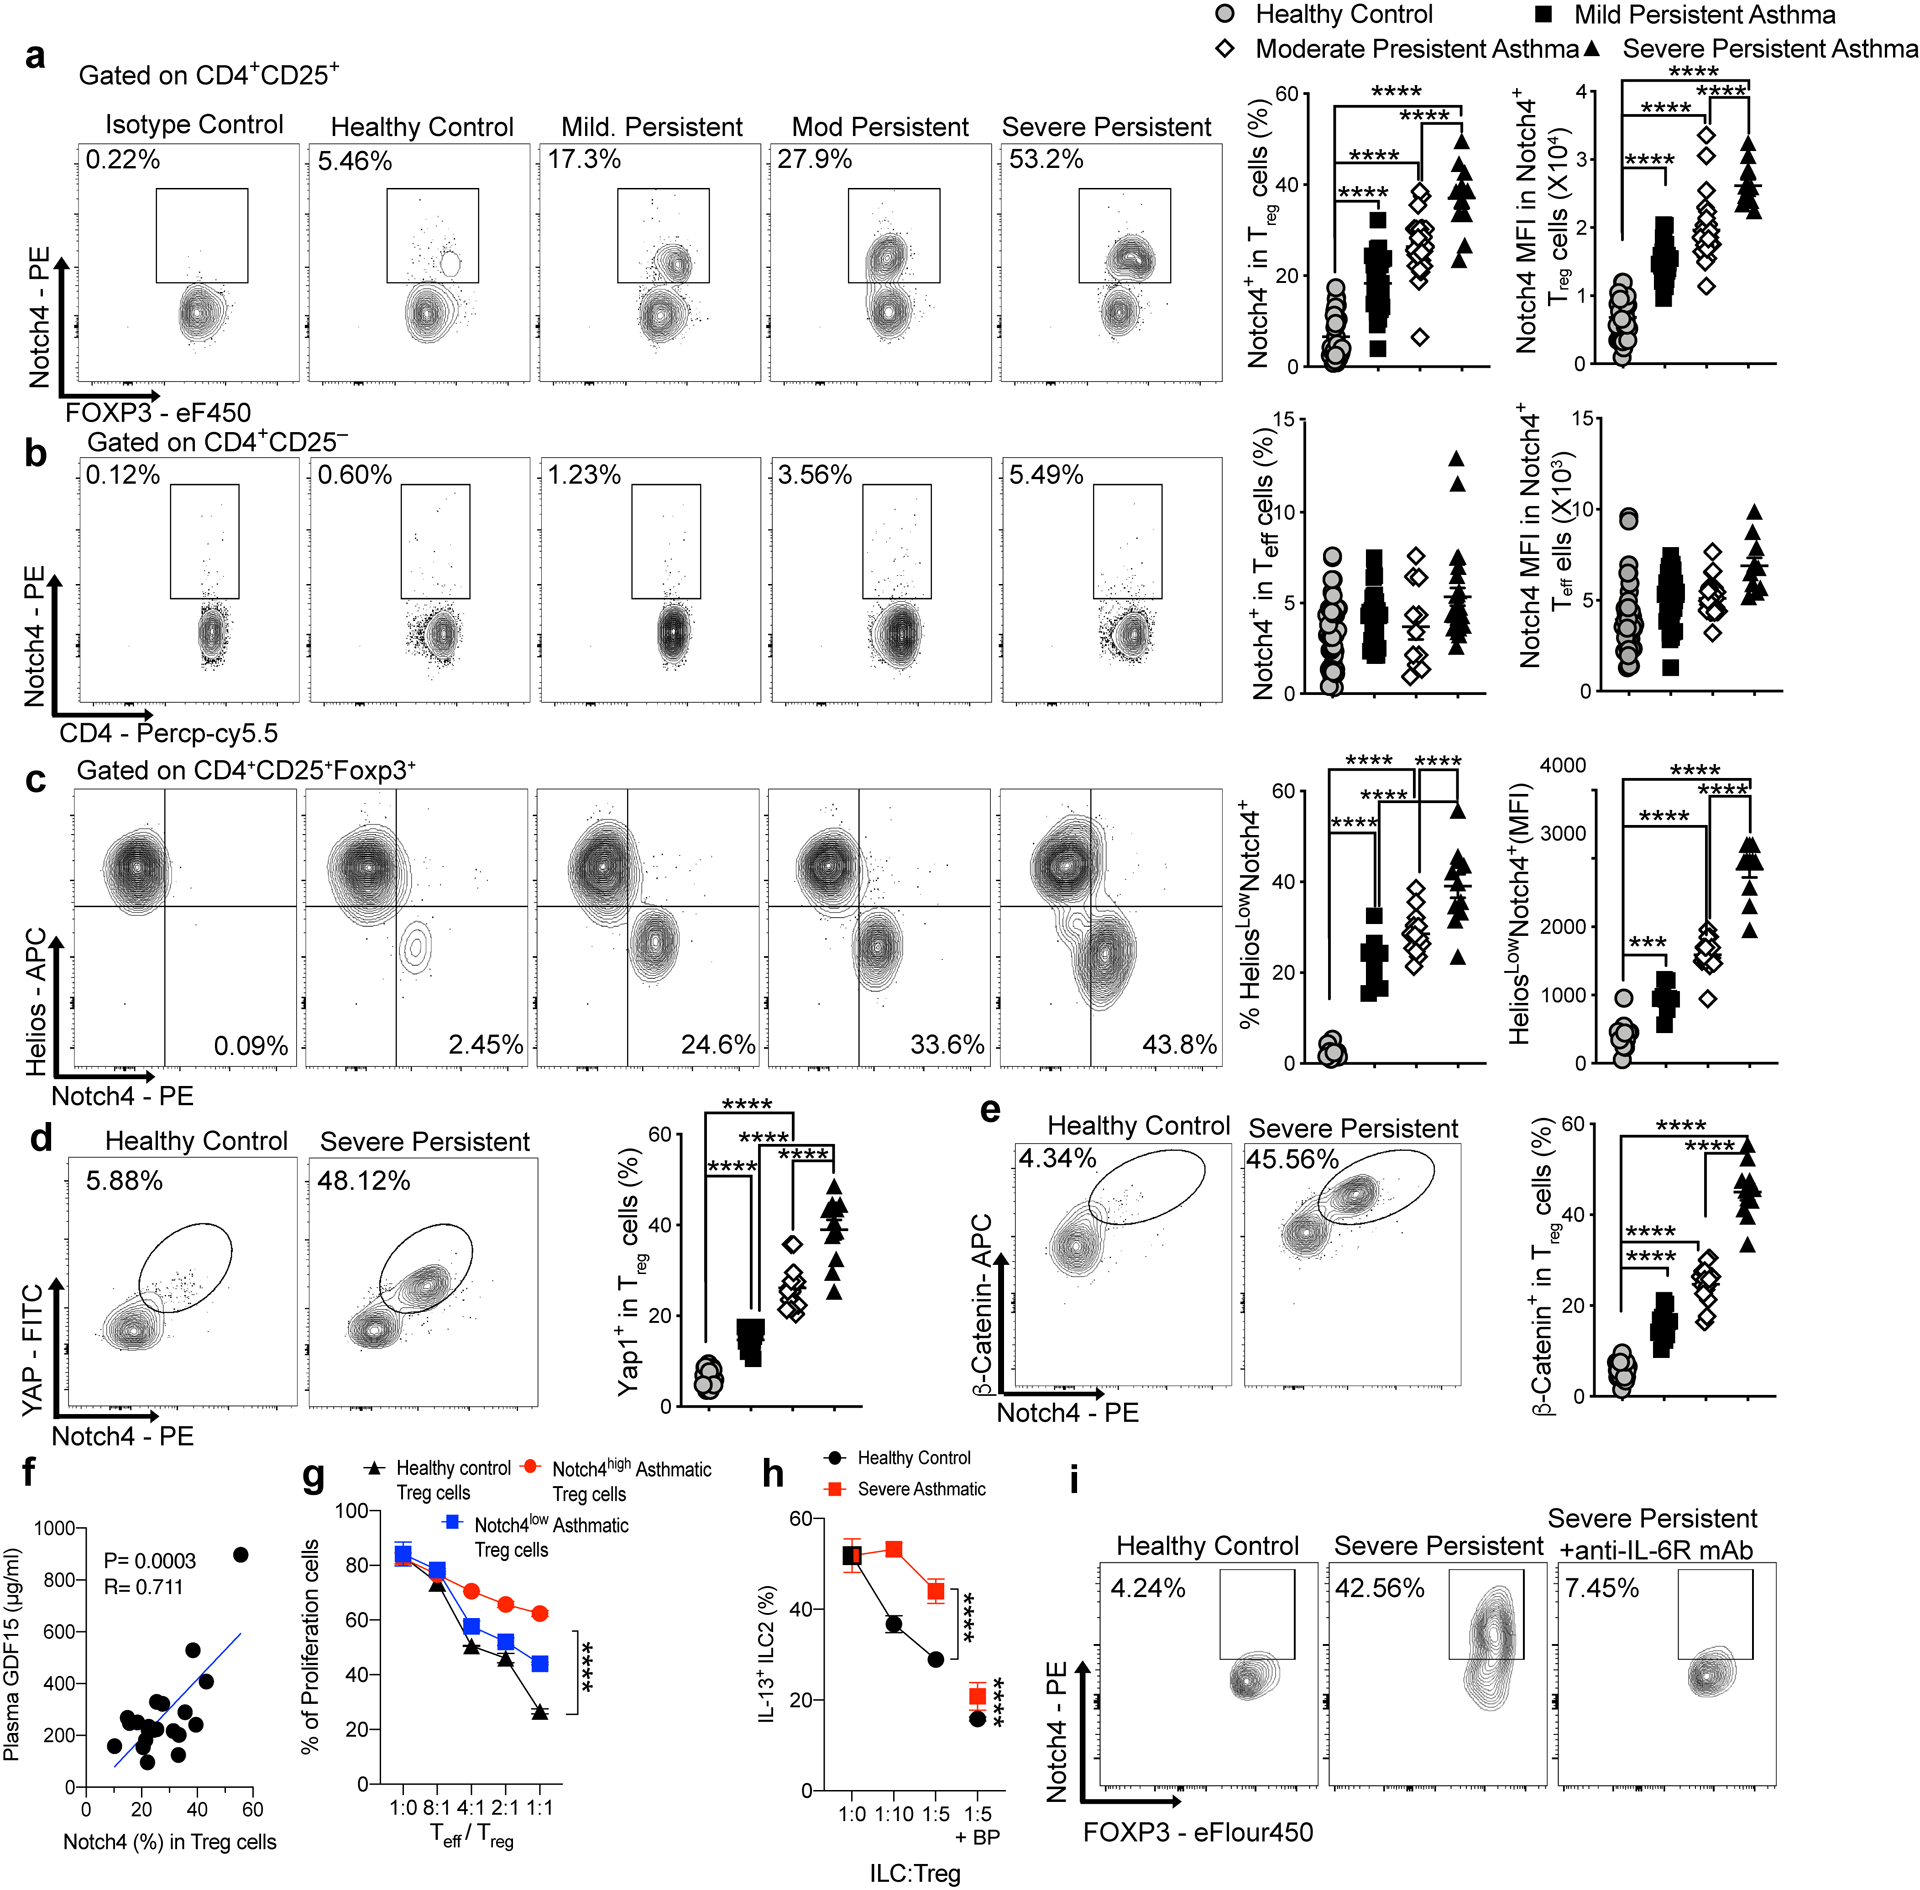
a,b, Flow cytometric analysis, cell frequencies and MFI of Notch4 expression on circulating Treg cells (a) and Teff cells (b) of control and asthmatic subjects, the latter segregated for asthma severity (control: n=39; mild n=31; moderate: n=27; severe: n=11). c, flow cytometric analysis, cell frequencies and MFI of Notch4 expression on Helios+ versus Helios– circulating Treg cells of control and asthmatic subjects (control: n=13; mild n=9, moderate n=14; severe: n=11). d,e, Flow cytometric analysis, cell frequencies and MFI of Yap (d) and β-catenin (e) expression on circulating Treg cells of control and severe asthmatic subjects (control n=24; mild n=15; moderate n=15; severe: n=11). f, Serum GDF15 concentrations in moderate and severe asthmatic subjects plotted as a function of Notch4 expression on circulating Treg cells (n=21). g, In vitro suppression third party CD4+ T cells (Teff) by the Notch4hi versus Notch4lo Treg cells from severe asthmatics compared to Treg cells of control subjects (n=2 subjects, 3 replicates per dilution per subject). h, In vitro suppression assays of ILC2 activation using circulating Notch4hi Treg cells of asthmatics subjects and control Treg cells of healthy controls, incubated at the indicated Treg cell:ILC2 ratios without or with GDF15 blocking peptide (n=5). i, Flow cytometric analysis of Notch4 expression in Treg cells of a healthy control and a severe asthmatic before and after treatment with anti-IL-6R mAb (n=1). Error bars indicate SEM. Statistical tests: One-way ANOVA with Dunnett’s post hoc analysis (a-e); simple linear regression analysis (f); two-way ANOVA with Sidak’s post hoc analysis (g,h); ***P<0.001, ****P<0.0001. Data representative of two or three independent experiments.
Further analysis revealed that Notch4 expression was restricted to the circulating Helios– iTreg cell subpopulation (Fig. 8c). Treg cell expression of the Hippo and Wnt pathway effector proteins Yap/Taz and β-catenin, respectively, localized to Notch4+ Treg cells and similarly increased as a function of asthma severity (Fig. 8d,e). Also, there were increased concentrations of GDF15 in the sera of moderate and severe asthmatics that positively correlated with circulating Treg cell Notch4 expression, whereas those of mild asthmatics were similar to those of controls (Fig. 8f and Extended Data Fig. 8). The contribution of Notch4 signaling to Treg cell dysfunction was ascertained by the demonstration that Notch4hi peripheral blood Treg cells poorly suppressed in vitro T cell proliferation as compared to Notch4lo Treg cells isolated from the same asthmatic subjects or to Treg cells isolated from healthy control subjects, which were overwhelmingly Notch4lo (Fig. 8g). Moreover, the in vitro co-culture of Notch4hi Treg cells, isolated from peripheral blood of severe asthmatics, failed to suppress the activation of ILC2 cells compared to Treg cells of healthy control subjects, a defect that was reversed by the addition of a GDF15 blocking peptide (Fig. 8h).
Analysis of peripheral blood cells of a severe asthmatic subject treated with the anti-IL-6R mAb Tocilizumab revealed decreased Notch4 expression on the patient Treg cells post initiation of therapy, consistent with the requirement for IL-6R signaling to upregulate Notch4 expression (Fig. 8i)25. These results, which mirror those obtained in the mouse system, indicate that Notch4 expression may similarly serve as an immune regulatory switch that licenses allergic inflammation in human asthmatics.
Discussion
In this study, we have identified a novel pathway central to the pathogenesis of asthmatic airway inflammation involving the inducible expression of Notch4 on allergen-specific Treg cells. This induction, synergistically mediated by allergens and ambient pollutant particles, activates downstream Hippo and Wnt pathways to subvert Treg cell stability and functions. Inhibition of Notch4 expression in Treg cells, but not that of other Notch receptors, suppressed airway inflammation and restored immune tolerance. Critically, Notch4 signaling upregulated the expression in Treg cells of GDF15, a cytokine that we demonstrate to reinforce airway inflammation by a novel mechanism involving ILC2 activation. Notch4 and its downstream effector pathways were upregulated on Treg cells of asthmatic subjects as a function of disease severity, thus identifying Notch4 as an immune regulatory switch mechanism that licenses asthmatic inflammation and highlighting the therapeutic potential for tolerance restoration in asthma.
Induction of Notch4 on Treg cells in the airway involved coordinate allergen peptide-specific TCR activation and IL-6-STAT3 signaling, a process further upregulated by IL-33. Remarkably, this pathway thus integrates several genetic loci, including NOTCH4, IL6 and IL33, identified to impart susceptibility to asthma incidence and/or disease severity26, 27, 28, 29, 30. Treg cell-specific deletion of Il6ra or Stat3 substantially attenuated Notch4 expression in Treg cells in allergic airway inflammation, as did treatment of a severe asthmatic subject with the anti-IL-6Rα chain mAb tocilizumab25. STAT3 was demonstrated to bind to the Notch4 promoter, consistent with direct upregulation of Notch4 expression by IL-6-STAT3 signaling. The specificity of Notch4 induction on lung Treg cells may relate to a “niche effect”, in which the interaction with alveolar macrophages normally drives differentiation of naive allergen specific T cells into Treg cells8, 31. The uptake of allergens and ambient particulate matter is associated with the production of IL-6 and upregulation of Notch ligands including Jag18, driving Treg skewing towards Teff cell phenotypes in a Notch4-dependent manner.
Notch4 expression on lung Treg cells mobilized several downstream pathways, notably Hippo and Wnt, to derail Treg cell stability and function. Expression of effectors of both pathways, including Yap and Taz (Hippo) and β-catenin (Wnt) also segregated with Notch4 expression in peripheral blood Treg cells of human asthmatics and correlated with asthma severity. The two pathways acted to disrupt different aspects of Treg cell functions. Whereas the Hippo pathway impaired lung Treg cell in vitro suppressor function and promoted their skewing towards the TH17 cell fate, the Wnt pathway promoted their TH2 cell-like reprogramming and was essential to the TH2 effector T cell response in the airways. Treg cell specific deletion of Rbpj segregated the TH2 and TH17 responses along the canonical and non-canonical pathways, respectively. Thus, Notch4 mobilizes distinct signaling pathways within lung Treg cells that act in a modular fashion to disrupt immune tolerance in the airways.
An important pathogenic mechanism mobilized by Notch4 is the potentiation of ILC2 activation, which proceeded by a Treg cell-intrinsic, β−catenin-dependent pathway. Notch4-β-catenin signaling impaired the suppression by Treg cells of activated ILC2. Furthermore, it positively promoted the activation of resting ILC2 by inducing the expression in Treg cells of GDF15, which selectively activated ILC2 but not T cells in synergy with IL-33. Antagonism of GDF15 augmented the in vitro suppression of ILC2 by Notch4hi Treg cells and down-regulated airway inflammation in vivo. These results indicated a critical role for GDF15 in mediating an ILC2-dependent forward amplificatory loop by which Notch4hi Treg cells actively promote asthmatic inflammation.
Analysis of Notch4 expression on circulating Treg cells of a pediatric cohort of asthmatic subjects demonstrated a step-wise increase in Notch4 expression as a function of asthma severity, with the Treg cells of severe asthmatics especially marked by high expression of Notch4 and its downstream effectors Yap, Taz and β-catenin. Similar to the mouse studies, Notch4-expressing human Treg cells also showed impaired in vitro suppressive function. Remarkably, there was minimal heterogeneity in Notch4 expression within each disease severity subgroup, highlighting Notch4 as a common pathogenic mechanism operative in these patients whose amplitude is highly informative of disease activity. These results emphasize the potential usefulness of Notch4 and its down-stream Hippo and Wnt effectors as novel biomarkers to monitor disease activity and response to therapy.
In conclusion, our studies identify a novel mechanism central to the pathogenesis of asthmatic inflammation. These studies, together with earlier ones on the role of Notch1 expression on Treg cell in promoting TH1 cell inflammatory and autoimmune responses13, 32, hint at a Treg cell-specific Notch receptor code that directs different TH cell- responses in allergic and autoimmune diseases. Elucidating the respective roles of different Notch receptors in controlling disease outcome by modulating Treg cell responses may offer opportunities for precision medicine interventions to restore immune tolerance in a tissue and disease-specific manner.
Methods
Mice.
The following mouse strains were obtained from the JAX Laboratories: CD4Cre (B6.Cg-Tg(Cd4-cre)1Cwi/BfluJ)33, floxed Ctnnb1 (Ctnnb1fl/fl) (B6(Cg)-Ctnnb1tm1Knw/J)34, Foxp3YFPCre (B6.129(Cg)-Foxp3tm4(YFP/icre)Ayr/J)35, Il6rfl/fl (B6;SJL-Il6ratm1.1Drew/J)36, Notch1fl/fl (B6.129X1-Notch1tm2Rko/Grid/J)37, Notch2fl/fl (B6.129S-Notch2tm3Grid/J)38, Notch3–/– (B6;129S1-Notch3tm1Grid/J)39, OT-II (B6.Cg-Tg(TcraTcrb)425Cbn/J)40, Stat3fl/fl (B6.129S1-Stat3tm1Xyfu/J)41, Wwtr1fl/fl (B6.129(Cg)-Wwtr1tm1Hmc/J) and Yap1fl/fl (B6.129P2(Cg)-Yap1tm1.1Dupa/J)42, 43, and CD45.1 (B6.SJL-Ptprca Pepcb/BoyJ) mice. Notch4fl/fl (Notch4tm1c(NCOM)Mfgc) were obtained from the Canadian mutant mouse repository. Pofut1fl/fl (B6.Cg-Pofut1tm2.1Pst/J), Rbpj1fl/fl (B6.129P2-Rbpjtm1Hon/HonRbrc) were kind gifts of Pamela Stanley and Tasuku Honjo, respectively12, 14.
Particles.
UFP (≤0.18 μm) were collected in an urban area of downtown Los Angeles, as previously reported7. The respective particles were suspended in an aqueous solution, with the hydrophilic components becoming part of the solution, while the solid non-soluble UFP cores are left in suspension. The entire mixture was administered intranasally, as indicated below.
T cell co-cultures with lung alveolar macrophages.
Naïve CD4+OTII+ T cells were isolated from spleens of OTII+Foxp3YFPCre mice by fluorescein-activated cell sorting (FACS). AM were isolated by flowcytometry as shown in8, and were aliquoted at 2×10⁴ cells in 48 well plates, then either sham treated, treated overnight with OVA323–339 or with OVA323–339 and UFP at 10 μg/ml. The treated AMs were washed twice with PBS to remove residual UFP, and the OTII+ naïve CD4+ T cells were then added at 4×10⁵ cells/well in a final volume of 0.5 ml 10% fetal calf serum (FCS)/RPMI culture medium. Recombinant IL-1β, IL-25, TSLP, and TNFα (Peprotech) were added at a concentration of 10 μg/ml. Recombinant IL-6 and IL-33 (Peprotech) were titrated from 10 μg/ml to 1 μg/ml. Rat anti-mouse IL-6 mAb (clone: MP5–20F3, Bioxcell) was added at a concentration of 10 μg/ml.
In vitro iTreg cell differentiation.
Sorted naïve CD4+CD62L+Foxp3YFPCre T cells (1 × 10⁶/ml) were cultured with plate-bound anti-CD28 (5 μg/ml, Biolegend), anti-CD3 (clone: 145–2C11, 5 μg/ml, Biolegend), recombinant TGF-β1 (5 ng/ml, R&D Systems), with or without IL-4 (10 ng/ml) (Peprotech), anti-IL-4 (clone: 11B11, 10 μg/ml) (Biolegend) or anti-IL-6 mAb (MP5–20F3, 10 μg/ml) (Biolegend), mitogen activated protein kinase (MEK) inhibitor PD98059 (50 μM, Sigma-Aldrich) or P38 inhibitor IV (10 μM, Sigma-Aldrich). After 4 days, the induced Treg cells were analyzed by flow cytometry for Foxp3 expression and intracellular cytokines production and/ re-sorted on the basis of YFP expression.
In vitro suppression assays.
Total CD4+ T cells were isolated using a CD4 negative isolation kit (Miltenyi Biotec) followed by cell sorting on FACSAria. Isolated Teff cells were labeled with CellTrace Violet Cell Proliferation dye according to the manufacturer’s instructions (Life Technologies) and were used as responder cells. Treg cells were isolated on a FACSAria on the basis of CD4, YFP and/or Notch4 expression and were used as suppressor cells. Responder cells were co-cultured with Treg cells, at the indicated ratios, and stimulated for 3 days with 2 μg/ml of coated anti-CD3 and 5 μg/ml of soluble anti-CD28 in 96-well, round-bottomed plates in triplicates. The responder cells (YFP– were then analyzed for CellTrace dye dilution by flow cytometry. For our human suppression assay studies, Treg cells were isolated on the basis of CD4+CD25+CD127– (Treg) while Teff cells were isolated as CD4+CD25–CD127+ (Teff) from either healthy controls or severe asthmatics. Teff cells were then stained with Cell Trace Violet Cell Proliferation dye (Invitrogen) and platted in a concentration of 104 cells in a U-bottom 96 well plate with 0.1μL prewashed T cell activation and Expansion beads (Thermofischer) in 100μL complete medium. Different numbers of Treg cells are added to the culture in 100μL of complete medium in order to have 1/1, 1/2, 1/4 and 1/8 ratios (respectively 104, 5X10³, 2.5X10³, 1.25X10³ cells) or 100μL of complete medium for wells without Treg cells. The cultures will be incubated at 37°C 5% CO2 for 4 days. On the fourth day, the cells will be stained again for CD4, CD127 and CD25 and evaluate the dilution of the proliferation dye by gating on CD4+ CD127+Violet Tracer+ cells.
In vitro ILC2 suppression assay.
Innate lymphoid cells (ILC) were isolated from lungs of OVA+UFP sensitized, challenged and treated mice. ILC2 were isolated as Lineage (Lin)– (CD3, CD4, CD11c, CD11b, CD19, SiglecF, F4/80)–Thy1.1+Sca-1+ T1/ST2+. IL-13 percentages were checked at the beginning of the experiment. ILC2 were then co-cultured with 105 cells/well. Treg cells at these different concentrations, 1:5, 1:10 or 1:20, from Foxp3YFPCre mice either sham treated or treated OVA+UFP with high Notch4 expression with or without the addition of anti-Notch4 mAb (clone: HMN4–14, Bioxcell) in concentration of 10ng/ml, Treg cells from Foxp3YFPCreNotch4Δ/Δ, Foxp3YFPCreCtnnb1Δ/Δ or Foxp3YFPCreYap1Δ/ΔWwtr1Δ/Δ mice treated with OVA+UFP. 48 hours later, IL-13 expression of ILC2 was measured by flowcytometric analysis.
In vitro ILC2–Treg cell co-cultures.
ILC2 cells were isolated from the lungs of naïve Foxp3YFPCre mice. These cells were incubated with either IL-33 (10 μg/ml), Notch4high Treg cells isolated from the lungs of OVA+UFP treated mice or with both along with or without GDF15 blocking peptide (Mybiosource) (10 ng/ml)44. 48 hours later, the expression of IL-13 in ILC2 cells was measured by flowcytometric analysis.
In vitro ILC2–GDF15 co-cultures.
ILC2 cells were isolated from the lungs of naïve Foxp3YFPCre mice. These cells were incubated with either IL-33 (10 μg/ml), recombinant GDF15 (R&D) (10 μg/ml) or both. 48 hours later, the expression of IL-13 in ILC2 cells was measured by flow cytometry.
Isolation of Human peripheral blood mononuclear cells (PBMCs).
Human PBMCs were isolated from full blood from either healthy control, mild asthmatics, moderate asthmatics or severe asthmatics probands via density gradient using Ficoll (GE Healthcare). PBMCs were then stored frozen in Fetal Calf Serum (FCS) (Sigma Aldrich) and 15% Dimethyl sulfoxide (DMSO) (Sigma Aldrich). The cells were later thawed for analysis of their Notch, Yap1 and -Catenin expression by flow cytometry.
Isolation, culture and suppression assay of Human peripheral ILC2 cells.
Human ILC2 cells were isolated used human ILC2 isolation kit (Miltenyi Biotec). The cells were then stained for CD294 and Lineage and sorted out as CD294+Lineage−. The ILC2 cells were then cultured with IL-33 (10 μg/ml) (Peprotech) and IL-25 (2 μg/ml) (Peprotech) for 5 days. Moreover, Treg cells were isolated from either asthmatics or healthy controls by sorting them out as CD4+CD25+CD127− cells. The Treg cells were cultured with the ILC2 in a 1:5 or 1:10 with and without the addition of GDF15 blocking peptide. 48 hours later, the production of IL-13 by the ILC2 were assessed by flow cytometric analysis.
GDF15 ELISA.
EDTA Plasma from 88 probands (Control subjects, mild, moderate and severe persistent asthma patients) were used to measure GDF15 using enzyme-linked immunosorbent assay (ELISA) (R&D) according to manufacturer’s protocol.
Allergic sensitization and challenge.
Mice were sensitized to OVA by intraperitoneal (i.p.) injection of 100 μg OVA in100 μl PBS, then boosted two weeks later with a second i.p. injection of OVA in PBS. Control mice were sham sensitized and boosted with PBS alone. Starting on day 29, both OVA and sham-sensitized mice were challenged with aerosolized OVA at 1%, for 30 minutes daily for 3 days. Two hours before each OVA aerosol exposure, subgroups of mice were given intranasally (i.n.) either PBS or UFP at 10 μg/100μl PBS/instillation. Mice were euthanized on day 32 post sensitization and analyzed. For dust mite-induced allergic airway inflammation, mice received 5 μg of lyophilized D. Pteronyssinus extract (Greer) in 100 μl PBS intranasally for 3 days at the start of the protocol then challenged with the same dose of D. Pteronyssinus extract on days 15–17 with or without UFP at the same concentration as before. Mice were euthanized on day 18 and analyzed for measures of airway inflammation. Bronchoalveolar lavage (BAL) fluid and lung tissues were obtained and analyzed for cellular components and T cell cytokine expression as described6. For the chronic model, Mice were sensitized to OVA by three intraperitoneal injections 10 mg OVA (Sigma) adsorbed to 1.5 mg Al(OH)3 (Pierce, Rockford) diluted in 200 mL phosphate-buffered saline (PBS)] on days 1, 14 and 21. The mice were challenged with OVA aerosol (1% wt/vol in PBS) via the airways twice a week on 2 consecutive days over a period of 12 weeks as previously described15. Sham sensitization and challenges were carried out with sterile Al(OH)3 in PBS. Animals were analyzed after 12 weeks of OVA aerosol challenge.
Measurement of airway functional responses.
Allergen-induced airway hyperreactivity (AHR) was measured, as previously described8. Anesthetized mice were exposed to doubling concentrations of aerosolized acetyl-β-methacholine (Sigma-Aldrich) by using a Buxco small-animal ventilator (Data Sciences International). The relative peak airway resistance for each methacholine dose, normalized to the saline baseline, was calculated.
Lung histopathology staining.
Paraffin-embedded lung sections were stained with hematoxylin and eosin (H&E) or Paraffin-acid-Schiff staining (PAS). The lung pathology was scored by blinded operators. Inflammation was scored separately for cellular infiltration around blood vessels and airways: 0, no infiltrates; 1, few inflammatory cells; 2, a ring of inflammatory cells 1 cell layer deep; 3, a ring of inflammatory cells 2–4 cells deep; 4, a ring of inflammatory cells of >4 cells deep15. A composite score was determined by the adding the inflammatory scores for both vessels and airways.
Polymerase Chain Reaction (PCR). B-cells
Treg and/or Teff cells were sorted out using ARIA II sorter (BD). mRNA isolation was conducted according to manufacturers’ protocol (Qiagen). cDNA and qualitative PCR (qPCR) were performed using RT-PCR cDNA conversion kit (Qiagen) and probes for Notch1, Notch2, Notch3, Notch4 and GDF15 from applied biosystems (ThermoFisher). The mRNA expression was normalized to Notch1 expression in Teff cell
Flow cytometric analysis of mouse and human cells.
Antibodies against the following murine antigens were used for flow cytometric analyses:
IL-4 (clone 11B11, catalogue no: 504104 1:300 dilution, Biolegend), Siglec-F (E50–2440, catalogue no: 5521261:300, BD Pharmingen), Foxp3 (FJK-16S, catalogue no: 48–5773-82 1:300, eBioscience), IFN-γ (XMG1.2, catalogue no: 505806 1:300, Biolegend), IL-13 (eBio13a, catalogue no.: 47–7133-82 1:300, eBioscience), Helios (22F6, catalogue no: 47–9883-42 1:200, eBioscience), CD11c (N418, catalogue no: 117318 1:500, Biolegend), CD11b (M1/70, catalogue no: 101222 1:500, eBioscience), CD4 (GK1.5, catalogue no: 100451, 1:500, Biolegend), CD3 (17A2, catalogue no: 100203, 1:500, Biolegend), IL-17 (TC11–18H10.1, catalogue no: 506922, 1:200, Biolegend), GR-1 (RB6–8C5, catalogue no: 108406, 1:500, Biolegend), CD45 (30-F11, catalogue no: 103140, 1:300, Biolegend), Notch1 (HMN1–12, catalogue no: 130615, 1:500, Biolegend), Notch2 (HMN2–35, catalogue no: 130714, 1:500, Biolegend), Notch3 (HMN3–133, catalogue no: 130512, 1:300, Biolegend), Notch4 (HMN4–14, catalogue no: 128407 1:200,Biolegend). Polyclonal rabbit anti-GDF15(catalogue no: 32572–05171, 1:200, Assaypro), anti-CD16/CD32 (clone: 93, Catalogue no: 101319, 1:1000, Biolegend), Alexa Fluor 647 goat anti-rabbit IgG Ab (clone PA5–39741, catalogue no: A32733, 1:1000, Thermofischer), p-Mob1 Ab (T35; clone D2F10, Catalogue no: 8699S, 1:300, CST), rabbit anti-mouse p-Lats1 Ab (T35; clone D57D3, 1:300, CST), rabbit anti-mouse p-Lats1/2 Ab (S909/872; clone PA5–39741, catalogue no: PA5–105895, 1:300, Thermofischer), Rat anti-mouse IL-6 mAb (Clone: MP5–20F3, Catalogue no: BE0046, 1:500, Bioxcell), anti-CD28 (Clone: 37.51, Catalogue no: 122004, ,1.1000, Biolegend) , anti-IL-4 (Catalogue no: 500-P54, 1:1000, Peprotech). Antibodies against the following human antigens were used: CD3 (HIT3a, catalogue no: 300318, 1:300,Biolegend), CD4 (RPA-T4, catalogue no: 300530, 1:300,Biolegend), Foxp3 (PCH-101,catalogue no: 48–4776-42 1:200, ebioscience), Helios (22F6, catalogue no: 47–9883-42 1:200, eBioscience), Notch1 (HMN1–519, catalogue no: 352108, 1:500, BD Pharmingen), Notch2 (HMN2–25, catalogue no: 742291, 1:300, BD Pharmingen), Notch3 (HMN3–21, catalogue no: 744828, 1:300, BD Pharmingen), Notch4 (HMN4–2, Catalogue no: 563269, 1:300, BD Pharmingen), Yap1 (147295, Catalogue no: 14729S, 1:200, CST) and beta-Catenin (196624, Catalogue no: IC13292V, 1:500,R&D system). The specificity and optimal dilution of each antibody was validated by testing on appropriate negative and positive controls or otherwise provided on the manufacturer’s website. Intracellular cytokine staining was performed as previously described13. Furthermore, for YFP/GFP/cytokine staining, a different protocol was used. Cells were resuspended cells in approximately 100 μl 4% formaldehyde per 1 million cells for 15 min at room temperature (20–25°C). after centrifugation, the pellet was resuspended with 100 μl of Triton X for each 1 million cells. The mix was incubated at RT for 10 minutes. Cytokines were stained overnight as previously prescribed in13. Dead cells were routinely excluded from the analysis based on the staining of eFluor 780 Fixable Viability Dye (1:1000 dilution) (eBioscience). Stained cells were analyzed on a BD LSR Fortessa cell analyzer (BD Biosciences) and data were processed using Flowjo (Tree Star Inc.).
Chromatin Immunoprecipitation (ChIP).
For ChIP analysis, two systems were used. For STAT3 ChIP, iTreg cells were used after naïve T-cell differentiation protocol. These cells were stimulated with or without IL-6 at concentration of (10 μg/ml). Cells were then directly cross linked with 10% PFA for 8 min at room temperature (RT). Chromatin was then treated with lysis buffer I and lysis buffer II. ChIP protocol was conducted as described45. Quantitative PCR was conducted to measure enrichment percentage to input controls at the Notch1 promoter region forward primer 5’-CACAAGGGGGTAAGGGTTC-3’; reverse primer 5’-GAGGCACTAGTGAGGCTCTGA-3’, Notch2 forward primer 5’-TTTCAAGCTCCTGCTGTCTCT-3’; reverse primer 5’-CTCTGGGCATTTCGTTCATT-3’, Notch3 forward primer 5’-AGGCTTGGCGGGTAGAAG-3’; reverse primer 5’-TCCCTCCTCCCTCTTTCC-3’ and Notch4 forward primer 5’-GCTCACAACCATCCGTAACA-3’; reverse primer 5’-ACTGAAACCGGTCACTTTGG-3’ promoter regions.
DNA methylation.
The methylation status of the Foxp3 Treg cell–specific demethylation region Conserved non-coding sequence 2, (CNS2) of Foxp3YFPcre, Foxp3YFPcreNotch4Δ/Δ, Foxp3YFPcreCtnnb1Δ/Δ and Foxp3YFPcreYap1Δ/ΔWwtr1Δ/Δ lung Treg cells of OVA+UFP mice were assessed. DNA extraction, bisulfite conversion, pyrosequencing, and data analysis were done by EpigenDx as published previously46, 47. twelve cytosine guanine dinucleotides (CpGs) of the mouse Treg-specific demethylation region (CNS2 of FOXP3) were analyzed.
Transcriptome Profiling.
Treg cells were isolated from either Foxp3YFPcre or Foxp3YFPCre Notch4Δ/Δ mice that were sensitized with OVA and challenged with OVA+UFP. mRNA was isolated using Qiagen RNeasy mini kit (Qiagen). RNA was then converted into Double-stranded DNA (dsDNA), using SMART-Seq v4 Ultra Low Input RNA kit (Clontech). dsDNA was then fragmented to 200–300 bp size, using M220 Focused-ultrasonicator (Covaris), and utilized for construction of libraries for Illumina sequencing using KAPA Hyper Prep Kit (Kapa Biosystems). Libraries were then quantified using Qubit dsDNA HS (High Sensitivity) Assay Kit on Agilent High Sensitivity DNA Bioanalyzer.
Gene-level read counts were quantified using feature Counts and the latest UCSC mouse annotation (GRCm38/mm10). To identify differentially expressed genes, we used edgeR (version 3.28) and DESeq2 (version 1.26.0) Bioconductor packages with default parameters. Count tables were normalized to TPM (Transcripts per Million) for visualizations and QC. Sample clustering and path analyses were performed using a custom-made pipeline available upon request. Transcripts were called as differentially expressed when the adjusted p values were below 0.05, fold-changes over ±1.5 and false discovery rate (FDR) were below 0.1. Raw sequencing files will be accessible in the NCBI repository in the near future.
Statistical analysis.
Student’s two-tailed t-test, one- and two-way ANOVA and repeat measures two-way ANOVA with Sidak post-test analysis of groups were used to compare test groups, as indicated. A p-value <0.05 was considered statistically significant.
Study approval.
Recruitment of human subjects was approved by the Institutional Review Board at Boston Children’s Hospital and Marmara University. All animal studies were reviewed and approved by the Boston Children’s Hospital office of Animal Care Resources.
Data Availability.
The data presented in the manuscript, including de-identified patient results, will be made available to investigators following request to the corresponding author. Any data and materials to be shared will be released via a material transfer agreement. RNA sequencing datasets have been deposited in the Gene Expression Omnibus with the accession code GSE151763.
Extended Data
Extended Data Fig. 1. Notch4 expression on lung Treg cells in allergic airway inflammation.
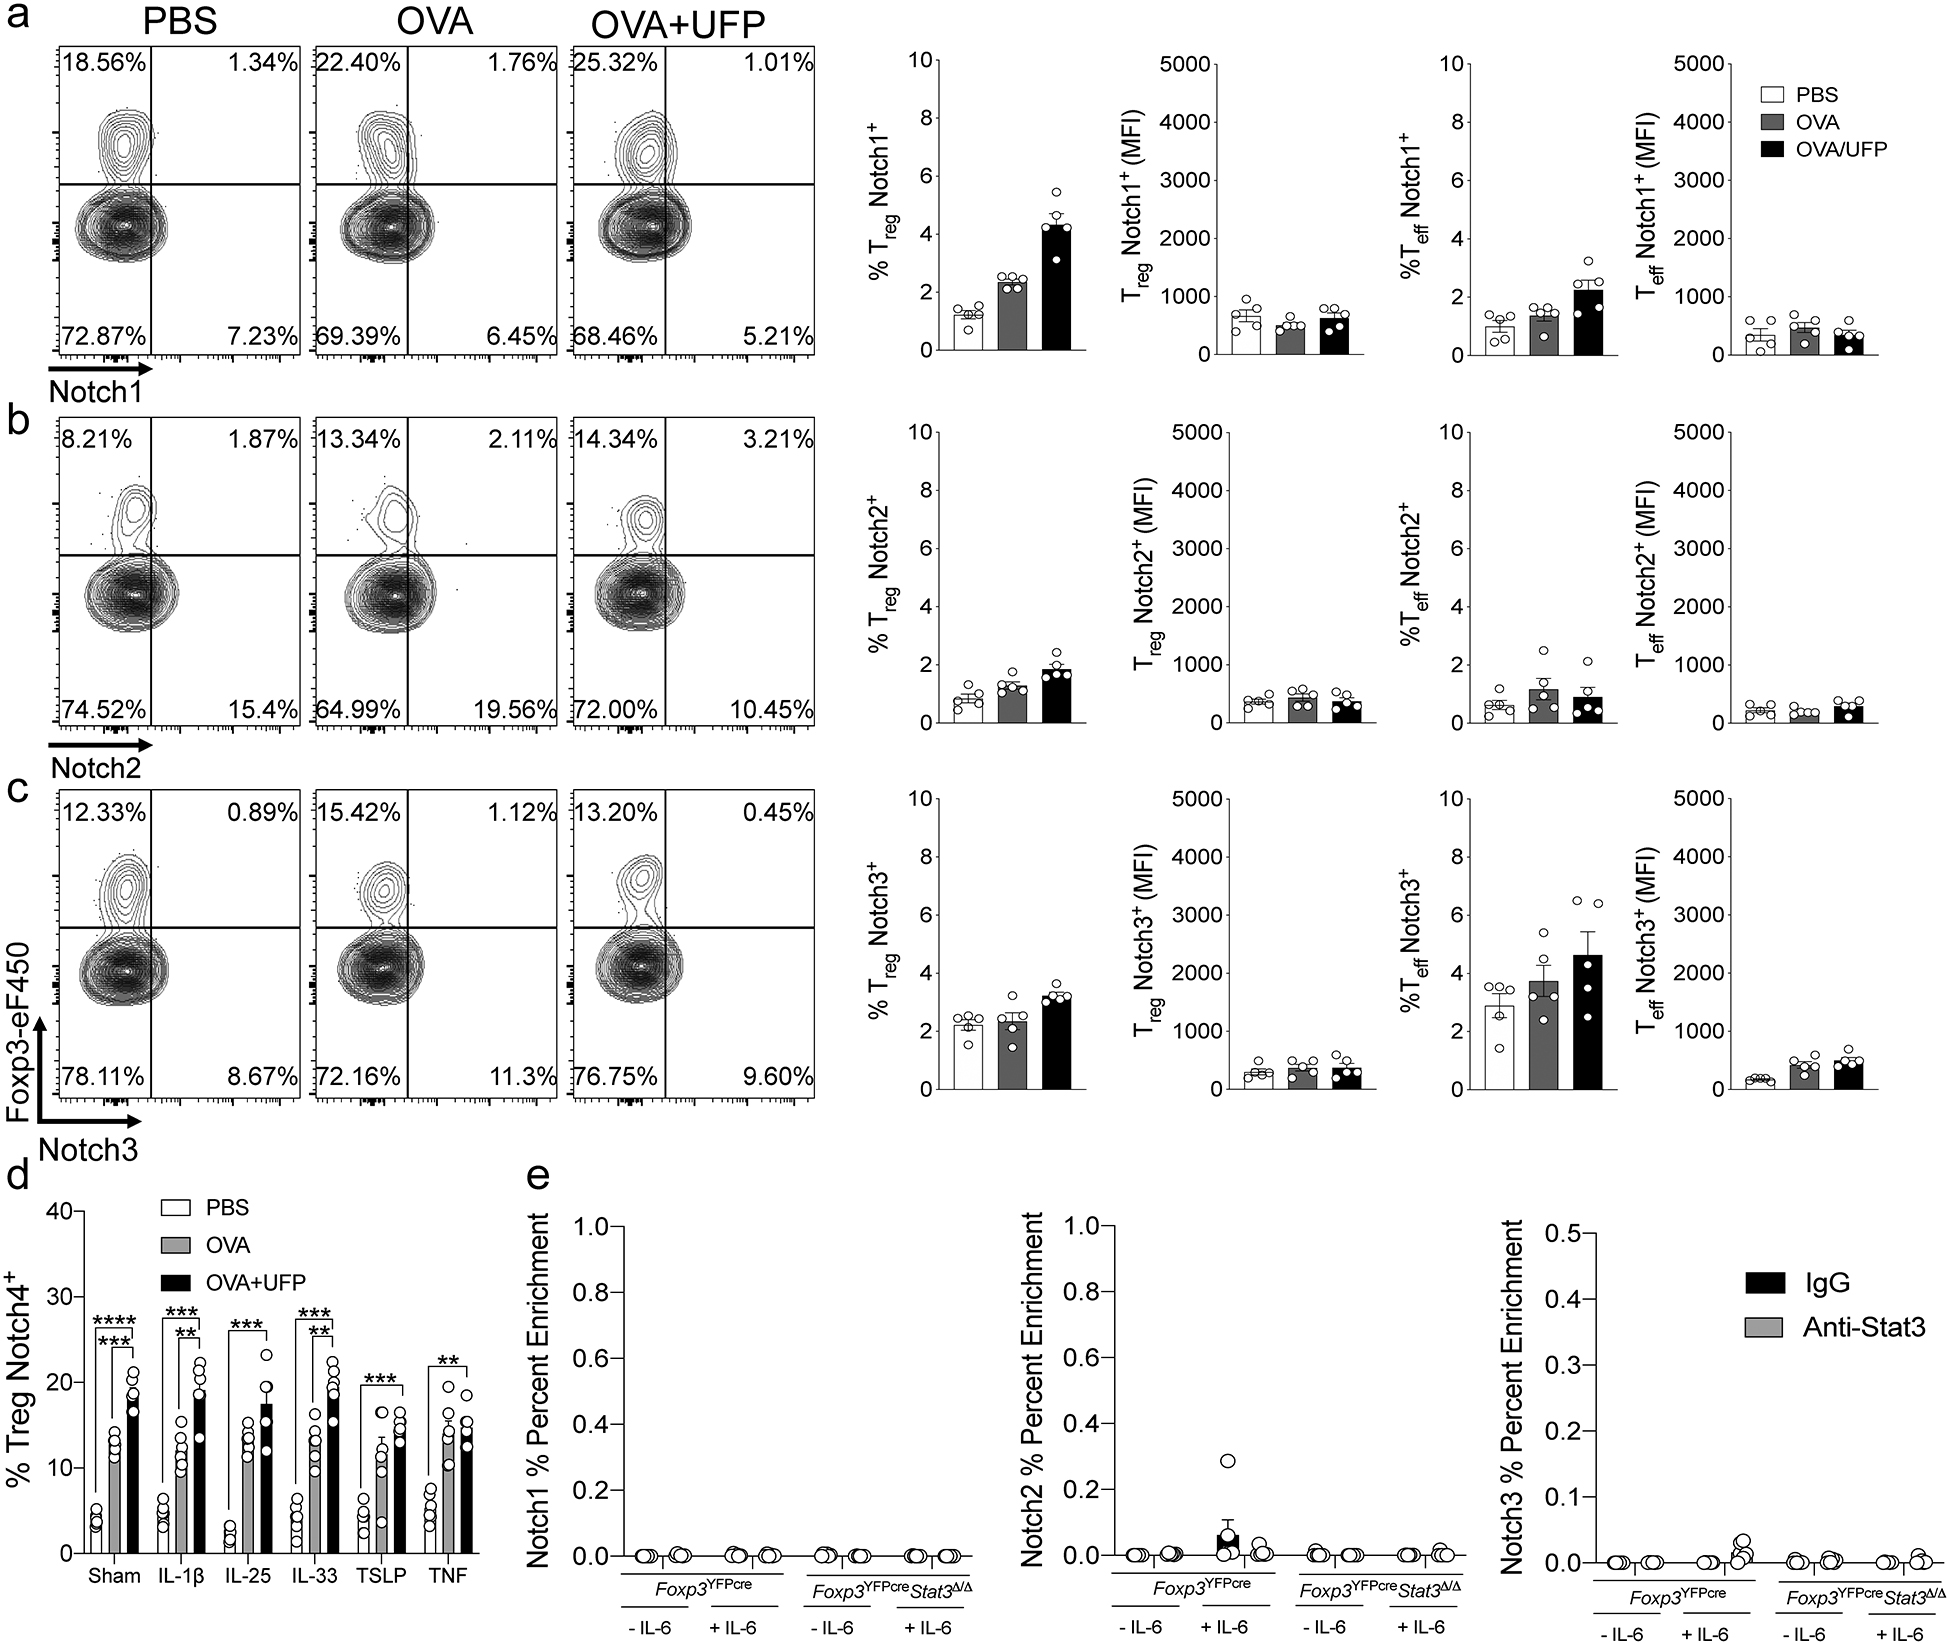
a-c, Flow cytometric analysis, cell frequencies and (MFI) of Notch1, 2 and 3 expression on lung Treg and Teff cells in Foxp3YFPCre (n=5). d, Cell frequencies of Notch4 expression on OT-II+CD4+Foxp3+ T cells generated in co-cultures with sham or OVA323–339+UFP-pulsed alveolar macrophages without or with IL-1β, IL-25, IL-33, TSLP or TNF (n=5). e, ChIP assays for the binding of STAT3 and control (IgG) antibodies to the Notch1, 2 and 3 promoters in lung Treg cells of OVA+UFP-treated Foxp3YFPCre, and Foxp3YFPCreStat3Δ/Δ mice (n=5). Each symbol represents one mouse. Numbers in flow plots indicate percentages. Error bars indicate SEM. Statistical tests: One-way ANOVA with Dunnett’s post hoc analysis (a-c); two-way ANOVA with Sidak’s post hoc analysis (d,e). **P<0.01, ***P<0.001, ****P<0.0001. Data representative of two or three independent experiments.
Extended Data Fig. 2. Notch4 expression on lung Treg cells licenses allergic airway inflammation.
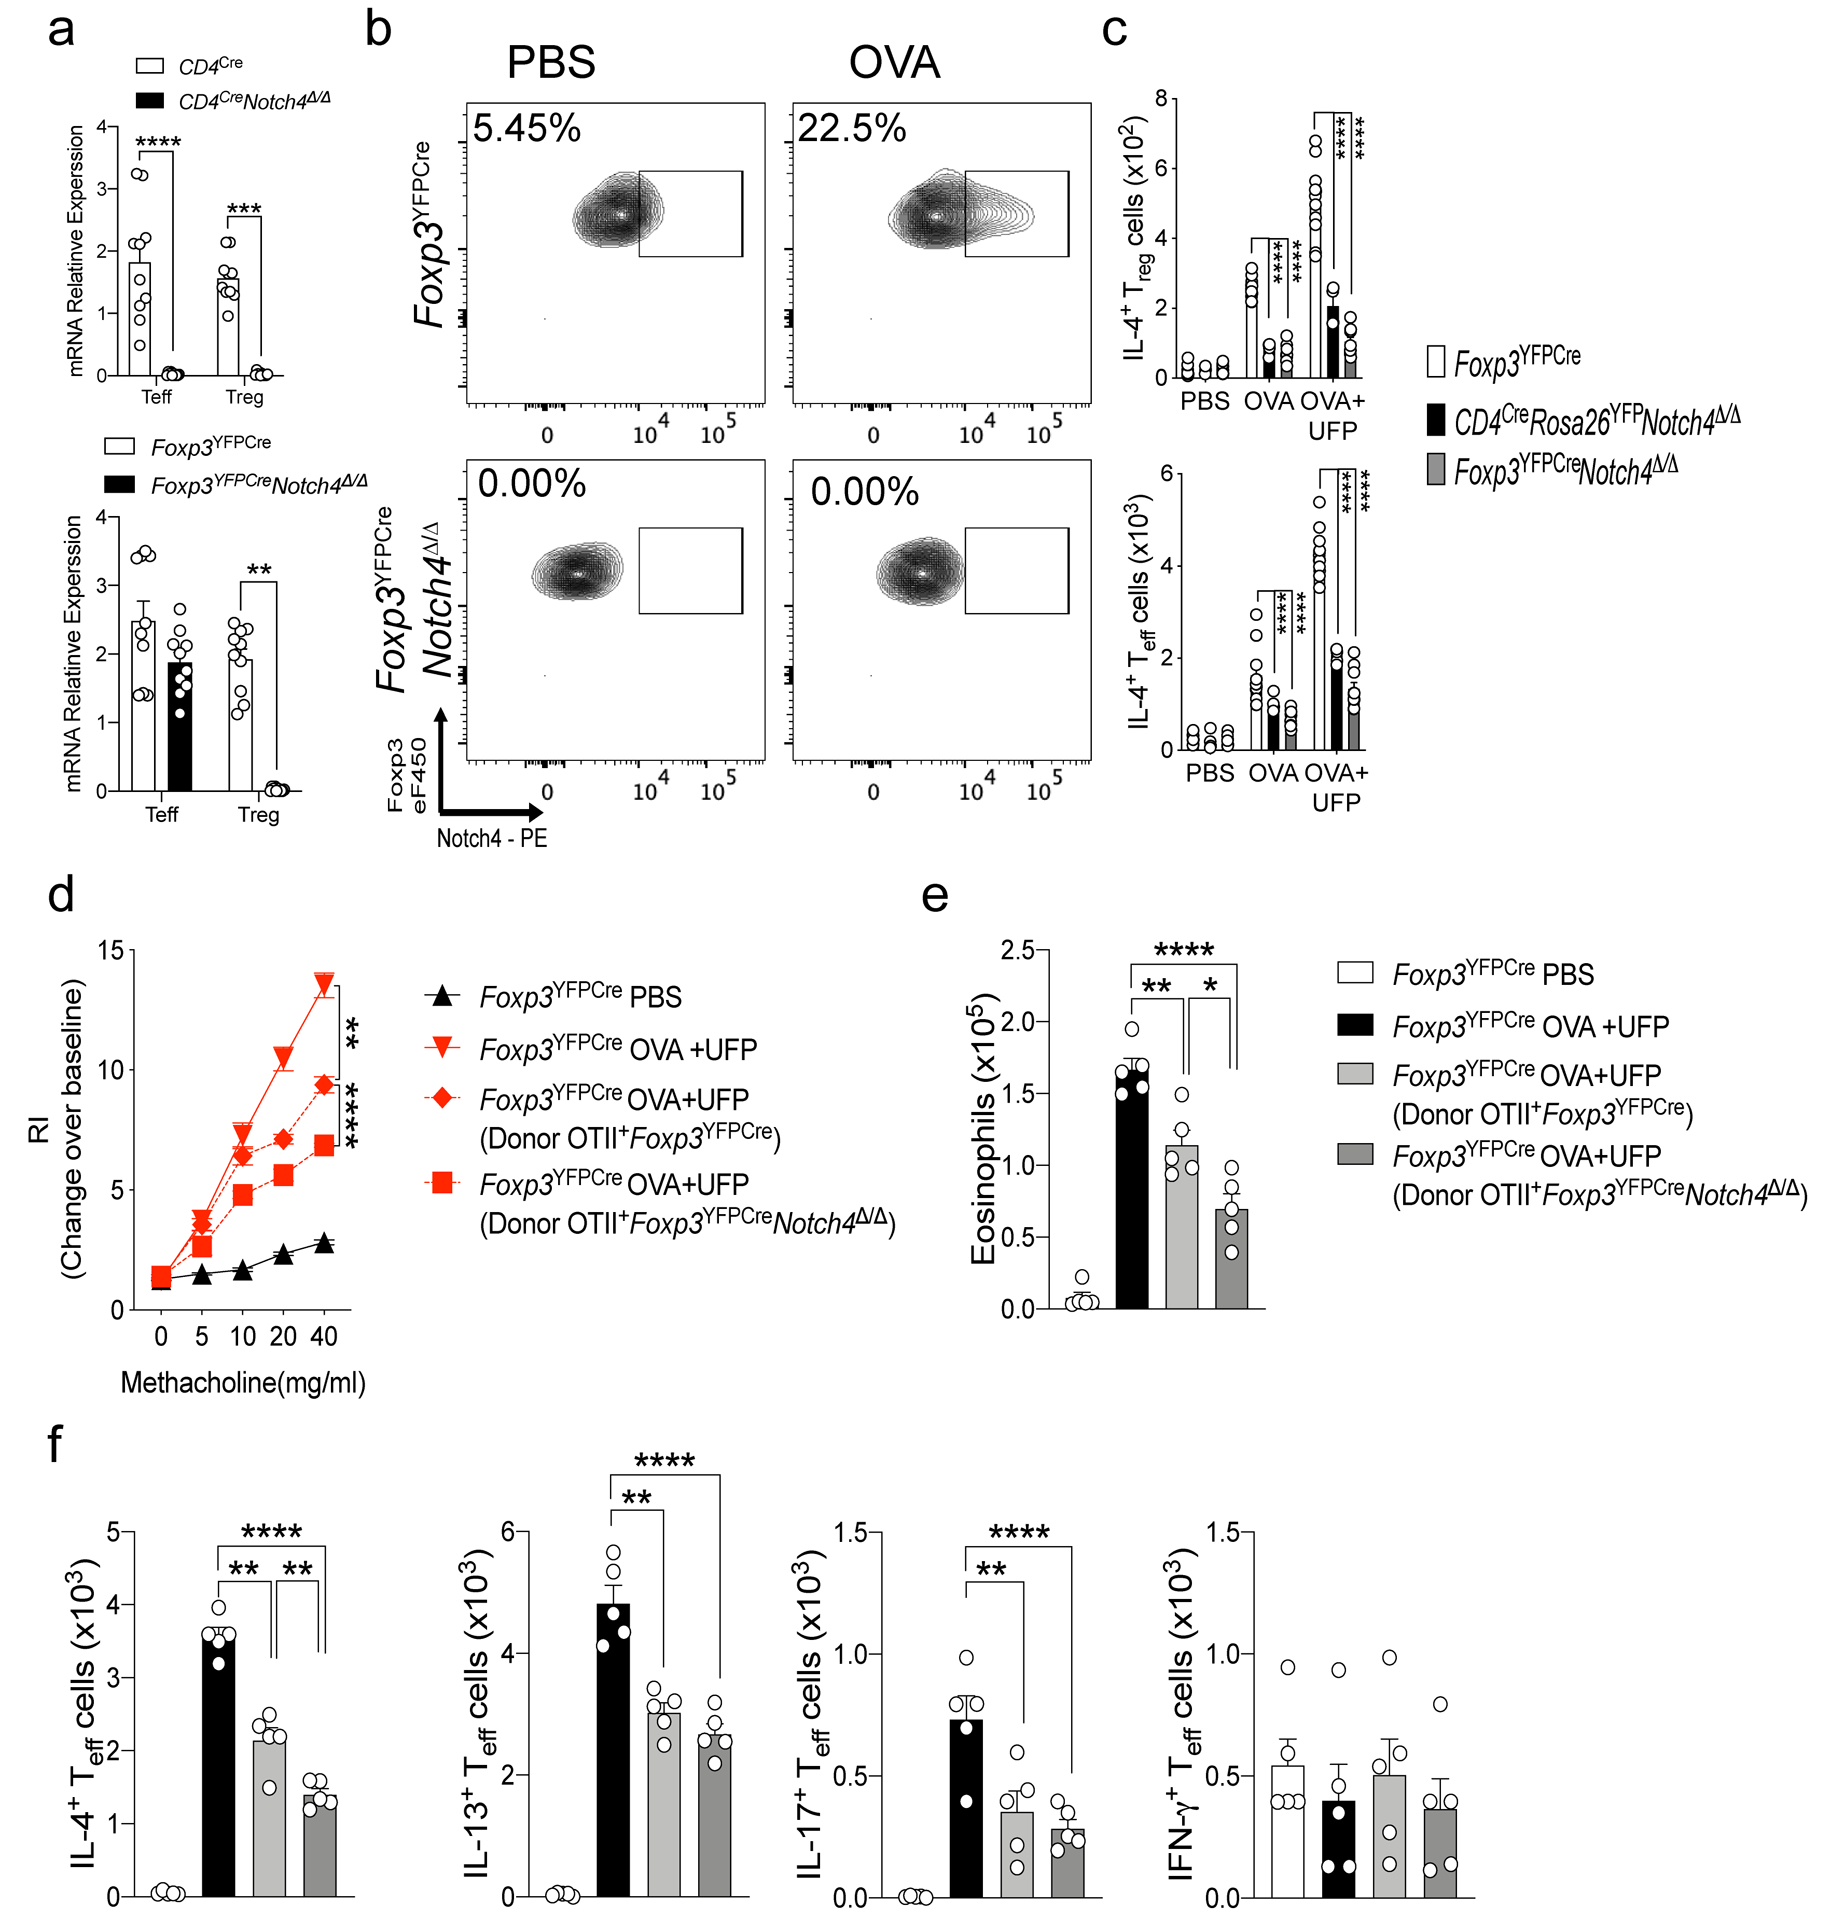
a, RT-PCR analysis of Notch4 expression in CD4Cre mice in B-cells and T-cells (n=5). b, RT-PCR analysis of Notch4 expression in Foxp3YFPCre mice in both Treg and Teff cells (n=5). c,d, IL-4 and IFN-γ expression in lung Foxp3+CD4+ Treg. (c) and Foxp3–CD4+Teff cells. (d) derived from the respectively treated Foxp3YFPCre, CD4CreNotch4Δ/Δ and Foxp3YFPCreNotch4Δ/Δ mice (n=5). e, Airway hyperresponsiveness in Foxp3YFPCre sensitized either with PBS or OVA, then challenged with OVA+UFP following transfer of OTII+Foxp3YFPCre or OTII+Foxp3YFPCreNotch4Δ/Δ iTreg cells (n=5). f, Eosinophil numbers for the respective mouse groups (n=5). g, IL-4, IL-13, IL-17 and IFNγ expression in lung Foxp3–CD4– Teff cells. Each symbol represents one mouse (n=5). Error bars indicate SEM. Statistical tests: two-way ANOVA with Sidak’s post hoc analysis (a,c,d); One-way ANOVA with Dunnett’s post hoc analysis (e,f). *P<0.05, **P<0.01, ***P<0.001, ****P<0.0001. Data representative of two or three independent experiments.
Extended Data Fig. 3. Allergic airway inflammatory responses in mice with Treg cell-specific Pofut1 or Rbpj1 deletion.
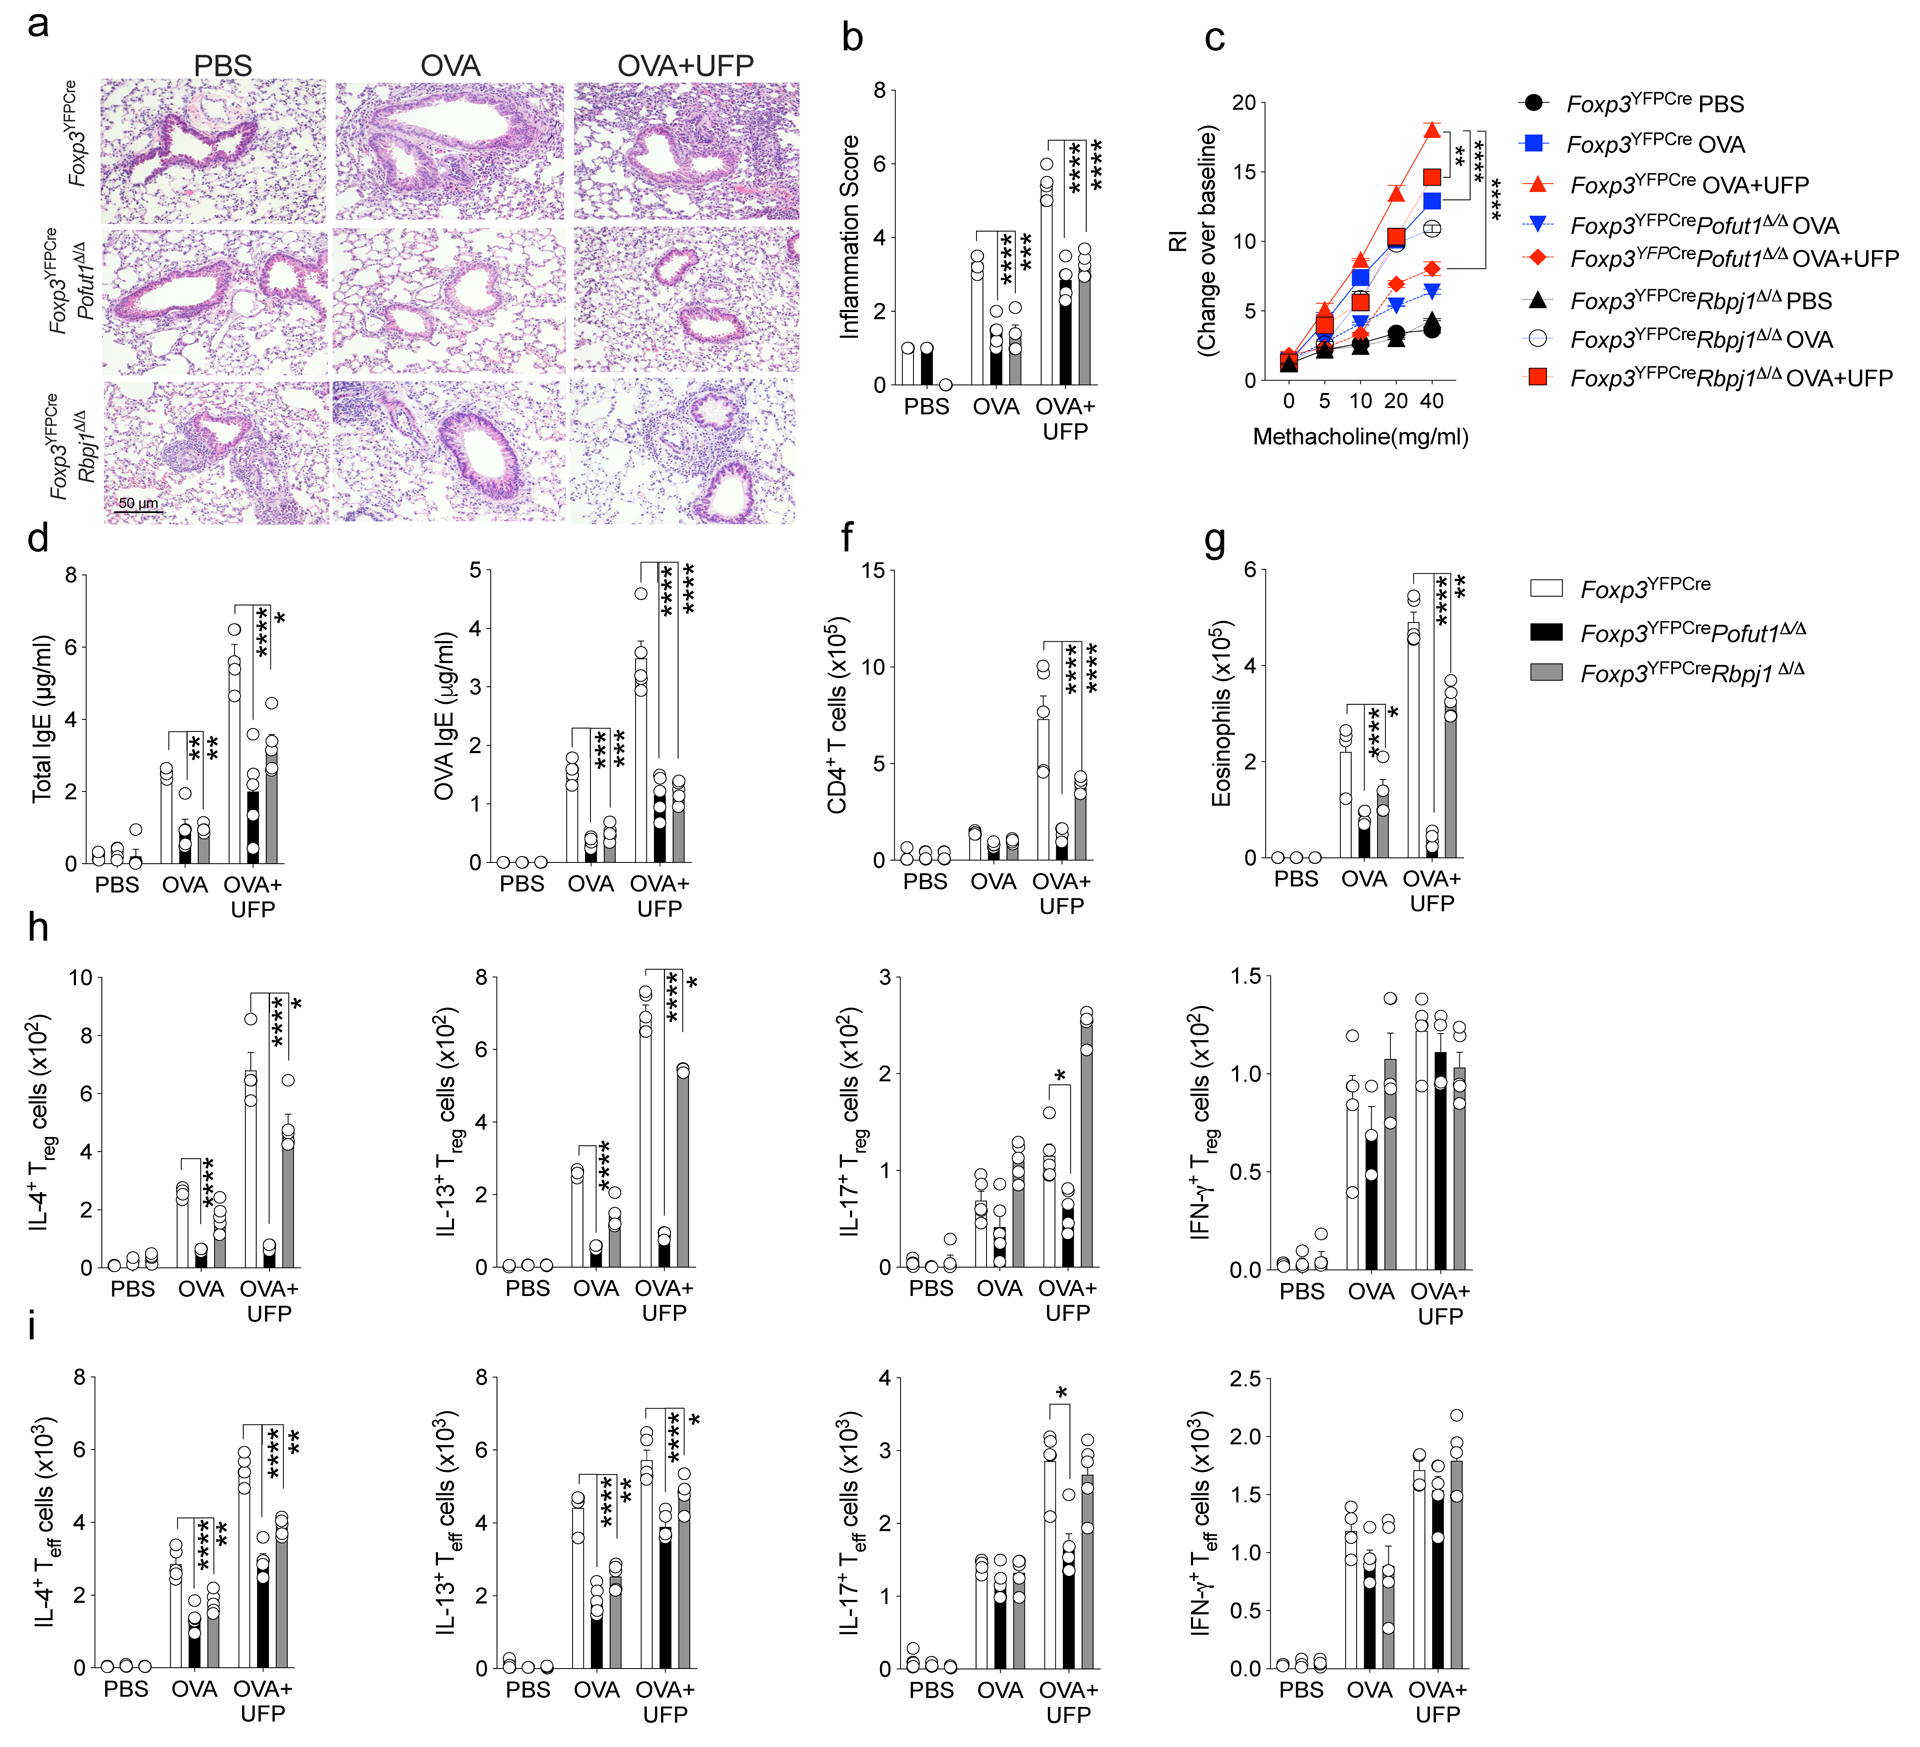
a, Representative PAS-stained sections of lung tissues isolated from Foxp3YFPCre, Foxp3YFPCrePofut1Δ/Δ or Foxp3YFPCreRbpj1Δ/Δ mice segregated into PBS, OVA or OVA+UFP-treated groups (200X magnification). b, Inflammation scores in the respective lung tissues. c, AHR in the respective mouse groups in response to methacholine. d,e, serum total and OVA-specific IgE concentrations. f,g, absolute numbers of lung CD4+ T cells and eosinophils. h,i,IL-4, IL-13, IL-17 and IFNγ expression in lung Foxp3+CD4+ Treg (h) and Foxp3–CD4+Teff cells (i). Each symbol represents an independent sample. Error bars indicate SEM. Statistical tests: two-way ANOVA with Sidak’s post hoc analysis (b-i). *P<0.05, **P<0.01, ***P<0.001, ****P<0.0001. Data representative of two or three independent experiments. n=5 mice per group.
Extended Data Fig. 4. Allergic airway inflammatory responses in mice with Treg cell-specific Notch1 or Notch2 deletion or global Notch3 deletion.

a-c, AHR in Foxp3YFPCre, Foxp3YFPCreNotch1Δ/Δ, Foxp3YFPCreNotch2Δ/Δ, or Foxp3YFPCreNotch3–/– mice segregated into PBS, OVA or OVA+UFP-treated groups (200X magnification). d, serum OVA-specific IgE concentrations. e,f, absolute numbers of lung CD4+ T cells and eosinophils. g,h, IL-4, IL-13, and IL-17 expression in lung Foxp3–CD4+Teff (g) and Foxp3+CD4+Treg cells (h). Each symbol represents an independent sample. Error bars indicate SEM. Statistical tests: two-way ANOVA with Sidak’s post hoc analysis a-h. Data representative of two or three independent experiments. n=5 mice per group.
Extended Data Fig. 5. Treg cell-specific Il6r and stat3 deletions attenuate allergic airway inflammation.
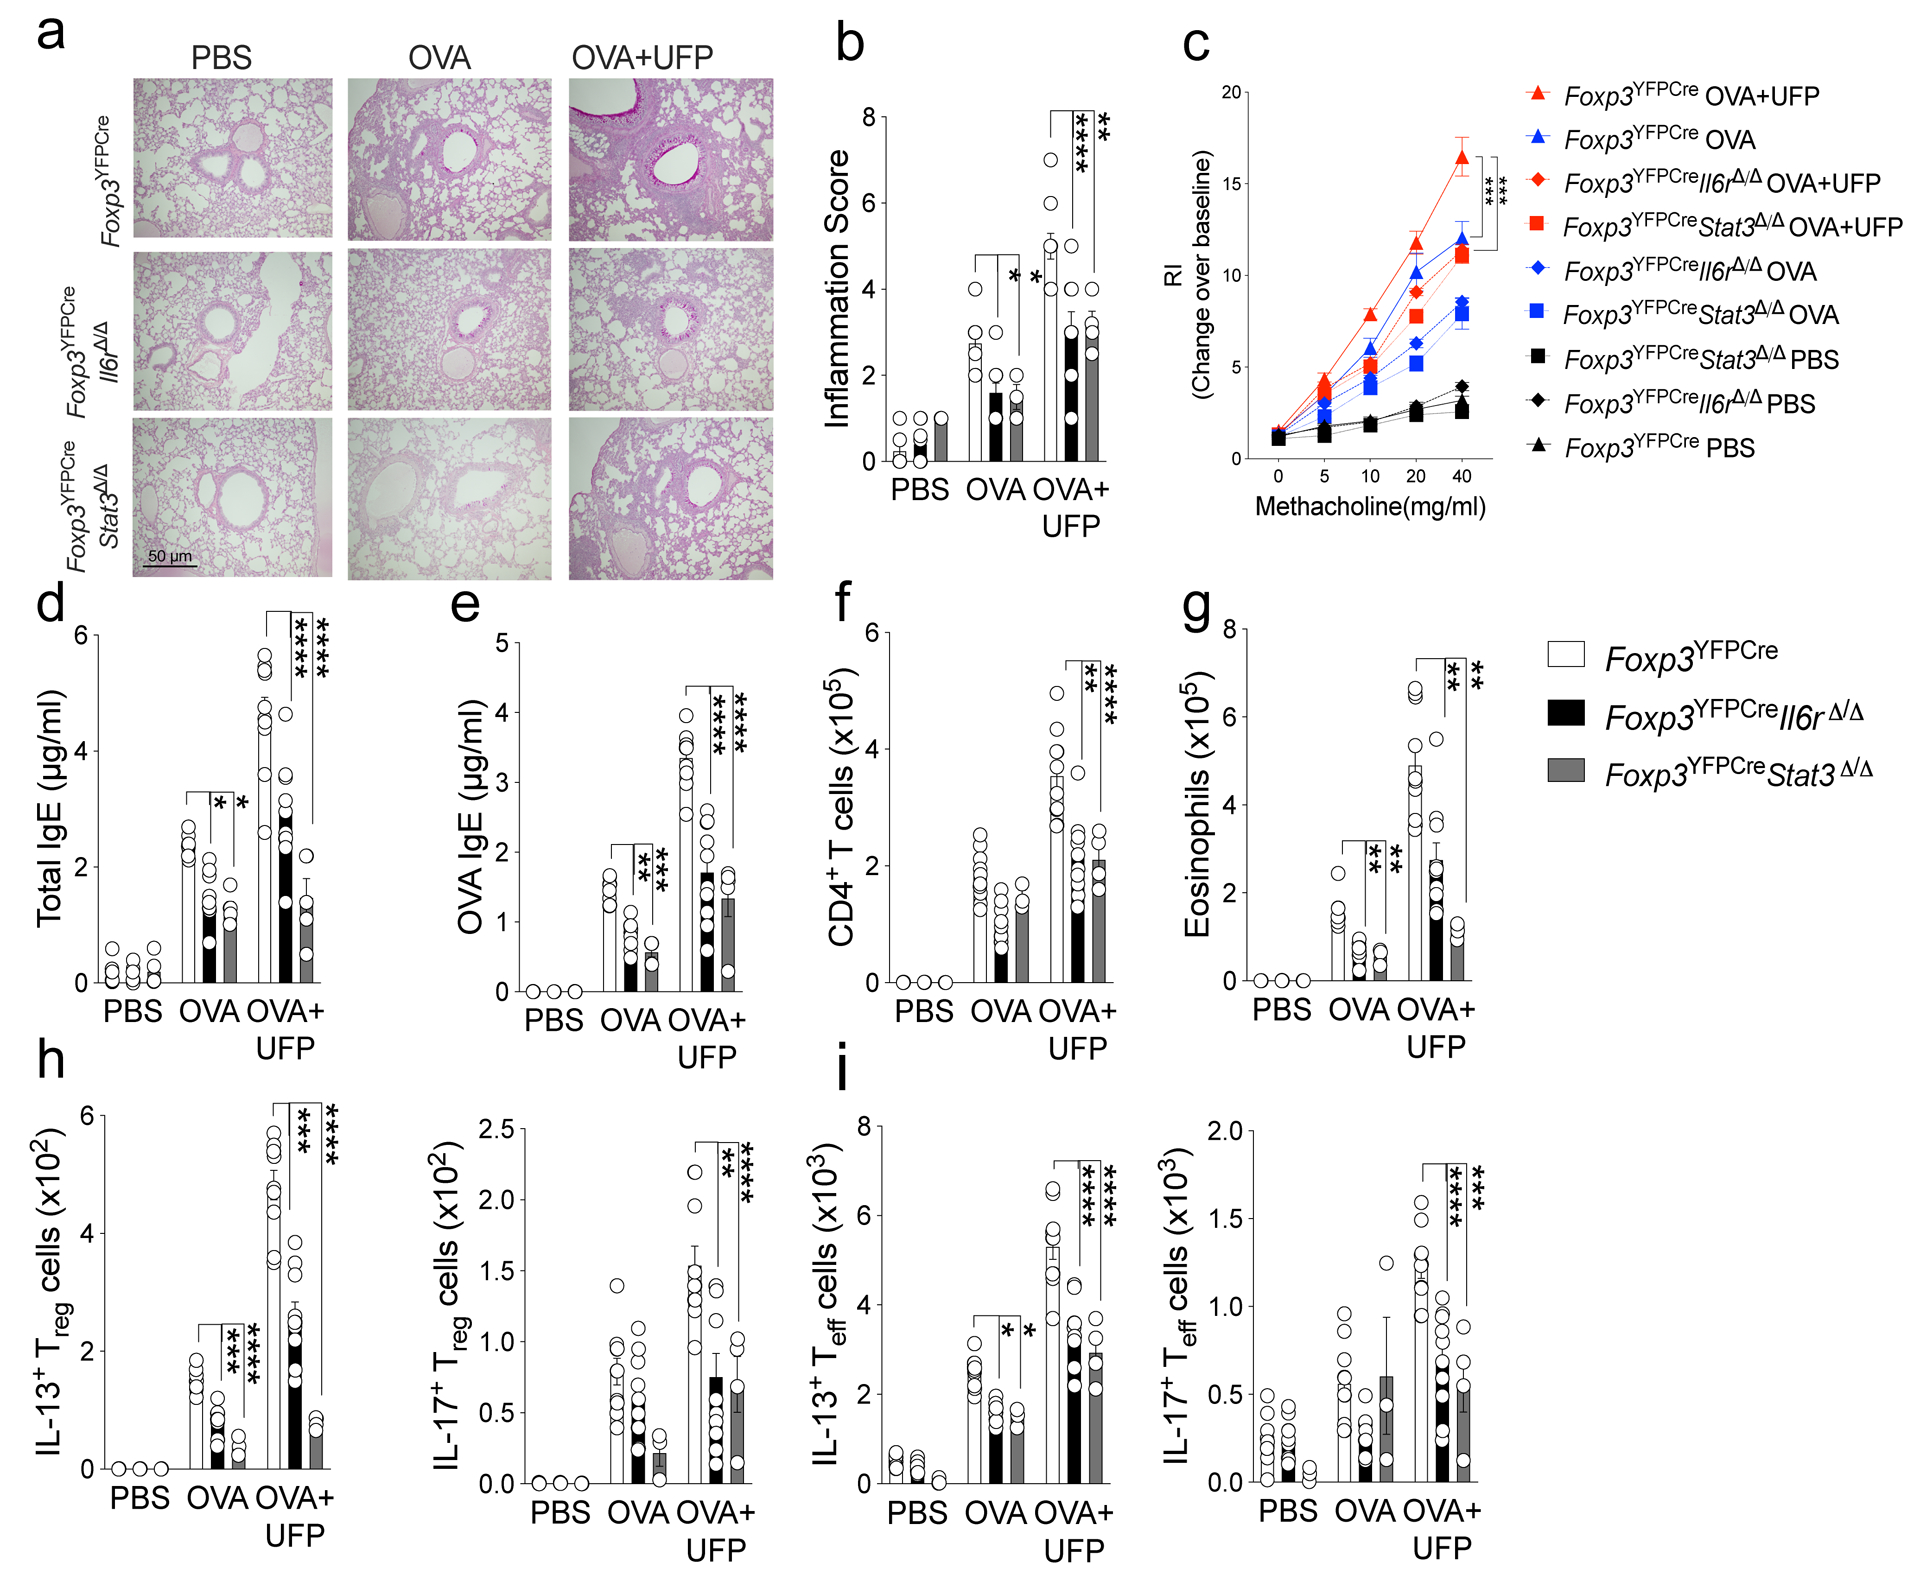
a, Representative PAS-stained sections of lung tissues isolated from Foxp3YFPCre, Foxp3YFPCreIl6rΔ/Δ or Foxp3YFPCreStat3Δ/Δ mice segregated into PBS, OVA or OVA+UFP-treated groups (200X magnification). b, Inflammation scores in the respective lung tissues. c, AHR in the respective mouse groups in response to methacholine. d,e, serum total and OVA-specific IgE concentrations. f,g, absolute numbers of lung CD4+ T cells and eosinophils. h,i, IL-13 and IL-17 expression in lung Foxp3+CD4+ Treg (h) and Foxp3–CD4+ Teff cells (i). Each symbol represents an independent sample. Error bars indicate SEM. Statistical tests: two-way ANOVA with Sidak’s post hoc analysis (b-i). *P<0.05, *P<0.05, **P<0.01, ***P<0.001, ****P<0.0001. Data representative of two or three independent experiments. n=5 mice per group.
Extended Data Fig. 6. Treg cell-specific Notch4 deletion rescues HDM induced allergic airway inflammation.
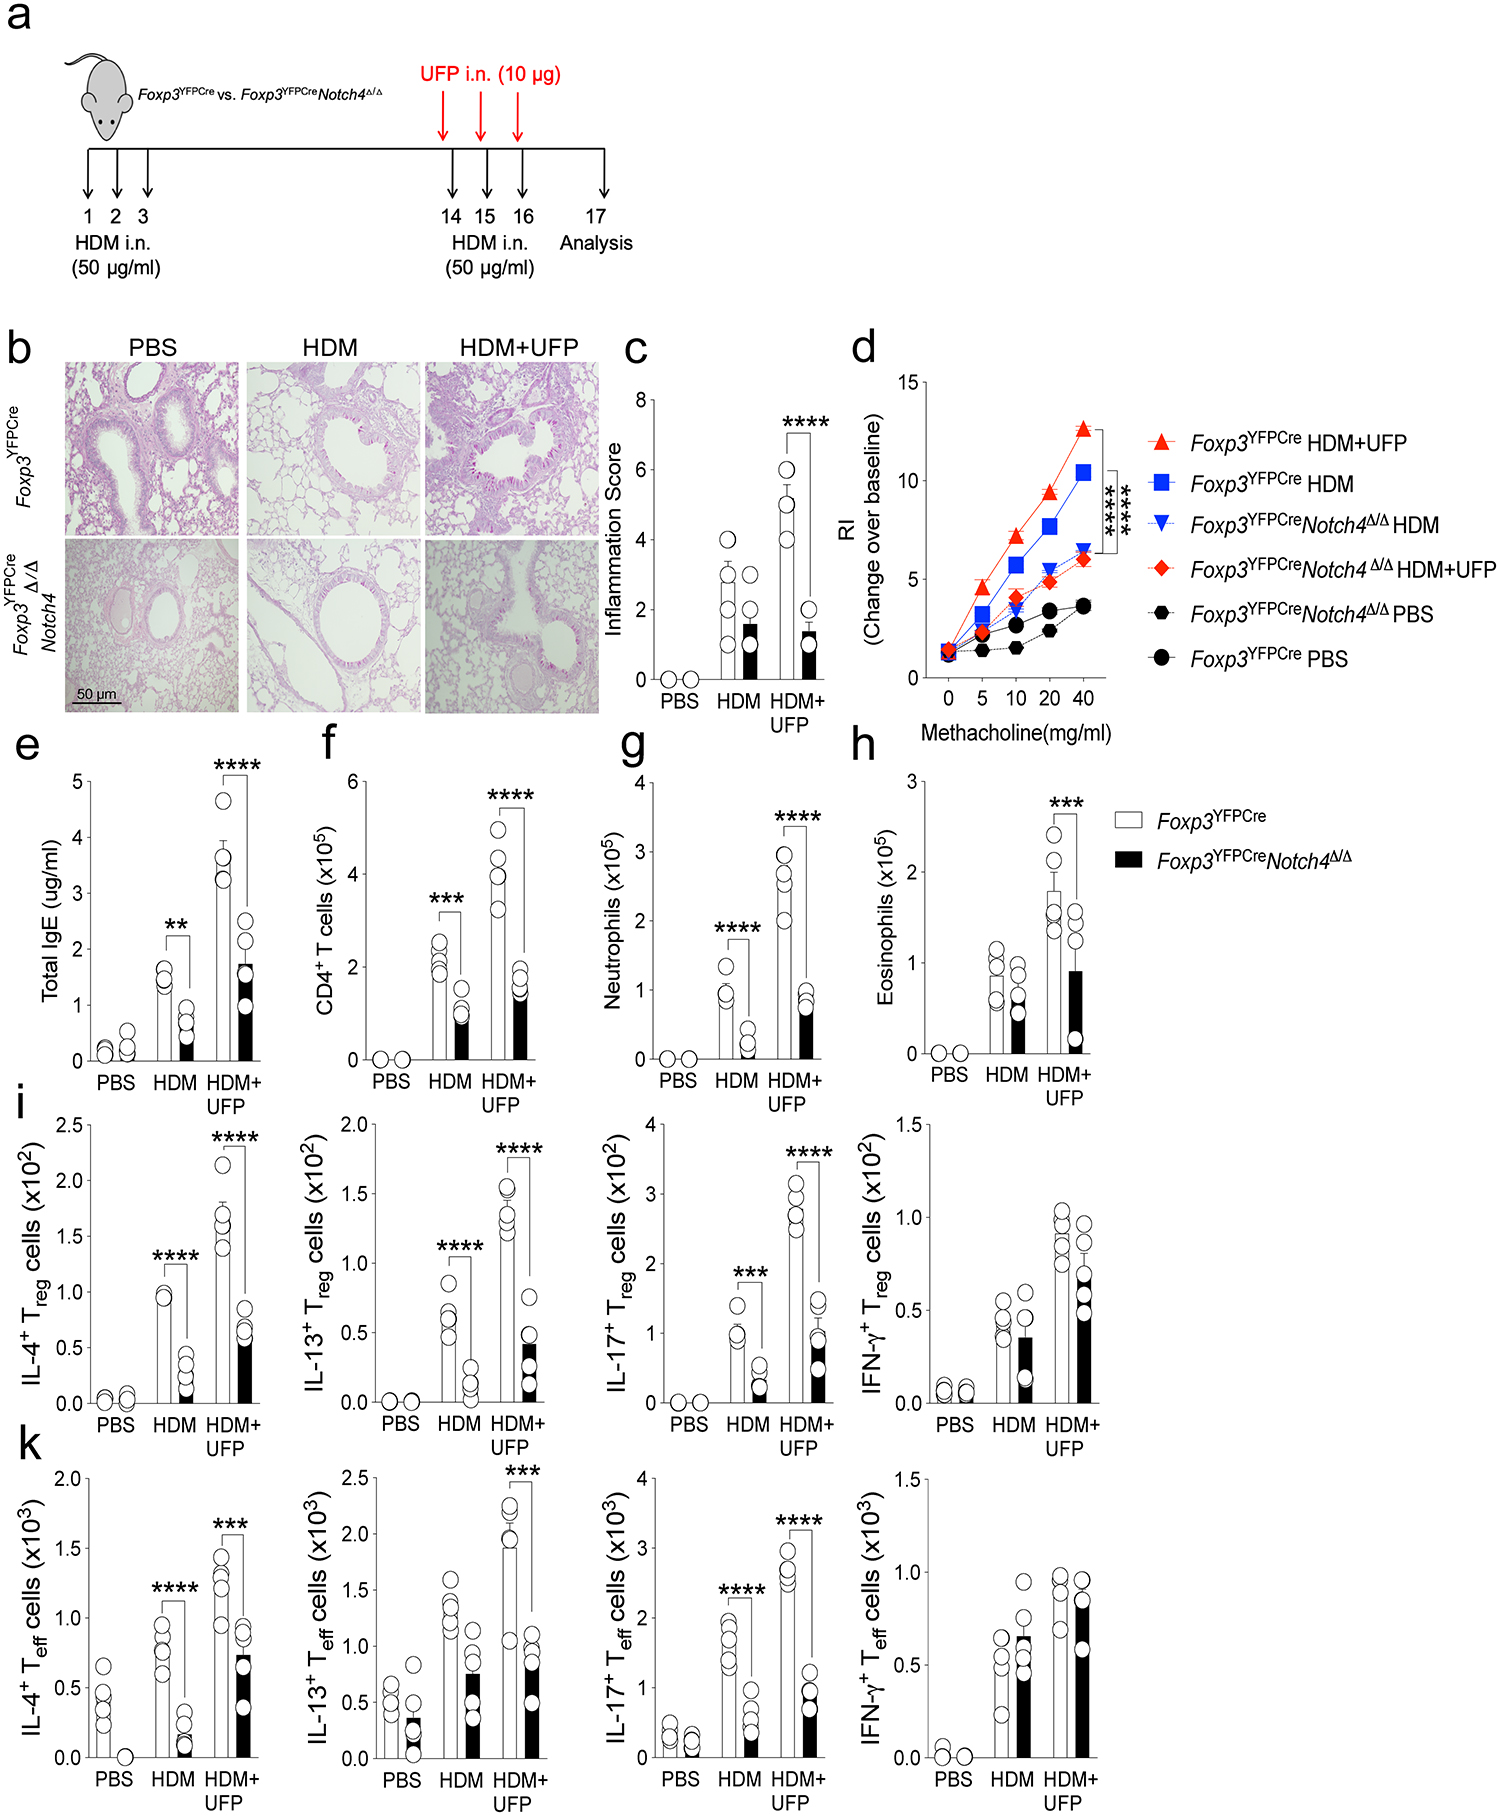
a, scheme of the house dust mite (HDM) airway inflammation protocol. b, Representative PAS-stained sections of lung tissues isolated from Foxp3YFPCre or Foxp3YFPCreNotch4Δ/Δ mice segregated into PBS, OVA or OVA+UFP-treated groups (200X magnification). c, Inflammation scores in the respective lung tissues. d, AHR in the respective mouse groups in response to methacholine. e, serum total IgE concentrations. (f-h), absolute numbers of lung CD4+ T cells, neutrophils and eosinophils. i,k, IL-4, IL-13, IL-17 and IFNγ expression in lung Foxp3+CD4+ Treg (i) and Foxp3–CD4+ Teff cells (k). Each symbol represents an independent sample. Numbers in flow plots indicate percentages. Error bars indicate SEM. Statistical tests: two-way ANOVA with Sidak’s post hoc analysis (c-k). **P<0.01, ***P<0.001, ****P<0.0001. Data representative of two or three independent experiments. n=5 mice per group.
Extended Data Fig. 7. Treg cell-specific Notch4 deletion rescues chronic allergic airway inflammation.
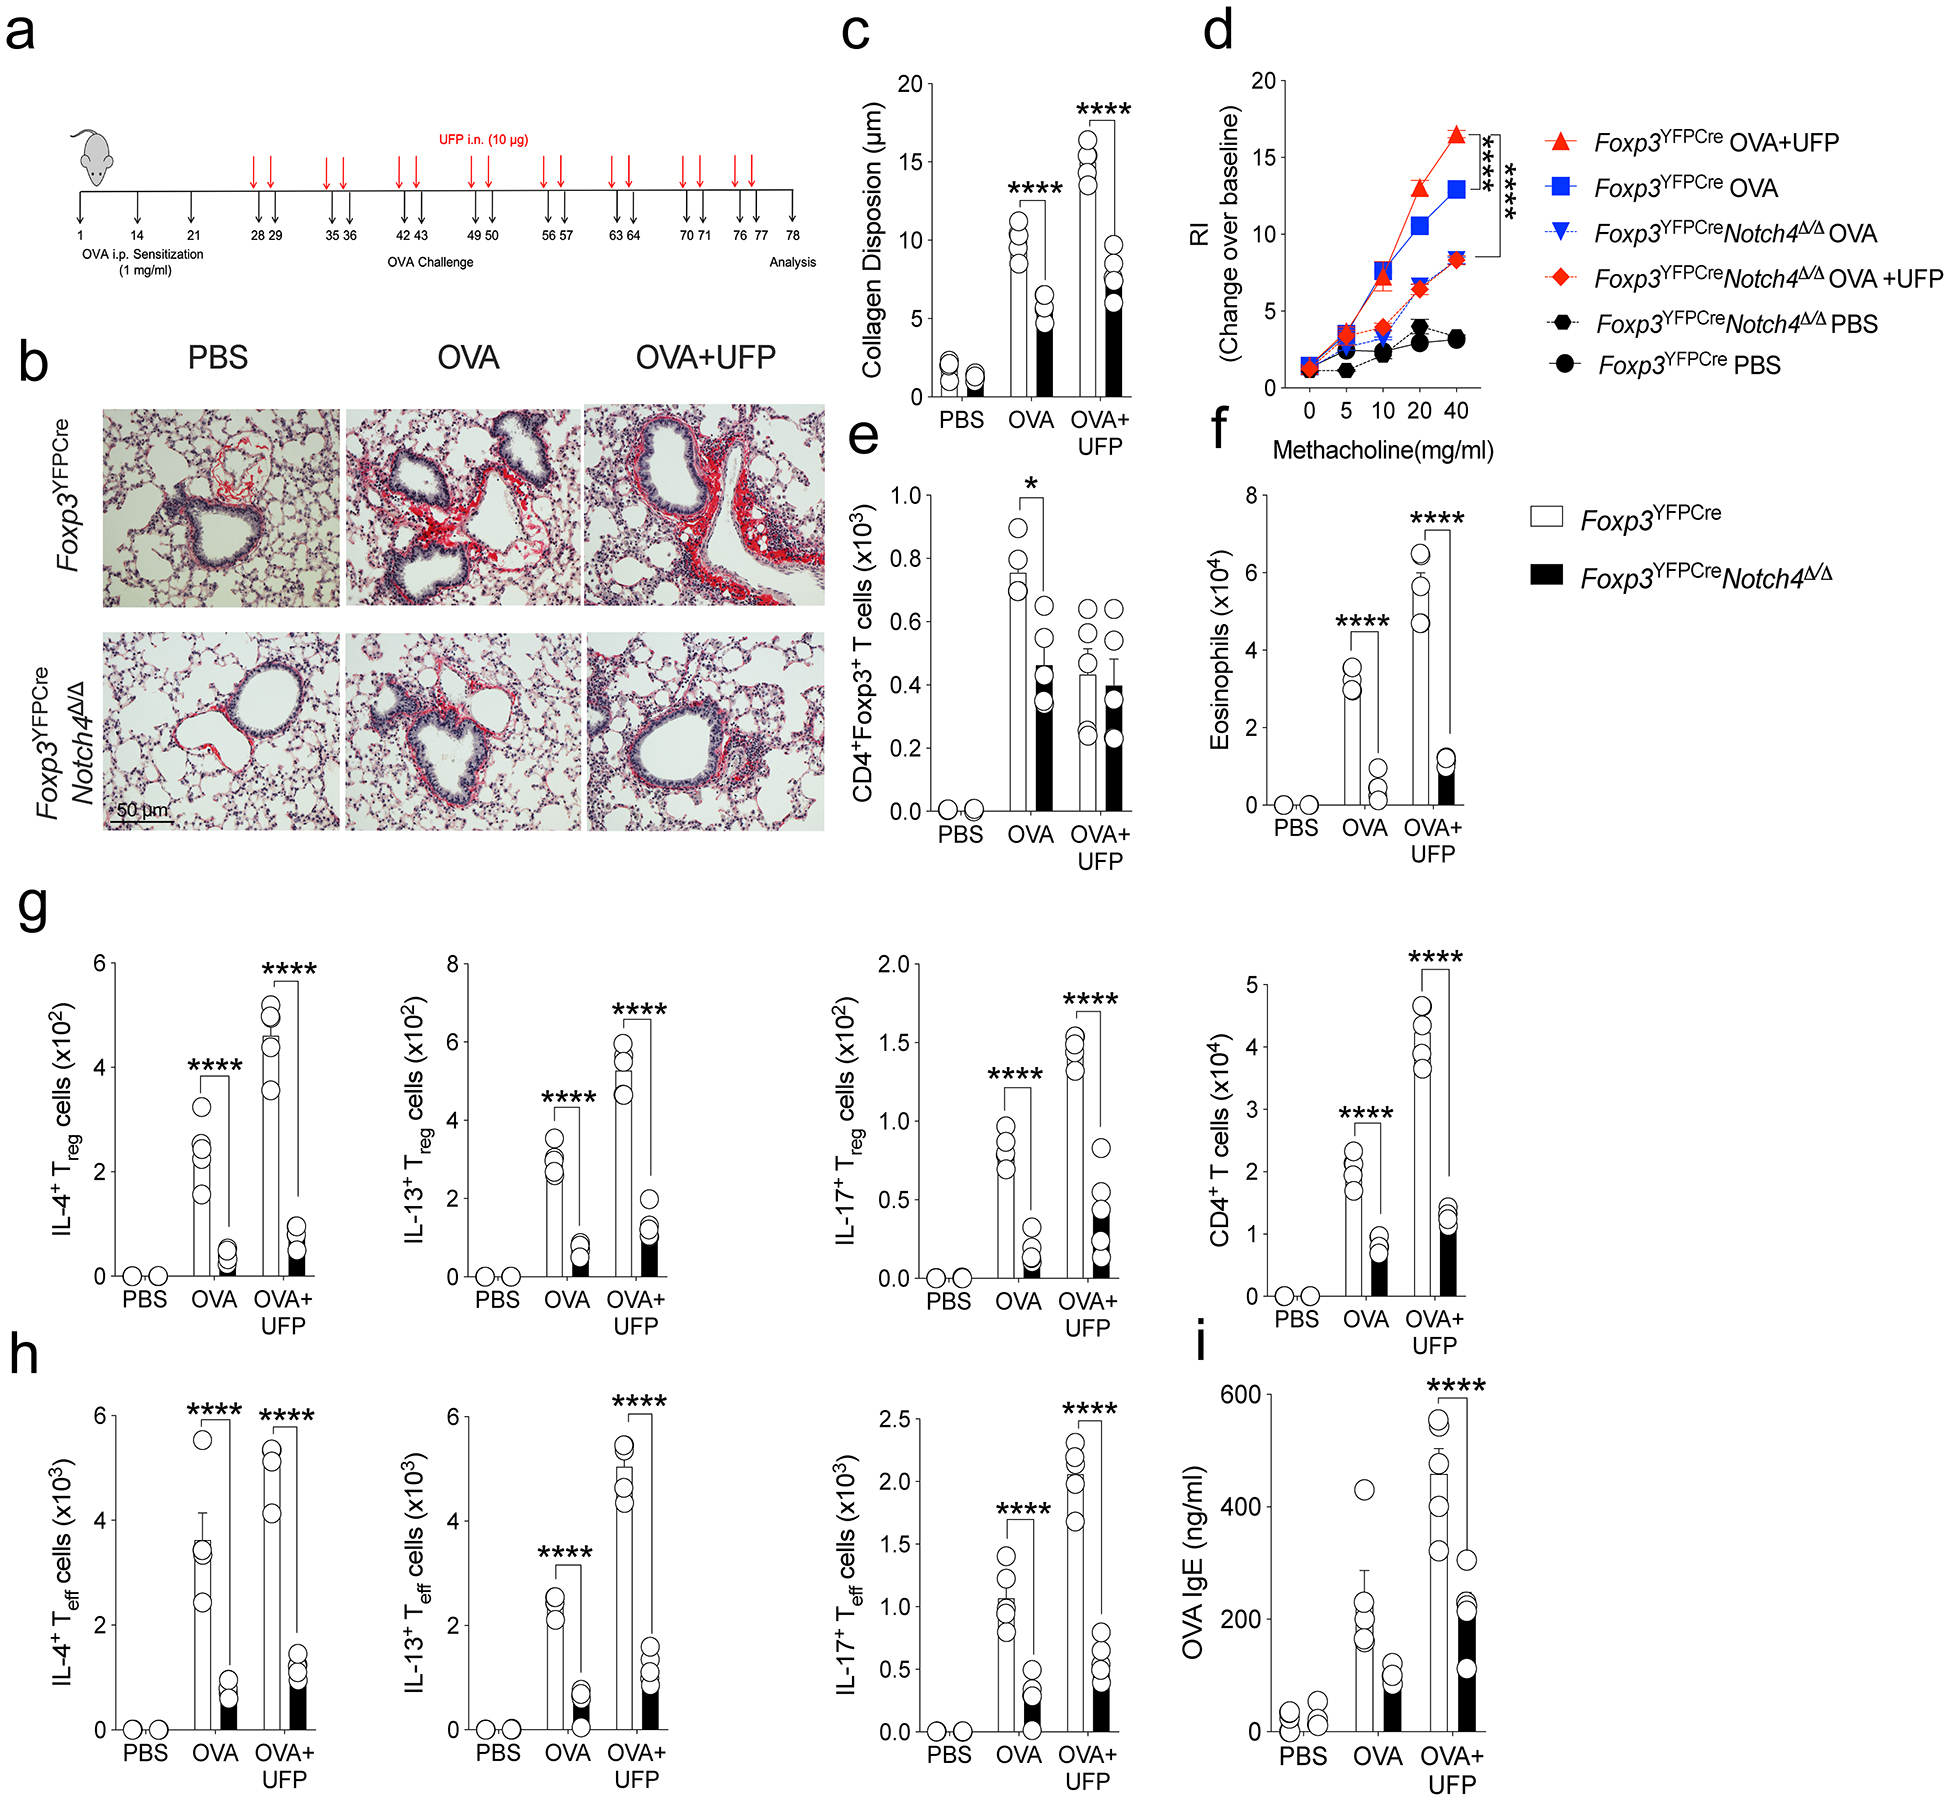
a, Scheme for the chronic airway inflammation mouse protocol b, Representative Sirius-Red-stained sections of lung tissues isolated from Foxp3YFPCre or Foxp3YFPCreNotch4Δ/Δ mice segregated into PBS, OVA or OVA+UFP-treated groups (200X magnification). c, Collagen disposition measurement in the respective lung tissues. d, AHR in the respective mouse groups in response to methacholine. e,f, absolute numbers of lung CD4+ T cells and eosinophils. g,h, IL-4, IL-13, and IL-17 expression in lung Foxp3+CD4+ Treg (g) and Foxp3–CD4+Teff cells (h). i, Serum OVA-specific IgE titers in the respective groups. Each symbol represents an independent sample. Error bars indicate SEM. Statistical tests: two-way ANOVA with Sidak’s post hoc analysis (c-h). *P<0.05, ****P<0.0001. Data representative of two or three independent experiments. n=5 mice per group.
Extended Data Fig. 8. Notch receptor expression in human Treg and Teff cells.
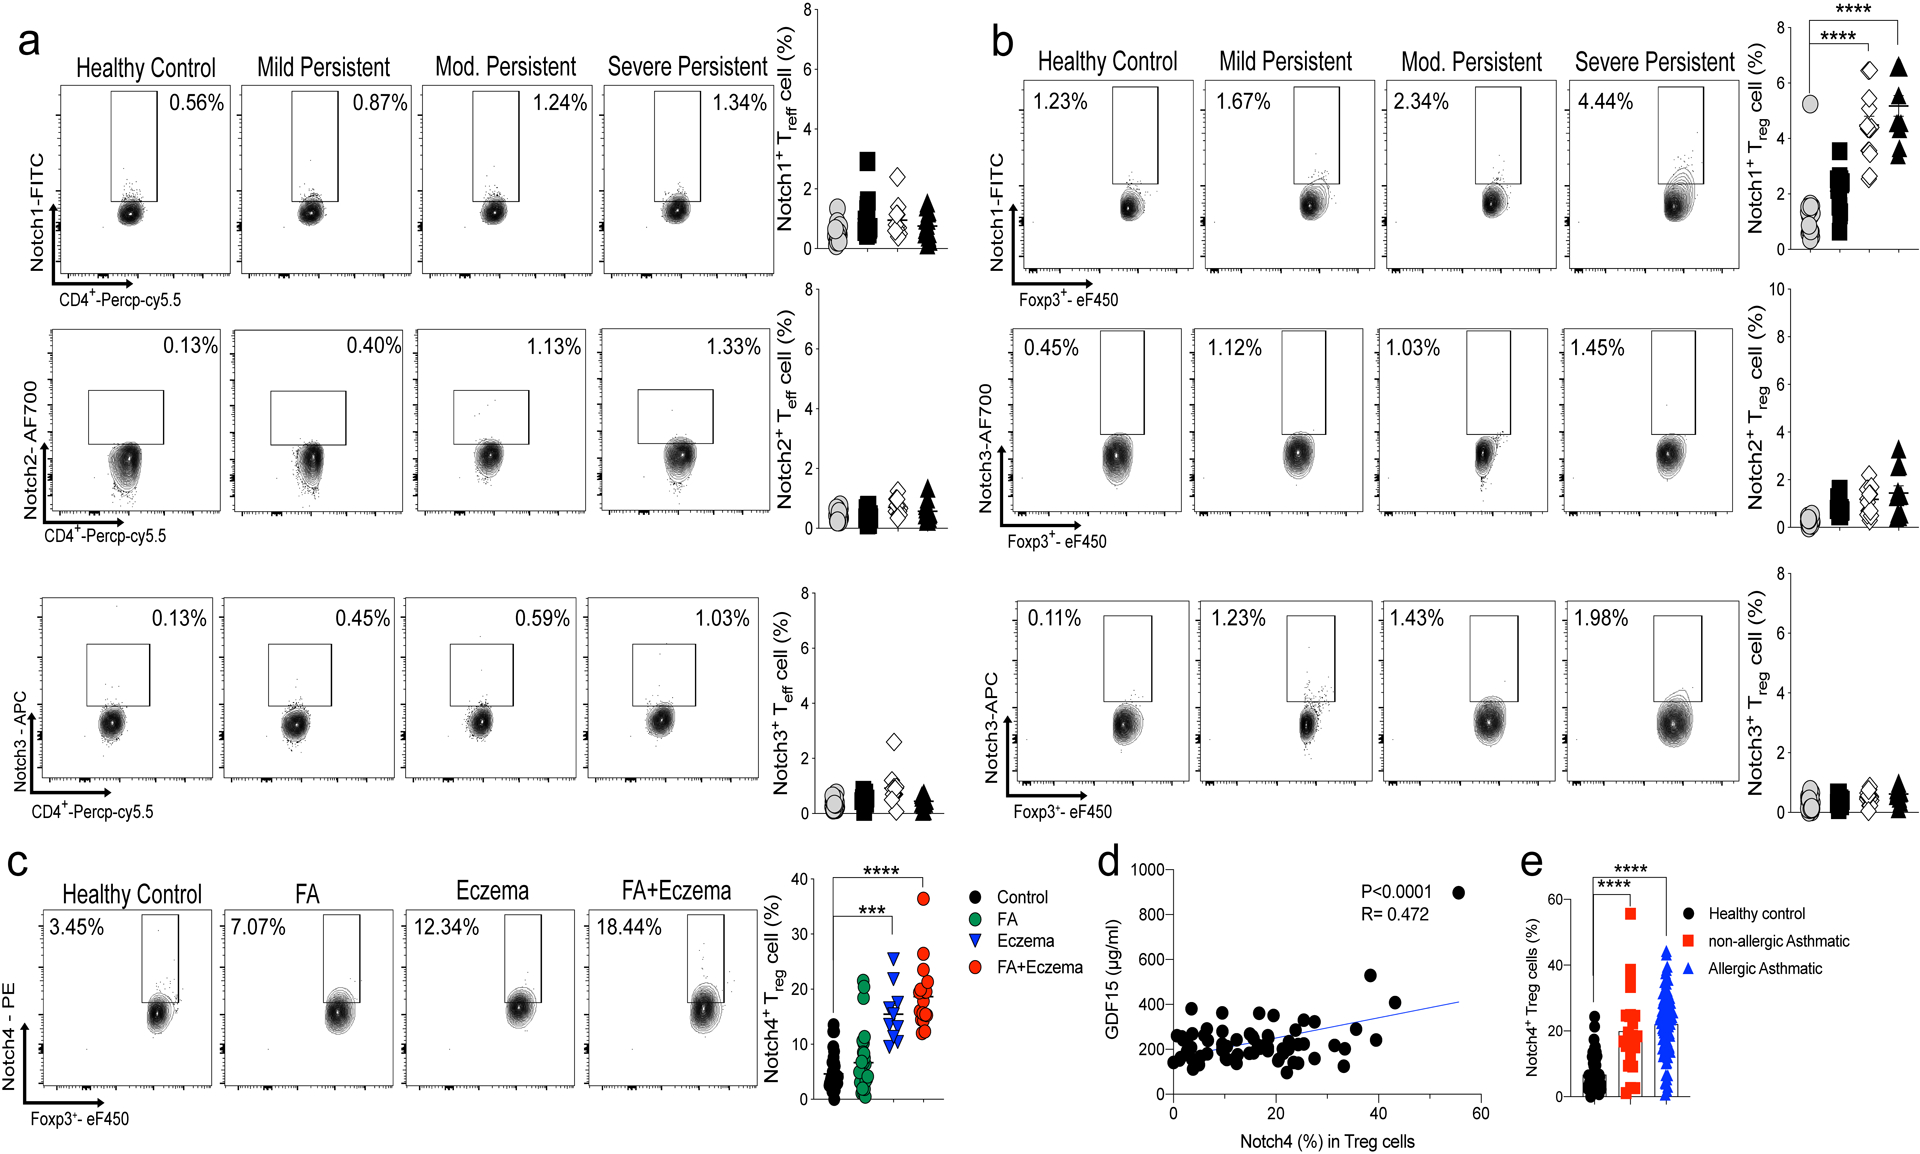
a,b, Flow cytometric analysis, cell frequencies and mean fluorescence intensity (MFI) of Notch1, 2 and 3 expression in peripheral blood Treg cells (a) and Teff cells (b) of control and asthmatic subjects, the latter segregated for asthma severity (control n=22, M.P n= 15, Mod n= 16. S.P n=11). c, Flow cytometric analysis and cell frequencies of Notch4 peripheral blood Treg cells of healthy control, food allergy (FA), eczema and FA+eczema (Control n=37, FA n= 28, Eczema n=10 and FA+Eczema n=20) d, Serum GDF15 concentrations in asthmatic subjects plotted as a function of Notch4 expression on circulating Treg cells (n=73) e, Cell frequencies of Notch4 expression in peripheral blood Treg cells in healthy subjects, allergic and non-allergic asthmatics (control = 56, non-allergic n=21, allergic n=85). Error bars indicate SEM. Statistical tests: One-way ANOVA with Dunnett’s post hoc analysis. (a-c,e); simple regression analysis (d). ***P<0.001, ****P<0.0001. Data representative of two or three independent experiments.
Supplementary Material
Acknowledgment
This work was supported by a National Institutes of Health grants R01 AI115699 and R01 AI065617 to T.A.C., U01AI110397 and R01 HL137192 to W.P. and the German Research Society grant HA 8465/1–1 to H.H.
Footnotes
Supplementary Materials
Materials and Methods
Extended data Figures 1 – 8
Data Set 1
Supplementary Table 1
Competing interests: Talal A Chatila, Hani Harb and Amir Massoud are inventors on published US patent application No. WO2019178488A1 submitted by The Children’s Medical Center Corporation, titled “Method for treating asthma or allergic disease”. Wanda Phipatanakul is a Consultant for Genentech, Novartis, Regeneron, Sanofi Genzyme, and Glaxo Smith Kline, and receives clinical trial support from Genentech, Novartis, Regeneron, Circassia, Thermo Fisher, Monaghan, Lincoln Diagnositcs, Alk Abello, and Glaxo Smith Kline.
References
- 1.Lambrecht BN & Hammad H The immunology of asthma. Nat Immunol 16, 45–56 (2015). [DOI] [PubMed] [Google Scholar]
- 2.Martinez FD & Vercelli D Asthma. Lancet 382, 1360–1372 (2013). [DOI] [PubMed] [Google Scholar]
- 3.Noval Rivas M & Chatila TA Regulatory T cells in allergic diseases. J Allergy Clin Immunol 138, 639–652 (2016). [DOI] [PMC free article] [PubMed] [Google Scholar]
- 4.Krishnamoorthy N et al. Early infection with respiratory syncytial virus impairs regulatory T cell function and increases susceptibility to allergic asthma. Nat Med 18, 1525–1530 (2012). [DOI] [PMC free article] [PubMed] [Google Scholar]
- 5.Noval Rivas M et al. Regulatory T cell reprogramming toward a Th2-cell-like lineage impairs oral tolerance and promotes food allergy. Immunity 42, 512–523 (2015). [DOI] [PMC free article] [PubMed] [Google Scholar]
- 6.Massoud AH et al. An asthma-associated IL4R variant exacerbates airway inflammation by promoting conversion of regulatory T cells to TH17-like cells. Nat Med 22, 1013–1022 (2016). [DOI] [PMC free article] [PubMed] [Google Scholar]
- 7.Xia M et al. Vehicular exhaust particles promote allergic airway inflammation through an aryl hydrocarbon receptor-notch signaling cascade. J Allergy Clin Immunol 136, 441–453 (2015). [DOI] [PMC free article] [PubMed] [Google Scholar]
- 8.Xia M, Harb H, Saffari A, Sioutas C & Chatila TA A Jagged 1-Notch 4 molecular switch mediates airway inflammation induced by ultrafine particles. J Allergy Clin Immunol 142, 1243–1256 e1217 (2018). [DOI] [PMC free article] [PubMed] [Google Scholar]
- 9.Tsai VWW, Husaini Y, Sainsbury A, Brown DA & Breit SN The MIC-1/GDF15-GFRAL Pathway in Energy Homeostasis: Implications for Obesity, Cachexia, and Other Associated Diseases. Cell Metab 28, 353–368 (2018). [DOI] [PubMed] [Google Scholar]
- 10.Luan HH et al. GDF15 Is an Inflammation-Induced Central Mediator of Tissue Tolerance. Cell 178, 1231–1244 e1211 (2019). [DOI] [PMC free article] [PubMed] [Google Scholar]
- 11.Chen W et al. Conversion of peripheral CD4+CD25- naive T cells to CD4+CD25+ regulatory T cells by TGF-beta induction of transcription factor Foxp3. J Exp Med 198, 1875–1886 (2003). [DOI] [PMC free article] [PubMed] [Google Scholar]
- 12.Shi S & Stanley P Protein O-fucosyltransferase 1 is an essential component of Notch signaling pathways. Proc Natl Acad Sci U S A 100, 5234–5239 (2003). [DOI] [PMC free article] [PubMed] [Google Scholar]
- 13.Charbonnier LM, Wang S, Georgiev P, Sefik E & Chatila TA Control of peripheral tolerance by regulatory T cell-intrinsic Notch signaling. Nat Immunol 16, 1162–1173 (2015). [DOI] [PMC free article] [PubMed] [Google Scholar]
- 14.Han H et al. Inducible gene knockout of transcription factor recombination signal binding protein-J reveals its essential role in T versus B lineage decision. Int Immunol 14, 637–645 (2002). [DOI] [PubMed] [Google Scholar]
- 15.Tachdjian R et al. Pathogenicity of a disease-associated human IL-4 receptor allele in experimental asthma. J Exp Med 206, 2191–2204 (2009). [DOI] [PMC free article] [PubMed] [Google Scholar]
- 16.Shi H et al. Hippo Kinases Mst1 and Mst2 Sense and Amplify IL-2R-STAT5 Signaling in Regulatory T Cells to Establish Stable Regulatory Activity. Immunity 49, 899–914 e896 (2018). [DOI] [PMC free article] [PubMed] [Google Scholar]
- 17.Geng J et al. The transcriptional coactivator TAZ regulates reciprocal differentiation of TH17 cells and Treg cells. Nat Immunol 18, 800–812 (2017). [DOI] [PubMed] [Google Scholar]
- 18.van Loosdregt J et al. Canonical Wnt signaling negatively modulates regulatory T cell function. Immunity 39, 298–310 (2013). [DOI] [PubMed] [Google Scholar]
- 19.van Loosdregt J & Coffer PJ The Role of WNT Signaling in Mature T Cells: T Cell Factor Is Coming Home. J Immunol 201, 2193–2200 (2018). [DOI] [PubMed] [Google Scholar]
- 20.Misra JR & Irvine KD The Hippo Signaling Network and Its Biological Functions. Annu Rev Genet 52, 65–87 (2018). [DOI] [PMC free article] [PubMed] [Google Scholar]
- 21.Clevers H & Nusse R Wnt/beta-catenin signaling and disease. Cell 149, 1192–1205 (2012). [DOI] [PubMed] [Google Scholar]
- 22.Feng Y et al. Control of the inheritance of regulatory T cell identity by a cis element in the Foxp3 locus. Cell 158, 749–763 (2014). [DOI] [PMC free article] [PubMed] [Google Scholar]
- 23.Li X, Liang Y, LeBlanc M, Benner C & Zheng Y Function of a Foxp3 cis-element in protecting regulatory T cell identity. Cell 158, 734–748 (2014). [DOI] [PMC free article] [PubMed] [Google Scholar]
- 24.Vivier E et al. Innate Lymphoid Cells: 10 Years On. Cell 174, 1054–1066 (2018). [DOI] [PubMed] [Google Scholar]
- 25.Esty B et al. Treatment of severe persistent asthma with IL-6 receptor blockade. J Allergy Clin Immunol Pract 7, 1639–1642 e1634 (2019). [DOI] [PMC free article] [PubMed] [Google Scholar]
- 26.Hirota T et al. Genome-wide association study identifies three new susceptibility loci for adult asthma in the Japanese population. Nat Genet 43, 893–896 (2011). [DOI] [PMC free article] [PubMed] [Google Scholar]
- 27.Ferreira MA et al. Identification of IL6R and chromosome 11q13.5 as risk loci for asthma. Lancet 378, 1006–1014 (2011). [DOI] [PMC free article] [PubMed] [Google Scholar]
- 28.Gruzieva O et al. Prenatal Particulate Air Pollution and DNA Methylation in Newborns: An Epigenome-Wide Meta-Analysis. Environ Health Perspect 127, 57012 (2019). [DOI] [PMC free article] [PubMed] [Google Scholar]
- 29.Li X et al. Genome-wide association study identifies TH1 pathway genes associated with lung function in asthmatic patients. J Allergy Clin Immunol 132, 313–320 e315 (2013). [DOI] [PMC free article] [PubMed] [Google Scholar]
- 30.Savenije OE et al. Association of IL33-IL-1 receptor-like 1 (IL1RL1) pathway polymorphisms with wheezing phenotypes and asthma in childhood. J Allergy Clin Immunol 134, 170–177 (2014). [DOI] [PubMed] [Google Scholar]
- 31.Soroosh P et al. Lung-resident tissue macrophages generate Foxp3+ regulatory T cells and promote airway tolerance. J Exp Med 210, 775–788 (2013). [DOI] [PMC free article] [PubMed] [Google Scholar]
- 32.Magee CN et al. Notch-1 Inhibition Promotes Immune Regulation in Transplantation via Treg-Dependent Mechanisms. Circulation (2019). [DOI] [PMC free article] [PubMed] [Google Scholar]
- 33.Lee PP et al. A critical role for Dnmt1 and DNA methylation in T cell development, function, and survival. Immunity 15, 763–774 (2001). [DOI] [PubMed] [Google Scholar]
- 34.Messerschmidt D et al. beta-catenin-mediated adhesion is required for successful preimplantation mouse embryo development. Development 143, 1993–1999 (2016). [DOI] [PubMed] [Google Scholar]
- 35.Rubtsov YP et al. Regulatory T cell-derived interleukin-10 limits inflammation at environmental interfaces. Immunity 28, 546–558 (2008). [DOI] [PubMed] [Google Scholar]
- 36.McFarland-Mancini MM et al. Differences in wound healing in mice with deficiency of IL-6 versus IL-6 receptor. J Immunol 184, 7219–7228 (2010). [DOI] [PubMed] [Google Scholar]
- 37.Yang X et al. Notch activation induces apoptosis in neural progenitor cells through a p53-dependent pathway. Dev Biol 269, 81–94 (2004). [DOI] [PubMed] [Google Scholar]
- 38.McCright B, Lozier J & Gridley T Generation of new Notch2 mutant alleles. Genesis 44, 29–33 (2006). [DOI] [PubMed] [Google Scholar]
- 39.Krebs LT et al. Characterization of Notch3-deficient mice: normal embryonic development and absence of genetic interactions with a Notch1 mutation. Genesis 37, 139–143 (2003). [DOI] [PubMed] [Google Scholar]
- 40.Barnden MJ, Allison J, Heath WR & Carbone FR Defective TCR expression in transgenic mice constructed using cDNA-based alpha- and beta-chain genes under the control of heterologous regulatory elements. Immunol Cell Biol 76, 34–40 (1998). [DOI] [PubMed] [Google Scholar]
- 41.Moh A et al. Role of STAT3 in liver regeneration: survival, DNA synthesis, inflammatory reaction and liver mass recovery. Laboratory investigation; a journal of technical methods and pathology 87, 1018–1028 (2007). [DOI] [PubMed] [Google Scholar]
- 42.Zhang N et al. The Merlin/NF2 tumor suppressor functions through the YAP oncoprotein to regulate tissue homeostasis in mammals. Developmental cell 19, 27–38 (2010). [DOI] [PMC free article] [PubMed] [Google Scholar]
- 43.Reginensi A et al. Yap- and Cdc42-dependent nephrogenesis and morphogenesis during mouse kidney development. PLoS Genet 9, e1003380 (2013). [DOI] [PMC free article] [PubMed] [Google Scholar]
- 44.Binder AK et al. Expression of Human NSAID Activated Gene 1 in Mice Leads to Altered Mammary Gland Differentiation and Impaired Lactation. PLoS One 11, e0146518 (2016). [DOI] [PMC free article] [PubMed] [Google Scholar]
- 45.Charbonnier LM et al. Functional Reprogramming of Regulatory T cells in the absence of Foxp3. Nat Immunol (in press) (2019). [DOI] [PMC free article] [PubMed] [Google Scholar]
- 46.Zheng Y et al. Role of conserved non-coding DNA elements in the Foxp3 gene in regulatory T-cell fate. Nature 463, 808–812 (2010). [DOI] [PMC free article] [PubMed] [Google Scholar]
- 47.Povoleri GAM et al. Human retinoic acid-regulated CD161(+) regulatory T cells support wound repair in intestinal mucosa. Nat Immunol 19, 1403–1414 (2018). [DOI] [PMC free article] [PubMed] [Google Scholar]
Associated Data
This section collects any data citations, data availability statements, or supplementary materials included in this article.
Supplementary Materials
Data Availability Statement
The data presented in the manuscript, including de-identified patient results, will be made available to investigators following request to the corresponding author. Any data and materials to be shared will be released via a material transfer agreement. RNA sequencing datasets have been deposited in the Gene Expression Omnibus with the accession code GSE151763.


