Summary
Bone marrow transplantation therapy relies on the life-long regenerative capacity of haematopoietic stem cells (HSCs)1,2. HSCs present a complex variety of regenerative behaviours at the clonal level, but the mechanisms underlying this diversity are still undetermined3–11. Recent advances in single cell RNA sequencing (scRNAseq) have revealed transcriptional differences amongst HSCs, providing a possible explanation for their functional heterogeneity12–17. However, the destructive nature of sequencing assays prevents simultaneous observation of stem cell state and function. To solve this challenge, we implemented expressible lentiviral barcoding, which enabled simultaneous analysis of lineages and transcriptomes from single adult HSCs and their clonal trajectories during long-term bone marrow reconstitution. Differential gene expression analysis between clones with distinct behaviour unveiled an intrinsic molecular signature that characterizes functional long-term repopulating HSCs. Probing this signature through in vivo CRISPR screening, we found the transcription factor Tcf15 to be required, and sufficient, to drive HSC quiescence and long-term self-renewal. In situ, Tcf15 expression labels the most primitive subset of true multipotent HSCs. In conclusion, our work elucidates clone-intrinsic molecular programs associated with functional stem cell heterogeneity, and identifies a mechanism for the maintenance of the self-renewing haematopoietic stem cell state.
Single cell analysis of HSC clones
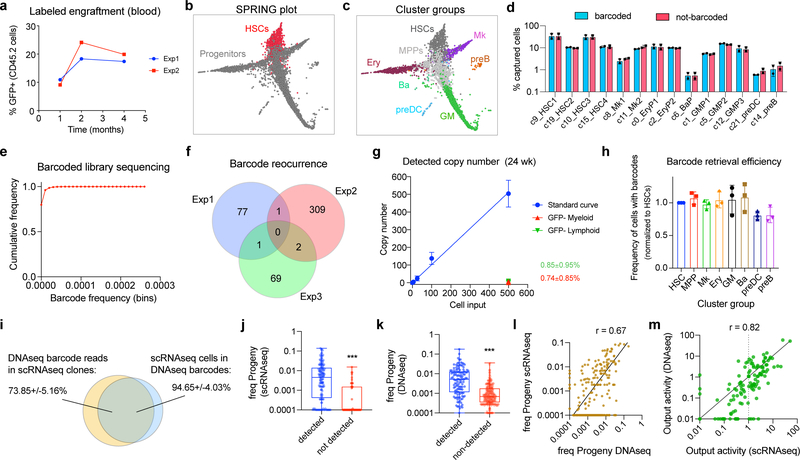
To simultaneously analyze mRNA and lineage information for multiple stem cell clones, we isolated long-term HSCs (LT-HSCs) from 8-wk old mice and transduced them with the Lineage and RNA recoverY (LARRY) lentiviral barcoding library (Fig. 1a)18. We transplanted approximately 1000 labeled cells into lethally-irradiated 8 wk-old recipients and analyzed the haematopoietic stem cell and committed progenitor cell fractions by inDrop single cell RNAseq after steady-state repopulation at 16–24 wk after transplant (Extended Data Fig. 1a, n = 3 experiments, 5 mice). We used Louvain clustering to identify different stem/progenitor populations, and these were labeled and merged on the basis of expression of previously identified markers (Extended Data Fig. 1b–c, see Supplementary Table 1). We then assigned LARRY lentiviral barcodes to each cell to reconstruct clonal relationships. Importantly, we benchmarked LARRY for long-term clonal tracking, confirming that library diversity was adequate for single-cell tracking, that barcode calling was efficient for most populations, that single cell readouts accurately sampled the most abundant barcodes, and that barcode silencing was negligible (Extended Data Fig. 1d–m).
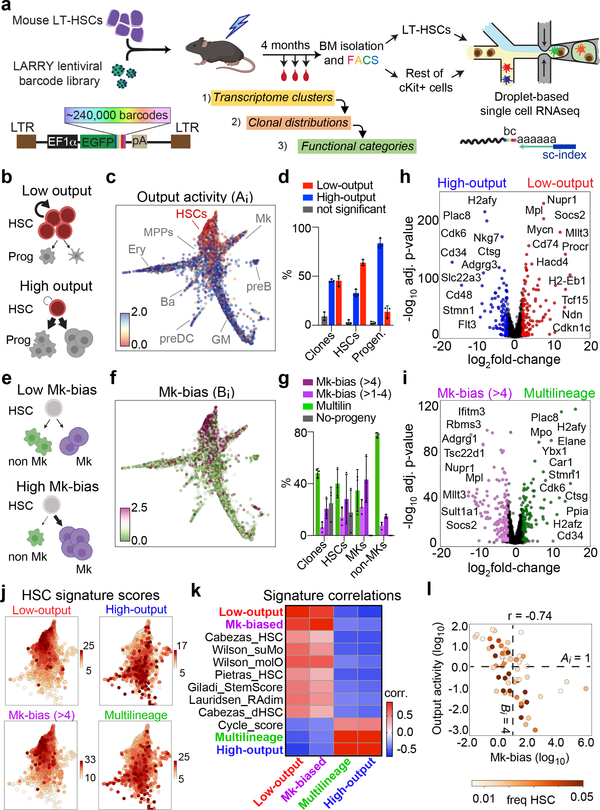
Figure 1. Simultaneous single cell lineage and transcriptome sequencing maps functional HSC heterogeneity.
a, Experimental design for studying HSC heterogeneity with the Lineage and RNA RecoverY (LARRY) lentiviral barcoding library. All panels are representative from n = 3 independent labeling experiments (5 mice). b, Schemes of low-output (top) and high-output (bottom) HSC clones. c, Single cell map showing clonal HSC output activity values. Major cell populations are labeled. d, Distribution of high-output (output activity >1) and low-output (output activity <1) HSC cells and clones (shown as % of total HSCs). Mean ± S.D. e, Schemes of lineage balanced (top) and biased (bottom) HSC clones. f, Single cell map showing clonal Mk-bias values. g, Distribution of Mk-biased and Multilineage HSCs (cells and clones), Mk cells and non-Mk cells (shown as % of total). Mean ± S.D. h, Genes differentially expressed in low-output (right, n = 7254 cells) versus high-output (left, n = 3512 cells) HSCs. Genes with adjusted p-value<0.01 (Benjamini-Hochberg-corrected t-test) and fold-change>2 are colored. Selected genes are labeled. i, Genes differentially expressed in Mk-biased (right, n = 3399 cells) versus Multilineage (left, n = 3771 cells) HSCs. Genes with adjusted p-value<0.01 (Benjamini-Hochberg-corrected t-test) and fold-change>2 are colored. j, Single cell map of HSCs, colored by signature score values. k, Heatmap showing the Pearson correlation between different signature scores across all HSCs (n = 10837). l, Scatter plot of Mk-bias and output activity (log-transformed) for each HSC clone, colored by clone HSC frequency. Dotted lines are the output activity threshold (Ai = 1), and the Mk-bias threshold (Bi = 4). Only clones with HSC frequency > 0.005 are depicted (n = 62).
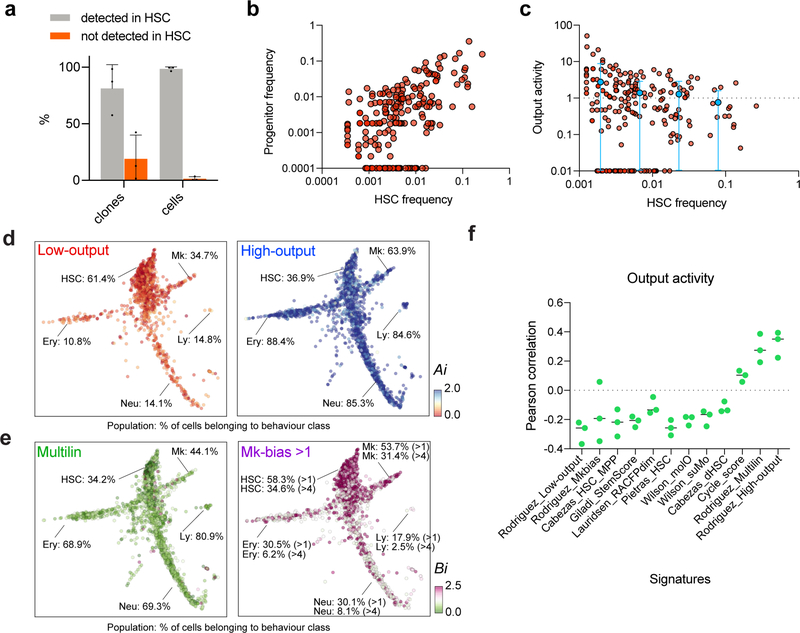
Evaluation of HSC and progenitor barcodes confirmed that transplantation haematopoiesis is sustained predominantly by HSCs, with most progeny represented in at least 1 barcoded HSC, as previously suggested (Extended Data Fig. 2a)3,19–21. This experimental framework allowed us to analyze the functional behaviors of 227 HSCs and their associated gene expression programs. We observed a large degree of clonal heterogeneity in terms of progeny output activity (Ai), defined as the ratio between the abundance of a given clone in the committed progenitor pool and its frequency in the HSC compartment (range: 0–51, mean = 1.66, Fig 1b,c and Extended Data Fig. 2b–c). Remarkably, over 55% of HSC clones (~60% of all HSCs) were categorized as relatively “low-output”, self-renewing significantly more than differentiating (Ai < 1, Fig. 1d and Extended Data Fig. 2d). Importantly, these clones were not simply made of rare small clones, as clones encompassing as many as 588 cells showed this behavior (Extended Data Fig. 2b–c). While previous DNA and retroviral barcoding studies had suggested the existence of low-output clones, our technical approach allowed us to precisely quantify and appreciate the heterogeneity of this behaviour8,11,19,22–25. We also found that HSC clones were highly diverse in their lineage bias (Bi), defined as the ratio between any single lineage and the other progenitors. In particular, we found that ~30% of clones presented Mk-biased output, and were responsible for 50–60% of all Mk progeny (Fig. 1e–g and Extended Data Fig. 2e), in line with previous observations8–10.
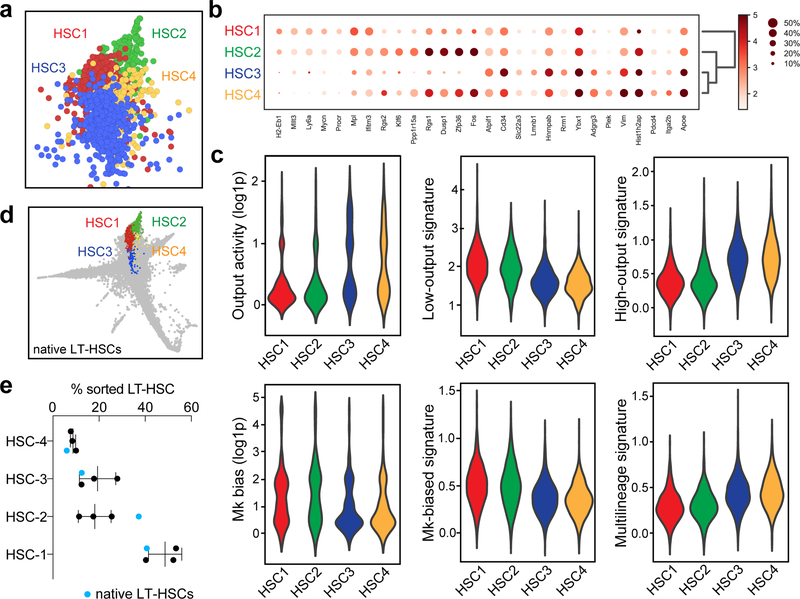
While defining clonal HSC heterogeneity, our approach simultaneously allowed us to characterize differences in gene expression among functionally different clones. Compared to high-output HSCs, low-output HSC clones expressed higher levels of quiescence and self-renewal markers such as Txnip, Mllt3, Socs2, Mpl, Mycn, Cdkn1c and Ndn, in addition to other components poorly described in HSCs, including fatty-acid oxidation enzymes (Hacd4), MHC class II components (Cd74, H2-Eb1), and transcription regulators (Nupr1, Tcf15)(Fig. 1h)26–32. Interestingly, the low-output HSC signature shared multiple genes with the Mk-biased HSC signature (Fig. 1i and Supplementary Table 2). Analysis of computed signature scores confirmed that low-output and Mk-bias genes are co-expressed, and overlap with published signatures of highly purified native LT-HSCs, while they negatively correlate with the cell-cycle signature score, suggesting a relatively quiescent HSC state post-transplantation (Fig. 1j,k and Extended Data Fig. 2f)12,17,33–35. The barcode measurements of HSC output activity (Ai) and Mk-bias (Bi) also presented a significant negative correlation (r=−0.74), confirming that low-output and Mk-biased behaviours are enriched in the same set of clones (p<0.001, Fig. 1l). Importantly, these behaviours were not restricted to distinct HSC subpopulations defined solely by transcriptional clustering methods, highlighting the relevance of clonal tracking for studying HSC heterogeneity (Extended Data Fig. 3a–e, Supplementary Table 3).
Altogether, our data suggest that, even after transplantation, a significant number of engrafted HSC clones display low progeny output (irrespective of their clone size), contribute biasedly to the Mk lineage, and express a distinct HSC signature with hallmarks of increased quiescence and self-renewal. We posit that, after transplantation, a subset of HSCs re-acquire a configuration that resembles non-transplant native LT-HSCs, which are also poorly contributing to mature progeny during the first year of life5 and show predominant Mk lineage contribution8,9,36.
The genetic program of HSC engraftment
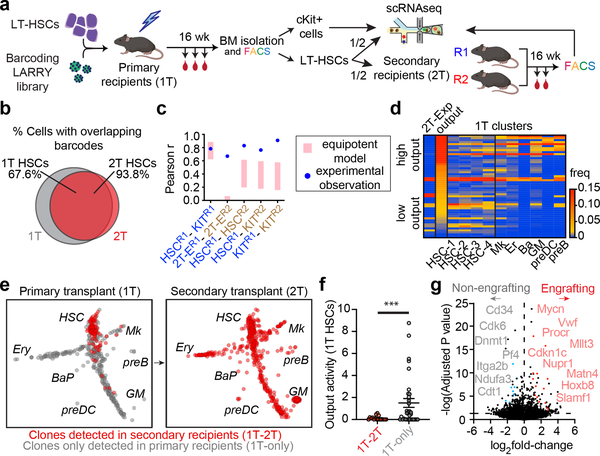
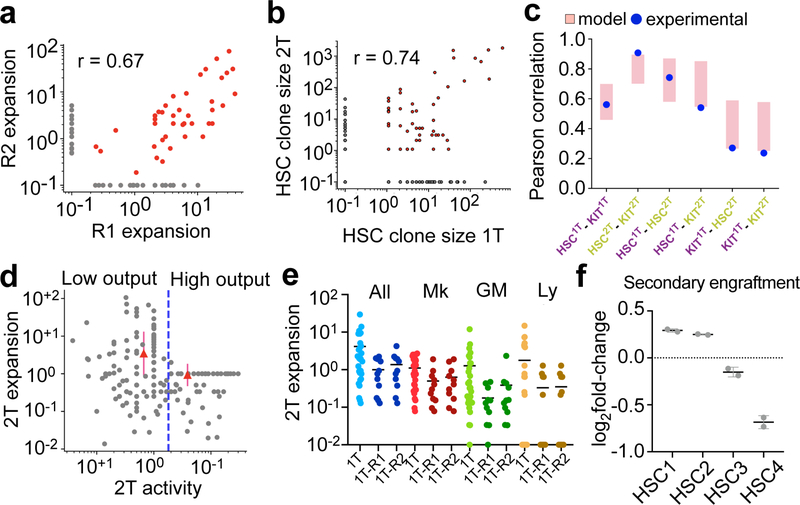
In order to identify clone-intrinsic gene expression programs associated with functional long-term repopulation capacity, we performed secondary transplantations. We repeated our barcoding experiments, sampling only half of the LT-HSC compartment by inDrop at 16 wk (1T clones), while the other half of the HSCs (~3500 barcoded cells) was randomly split into 2 equal parts and transplanted into 2 secondary recipients. These recipients were analyzed 24-wk after transplantation by inDrop (2T clones, 25636 cells) (Fig. 2a–b). We found a strong correlation (r = 0.67) between the secondary engraftment potential (“2T-expansion”) of the same clones in separate secondary recipients (Fig. 2c, Extended Data Fig. 4a), in line with a recent report37. This high correlation seems to be predetermined, at least in part, by size-independent clone-autonomous properties of the primary HSC clone (Fig 2c, Extended Data Fig. 4b,c), when compared to an equipotent null model, in which each HSC is assumed to have equal probability of engrafting (p=0.0013, see Supplementary Methods). Since post-transplant low-output HSCs expressed hallmarks of self-renewal, we hypothesized that the differentiation output of each clone could be negatively impacting its serial transplantation potential. We found that high-output 1T HSC clones were significantly absent in secondary recipients (Fig. 2d–e). Instead, serial transplantation was mainly driven by low-output 1T HSC clones (p = 0.049, compared with the equipotent null model, Fig. 2d–f and Extended Data Fig. 4d), and this observation held true when considering separate lineages or all progeny (Megakaryocytes, Mk, Myeloid, My, or Lymphoid, Ly, Extended Data Fig. 4e). Combined, these results argue that the differentiation history of a clone compromises its long-term repopulating capacity in a clone-autonomous fashion.
Figure 2. A clonal molecular signature of serial repopulation capacity.
a, Experimental design for secondary transplantation experiment. b, Venn diagram showing the clonal overlap between of 1T HSCs (% cells) and 2T HSCs. c, Histogram of pearson correlations between secondary recipient clone measurements (see Supplementary methods). Pink bars show the correlation distribution of the equipotent HSC null model (1 S.D. over 104 calculations). Blue circles represent the observed experimental data. d, Heatmap showing the clonal frequency in 2T and in 1T clusters. The clones are ordered from top to bottom by 1T output activity (scale normalized to plot with the same scale). Only clones represented in at least 5 1T-HSCs are shown. e, SPRING plot of clones in 1T (left), and clones in 2T (right), randomly subsampled for visualization (representative from n = 2 animals). Clones are colored red if they are also detected in 2T (1T-2T clones), and in gray if they are not detected in 2T (1T-only). Populations are labeled. f, Scatter plot showing the output activity (Ai) of 1T-HSC clones comparing 2T-engrafting (red, n = 17) versus non-engrafting (gray, n = 33) clones. Lines represent mean ± S.E.M. *** p = 0.0098 in Kolmogorov-Smirnov (2-sided) test. g, Volcano plot of differential expression analysis of secondary engrafting (n = 773) vs. non-engrafting (n = 591) HSCs. Benjamini-Hochberg-corrected t-test p-values are shown.
Similar to other clonal functional outcomes, serial repopulating behaviour was only modestly enriched in HSC subclusters defined solely by their transcriptome (Extended Data Fig. 4f). In order to extract a gene signature that was indicative of long-term potential, irrespective of clustering or any other parameters, we performed differential expression analysis comparing clones with observed serial repopulation and clones that were not detected in the second grafts. The molecular signature of functional long-term regeneration was characterized by expression of several well-known markers of native quiescent HSCs (Mycn, Procr, Mllt3, Matn4, Hoxb8, Slamf1, Rorc, Cdkn1c)7,16,31,32,38–41, and depleted of expression of cycling/activated HSC and Mk-primed HSC markers (Cd34, Cdk6, Pf4, Itga2b, Gata1)16,42–44, in addition to a large number of genes that are yet undefined in this process (Fig. 2g and Supplementary Table 2). This signature correlated remarkably with the low-output and Mk-biased signatures, and some native LT-HSC signatures previously described (Extended Data Fig. 5a–c and Supplementary Table 2)12,17. Altogether, our results indicate that long-term potency is an intrinsic and heritable property of self-renewing low-output HSC clones, which can propagate through transplantation and is characterized by the maintenance of a unique transcriptional program, with many hallmarks of native and quiescent HSCs.
In situ CRISPR screening of HSC fate
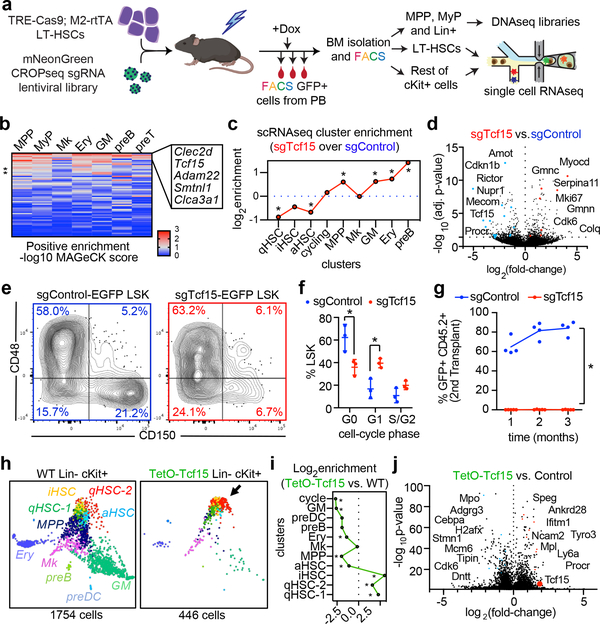
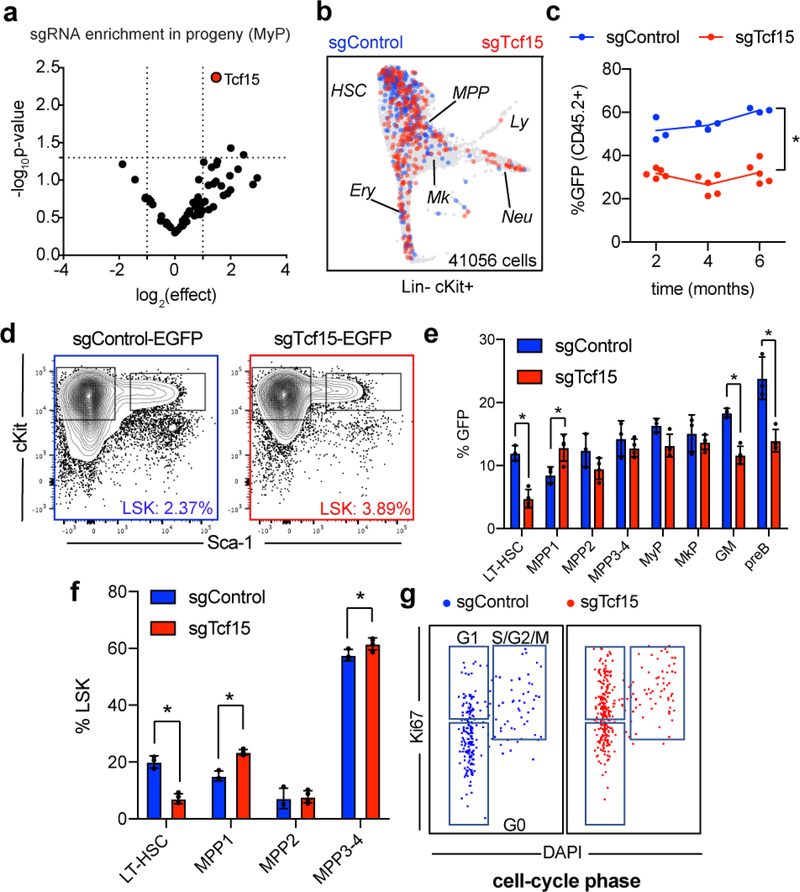
Based on the combined transcriptional signatures of low-output and secondary-repopulating HSC clones, we selected 63 differentially upregulated genes previously uncharacterized in HSCs, to test their requirement for suppressing HSC output (Supplementary Table 4). We performed a Dox-inducible positive-enrichment in vivo CRISPR screening post-reconstitution to identify sgRNAs that increased HSC contribution to mature/progenitor cell fractions (Fig. 3a, Supplementary Table 5)45,46. Deep sequencing revealed 5 targets that were consistently overrepresented in most populations and had the highest positive average enrichment score using MAGeCK analysis: Adam22, Tcf15, Clec2d, Clca3a1, and Smtnl1 (Fig. 3b, Supplementary Table 6)47. We determined that Tcf15 sgRNA had the most robust effect across the 6 biological replicates (Extended Data Fig. 7a). Tcf15 was also the only transcription factor, which suggested a possible master regulatory function in the molecular program that controls HSC output. Tcf15 encodes the protein Paraxis, a transcription factor that is essential for pluripotency exit, somitogenesis and paraxial mesoderm development, but not described in haematopoiesis so far48–50.
Figure 3. In vivo CRISPR screening identifies regulators of HSC output.
a, Experimental design for the steady state CRISPR screening. b, Heatmap showing positive enrichment score for each targeted gene (rows), in each BM compartment (columns). The top 5 genes are labeled. c, Single-cell cluster enrichment of sgTcf15 (log2fold over sgControl). *p<0.1 by differential proportion analysis (DPA) test (nsgTcf15=298, nsgControl=437). For DPA, see methods. d, Volcano plot showing differentially expressed genes comparing sgTcf15 (n=220) vs. sgControl (n=269) HSCs from the scRNAseq experiments. Benjamini-Hochberg-corrected t-test p-values are shown. e, FACS plots showing BM LSK staining for SLAM staining of donor-derived sgControl and sgTcf15 EGFP+ cells. Plots are representative from n=4 independent experiments. f, Quantification of cell cycle status of EGFP+ LSKs. Mean ± S.D. *p<0.005 (n=3, Holm-Sidak-corrected two-sided t-test). g, Quantification of donor engraftment (%EGFP+ of all PB cells) in secondary transplantation. *p<0.005 (n=4, Holm-Sidak-corrected two-sided t-test). h, SPRING single-cell RNAseq map of one representative experiment comparing wild-type (left) vs. Tcf15 overexpressing cKit enriched cells (right). i, Cluster enrichment of TetO-Tcf15 represented as log2fold-enrichment over control. *p<0.1 DPA test (nTetO-Tcf15=440, ncontrol=1752). j, Volcano plot showing differential gene expression of TetO-Tcf15 (n=446) vs. control cKit+ (n=1754) cells. Benjamini-Hochberg-corrected t-test p-values are shown.
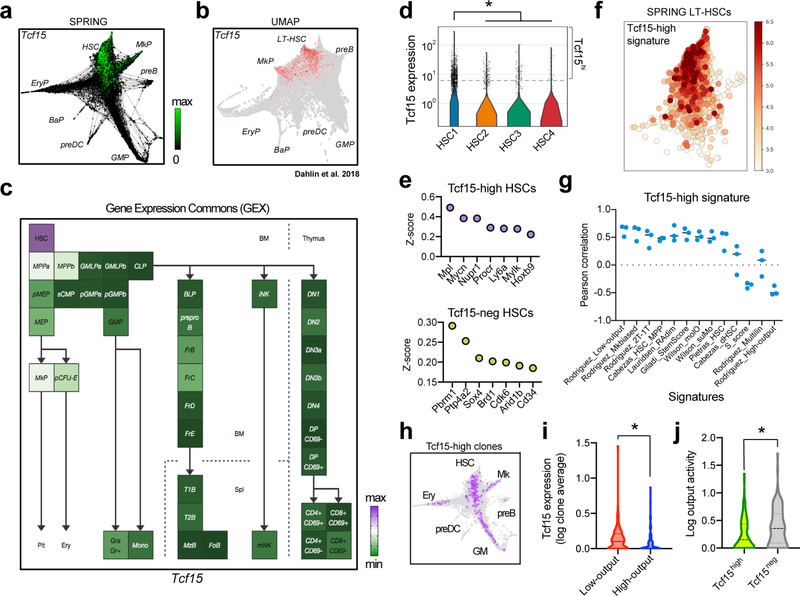
We confirmed that Tcf15 expression is specific to HSCs in ours and previously published datasets (Extended Data Fig. 6a–c)9,14,51. Tcf15 expression correlated with low-output/long-term engraftment HSC signatures (Extended Data Fig. 6d–g). Clonal data showed that Tcf15hi HSCs exhibited significantly lower output activity (Extended Data Fig. 6h–i). Additionally, combined single cell mRNA and sgRNA sequencing revealed that Tcf15 sgRNA clones were partially depleted from quiescent HSC clusters and enriched in committed progenitor clusters (Fig. 3c and Extended Data Fig. 7b). Differential gene expression analysis in Tcf15 sgRNA cells showed reduced expression of Tcf15 (expression: 13% of control, p=0.02), in addition to other quiescent HSC markers (Sult1a1, Procr, Mecom, Cdkn1b/c), and concomitant upregulation of cell-cycle and active HSC hallmarks (Fig. 3d and Supplementary Table 7).
A typical consequence of loss of quiescence is stem cell exhaustion and impaired long-term regenerative capacity52,53. Lentiviral-mediated Tcf15 CRISPR KO partially impaired peripheral blood and BM engraftment in primary transplants (Extended Data Fig. 7c–f). The most noticeable defect was observed in the immunophenotypic LT-HSC gate, suggesting a specific loss of the most quiescent stem cells, which we confirmed by cell-cycle analysis (Fig. 3e–f and Extended Data Fig. 7g). We further validated that disrupting Tcf15 fully abrogates long-term engraftment potential in secondary transplantation (Fig. 3g).
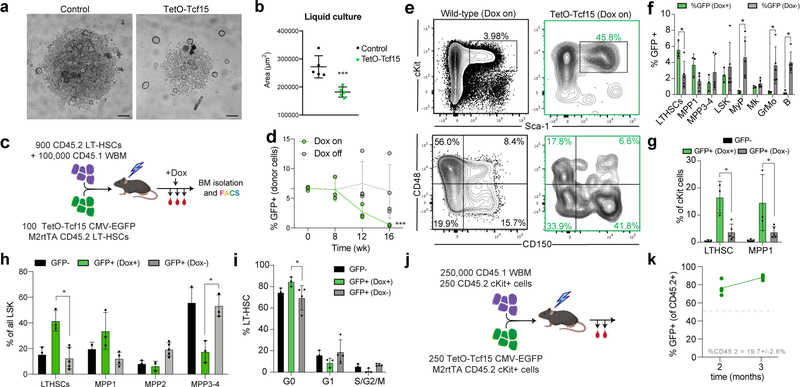
Since Tcf15 is a transcription factor, we hypothesized that inducing Tcf15 expression could be sufficient to enforce quiescence through the upregulation of a Tcf15-driven gene network. Using a lentiviral Dox-inducible Tcf15 transgene, we first observed that Tcf15 overexpression inhibited HSC proliferation in vitro (Extended Data Fig. 8a,b). Similarly, Tcf15 overexpression in stably reconstituted mice led to the inhibition of haematopoietic differentiation (Extended Data Fig. 8c–d). Remarkably, Tcf15-overexpressing cells exhibited a 20.8-fold enrichment in the frequency of LT-HSCs in the BM and a depletion of downstream progenitors (Extended Data Fig. 8e–i). Single cell RNAseq analysis of the cKit+ marrow fraction revealed that Tcf15-overexpressing cells were almost exclusively restricted to the quiescent HSC clusters (Fig. 3h,i). Secondary transplantations demonstrated that Tcf15-overexpressing LT-HSCs could still exhibit long-term repopulation upon suppression of Tcf15 transgene expression by Dox withdrawal (Extended Data Fig. 8j,k). To outline a gene program driven by Tcf15, we compared the single-cell differential gene expression signatures of Tcf15-overexpressing (Fig. 3j, Supplementary Table 8) and Tcf15-depleted HSCs, and found 174 genes with significant symmetrically opposite expression, which were enriched for previously described regulators of HSC quiescence/maintenance, including Cdkn1c, Socs2, Mcl1, and Gata2 (Supplementary Table 9)29,31,54,55. Altogether, these experiments indicate that Tcf15 expression is both required and sufficient to maintain stem cell quiescence, and that Tcf15 is required for the long-term regenerative capacity of HSCs.
Tcf15 defines a hierarchy within LT-HSCs
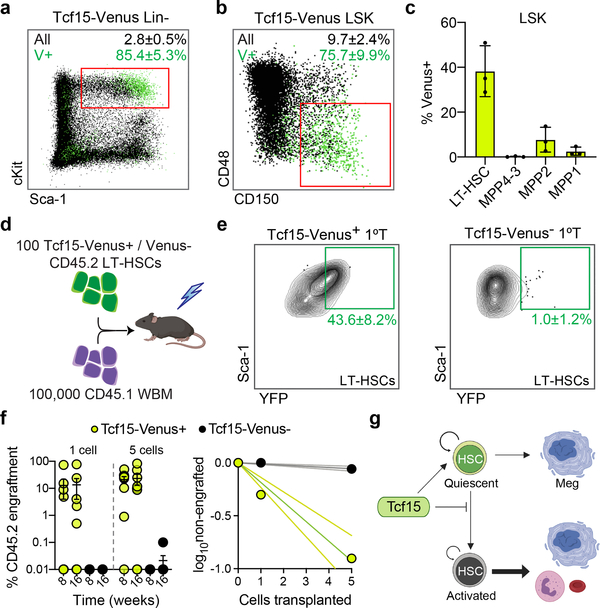
To understand how Tcf15 expression is regulated in the native context, we generated a knock-in reporter mouse, Tcf15-Venus (Extended Data Fig. 9a). Venus fluorescent protein expression was detected in only 0.032% of bone marrow cells and was highly enriched in the LT-HSC compartment, which contained 65.6% of all Lin− Venus+ cells (Fig. 4a,b and Extended Data Fig. 9b–f). However, consistent with scRNAseq analysis, Tcf15 expression within the LT-HSC compartment was markedly heterogeneous, labeling only 38.4% of the cells, and positively correlated with surface receptor levels of EPCR (Procr, r=0.61±0.13) and Sca-1 (Ly6a, r=0.65±0.07), two markers of quiescent LT-HSCs that were also part of the Tcf15hi gene set (Fig. 4c and Extended Data Fig. 9f). To test the functional implications of Tcf15 expression, we separately transplanted Venus+ and Venus− LT-HSCs into irradiated recipients (Fig. 4d). Venus+ cells reconstituted relatively normal blood and bone marrow compartments, and regenerated both Venus+ and Venus− HSCs (Fig. 4e and Extended Data Fig. 9g–o). In contrast, Venus− cells solely gave rise to Venus− cells, displayed relatively impaired primary regeneration, and showed significant loss of secondary repopulation capacity (Fig. 4e and Extended Data Fig. 9g–p). Extreme dilution analysis with single and 5-cell transplantation revealed a frequency of ~1 functional HSC for every 2 cells in the Tcf15+ LT-HSC compartment, whereas virtually no reconstitution activity was observed in the Tcf15− compartment (Fig. 4f). Altogether our analyses indicate that Tcf15 expression defines a hierarchy within HSCs, where it promotes a self-renewing, quiescent Tcf15+ cell state with long-term repopulation potential. We propose a model where upon injury or transplantation, a subset of HSCs loses Tcf15 expression in order to become active and produce progeny (Fig. 4g).
Figure 4. Tcf15 expression defines the functional LT-HSCs.
a, FACS plot of Tcf15-Venus knock-in reporter Lin− cells. Mean±S.D. % of LSKs (red square) of all Lin- (Venus+ vs. all cells) is shown. Plots in (a), (b) and (e) in are representative from n=3 independent experiments with similar results. b, FACS plot of Tcf15-Venus knock-in reporter LSK Venus+ cells stained for SLAM markers. Mean±S.D. % of LT-HSCs (red square) within LSK (Venus+ vs. all cells) is shown. c, Mean±S.D. percentage of Tcf15-Venus expression within each LSK SLAM compartment (n=3). d, Primary competitive transplantation of HSCs derived from Tcf15-Venus reporter (CD45.2) mice. e, FACS plots showing YFP (Venus) vs. Sca-1 intensity of donor-derived LT-HSCs from mice transplanted with 100 Venus+ (left) or Venus− (right) HSCs. Mean±S.D. % of Venus+ LT-HSCs is shown. f, Comparison of transplantation efficiency of single or 5 HSCs (Tcf15-Venus+ or Venus-). Left, mean±S.D. % myeloid CD45.2+ engraftment in recipients (n=8 mice per category). Right, limiting dilution quantification. g, Model. Tcf15 is expressed in a subset of low-output self-renewing HSCs. Upon injury or transplantation, only a subset of these HSCs maintains Tcf15 levels, and restores the reservoir pool of relatively quiescent HSCs (some of which can still produce Meg-lineage cells).
Recent development of simultaneous lineage and mRNA profiling has enabled direct association of cell behaviours with unique gene expression signatures18,56–58. Applied to haematopoietic regeneration, we have uncovered clone-autonomous stem cell behaviours and the molecular mechanisms that regulate them in vivo. We propose that Tcf15 is one of the few HSC-restricted transcription factors that specifically regulates the functional LT-HSC state. Our approach may also be directly adapted to study stem cell quiescence regulators in other regenerative tissues.
Methods
Animal guidelines
All animal procedures followed relevant guidelines and regulations. All protocols and mouse lines were approved and supervised by the Boston Children’s Hospital Institutional Animal Care and Use Committee.
Mice
The TetO-Cas9/M2rtTA mice were a kind gift from Stuart Orkin (and are available from The Jackson Laboratory strain #029476). To induce Cas9 expression, mice were fed with 1mg/ml Dox together with 5mg/ml sucrose in drinking water for the indicated periods of time. Thereafter, Dox was removed. The Tcf15-Venus mice were generated from previously described targeted ES cells50. All other mice were BL/6J strain and obtained from The Jackson Laboratory. Female mice were used as recipients for transplantation. Phlebotomy was performed by retro-orbital sinus peripheral blood collection and analysis (200 ul). Complete blood counts were analyzed with an automated Hemacytometer.
Bone marrow preparation
After euthanasia, whole BM (excluding the cranium) of BL/6J or TetO-Cas9/M2rtTA mice was immediately isolated by flushing and crushing in 2% fetal bovine serum (FBS) phosphate buffered saline (PBS), and erythrocytes were removed with RBC lysis buffer. CD45.1 (CD45.1, B6.SJL-Ptprca Pep3b/BoyJ, stock # 002014, the Jackson Laboratory) mice were used as transplantation recipients for CD45.2 (CD45.2) mice.
Fluorescence activated cell sorting (FACS)
Lineage depletion was performed using Magnetic Assisted Cell Sorting (Miltenyi Biotec) with anti-biotin magnetic beads and the following biotin-conjugated lineage markers: CD3e, CD19, Gr1, Mac1, and Ter119. Cell populations from BM were purified through 4-way sorting using FACSAria (Becton Dickinson) and 6-way sorting using MoFlo XDP (Beckman Coulter). An example of the sorting strategy for InDrop experiments can be found in Extended Data Figure 10. Lineage enrichment was performed using anti-cKit (2B8) magnetic beads (Miltenyi Biotec). The following combinations of cell surface markers were used to define these cell populations: Erythroblasts: Ly6G− CD19− Ter119+ FSChi, Granulocytes: Ly6G+ CD19− Ter119−, Monocytes: Ly6C+ Ly6G− CD19− Ter119−, pro/pre-B cells: Ly6G− CD19+, Megakaryocyte progenitors: Lin- cKit+ Sca1- CD150+ CD41+, LT-HSC (long-term hematopoietic stem cells): Lin− cKit+ Sca1+ CD150+ CD48− MPP1/ST-HSC (multipotent progenitors gate 1/short-term stem cells): Lin− cKit+ Sca1+ CD150− CD48−, MPP2 (multipotent progenitors gate 2): Lin− cKit+ Sca1+ CD150+ CD48+, MPP3/4 (multipotent progenitors gates 3/4): Lin− cKit+ Sca1+ CD150− CD48+. For cell-cycle analysis, isolated cells were fixed in 4% PFA at room temperature for 10 minutes and permeabilized with 0.1% Triton-X100 (Sigma) before intracellular staining with 1 μg/ml DAPI and anti-mouse Ki67 antibody. Flow cytometry data were analyzed with FlowJo (Tree Star). FACS-sorting was performed to obtain the maximal number of available cells from the whole BM extract using purity modes (~98% purity) at ~80% efficiency. Example sorting parameters for LARRY barcoding experiments can be found in Supplementary Figure 1. The list of antibodies can be found in Supplementary Table 13.
Transplantation assays
LT-HSCs from BL/6J (CD45.2) 8 wk-old mice were transplanted in PBS through retro-orbital injection (150 μl per mouse) into CD45.1 recipient mice previously exposed to a lethal gamma radiation dose (2 times 5 Gy with 2h interval). Donor cell engraftment (% CD45.2+ peripheral blood leukocytes) and labeling frequency was analyzed using an LSRII equipment (Becton Dickinson). FACS was performed using a BD Aria Ilu or BD Fusion (custom order) equipped with 5 lasers (UV/Violet/Blue/Yellow-Green/Red).
DNA isolation and amplification
Cells of interest were sorted into 1.7 ml tubes and concentrated into 5–10μl of buffer by low speed centrifugation (700g 5 minutes). Sample DNA was purified by QIAamp DNA Micro kit (56304, Qiagen) and eluted into 10μl elution buffer before PCR processing. Details for the LARRY pooled library amplification protocol are available at Addgene (#140024).
Single-cell RNA sequencing and low-level data processing
Transcriptome barcoding and preparation of libraries for single-cell mRNA-sequencing was performed with inDrops using a 1cellbio device (1cellbio, USA). For our experiment, the EGFP+ Lin- cKit-enriched BM fraction from recipients was labeled and FACS sorted in 4 ways to purify SLAM LT-HSCs (Lin-Sca1+cKit+CD150+CD48-), MPPs (Lin-Sca1+cKit+CD150-), MkP (Lin-Sca1-cKit+CD150+CD41+) and the rest of cKit-enriched cells. All available labeled LT-HSCs are encapsulated in one sample. Then, MPP, MkP and the rest of cKit-enriched cells are pooled at equal quantities to sample HSC progeny (“KIT” cells). LT-HSC and KIT libraries were processed independently. Libraries for all the populations were prepared the same day, with the same stock of primer-gels and RT-mix, to avoid batch effects. InDrop Primer-gels (v3) were purchased from the Harvard Single Cell Core. Libraries were sequenced on an Illumina NextSeq 500 sequencer using a NextSeq High 75 cycle kit, according to InDrop v3 guidelines (Harvard Single Cell Core). Raw sequencing reads were processed using the indrops v0.3 pipeline (github.com/indrops/indrops,59). LARRY sequencing reads were processed using the LARRY v0.1 pipeline (github/allonkleinlab/LARRY). Single cell data was analyzed and visualized using scanpy v1.4.6 (github/theislab/scanpy,60) and SPRING v1.6 (github/allonkleinlab/SPRING_dev,61).
Single-cell encapsulation and library preparation for sequencing
For single-cell RNA sequencing (scSeq), we used the inDrops updated protocol described in (Zilionis et al. 2018)59, with a modification to allow targeted sequencing of the LARRY barcode. In brief, single cells were encapsulated into 3-nl droplets with hydrogel beads carrying barcoding reverse transcription primers. After reverse transcription in droplets, the emulsion was broken and the bulk material was taken through: (i) second strand synthesis; (ii) linear amplification by in vitro transcription (IVT); (iii) amplified RNA fragmentation; (iv) reverse transcription; (v) PCR. To specifically amplify barcode-containing EGFP transcripts, we split the amplified RNA fraction (after step (ii)) and used one half for standard library preparation and the other half for targeted lineage barcode enrichment. To target the barcode, we modified the subsequent steps of library prep by (i) skipping RNA fragmentation; (ii) priming reverse transcription using a transcript specific primer at 10mM (TGAGCAAAGACCCCAACGAG); (iii) introducing an extra PCR step using a targeted primer (8 cycles using Kapa HiFi 2X master mix; Roche; primer sequence = TCG TCG GCA GCG TCA GAT GTG TAT AAG AGA CAG NNN Ntaa ccg ttg cta gga gag acc atat) and 1.2X bead purification (Agencourt AMPure XP). Targeted and non-targeted final libraries were pooled at 1:5 ratio before sequencing.
Read alignment, cell filtering, and counts normalization
FASTQ sequence files were demultiplexed and aligned to the GRCm38 mouse reference genome using the inDrops v0.3 pipeline (https://github.com/indrops/indrops), generating cell-by-gene counts tables for each experiment and condition. Cells were filtered to include only abundant inDrop barcodes on the basis of visual inspection of the histograms of total transcripts per cell (SPRING_dev/data-prep). The data were further filtered to eliminate putatively stressed or dying cells, defined by having >15% of transcripts coming from mitochondrial genes. We used the SCRUBLET algorithm (https://github.com/AllonKleinLab/scrublet62) to inspect putative doublet cells. Cells within each experiment were then normalized (20,000 counts) to have the same total number of transcripts for all subsequent analyses. Filtering and QC parameters (min/max UMIs/cell, median UMIs/cell, normalized UMIs/cell, median genes/cell), are summarized in Supplementary Table 10.
Generation of SPRING plot layouts
We used SPRING for single-cell data visualization61. For all SPRING plots shown, we began with total-counts-normalized gene expression data, filtered for highly variable genes using the SPRING gene filter_genes function (from https://github.com/AllonKleinLab/SPRING_dev/blob/master/data_prep/spring_helper.py using parameters (85, 3, 3)), and further filtered to exclude cell cycle correlated genes – defined as those with correlation R>0.1 to the gene signature defined by Ube2c, Hmgb2, Hmgn2, Tuba1b, Ccnb1, Tubb5, Top2a, and Tubb4b. To plot cells in SPRING, we embedded cells in 50-dimensional PC space, and imported them into SPRING dynamic mode as a k-nearest-neighbor (knn) graph with (k=8). The graph was then allowed to relax in SPRING. To avoid confusion by having many different SPRING plots throughout the manuscript, we reused the single cell coordinates from 2 experiments and mapped all other experiments by allowing each cell to choose its 40 nearest neighbors from the first experiment (approximate nearest neighbors), and then take on the average position of the subset of neighbors that were among the original set.
Single cell clustering
Single cell transcriptomes were clustered using the louvain algorithm, following a current recommendation of best practices 63. This was performed directly with the SPRING command run_clustering.py, which takes the knn graph and uses the networkx package community.best_partition function to return the most stable partition (resolution was maintained as default = 1). Clusters that were not reproducible between biological replicates were excluded from further analyses. For plotting clusters and populations into single cell maps, cells were subsampled randomly without substitution (8000 cells), and plotted top to bottom ordered by clusters (in the following order: ‘8’, ‘11’, ‘15’, ‘19’, ‘9’, ‘10’, ‘2’, ‘0’, ‘3’, ‘4’, ‘7’, ‘6’, ‘1’, ‘5’, ‘12’, ‘21’, ‘14’). Some clusters were low-abundance and not reproducible in independent experiments and these are not shown in these plots (‘13’, ‘16’, ‘17’, ‘18’, ‘20’, ‘22’, ‘23’).
Cluster annotation
HSC and progenitor clusters were annotated semi-manually, by identifying previously described marker genes among the top cluster-enriched genes (ranked gene z-score test comparing each cluster vs. all remaining cells). The full list of cluster markers used are summarized in Supplementary Table 1. HSC clusters were defined by being enriched in the LT-HSC single cell libraries (compared to the progenitor libraries). Differential gene expression between each HSC subcluster and the rest is shown in Supplementary Table 3. Among the four HSC clusters, HSC-1 presented a gene signature that was closest to the native dormant LT-HSC signature and HSC-2 presented a gene signature that suggested an aged/inflammatory state9,12,16,64,65. In contrast, cluster HSC-3 showed a transcriptional program associated with HSC cycling and activation34,42, and cluster HSC-4 was defined by markers of activation and Megakaryocyte-priming66. From the rest of the cKit+ cells, we identified 16 additional clusters containing different progenitor cells, including 3 stable clusters of multipotent progenitors or “MPP”67–69. Progenitor clusters were combined based on the common expression of described lineage markers, such as: Mpo, Prtn3 end Elane for Granulocyte/Monocyte (GM clusters 1, 2 and 3), Car1, Car2 and Klf1 for Erythroid (Ery-1/2), and Pf4, Itga2b, Cd9 and Rap1b for Megakaryocyte progenitors (Mk-1/2). MPP clusters were annotated by being enriched in the progenitor libraries (compared to the LT-HSC libraries) but lacking expression of specific lineage markers as defined.
Differential proportion analysis (DPA)
For statistical test of the differences in cluster proportions, we used the DPA algorithm70. This algorithm returns the probability that an observed distribution of cells among clusters is obtained by random chance, by shuffling the cells across categories 100,000 times to estimate a null distribution. Clusters with a resulting p < 0.1 were considered as significantly differentially enriched between the two conditions.
Cell barcoding with LARRY
The pLARRY vector was constructed by DNA synthesis and Gateway cloning (Vectorbuilder) using a protocol adapted from (Naik, Schumacher et al. 2014) and (Gerrits, Dykstra et al. 2010). The barcoded linker was created by annealing two DNA primers (forward, 5′-CCC CGG ATC CAG ACA TNN NNC TNN NNA CNN NNT CNN NNG TNN NNT GNN NNC ANN NNC ATA TGA GCA ATC CCC ACC CTC CCA CCT AC-3′; reverse, 5′-GTA GGT GGG AGG GTG GGG ATT GCT-3′; IDT DNA). N was a hand mix of 25% A, 25% C, 25% T and 25% G. Primers (10 pmoles of each) were mixed in 50 μl 1× NEB buffer 4 (New England Biolabs). After heating the mixture for 5 minutes at 95°C, the primers were allowed to anneal down to 37°C gradually decreasing temperature (0.5°C/minute). Then, 1U of Klenow DNA polymerase (3’−5’ Exonuclease mutant) and 50 nmoles of dNTPs was added to the mixture and incubated for 2 hours at 37°C. After Klenow inactivation for 20 minutes, the barcoded linker was then digested with a mixture of NdeI and BamHI (New England Biolabs) and ligated into the NdeI-BamHI site of the pLARRY vector at 3:1 ratio. The resulting ligation mix was purified and transformed into 10-beta electroporation ultracompetent E. coli cells (New England Biolabs) and grown overnight on LB plates supplemented with 50 μg/mL ampicillin (Sigma-Aldrich). From 8 plates, ~0.5–1×10⁶ colonies were pooled by flushing plates with LB supplemented with 50 μg/mL ampicillin. After 6h of culture, plasmid DNA was extracted with a Maxiprep endotoxin-free kit (Macherey-Nagel). We amplified and sequenced the LARRY library barcodes in bulk (performed in duplicate, with a barcode overlap of 97.7%) and used these sequencing reactions to build a barcode whitelist using the software suite umi-tools (distance = 5). The whitelist is provided in Supplementary Table 12. The pLARRY vector map and plasmid, as well as a sample of the library are available through Addgene (Pooled library #140024).
LARRY library lentiviral preparation
LARRY-EGFP library and third generation lentivirus components (psPAX2 and pMD2.G) were co-transfected into HEK293X cells using the TRANS-IT 293 kit (Mirus bio). Lentivirus was harvested every 12 hours for 72 hours and concentrated using ultracentrifugation. HEK293X cells were grown in DMEM with 10% fetal bovine serum (FBS) and 1% Penicillin/Streptomycin (GIBCO, Thermofisher scientific). Haematopoietic stem cells (HSCs) were transduced using spin infection (800g for 90 minutes at 30°C) in virus concentrate, cultured at 37°C for 8h and then washed out twice with PBS and resuspended in PBS for transplantation.
Calling of lineage barcodes
To call lineage barcodes, we began with an intermediate output of the indrops pipeline: a list of reads with annotated cell barcode and unique molecular identifier (UMI). From this list, we extracted all (Cell-BC, UMI, lineage-BC) triples that were supported by at least 10 reads, collapsed all Lineage-BC’s within a hamming distance of 4 using a graph-connected-components based algorithm, and carried forward the (Cell-BC, Lineage-BC) pairs supported by 3 or more UMIs. To call clones, we then applied a set of filtering steps: (i) Cells with the exact same barcode were classified as clones; (ii) Pairs of cells in separate sequencing libraries with the same Cell-BC and Lineage-BC were discarded, since statistically these could only arise from instability of the droplet emulsion. These steps have been implemented in a pipeline available online: https://github.com/AllonKleinLab/LARRY. All called barcodes were then verified against the barcode whitelist generated by bulk DNAseq (see Supplementary Table 12). Typically, we successfully retrieved the lineage barcodes from ~75–90% of inDrop GFP+ cells using these parameters. Sorting, filtering and barcode retrieval efficiencies are summarized in Supplementary Table 10. To estimate the quality of our scRNAseq-based barcode calling approach we verified that: 1) barcoded and non-barcoded cells present similar transcriptional cluster distributions (variance across clusters was 4.55%±2.78%), 2) barcode diversity is sufficient for labeling unique cells, and 3) barcode expression is not significantly silenced even after extended periods of time (Extended Data Fig. 1b–f). We also verified that barcode retrieval efficiency per GFP+ cell was similar across populations, with a minor loss of capture efficiency in the preDC and preB clusters (Extended Data Fig. 1g). To further ensure that barcode retrieval by scRNAseq was representative of the “real” barcode pool, we compared our method with a traditional PCR-based amplification from genomic DNA. We amplified the LARRY barcode from 50 ng of genomic DNA isolated from 200,000 Myeloid (Gr1/Mac1+) and 100,000 Lymphoid (CD19+) progenitors, using a nested PCR protocol over three steps with a total of 25 PCR cycles (primers and PCR protocol is indicated in the following link: https://benchling.com/s/seq-F1D5aW7t9lBn3q8oywBg), and sequenced on an Illumina MiSeq. Barcodes were then trimmed, collapsed and compared with the inDrop RNAseq-derived barcodes (using a hamming distance of 4). Analysis revealed that at least ~70% of DNAseq barcodes (largest barcodes overall) were present in the scRNAseq data (Extended Data Fig. 1h–j), and the estimated clone sizes derived from scRNAseq and DNAseq for each clone were positively correlated (r = 0.72, Extended Data Fig. 1k). To further confirm that the low-output activity observed in HSC clones is not due to low barcode sampling efficiency or barcode silencing, we performed a comparison of the relative output calculated from DNAseq and scRNAseq data for the same clones, which revealed a significant positive correlation (r = 0.83, Extended Data Fig. 1l). We could not robustly retrieve Mk barcodes by DNAseq, and therefore our estimation of Mk contribution could not be validated in a similar fashion. However, our estimations fall in line with previous publications using single HSC transplants, using a more sensitive measurement8.
Quantification and classification of HSC clonal behaviors
For each clone, the distribution of cells amongst clusters was used to quantify 3 distinct behaviours. Consider Ni the number of all cells, Ki the number of non-HSC cells and Hi the number of HSC cells, for each clone i. For estimating the clone size, we calculated the relative abundance (frequency) of each clone i:
For quantifying the relative output activity (Ai) of each clone i, we divided the frequency in non-HSC clusters (ki) by the frequency in HSC clusters (hi). We added a pseudocount of 0.0001 in the denominator to avoid division by 0 in clones without progeny.
For finding statistically significant high and low-output clones, we first defined a null hypothesis, assuming no differences in output activity among clones (output = 1). Then, we generated a null hypothesis distribution of Ai values for each clone by sampling 10% the HSCs (expected progenitors), calculating the Ai for each clone and iterating this process over 1000 times. We next generated a similar distribution of our observed values, by bootstrapping 10% of the non-HSCs. Finally, for each clone we compared the two distributions of Ai,obs vs. Ai,exp using a two-sample t-test. Clones with p-values < 0.05 were considered as significantly high or low-output and used for subsequent analyses (on average 94.3% of clones).
For quantifying the Megakaryocyte lineage bias (Bi) for each clone i, we divided the frequency in Mk-clusters (ki,Mk) by the frequency in non-Meg clusters. We added a pseudocount of 0.0001 in the denominator to avoid division by 0 in clones without progeny.
For finding statistically significant Mk-biased clones, we first defined a null hypothesis, assuming no differences in Mk-bias among clones (Bi = 1). Then, we generated a null hypothesis distribution of Bi values for each clone by sampling 10% non-Mk progenitors (expected Mk), calculating the Bi for each clone and iterating this process over 1000 times. We next generated a similar distribution of our observed values, by bootstrapping 10% of the Mk progenitors. Finally, for each clone we compared the distributions of Bi,obs and Bi,exp using a two-sample t-test. Clones with p-values < 0.05 and Bi >1 or Bi >4 were considered as significantly biased and used for subsequent analyses. For calculating signatures, we considered Bi > 4, but quantification of clones with Bi > 1 are also shown in Figure 1j and Supplementary Table 2. For plotting these measurements into single cell maps, cells were subsampled randomly without substitution (8000 cells), and then ordered top to bottom, first by clusters (1–23) and then randomly within each cluster. For the separate plots of high-output and low-output clones in Extended Data Fig. 2d–e, cells were subsampled randomly without substitution (2200 cells), and then ordered (top to bottom) in the same way. The results of all these quantifications are summarized in Supplementary Table 11.
Single cell differential gene expression analysis
Single cell differential gene expression was carried out with scanpy, using the rank_genes_groups function, which performs a t-test with Benjamini-Hochberg correction for multiple testing. The numbers of cells used for each comparison are summarized in each corresponding supplementary table. Symmetrically opposite gene expression analysis of sgTcf15 and TetO-Tcf15 HSCs was performed by multiplying the scores of each differentially expressed gene (ranksgTcf15 x rankTetO-Tcf15), selecting all results with negative sign (those expressed in opposite directions) and then further filtering those downregulated in sgTcf15, with the assumption that these genes are regulated positively by Tcf15 transcription factor activity. The resulting list was analyzed using Toppgene for gene ontology analysis and is shown in Supplementary Table 9.
Gene signature scores
Scores for gene signatures were generated with the scanpy score_genes function, with default options. Selected genes to build each score were the top differentially enriched genes (adj. p-value < 0.05) after ranking by combined score. These genes are indicated in Supplementary Table 2. A similar approach was taken for computing previously published stem cell signatures. For the Wilson et al. MolO and suMo signatures and Giladi et al. StemScore signatures were used as described in their respective publications. For the Pietras et al. HSC signature, we used the top 1000 genes with adjusted p-value <0.05. For the Cabezas-Wallscheid et al. 2014 (HSC) and 2017 (dHSC) signatures, we used all the genes with adjusted p-value <0.05 (273 and 787 genes respectively). For the Lauridsen et al. RA-CFPdim HSCs, we used the genes with adjusted p-value <0.05. Signature gene lists from these publications are shown in Supplementary Table 2. For plotting these signature scores into single cell maps, cells were plotted ordered by signature score (highest score on top).
Secondary transplantation of barcoded HSCs
EGFP+ immunophenotypic HSCs from barcoded primary transplants (~7500 cells) were isolated by FACS in 2%FBS-supplemented phosphate-buffered saline (PBS) and split randomly at equal proportions into 2 microcentrifuge tubes. Cells from one tube were prepared and analyzed using inDrops as previously indicated. The HSCs from the remaining tube were spun down, resuspended in 300 μl PBS and injected retroorbitally into 2 lethally irradiated CD45.1 BL6 mice (secondary recipients). Secondary recipients were analyzed (100 ul retroorbital blood) to verify engraftment after 2 and 4 months. After 4 months, secondary recipients were euthanized and all LT-HSCs were purified similar to the primary transplants and analyzed by inDrops independently. For each recipient, a fraction of the cKit+ progenitors was also analyzed by inDrops to determine the contribution of clones to differentiated blood lineages. The pipeline to analyze secondary transplant data is available at https://github.com/AllonKleinLab/StemCellTransplantationModel and a more extensive description of mathematical methods and results can be found in Supplementary Methods.
CROP-seq CRISPR screening
To select the candidate genes, we ranked all genes expressed by low-output HSC clones, excluded those that were not specific to the LT-HSC compartment, and then further excluded most genes previously described to have a role in HSC maintenance, to focus on novel discoveries (Supplementary Table 4). This selection allowed us to focus on discovering new candidates of steady state stem cell quiescence. We included 2 genes, that have been described to have an HSC activation (loss of quiescence) phenotype upon KO (Ptger4 and Tsc22d1) as putative positive controls. The final sgRNA library (carrying 3 sgRNAs per each candidate, and 5 control sgRNAs, Supplementary Table 5) was cloned into a custom-made CROPseq-mNeonGreen vector using the published protocol in http://crop-seq.computational-epigenetics.org.
We isolated TetO-Cas9;M2rtTA LT-HSCs and transduced them with the library (MOI = 0.3) for 8h. We then transplanted the cells into 6 separate recipients (in two independent experiments), waited until steady state reconstitution (16 wk) and added Dox in drinking water for up to 2 months. We analyzed the blood of recipients before and after dox addition, and sort-purified different BM populations for deep sgRNA sequencing at the end point. Finally, we used inDrop to encapsulate all the available LT-HSCs (18630 cells), and a fraction of the remaining cKit+ cells (22426 cells) to sample different progenitors. To sequence the sgRNAs, we followed the published protocol in Datlinger et al.45, adapting it to inDrop sequencing primers by adding the inDrop adapters for inDrop multiplexing and mixing, as performed for the LARRY barcode, and modifying the LARRY barcode calling pipeline. CropSeq sgRNA bulk sequencing from DNA was also performed as indicated in Datlinger et al.45, using up to 10 ng of DNA purified from sorted immunophenotypic gates, or 10 ng of lentiviral plasmid library maxiprep. Libraries were indexed using TruSeq Illumina primers and sequenced on Illumina NextSeq 500. Sequences were demultiplexed and aligned to a custom bowtie index containing the sgRNA sequences for the whole library. Reads were then mapped using bowtie, sorted, counted and normalized to 1,000,000 counts per index. Bulk sgRNA sequence enrichment was performed using MAGeCK47.
Statistical methods
Statistical analysis tests, parameters and results are described in each corresponding figure, with details in specific sections of methods, as indicated. The description of statistical and mathematical methods for data analysis of secondary transplantations is included in the Supplementary Information (Supplementary Methods).
Extended Data
Extended Data Figure 1. Controls and validation of the approach.
a, Comparison of peripheral blood engraftment for barcode-expressing cells (EGFP+) in two representative experiments. b, Merged cluster labeling of the dataset, indicating the localization of HSCs (pink) and Progenitors (gray) in the single cell map plotted using SPRING. c, Merged cluster labeling, indicating the localization of Erythroid (Ery), Basophil (Ba), Dendritic cell (preDC), Granulocyte-Monocyte (GM), B-cell (preB) and Megakaryocyte (Mk) progenitors. d, Cluster distribution comparison of barcoded (blue) and non-barcoded (red) cells. Mean±S.D. % of cells assigned to each cluster (n=2 independent experiments). e, Barcode library diversity estimation, showing cumulative barcode frequency at different barcode abundances (binned). 96% of the library is represented by barcodes with a freq < 0.00001. f, Barcode library diversity estimation, showing the barcode overlap between independent experiments. Average overlap is 1.3%. g, Barcode silencing estimation, showing the % of barcodes detected in the genomic DNA of EGFP-negative cells by quantitative PCR. A calibration curve using sorted numbers of EGFP-positive cells is shown in blue. Mean±S.D. of n = 3 independent animals are shown. Lines represent linear regression from the data. h, Differences in barcode detection efficiency. The histogram represents the proportion of barcoded cells in each population as detected by scRNAseq (HSCs, MPP, Mk, GM, Ery, Ba, preDC and preB). Data shown are mean±S.D. from 3 independent experiments. The data are shown normalized by the proportion of barcoded HSCs (72.3%±5.5%). The mean efficiency drops for the preDC and preB populations, but it is not significant (paired two-sided t-tests, p=0.07, p=0.17). i, Mean ± S.D. % of shared DNAseq reads and scRNAseq cells across barcodes in progenitors (n=3 independent experiments). j, Distribution of progeny frequencies for all clones (quantified by scRNAseq), and labeled according to their presence or absence in DNAseq barcodes. Box plot shows median and interquartile range. Error bars are min/max values. *** p<0.01 two-sided t-test (ndetected=137, nnot-detected=50). k, Distribution of progeny frequencies for all barcodes (quantified by DNAseq), and labeled according to their presence or absence in scRNAseq-recovered barcodes. Box plot shows median and interquartile range. Error bars are min/max values. *** p<0.01 two-sided t-test (ndetected=127, nnot-detected=286). l, Correlation of DNAseq and RNAseq barcode frequencies (n=429). Pearson correlation (r) is shown. Line represents simple linear regression of the data. A pseudocount of 0.0001 is used for plotting clones undetected in either set. m, Correlation of DNAseq and RNAseq measurements of HSC output activity for all HSC clones (n=136). Pearson correlation (r) is shown. Line represents simple linear regression of the data. A pseudocount of 0.01 is used to plot clones with output = 0.
Extended Data Figure 2. Description of HSC heterogeneity according to their output activity and clone size.
a, Histogram showing % of cells (right) and % of clones (left) in progenitors that are not detected in HSCs (n=3 independent experiments). Whereas some clones are not detected in HSCs (orange bar, left), these are typically single cell clones and minimally contribute to progenitor cellularity (orange bar, right). pclones = 0.022 and pcells < 0.001. Holm-Sidak multiple-test corrected t-test. b, Scatter plot showing correlation between HSC clone size, hi (expressed as fraction of total HSCs in each experiment), and clonal output activity, ki (fraction of total progenitors), for each detected clone (data is pooled from 5 mice). Pearson correlation r = 0.59 (n=226 clones, from all 3 independent experiments). A pseudocount of 0.0001 is used for progeny frequency to display the zeros (clones with no output). c, Scatter plot showing HSC clone sizes and their range of differentiated output activity. Pearson correlation r = −0.097 (slope non-significantly different than zero, p=0.1449, n=226 clones). A pseudocount of 0.01 is used for output activity to display clones for which progeny is not detected. The binned average and range are shown in blue (HSC frequency bins are [0.0001–0.005], n=127, [0.005–0.01], n=33, [0.01–0.05], n=52 [0.05–1], n=14). d, Single cell maps showing the clonal HSC output activity values for each single cell. Low-output clones are shown on the left and high-output clones are shown on the right. For each population (HSCs, Mk, Ery, Ly and Neu), the percentage of cells that belongs to clones of the indicated behavior class is shown. Scale range, 0 (red) to 2 or more (blue). Plotted single cells are randomly subsampled (n=2000) without replacement. e, Single cell maps showing the clonal HSC Mk-bias values for each single cell. Non-biased multilineage clones are shown on the left and Mk-biased (bias>1) clones are shown on the right. For each population (HSCs, Mk, Ery, Ly and Neu), the percentage of cells that belongs to clones of the indicated behavior class is shown. Scale range, 0 (green) to 2.5 or more (pink). Plotted single cells are randomly subsampled (n=2000) without replacement. f, Pearson correlation between the output activity and the average signature score of each clone, for different computed signatures as in Figure 1. Black bars indicate mean of 3 independent experiments.
Extended Data Figure 3. Description of HSC subclusters.
a, SPRING plot showing the localization of the four reproducible HSC subclusters, HSC1–4. The plot is representative of one of three experiments with similar results. b, Marker gene expression for HSC subclusters. c, Violin plots showing the values for output activity, Mk-bias, and the scores of different HSC behaviour signatures. Violin plots show all the data (min-to-max) and are representative from one of 3 independent experiments (nHSC1=2206, nHSC2=577, nHSC3=1794, nHSC4=649). DPA results (p-values) are indicated for each HSC cluster in order from HSC1 to HSC4. Low-output: 0.0023, 0.0051, <0.0001, 0.0114. High-output: <0.0001, 0.3883, <0.0001, 0.0006. Mk-bias: 0.0002, 0.0172, 0.0516, 0.0182. Multilineage: 0.2257, 0.0763, 0.4374, 0.1977. d, SPRING plot showing distribution of native LT-HSCs (n=1) mapped by approximate nearest neighbors (see Methods). e, Cluster distribution of native LT-HSCs (blue dots) compared to transplant HSCs (black dots). Mean±S.D., n=3. Chi-square test (transplant HSCs vs. native LT-HSCs), pexp1=10−8, p exp2=0.0007, p exp3=0.0483.
Extended Data Figure 4. Additional data for validation of the null-equipotent HSC model.
a, Scatter plot showing the Pearson correlation between expansion of HSC clones in each secondary recipient (R1 and R2, n=133 clones). b, Scatter plot showing the Pearson correlation between HSC clone size in primary and secondary recipients (n=485 clones). The gray dots are clones only detected in either primary or secondary recipients, using pseudocount of 0.1 to plot in logarithmic scale. c, Histogram depicting the values for clone size correlations between the designated populations. The experimental data is shown in blue, and the data (range) from the null equipotent model is shown in pink (1σ). d, Scatter plot of relative HSC output activity in the primary transplant (1T output) vs. clone expansion in secondary recipients (2T expansion). Clonal expansion (2T/1T clone size) is used, instead of absolute clone size, to account for the effect of 1T clone size on the estimation of engraftment capacity. To avoid numerical divergence, pseudocount = 1 is added before taking the ratio. High-output clones are top 40% clones ranked by their 1T activities, and the remaining 60% are classified as low-output clones. Red triangles show the mean±S.D. 2T expansion for each category (n=485 clones, combined from both recipients). e, Scatter plot showing relative 1T output activity across different lineages for all 1T clones and secondary engrafting clones (R1 and R2 shown separately). Bar indicates mean output value. f, Fold-change in the HSC cluster distribution showing the enrichment of secondary transplantation capacity in HSC-1/2/3/4 subclusters. Bars indicate mean±S.D. (n=2). Chi-square test p = 0.009 (observed vs. expected distribution). See data availability statement for source data of secondary transplantation assays.
Extended Data Figure 5. Comparison of LT-HSC signatures.
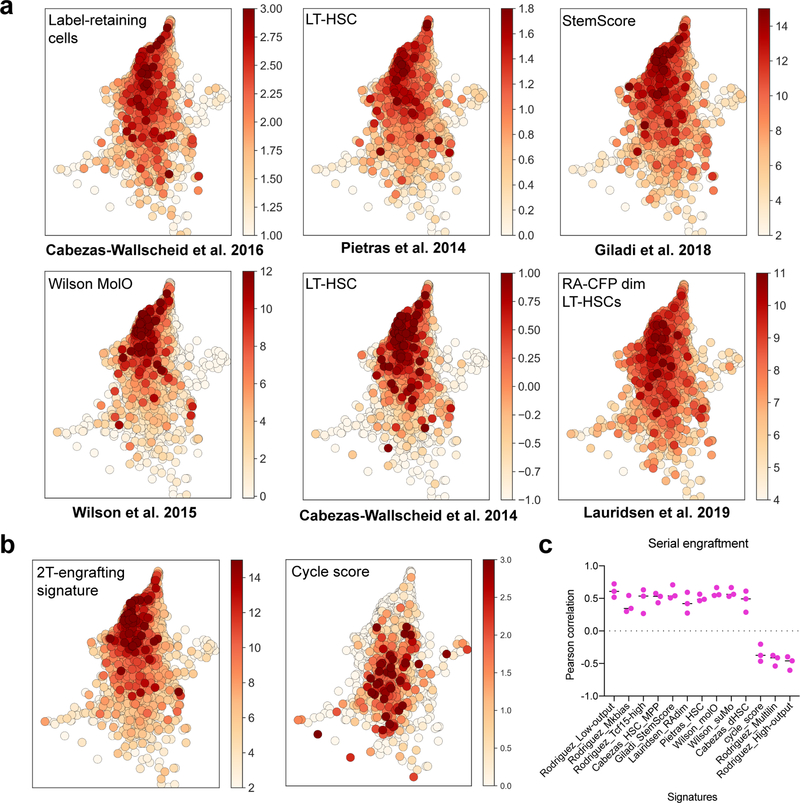
a, Single cell plots of transplanted and barcoded HSCs showing the scores of previously published HSC signatures. Pietras et al. 2014 HSC signature is derived from comparison of Flt3-CD48-CD150+ LSKs (HSCs) versus all other progenitor populations. Lauridsen et al. 2019 dormant HSC (dHSC) signature is derived from comparison of RA-CFPdim HSCs, which are enriched in quiescent HSCs, versus RA-CFPpositive HSCs, which are enriched in cycling HSCs. Giladi et al. 2018 StemScore is derived from single cell data analysis of genes correlating with Hlf expression in naive HSCs. Wilson et al. 2015 MolO signature is derived from single cell expression data of index-sorted LT-HSCs. Cabezas-Wallscheid et al. 2017 label-retaining HSC signature is derived all HSC genes significantly upregulated in H2B-GFPhi label-retaining HSCs, compared to H2B-GFPlow. b, Single cell plot showing the 2T-engrafting signature score, derived from the comparison of serially repopulating HSC clones and non-serially repopulating clones (Figure 2). c, Pearson correlation between the 2T-engraftment long-term repopulating signature score and the indicated HSC signature scores. Low-output, high-output, Mk-biased and Multilineage signature scores are derived from the analyses shown in Figure 1. Black bars indicate mean of 3 independent experiments.
Extended Data Figure 6. Tcf15 expression is restricted to HSCs, and it is highest in the low-output clones.
a, Localization of expression of Tcf15 along the single cell manifold using SPRING. Major cluster groups are labeled. The plot shows cells from one of 3 experiments with similar results (n=16976 cells). b, Localization of expression of Tcf15 along the single cell manifold in the Dahlin et al. 2018 dataset using Scanpy (n=44802 cells pooled from 6 animals). Major cluster groups are labeled. c, Localization of Tcf15 expression along the bone marrow FACS-pure populations in Gene Expression Commons. d, Expression levels of Tcf15 in the different HSC subclusters. Violin plots show all the data (min-to-max). The scale (width) of the violin plot is adjusted to show the same total area for each subcluster (nHSC1=10815, nHSC2=2265, nHSC3=2867, nHSC4=900). Tcf15 expression scale is log (normalized UMI). DPA results (p-values) testing enrichment of Tcf15hi (>5 UMI) cells across each HSC cluster are, in order, from cluster HSC1 to HSC4: <0.0001, 0.4843, <0.0001, 0.0009. * indicates enrichment in HSC1. e, Selected genes enriched in Tcf15hi HSCs and Tcf15neg HSCs. f, Single cell plot of the Tcf15hi signature score, using genes enriched in Tcf15-expressing cells (z-score > 0.3). g, Pearson correlation between the Tcf15hi signature score and the indicated HSC signature scores. Bars indicate average of n=3 independent experiments. Low-output, high-output, Mk-biased and Multilineage signature scores are derived from the analyses shown in Figure 1. h, SPRING plots showing distribution of Tcf15hi HSC clones and their progeny (purple) compared to the rest of HSCs (light gray) in primary transplants. Major cluster groups are labeled. Cells shown are from a representative experiment of 3 independent experiments with similar results (n=16976 cells). i, Violin plot showing the average distribution of Tcf15 expression levels in low-output (n=123) versus high-output (n=101) HSC clones taken from 3 independent experiments with similar results. Violin plot shows all data, with median (dashed line) and quartiles (dotted lines). *p=0.0165 (two-sided unpaired t-test). j, Violin plot showing the distribution of relative output activity in Tcf15hi (n=95) versus Tcf15neg (n=129) HSC clones. Violin plot shows all data, with median (dashed line) and quartiles (dotted lines). *p=0.0015 (two-sided unpaired t-test).
Extended Data Figure 7. Additional measurements on Tcf15 requirement for HSC quiescence.
a, Volcano-plot showing the multiple comparison-corrected (Bonferroni) unique t-test for each gene in a representative population (LS−K+CD41−, Myeloid progenitors). Two-sided test, n = 6 independent mice. b, SPRING plot localization of sgControl vs. sgTcf15 cells using inDrop. Identified branches are labeled by marker gene expression. Plot is representative from one of n = 2 independent single-cell experiments (each experiment from 3 mice combined). c, Quantification of PB engraftment as %EGFP+ cells (of all CD45.2+), comparing sgControl (blue) and sgTcf15 (red) donor cells. *p=0.0017 (two-sided unpaired t-test, nsgControl=4 and nsgTcf15=5 animals). Lines indicate mean per group. d, FACS plots showing Lin- cKit-enriched BM staining for LSKs in primary recipients. Only EGFP+ cells are shown in the plots. Plots are taken from representative one animal per group from n=3 experiments. e, Quantification of bone-marrow engraftment as Mean ± S.D. %EGFP+ cells (of all BM) in each designated compartment. *significant discoveries. pLT-HSC<0.0001, pMPP1=0.0237, pMPP2=0.1427, pMPP3/4=0.5190, pMyP=0.1206, pMkP=0.5190, pGM=0.0002, ppreB<0.0001 (two-sided Holm-Sidak multiple-corrected t-test, n=3). f, Phenotype quantification as Mean ± S.D. % of donor LSKs in primary recipients corresponding to each SLAM gate (LT-HSC, MPP1, MPP2, MPP3/4). *significant p-value pLT-HSC<0.0001, pMPP1=0.0001, pMPP2=0.7152, pMPP3/4=0.0428 (two-sided Holm-Sidak multiple-corrected t-test, n=3). g, FACS scatter plots of sgControl and sgTcf15 EGFP+ LSKs, stained with DAPI and Ki-67 to evaluate cell cycle status. Plots are taken from representative one animal per group taken from 3 independent experiments.
Extended Data Figure 8. Additional data on Tcf15 sufficiency for HSC quiescence.
a, Micrographs of liquid cultures of control TetO-Tcf15 cells. LT-HSCs (1000 cells) from M2rtTA mice were transduced with GFP-carrying lentiviral vectors expressing either a control sgRNA or TetO-Tcf15. Cells were sorted immediately into 1 μg/ml Dox-supplemented STEMspan + SCF/Flt3L/TPO and cultured for 7 days. Images are representative of 5 independent experiments with similar results. b, Quantification of liquid culture cellularity by measuring the area of the liquid colonies from 5 independent experiments. Mean ± S.D. is indicated. Control HSC cultures are shown in black, and TetO-Tcf15 HSC cultures are shown in green. *p<0.0001 (unpaired two-sided t-test). c, Experimental setup to evaluate the effect of Tcf15 overexpression. d, Quantification of TetO-Tcf15 EGFP+ cells in peripheral blood. Time-point 0 reflects the lentiviral transduction efficiency evaluated from a remainder of non-transplanted cultured HSCs. Untreated (Dox-) controls (n=5) were compared with Dox-treated (Dox+) mice (n=5). Line represents mean. Arrow indicates time point of Dox addition in the Dox-treated mice. *** Two-way ANOVA test (genotype x time-factor) p = 0.0127. e, FACS contour plots of Dox-treated TetO-Tcf15 BM cells at 16 wk. Left panels show Lin- EGFP- control cells. Right panels show Lin- EGFP+ TetO-Tcf15 cells. Plots are representative from 3 independent experiments. f, Fraction of TetO-Tcf15 EGFP+ cells in different BM populations at 16wk (nDox−=5, nDox+=3). Mean ± S.D. *two-sided unpaired t-test. P-values are pLT-HSC = 0.0144, pMyP=0.0010, pGM=0.0091, ppreB=0.0032. g, Quantification of % of all Lin- EGFP+ cells that belong to the LT-HSC or MPP1(ST-HSC) fraction (nDox−=5, nDox+=3). Mean ± S.D. *two-sided unpaired Holm-Sidak-corrected multiple comparisons t-test. P-values are pLT-HSC = 0.0062, and pMPP1 = 0.0157. h, Quantification of LT-HSC, MPP1, MPP2 and MPP3/4 as % of all donor LSK, comparing EGFP+ (treated and untreated) and EGFP- cells (nDox−=5, nDox+=3). Mean ± S.D. *two-sided unpaired Holm-Sidak-corrected multiple comparisons t-test. P-values are pLT-HSC = 0.0042, and pMPP3–4= 0.0001. i, Quantification of cell cycle phase (G0, G1, G2/M) in LT-HSCs, comparing donor EGFP+ (Dox-treated and untreated) and EGFP- cells (nDox−=5, nDox+=3). Mean ± S.D. *two-sided unpaired Holm-Sidak-corrected multiple comparisons t-test, pG0 = 0.0148, pG1 = 0.1127, pG2/S/M = 0.4815. j, Competitive secondary transplantation of cKit cells derived from Dox-supplemented TetO-Tcf15 mice. EGFP+ cKit+ cells were FACS-purified from Dox-treated primary recipients from experiment in Figure 6A. These cells were transplanted competitively against the same number of cKit cells isolated from a CD45.2+ wild-type donor (same gate), with an additional 250,000 of CD45.1 nucleated whole bone marrow cells (WBM). k, Quantification of EGFP+ CD45.2+ secondary engraftment showing higher repopulation from TetO-Tcf15 cKit+ cells (EGFP positive), which outcompete WT cKit+ cells (EGFP negative). Line represents mean (n=4 independent experiments). One-way t-test (vs. null hypothesis of 50% engraftment) p=10−202.
Extended Data Figure 9. Additional data on Tcf15-Venus knock-in mouse model.
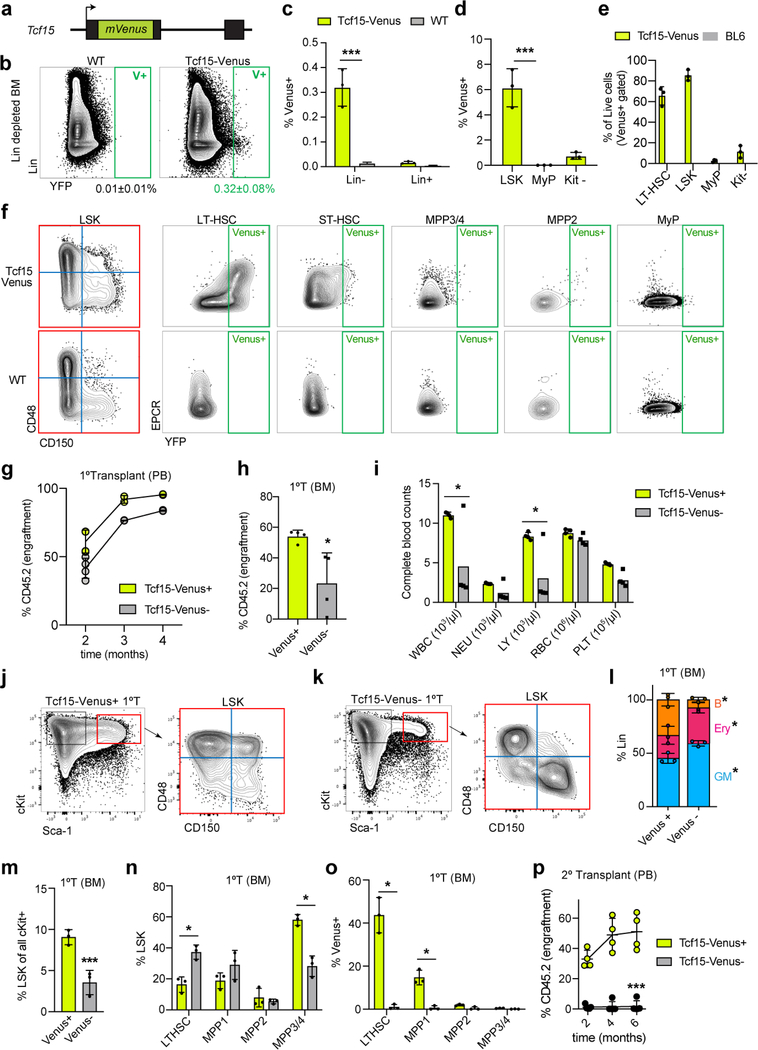
a, Tcf15-Venus knock-in mouse allele. The open-reading frame of monomeric Venus fluorescent protein is knocked-in replacing the start codon in the first exon of the Tcf15 locus. b, FACS plot of Tcf15-Venus knock-in mouse reporter bone marrow, stained with Lineage markers. Bone marrow from a wild-type BL/6J mouse is used as a negative control. The YFP channel was used to detect expression of Venus fluorescent protein. Plots are representative of 3 independent experiments with similar results. c, Quantification of %Venus+ cells in Lin- vs. Lin+ bone marrow, comparing Tcf15-Venus reporter and negative control mice (n=3). Mean ± S.D. ***Holm-Sidak-corrected multiple comparison two-sided t-test p=0.0243. d, Quantification of %Venus+ cells in Lin-Sca1+cKit+ (LSK), Lin-Sca1-cKit+ (MyP) and Lin-Sca1-cKit- (Kit-). Mean ± S.D. ***unpaired two-sided t-test, p=0.0021 (n=3). e, Quantification of distribution of Lin− Venus+ cells from Tcf15-Venus knock-in reporter bone marrow (measured as % Live Lin−). BL/6J bone marrow cells are shown for comparison, as negative controls. Mean ± S.D. (n=3). f, FACS plot of Tcf15-Venus knock-in reporter LSK cells, stained for LSK SLAM markers to show YFP (Venus) expression in different SLAM compartments. BL/6J bone marrow LSK cells are used as a negative control. Plots shown are representative of 3 independent experiments with similar results. g, Donor engraftment in primary competitive transplantation, measured as % of PB CD45.2+ leukocytes. Bars indicate mean ± S.D. (n=4). h, Engraftment in BM, measured as total CD45.2+ cells at 3–4 months post transplantation. Mean ± S.D. (n=4). *Holm-Sidak-corrected multiple comparison unpaired two-sided t-test, p=0.0223. i, Automated peripheral blood counts of mice reconstituted with Venus+ or Venus- HSCs. The scale is shared for all measurements, but the units are indicated for each population after the labels. *Holm-Sidak-corrected multiple comparison two-sided t-test pWBC=0.0006, pLY=0.0056. j, FACS plots showing bone marrow Lin− analysis of primary recipients transplanted with Venus+ HSCs. Left panels show cKit vs. Sca1 staining of all cKit+ cells. Right panel shows SLAM (CD48, CD150) staining of LSK cells. Plots shown are representative of 3 independent experiments with similar results. k, FACS plots showing bone marrow Lin− analysis of primary recipients transplanted with Venus− HSCs. Left panels show cKit vs. Sca1 staining of all cKit+ cells. Right panel shows SLAM (CD48, CD150) staining of LSK cells. Plots shown are representative of 3 independent experiments with similar results. l, Quantification of % of BM Myeloid (GM, Gr-1+), Lymphoid (B, CD19+) and Erythroid (Ery, Ter119+) cells from Venus+ vs. Venus− primary recipients. Mean ± S.D. (n=3). *Holm-Sidak corrected multiple comparison two-sided t-test. pB=0.0002, pEry=0.0166, pGM=0.0125. m, Quantification of FACS gate in (J, left panels) showing % of all cKit cells that are LSK. Mean ± S.D. (n=3). ***unpaired two-sided t-test. pB=0.0054. n, Quantification of % of donor-derived LSK cells belonging to each SLAM population. Mean ± S.D. (n=3). *Holm-Sidak corrected multiple comparison two-sided t-test. pLT-HSC=0.0010, pMPP1=0.0806, pMPP2=0.6026, pMPP3–4<0.0001. o, Quantification of % Venus+ cells in each CD45.2+ LSK SLAM subpopulation, comparing recipients transplanted with 100 Venus+ vs. Venus− HSCs. Mean ± S.D. (n=3). *Holm-Sidak corrected multiple comparison two-sided t-test. pLT-HSC<0.0001, pMPP1=0.0002, pMPP2=0.8157, pMPP3–4=0.8820. p, Donor engraftment in secondary competitive transplantation, measured as % of PB CD45.2+ granulocytes. Mean ± S.D. (nVenus+=4, nVenus−=5). Line connects the means at each time point. ***paired two-sided t-test p<0.0001.
Supplementary Material
Acknowledgements
A.R.F. acknowledges support by the Life Sciences Research Foundation Merck Fellowship, the European Molecular Biology Organization Long-term Fellowship (ALTF 675–2015), the American Society of Hematology Scholar Award, the Leukemia Lymphoma Society Special Fellow Career Development Program Award (3391–19) and the NIH NHLBI K99/R00 transition to independence award (K99 HL146983). S.W. was supported by. A.M.K., S.W. and C.S.W. acknowledge support by NIH grants R33CA212697–01 and 1R01HL14102–01, the Harvard Stem Cell Institute Blood Program Pilot Grant DP-0174–18-00, and the Chan-Zuckerberg Initiative grant 2018–182714. S.L. was supported by a Senior Fellowship from the Wellcome Trust WT103789AIA. F.D.C was supported by NIH grants HL128850–01A1 and P01HL13147. F.D.C. is a scholar of the Howard Hughes Medical Institute and the Leukemia and Lymphoma Society. The authors wish to acknowledge Chia-Yi Lin for generating Tcf15-Venus mice. We acknowledge the assistance of Ronald Mathieu and the Flow Cytometry Core at Boston Children’s Hospital, the assistance of Alex Ratner and the Harvard Medical School Single Cell Core, and the assistance of the Harvard Biopolymers Facility for high-throughput sequencing. The authors also wish to thank members of the Camargo and Klein lab for helpful discussions, method development and scripts. Illustrations created with Biorender.com.
Footnotes
Competing interests
A.M.K. is a co-founder of 1cellbio, Ltd. The rest of the authors declare no competing interests.
Data and materials availability
Data and analyses are available at the following links: http://github.com/rodriguez-fraticelli/Tcf15_HSCs and https://github.com/AllonKleinLab/StemCellTransplantationModel. Raw data and counts matrices are available at GEO (GSE134242). Source Data behind Figures 1–4 and Extended Data Figures 1–9 are available within the manuscript files.
The LARRY barcoding tool is available at Addgene (#140024).
Code availability
Code, processed data and analyses are available at http://github.com/rodriguez-fraticelli/Tcf15_HSCs and https://github.com/AllonKleinLab/StemCellTransplantationModel.
References (main-text)
- 1.Haas S, Trumpp A & Milsom MD Causes and Consequences of Hematopoietic Stem Cell Heterogeneity. Cell Stem Cell 22, 627–638 (2018). [DOI] [PubMed] [Google Scholar]
- 2.Laurenti E & Göttgens B From haematopoietic stem cells to complex differentiation landscapes. Nature 553, 418–426 (2018). [DOI] [PMC free article] [PubMed] [Google Scholar]
- 3.Naik SH et al. Diverse and heritable lineage imprinting of early haematopoietic progenitors. Nature 496, 229–232 (2013). [DOI] [PubMed] [Google Scholar]
- 4.Dykstra B et al. Long-term propagation of distinct hematopoietic differentiation programs in vivo. Cell Stem Cell 1, 218–229 (2007). [DOI] [PubMed] [Google Scholar]
- 5.Sun J et al. Clonal dynamics of native haematopoiesis. Nature vol. 514 322–327 (2014). [DOI] [PMC free article] [PubMed] [Google Scholar]
- 6.Dharampuriya PR et al. Tracking the origin, development, and differentiation of hematopoietic stem cells. Curr. Opin. Cell Biol 49, 108–115 (2017). [DOI] [PMC free article] [PubMed] [Google Scholar]
- 7.Kent DG et al. Prospective isolation and molecular characterization of hematopoietic stem cells with durable self-renewal potential. Blood 113, 6342–6350 (2009). [DOI] [PubMed] [Google Scholar]
- 8.Carrelha J et al. Hierarchically related lineage-restricted fates of multipotent haematopoietic stem cells. Nature 554, 106–111 (2018). [DOI] [PubMed] [Google Scholar]
- 9.Rodriguez-Fraticelli AE et al. Clonal analysis of lineage fate in native haematopoiesis. Nature vol. 553 212–216 (2018). [DOI] [PMC free article] [PubMed] [Google Scholar]
- 10.Yamamoto R et al. Clonal analysis unveils self-renewing lineage-restricted progenitors generated directly from hematopoietic stem cells. Cell 154, 1112–1126 (2013). [DOI] [PubMed] [Google Scholar]
- 11.Yamamoto R et al. Large-Scale Clonal Analysis Resolves Aging of the Mouse Hematopoietic Stem Cell Compartment. Cell Stem Cell 22, 600–607.e4 (2018). [DOI] [PMC free article] [PubMed] [Google Scholar]
- 12.Giladi A et al. Single-cell characterization of haematopoietic progenitors and their trajectories in homeostasis and perturbed haematopoiesis. Nature Cell Biology vol. 20 836–846 (2018). [DOI] [PubMed] [Google Scholar]
- 13.Buenrostro JD et al. Integrated Single-Cell Analysis Maps the Continuous Regulatory Landscape of Human Hematopoietic Differentiation. Cell 173, 1535–1548.e16 (2018). [DOI] [PMC free article] [PubMed] [Google Scholar]
- 14.Dahlin JS et al. A single-cell hematopoietic landscape resolves 8 lineage trajectories and defects in Kit mutant mice. Blood 131, e1–e11 (2018). [DOI] [PMC free article] [PubMed] [Google Scholar]
- 15.Haas S et al. Human haematopoietic stem cell differentiation follows a continuous waddington-like landscape. Experimental Hematology vol. 44 S77 (2016). [Google Scholar]
- 16.Cabezas-Wallscheid N et al. Vitamin A-Retinoic Acid Signaling Regulates Hematopoietic Stem Cell Dormancy. Cell 169, 807–823.e19 (2017). [DOI] [PubMed] [Google Scholar]
- 17.Wilson NK et al. Combined Single-Cell Functional and Gene Expression Analysis Resolves Heterogeneity within Stem Cell Populations. Cell Stem Cell 16, 712–724 (2015). [DOI] [PMC free article] [PubMed] [Google Scholar]
- 18.Weinreb C, Rodriguez-Fraticelli AE, Camargo FD & Klein AM Lineage tracing on transcriptional landscapes links state to fate during differentiation. doi: 10.1101/467886. [DOI] [PMC free article] [PubMed] [Google Scholar]
- 19.Verovskaya E et al. Heterogeneity of young and aged murine hematopoietic stem cells revealed by quantitative clonal analysis using cellular barcoding. Blood 122, 523–532 (2013). [DOI] [PubMed] [Google Scholar]
- 20.Cheung AMS et al. Analysis of the clonal growth and differentiation dynamics of primitive barcoded human cord blood cells in NSG mice. Blood 122, 3129–3137 (2013). [DOI] [PMC free article] [PubMed] [Google Scholar]
- 21.Lu R, Neff NF, Quake SR & Weissman IL Tracking single hematopoietic stem cells in vivo using high-throughput sequencing in conjunction with viral genetic barcoding. Nat. Biotechnol 29, 928–933 (2011). [DOI] [PMC free article] [PubMed] [Google Scholar]
- 22.McKenzie JL, Gan OI, Doedens M, Wang JCY & Dick JE Individual stem cells with highly variable proliferation and self-renewal properties comprise the human hematopoietic stem cell compartment. Nat. Immunol 7, 1225–1233 (2006). [DOI] [PubMed] [Google Scholar]
- 23.Biasco L et al. In Vivo Tracking of Human Hematopoiesis Reveals Patterns of Clonal Dynamics during Early and Steady-State Reconstitution Phases. Cell Stem Cell 19, 107–119 (2016). [DOI] [PMC free article] [PubMed] [Google Scholar]
- 24.Scala S et al. Dynamics of genetically engineered hematopoietic stem and progenitor cells after autologous transplantation in humans. Nat. Med 24, 1683–1690 (2018). [DOI] [PubMed] [Google Scholar]
- 25.Lu R, Czechowicz A, Seita J, Jiang D & Weissman IL Clonal-level lineage commitment pathways of hematopoietic stem cells in vivo. Proc. Natl. Acad. Sci. U. S. A 116, 1447–1456 (2019). [DOI] [PMC free article] [PubMed] [Google Scholar]
- 26.Qian H et al. Critical role of thrombopoietin in maintaining adult quiescent hematopoietic stem cells. Cell Stem Cell 1, 671–684 (2007). [DOI] [PubMed] [Google Scholar]
- 27.Yoshihara H et al. Thrombopoietin/MPL signaling regulates hematopoietic stem cell quiescence and interaction with the osteoblastic niche. Cell Stem Cell 1, 685–697 (2007). [DOI] [PubMed] [Google Scholar]
- 28.Kubota Y, Osawa M, Jakt LM, Yoshikawa K & Nishikawa S-I Necdin restricts proliferation of hematopoietic stem cells during hematopoietic regeneration. Blood 114, 4383–4392 (2009). [DOI] [PubMed] [Google Scholar]
- 29.Vitali C et al. SOCS2 Controls Proliferation and Stemness of Hematopoietic Cells under Stress Conditions and Its Deregulation Marks Unfavorable Acute Leukemias. Cancer Res 75, 2387–2399 (2015). [DOI] [PubMed] [Google Scholar]
- 30.Jeong M et al. Thioredoxin-interacting protein regulates hematopoietic stem cell quiescence and mobilization under stress conditions. J. Immunol 183, 2495–2505 (2009). [DOI] [PubMed] [Google Scholar]
- 31.Matsumoto A et al. p57 is required for quiescence and maintenance of adult hematopoietic stem cells. Cell Stem Cell 9, 262–271 (2011). [DOI] [PubMed] [Google Scholar]
- 32.Laurenti E et al. Hematopoietic stem cell function and survival depend on c-Myc and N-Myc activity. Cell Stem Cell 3, 611–624 (2008). [DOI] [PMC free article] [PubMed] [Google Scholar]
- 33.Cabezas-Wallscheid N et al. Identification of regulatory networks in HSCs and their immediate progeny via integrated proteome, transcriptome, and DNA methylome analysis. Cell Stem Cell 15, 507–522 (2014). [DOI] [PubMed] [Google Scholar]
- 34.Lauridsen FKB et al. Differences in Cell Cycle Status Underlie Transcriptional Heterogeneity in the HSC Compartment. Cell Rep. 24, 766–780 (2018). [DOI] [PubMed] [Google Scholar]
- 35.Pietras EM et al. Functionally Distinct Subsets of Lineage-Biased Multipotent Progenitors Control Blood Production in Normal and Regenerative Conditions. Cell Stem Cell 17, 35–46 (2015). [DOI] [PMC free article] [PubMed] [Google Scholar]
- 36.Säwen P et al. Murine HSCs contribute actively to native hematopoiesis but with reduced differentiation capacity upon aging. Elife 7, (2018). [DOI] [PMC free article] [PubMed] [Google Scholar]
- 37.Yu VWC et al. Epigenetic Memory Underlies Cell-Autonomous Heterogeneous Behavior of Hematopoietic Stem Cells. Cell 168, 944–945 (2017). [DOI] [PMC free article] [PubMed] [Google Scholar]
- 38.Balazs AB, Fabian AJ, Esmon CT & Mulligan RC Endothelial protein C receptor (CD201) explicitly identifies hematopoietic stem cells in murine bone marrow. Blood 107, 2317–2321 (2006). [DOI] [PMC free article] [PubMed] [Google Scholar]
- 39.Pina C, May G, Soneji S, Hong D & Enver T MLLT3 regulates early human erythroid and megakaryocytic cell fate. Cell Stem Cell 2, 264–273 (2008). [DOI] [PubMed] [Google Scholar]
- 40.Uckelmann H et al. Extracellular matrix protein Matrilin-4 regulates stress-induced HSC proliferation via CXCR4. J. Exp. Med 213, 1961–1971 (2016). [DOI] [PMC free article] [PubMed] [Google Scholar]
- 41.Qian P et al. Retinoid-Sensitive Epigenetic Regulation of the Hoxb Cluster Maintains Normal Hematopoiesis and Inhibits Leukemogenesis. Cell Stem Cell 22, 740–754.e7 (2018). [DOI] [PubMed] [Google Scholar]
- 42.Laurenti E et al. CDK6 levels regulate quiescence exit in human hematopoietic stem cells. Cell Stem Cell 16, 302–313 (2015). [DOI] [PMC free article] [PubMed] [Google Scholar]
- 43.Osawa M, Hanada K, Hamada H & Nakauchi H Long-term lymphohematopoietic reconstitution by a single CD34-low/negative hematopoietic stem cell. Science 273, 242–245 (1996). [DOI] [PubMed] [Google Scholar]
- 44.Gekas C & Graf T CD41 expression marks myeloid-biased adult hematopoietic stem cells and increases with age. Blood 121, 4463–4472 (2013). [DOI] [PubMed] [Google Scholar]
- 45.Datlinger P et al. Pooled CRISPR screening with single-cell transcriptome readout. Nat. Methods 14, 297–301 (2017). [DOI] [PMC free article] [PubMed] [Google Scholar]
- 46.Hill AJ et al. On the design of CRISPR-based single-cell molecular screens. Nat. Methods 15, 271–274 (2018). [DOI] [PMC free article] [PubMed] [Google Scholar]
- 47.Li W et al. MAGeCK enables robust identification of essential genes from genome-scale CRISPR/Cas9 knockout screens. Genome Biol. 15, 554 (2014). [DOI] [PMC free article] [PubMed] [Google Scholar]
- 48.Rowton M et al. Regulation of mesenchymal-to-epithelial transition by PARAXIS during somitogenesis. Developmental Dynamics vol. 242 1332–1344 (2013). [DOI] [PubMed] [Google Scholar]
- 49.Burgess R, Cserjesi P, Ligon KL & Olson EN Paraxis: A Basic Helix-Loop-Helix Protein Expressed in Paraxial Mesoderm and Developing Somites. Developmental Biology vol. 168 296–306 (1995). [DOI] [PubMed] [Google Scholar]
- 50.Davies OR et al. Tcf15 primes pluripotent cells for differentiation. Cell Rep 3, 472–484 (2013). [DOI] [PMC free article] [PubMed] [Google Scholar]
- 51.Seita J et al. Gene Expression Commons: An Open Platform for Absolute Gene Expression Profiling. PLoS ONE vol. 7 e40321 (2012). [DOI] [PMC free article] [PubMed] [Google Scholar]
- 52.Yamada T, Park CS & Lacorazza HD Genetic control of quiescence in hematopoietic stem cells. Cell Cycle 12, 2376–2383 (2013). [DOI] [PMC free article] [PubMed] [Google Scholar]
- 53.Nakamura-Ishizu A, Takizawa H & Suda T The analysis, roles and regulation of quiescence in hematopoietic stem cells. Development 141, 4656–4666 (2014). [DOI] [PubMed] [Google Scholar]
- 54.Opferman JT et al. Obligate role of anti-apoptotic MCL-1 in the survival of hematopoietic stem cells. Science 307, 1101–1104 (2005). [DOI] [PubMed] [Google Scholar]
- 55.Menendez-Gonzalez JB et al. Gata2 as a Crucial Regulator of Stem Cells in Adult Hematopoiesis and Acute Myeloid Leukemia. Stem Cell Reports 13, 291–306 (2019). [DOI] [PMC free article] [PubMed] [Google Scholar]
- 56.Raj B et al. Simultaneous single-cell profiling of lineages and cell types in the vertebrate brain. Nat. Biotechnol 36, 442 (2018). [DOI] [PMC free article] [PubMed] [Google Scholar]
- 57.Alemany A, Florescu M, Baron CS, Peterson-Maduro J & van Oudenaarden A Whole-organism clone tracing using single-cell sequencing. Nature 556, 108–112 (2018). [DOI] [PubMed] [Google Scholar]
- 58.Biddy BA et al. Single-cell mapping of lineage and identity in direct reprogramming. Nature vol. 564 219–224 (2018). [DOI] [PMC free article] [PubMed] [Google Scholar]
References (methods section)
- 59.Zilionis R et al. Single-cell barcoding and sequencing using droplet microfluidics. Nat. Protoc 12, 44–73 (2017). [DOI] [PubMed] [Google Scholar]
- 60.Wolf FA, Angerer P & Theis FJ SCANPY: large-scale single-cell gene expression data analysis. Genome Biol. 19, 15 (2018). [DOI] [PMC free article] [PubMed] [Google Scholar]
- 61.Weinreb C, Wolock S & Klein AM SPRING: a kinetic interface for visualizing high dimensional single-cell expression data. Bioinformatics 34, 1246–1248 (2018). [DOI] [PMC free article] [PubMed] [Google Scholar]
- 62.Wolock SL, Lopez R & Klein AM Scrublet: Computational Identification of Cell Doublets in Single-Cell Transcriptomic Data. Cell Syst 8, 281–291.e9 (2019). [DOI] [PMC free article] [PubMed] [Google Scholar]
- 63.Luecken MD & Theis FJ Current best practices in single-cell RNA-seq analysis: a tutorial. Molecular Systems Biology vol. 15 (2019). [DOI] [PMC free article] [PubMed] [Google Scholar]
- 64.Kirschner K et al. Proliferation Drives Aging-Related Functional Decline in a Subpopulation of the Hematopoietic Stem Cell Compartment. Cell Rep. 19, 1503–1511 (2017). [DOI] [PMC free article] [PubMed] [Google Scholar]
- 65.Wilson A et al. Hematopoietic stem cells reversibly switch from dormancy to self-renewal during homeostasis and repair. Cell 135, 1118–1129 (2008). [DOI] [PubMed] [Google Scholar]
- 66.Haas S et al. Inflammation-Induced Emergency Megakaryopoiesis Driven by Hematopoietic Stem Cell-like Megakaryocyte Progenitors. Cell Stem Cell 17, 422–434 (2015). [DOI] [PubMed] [Google Scholar]
- 67.Tusi BK et al. Population snapshots predict early haematopoietic and erythroid hierarchies. Nature 555, 54–60 (2018). [DOI] [PMC free article] [PubMed] [Google Scholar]
- 68.Paul F et al. Transcriptional Heterogeneity and Lineage Commitment in Myeloid Progenitors. Cell vol. 164 325 (2016). [DOI] [PubMed] [Google Scholar]
- 69.Grimes HL et al. Single cell transcriptome-based dissection of lineage fate decisions in myelopoiesis. Experimental Hematology vol. 42 S21 (2014). [Google Scholar]
- 70.Farbehi N et al. Single-cell expression profiling reveals dynamic flux of cardiac stromal, vascular and immune cells in health and injury. Elife 8, (2019). [DOI] [PMC free article] [PubMed] [Google Scholar]
Associated Data
This section collects any data citations, data availability statements, or supplementary materials included in this article.


