Abstract
Alcohol dependence promotes neuroadaptations in numerous brain areas, leading to escalated drinking and enhanced relapse vulnerability. We previously developed a mouse model of ethanol dependence and relapse drinking in which repeated cycles of chronic intermittent ethanol (CIE) vapor exposure drive a significant escalation of voluntary ethanol drinking. In the current study, we used this model to evaluate changes in neuronal activity (as indexed by c‐Fos expression) throughout acute and protracted withdrawal from CIE (combined with or without a history of ethanol drinking). We analyzed c‐Fos protein expression in 29 brain regions in mice sacrificed 2, 10, 26, and 74 hours or 7 days after withdrawal from 5 cycles of CIE. Results revealed dynamic time‐ and brain region‐dependent changes in c‐Fos activity over the time course of withdrawal from CIE exposure, as compared with nondependent air‐exposed control mice, beginning with markedly low expression levels upon removal from the ethanol vapor chambers (2 hours), reflecting intoxication. c‐Fos expression was enhanced during acute CIE withdrawal (10 and 26 hours), followed by widespread reductions at the beginning of protracted withdrawal (74 hours) in several brain areas. Persistent reductions in c‐Fos expression were observed during prolonged withdrawal (7 days) in prelimbic cortex, nucleus accumbens shell, dorsomedial striatum, paraventricular nucleus of thalamus, and ventral subiculum. A history of ethanol drinking altered acute CIE withdrawal effects and caused widespread reductions in c‐Fos that persisted during extended abstinence even without CIE exposure. These data indicate that ethanol dependence and relapse drinking drive long‐lasting neuroadaptations in several brain regions.
Keywords: alcohol, amygdala, bed nucleus of stria terminalis, cortex, dependence, stress
A mouse model of ethanol dependence and relapse drinking was used to evaluate changes in neuronal activity (as indexed by c‐Fos expression) in 29 brain regions throughout withdrawal. Results revealed dynamic time‐ and brain region‐dependent changes during acute and protracted withdrawal from chronic intermittent ethanol vapor exposure in prelimbic cortex, nucleus accumbens shell, dorsomedial striatum, paraventricular nucleus of thalamus, and ventral subiculum. A history of ethanol drinking caused widespread reductions in c‐Fos that persisted during extended abstinence even without CIE exposure.
Abbreviations
- BLA
basolateral amygdala
- CeA
central amygdala
- Cg
anterior cingulate cortex
- dBNST
dorsal bed nucleus of stria terminalis
- dHPC1
dorsal hippocampus, CA1
- DLS
dorsolateral striatum
- DMH
dorsomedial hypothalamus
- DMS
dorsomedial striatum
- DR
dorsal raphe
- dSub
dorsal subiculum
- EW
Edinger‐Westphal nucleus
- IL
infralimbic cortex
- LC
locus coeruleus
- LH
lateral hypothalamus
- LHb
lateral habenula
- LOFC
lateral orbitofrontal cortex
- M1
motor cortex, primary
- MR
medial raphe
- NAco
nucleus accumbens, core
- NAsh
nucleus accumbens, shell
- NTS
nucleus tractus solitarius (A2 region)
- PL
prelimbic cortex
- PVN
paraventricular nucleus of hypothalamus
- PVT
paraventricular nucleus of thalamus
- RMTg
rostromedial tegmental nucleus
- vBNST
ventral bed nucleus of stria terminalis
- VP
ventral pallidum
- vSub
ventral subiculum
- VTA
ventral tegmental area
1. INTRODUCTION
Heavy alcohol drinking continues to be a serious problem in the United States and throughout the world due to the large medical and economic burdens placed on society. Excessive alcohol (ethanol) consumption over time can lead to the development of dependence and alcohol use disorder (ie, addiction), driven largely by complex adaptations in brain reward and stress systems. 1 , 2 , 3 These neuroadaptive changes are thought to underlie the emergence of physical symptoms and negative affect components of withdrawal when drinking is terminated. This, in turn, is believed to drive increased vulnerability to relapse and facilitate a shift from regulated drinking to excessive, uncontrollable ethanol consumption. 4 , 5 , 6
Animal models have played a significant role in advancing knowledge of the neural mechanisms that underlie ethanol dependence and providing valuable insights for discovering novel treatment targets. 7 , 8 Many laboratories have utilized the chronic intermittent ethanol (CIE) model involving repeated exposure to and withdrawal from ethanol vapor inhalation to investigate neuroadaptations associated with dependence and elevated ethanol consumption. 4 , 9 Indeed, CIE exposure has been shown to produce escalated drinking in mice 10 , 11 and rats. 12 , 13 Similarly, our laboratory developed a mouse model of ethanol dependence and relapse drinking, in which repeated cycles of CIE exposure produce progressive increases in voluntary ethanol drinking, as compared with nondependent air‐exposed mice. 14 , 15
The present study utilized this mouse CIE‐drinking model to examine the time course of CIE exposure/withdrawal‐induced changes in neuronal activity across a large number of brain regions. c‐Fos expression was used as an index of neuronal activity, as it has been used previously to examine neural responses to acute and chronic ethanol administration and drinking 16 , 17 , 18 , 19 (reviewed by Vilpoux et al 20 ). In this study, we investigated the impact of repeated withdrawal experiences in the CIE model on c‐Fos protein activity in 29 brain regions at 5 time points, including after removal from the CIE chamber (2 hours, intoxication), acute withdrawal (10 and 26 hours), and protracted withdrawal (74 hours, 7 days). We focused on brain regions heavily implicated in ethanol reward, withdrawal, addiction, and learning; our analysis includes the majority of brain areas identified as the neurocircuitry involved in acute and chronic drug effects via a hierarchical clustering algorithm. 21 Additionally, the study design enabled evaluation of the possibility that the opportunity to voluntarily consume ethanol (ie, relapse drinking) might modulate CIE‐related changes in neural activity. We hypothesized that repeated cycles of CIE exposure would produce significant changes in c‐Fos expression throughout the brain during exposure (intoxication) and acute withdrawal and that a history of ethanol drinking would alter (mitigate and/or exacerbate) the effects of CIE withdrawal. Further, we hypothesized that these effects would be particularly robust in reward‐ and stress‐associated areas thought to underlie addiction. 3
2. MATERIAL AND METHODS
2.1. Animals
Male C57BL/6J mice (10‐ to 12‐week old) were obtained from Jackson Laboratories (Bar Harbor, ME) and housed in standard polycarbonate cages with wood shavings in a temperature‐ and humidity‐controlled vivarium within an AAALAC‐accredited facility. Mice were maintained on a 12‐hour modified reverse light/dark cycle (lights off at 1200 hours) with ad libitum access to food and water. All mice were individually housed (as adults) 1 week prior to the start of baseline drinking and throughout the study. All experiments were in accordance with the NIH Guide for the Care and Use of Laboratory Animals and the Institutional Animal Care and Use Committee at the Medical University of South Carolina.
2.2. Study design
Mice experienced 5 cycles of chronic intermittent ethanol (CIE) vapor or air (AIR) exposure with or without limited‐access drinking tests during the intervening weeks using procedures described in detail below. Mice were sacrificed at different withdrawal time points according to removal from the chamber for the final CIE or AIR exposure (Figure 1). The overall factorial design of the study was 2 (exposure condition: AIR or CIE) × 2 (drinking condition: DRK or no drinking) × 5 (withdrawal time point: 2, 10, 26, and 74 hours or 7 days). Additional groups of mice in the AIR + DRK and CIE + DRK conditions were given the opportunity to return to drinking ethanol for 4 days (Monday‐Thursday) preceding sacrifice at the 7 days CIE withdrawal time point on Friday (AIR + DRK* and CIE + DRK*; schematic in Figure 10). Thus, a total of 22 experimental groups were included in the study. Final group sizes were n = 4 to 6 per time point within each condition.
FIGURE 1.

Schematic of study design. Mice in the chronic intermittent ethanol (CIE) only and AIR only groups were nonmanipulated prior to being exposed to 1‐week cycles of ethanol (EtOH) vapor or AIR chambers, with no manipulation during the intervening weeks. Mice in the drinking (DRK) conditions underwent a 2‐week fading procedure followed by 4 weeks of limited‐access ethanol drinking to establish a baseline prior to ethanol vapor (CIE + DRK) or AIR (AIR + DRK) exposure. Cycles of EtOH or AIR exposure were alternated with 5‐day ethanol intake tests. Mice were sacrificed at 2, 10, 26, and 74 hours or 7 days after final exposure to either EtOH or AIR chambers. Among mice in the DRK groups sacrificed at the 7‐day time point, half were allowed to continue limited‐access drinking during test 5, whereas the other half remained abstinent (see Figure 10 for schematic of these groups)
FIGURE 10.
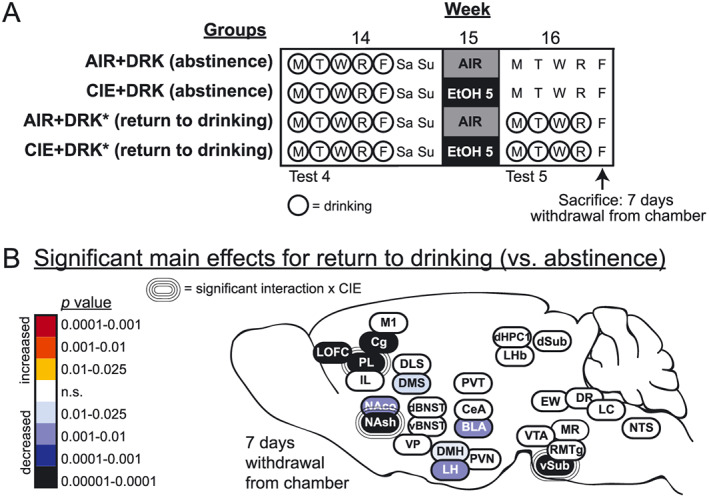
Effects of a return to drinking following the fifth CIE exposure (ie, relapse drinking). A, Schematic of study design for the 3 weeks prior to sacrifice; the first 13 weeks are shown in Figure 1. Prior to sacrifice at 7 days withdrawal from the vapor chamber, some animals were allowed to return to drinking ethanol (AIR + DRK* and CIE + DRK*), while others remained abstinent from drinking (AIR + DRK and CIE + DRK). B, Heat density map showing significant main effects for return to drinking on c‐Fos protein expression in each brain area. Brain areas are color‐coded according to valence of change (as compared with abstinent animals) and level of statistical P value. Significant interactions with CIE (CIE × return to drinking) are also indicated for each brain area
These studies were carried out in four overlapping cohorts of animals, with the arrival of cohorts staggered across 10 weeks. Each cohort included animals in all exposure groups (CIE, DRK) and withdrawal time points. Withdrawal started at the same time for all animals in a cohort, and then animals were euthanized at their assigned time point over the week. Immunohistochemistry was carried out on 24 brains at a time, and the brains were randomly selected from the different groups. The sacrifices and immunohistochemistry for these four cohorts were carried out by the same experimenter.
2.3. Chronic intermittent ethanol exposure
Ethanol vapor (or air) was delivered in Plexiglas inhalation chambers as previously described. 14 , 15 Chamber ethanol concentrations were monitored daily, and air flow was adjusted to maintain ethanol concentrations within a range that yielded stable blood ethanol levels (175‐225 mg/dL). Mice were placed in inhalation chambers at 1600 hours and removed 16 hours later. Before each 16‐hour exposure, mice in CIE groups were administered an injection of ethanol (1.6 g/kg) and the alcohol dehydrogenase inhibitor pyrazole (1 mmol/kg in saline) to maintain a stable level of intoxication during ethanol vapor exposure. Mice in AIR groups received an injection of pyrazole before being placed in control chambers. All injections were given at a volume of 20 mL/kg (i.p.).
2.4. Limited‐access drinking
Mice were trained to drink ethanol in the home cage under a limited‐access, two‐bottle choice paradigm as previously described. 14 , 15 A modified sucrose fading procedure was used with 15% ethanol as the final solution and water as the alternative fluid. The 2‐hour drinking sessions started at 1130 hours Monday through Friday. The amount consumed was recorded daily (±0.1 mL) and body weights weekly. The position of ethanol and water bottles was alternated randomly to avoid side preferences.
2.5. c‐Fos immunohistochemistry
Mice were sacrificed 2 hours after the withdrawal time point of interest (0, 8, 24, and 72 hours or 7 days), because maximal levels of c‐Fos protein occur 1 to 3 hours after cellular activation. 22 Mice were deeply anesthetized with urethane (1.5 mg/kg, i.p.) and then transcardially perfused with 4‐mL phosphate buffer and then 20‐mL 4% formaldehyde (formalin diluted in phosphate buffer) at a 10 mL/min flow rate. Brains were removed, post‐fixed in 4% formaldehyde overnight at 4°C, and then placed into 20% sucrose in phosphate‐buffered saline (PBS) with 0.01% sodium azide for 2 days prior to freezing. A total of 40‐μm sections were cut on a cryostat and collected into PBS‐azide for storage prior to staining.
c‐Fos immunohistochemistry was carried out on free‐floating sections. All incubations and rinses took place at room temperature on a shaker. Sections were rinsed in PBS three times between steps. Sections were first placed into 0.3% H2O2 for 15 minutes, followed by blocking in 2% normal donkey serum in PBS with 0.3% triton‐X (PBST) for 1 hour and incubation in primary antibody (1:20 000 rabbit anti‐cFos, EMD‐Millipore, cat# PC38) diluted in blocking solution overnight. Sections were then incubated in 1:1000 biotinylated donkey anti‐rabbit (Jackson Immuno Research) for 1 hour and 1:1000 ABC (Vector Elite Kit, Vector Labs) for 45 minutes. The reaction was visualized via incubation for 10 minutes in 0.025% 3,3′‐diaminobenzidine (DAB), 0.05% nickel ammonium sulfate, and 0.015% H2O2. Sections were mounted onto Superfrost Plus slides, dried, and coverslipped using Permount.
2.6. Pyrazole control experiment
To determine whether c‐Fos expression in this study was affected by the pyrazole that was administered repeatedly to all groups, an additional experiment was run in which two groups of AIR‐exposed mice received either pyrazole or vehicle (n = 7‐8). Mice experienced 4 cycles of intermittent AIR exposure, with intervening weeks between exposures (but no ethanol drinking), as described above. One group of mice received an injection of pyrazole before being placed in control chambers each day (similar to other AIR groups), while another group received an injection of saline. All mice were sacrificed 2 hours after removal from the chamber for the final AIR exposure. c‐Fos immunohistochemistry was carried out as described above, except that a different version of the primary antibody was used due to availability (1:5000 rabbit anti‐cFos, EMD‐Millipore, cat# ABE457).
2.7. Image analysis
Images were captured at 10× magnification using an EVOS FL microscope (Model AMF‐4300; ThermoFisher). One 40‐μm brain section was used for each brain area per animal. For most brain areas, representative images were taken of both right and left hemispheres on the section and c‐Fos counts were averaged across hemispheres, but a single image was taken for midline structures (PVT, PVN, EW, MR, DR). Fos‐positive nuclei were counted on images using a custom automated macro written in ImageJ (NIH). After a region of interest (ROI) was created on the image (see Table S1 and Figures 4, 5, 6, 7, 8 for ROI location, shape, and size), nuclei were counted that matched criteria for size, circularity, and intensity. The c‐Fos count for each individual ROI in each mouse (and in each hemisphere, if applicable) was divided by the exact size of the ROI used for that c‐Fos count, yielding a c‐Fos density per brain area per mouse. c‐Fos densities were calculated for 0.2 mm2 area (to account for differences in ROI sizes used for different brain areas) and normalized to control AIR groups (% AIR) for each time point (Figures 4, 5, 6, 7, 8) to allow easier comparisons across the data. Raw density values (c‐Fos counts per 0.2 mm2 area) are provided as supplemental information (Table S2).
FIGURE 4.
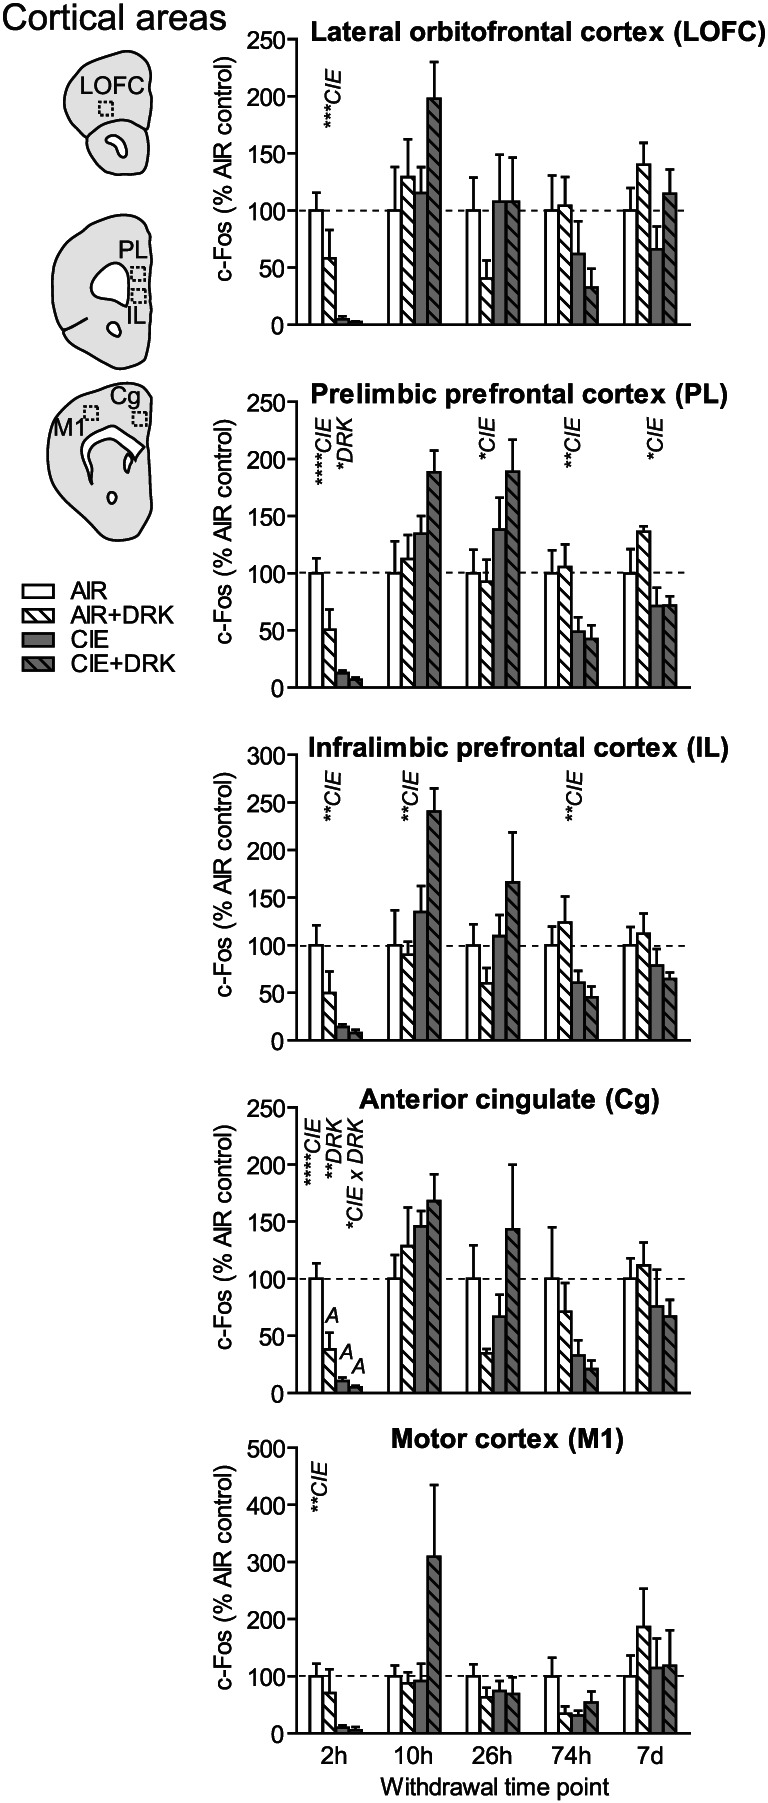
c‐Fos expression in cortical areas following various withdrawal time points. Significant main effects for chronic intermittent ethanol (CIE), ethanol drinking (DRK), and interactions (CIE × DRK) are shown for each time point (* P < .05, ** P < .01, *** P < .001, **** P < .0001); significant post hoc comparisons are represented by letters above a given bar indicating to which other bar a significant difference was observed (eg, A = first bar, B = second bar)
FIGURE 5.
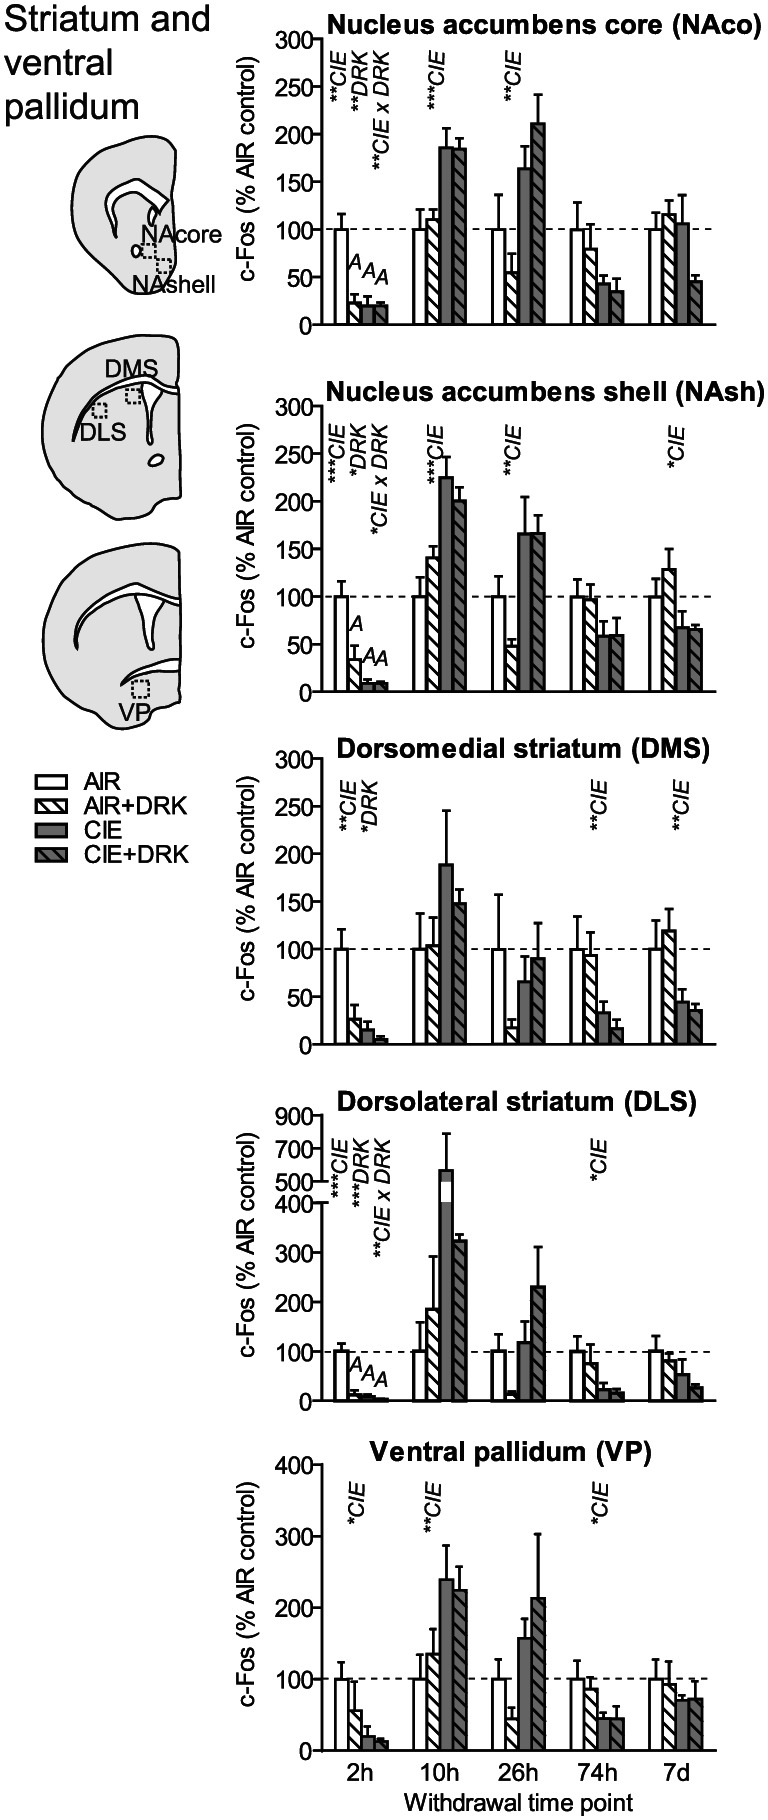
c‐Fos expression in striatal areas and ventral pallidum following various withdrawal time points. Significant main effects for chronic intermittent ethanol (CIE), ethanol drinking (DRK), and interactions (CIE × DRK) are shown for each time point (* P < .05, ** P < .01, *** P < .001, **** P < .0001); significant post hoc comparisons are represented by letters above a given bar indicating to which other bar a significant difference was observed (eg, A = first bar, B = second bar)
FIGURE 6.
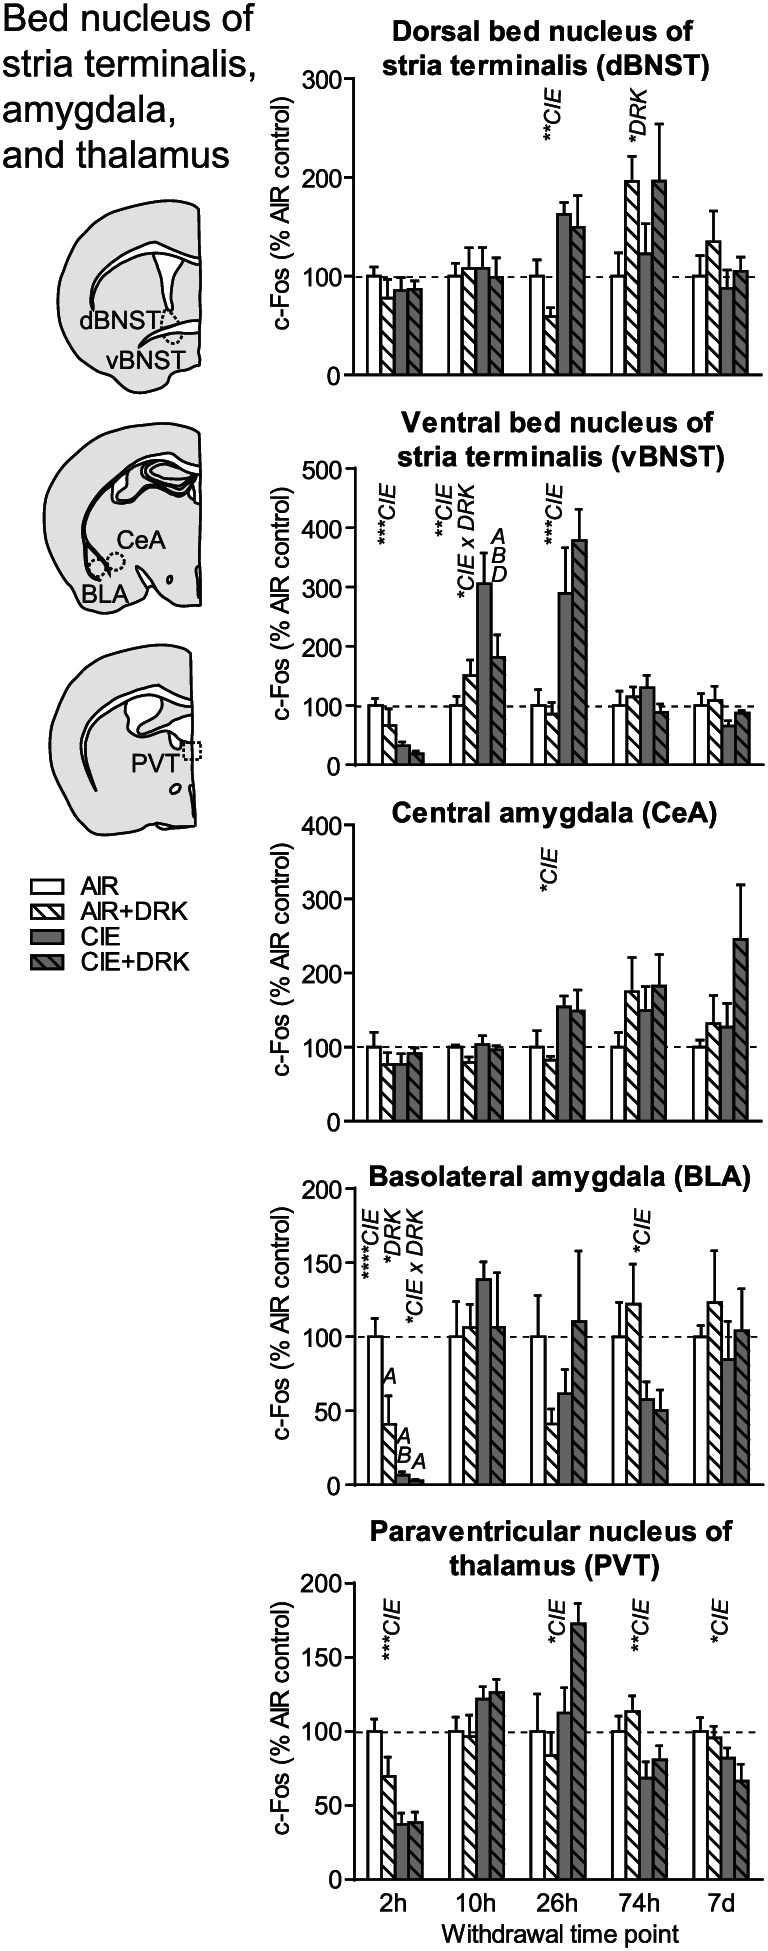
c‐Fos expression in bed nucleus of stria terminalis, amygdala, and paraventricular thalamus following various withdrawal time points. Significant main effects for chronic intermittent ethanol (CIE), ethanol drinking (DRK), and interactions (CIE × DRK) are shown for each time point (* P < .05, ** P < .01, *** P < .001, **** P < .0001); significant post hoc comparisons are represented by letters above a given bar indicating to which other bar a significant difference was observed (eg, A = first bar, B = second bar)
FIGURE 7.
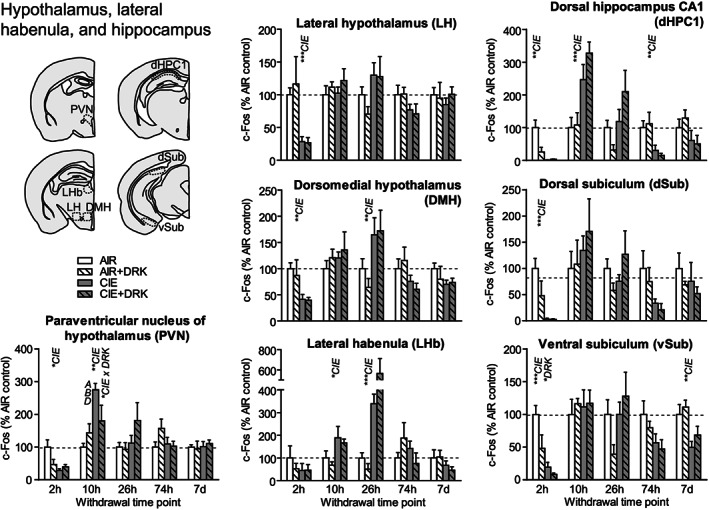
c‐Fos expression in hypothalamus, lateral habenula, and hippocampus following various withdrawal time points. Significant main effects for chronic intermittent ethanol (CIE), ethanol drinking (DRK), and interactions (CIE × DRK) are shown for each time point (* P < .05, ** P < .01, *** P < .001, **** P < .0001); significant post hoc comparisons are represented by letters above a given bar indicating to which other bar a significant difference was observed (eg, A = first bar, B = second bar)
FIGURE 8.
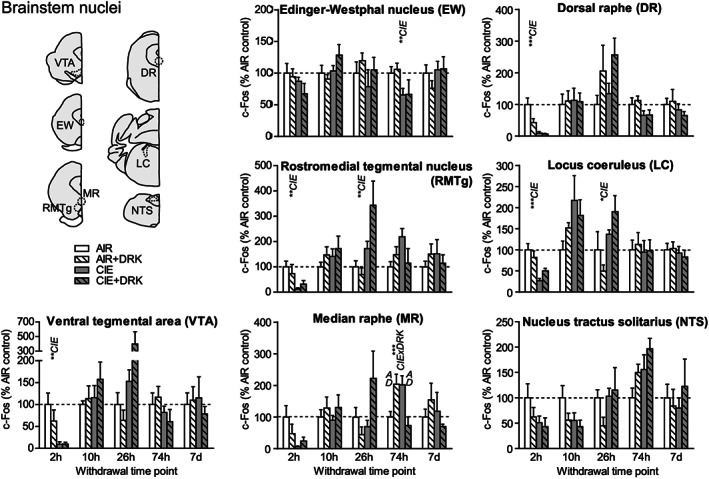
c‐Fos expression in several brainstem nuclei following various withdrawal time points. Significant main effects for chronic intermittent ethanol (CIE), ethanol drinking (DRK), and interactions (CIE × DRK) are shown for each time point (* P < .05, ** P < .01, *** P < .001, **** P < .0001); significant post hoc comparisons are represented by letters above a given bar indicating to which other bar a significant difference was observed (eg, A = first bar, B = second bar)
2.8. Statistical analysis
Ethanol intake values (g/kg) were collapsed across withdrawal time point assignments and averaged across each test week. Data were analyzed by two‐way ANOVA with test week as a repeated factor. Separate two‐way ANOVAs were conducted for DRK groups that had only four drinking test weeks (AIR + DRK and CIE + DRK) and those that had five drinking test weeks (AIR + DRK* and CIE + DRK*, allowed to return to drinking). Post hoc analyses included Bonferroni's multiple comparisons to compare groups within each test week and Sidak's multiple comparisons test to compare test weeks to baseline within each group.
For c‐Fos analyses, two‐way ANOVAs were conducted to investigate main effects of CIE exposure (CIE vs AIR), drinking exposure (DRK vs no drinking), and interactions between CIE and DRK at each time point for a given brain area (statistical values for main effects and interactions are shown in Table S1). Separate two‐way ANOVAs were conducted for DRK groups that either returned to drinking (AIR + DRK* and CIE + DRK*) or remained abstinent during the 7 days of withdrawal (AIR + DRK and CIE + DRK) following the fifth exposure cycle (statistical values are shown in the final column of Table S1). We adjusted for the possibility of type 1 errors in the multiple c‐Fos comparisons by controlling the false discovery rate at 15% using the Benjamini‐Hochberg procedure. 23 A false discovery rate of 15% was chosen given the exploratory nature of this study and to balance the potential for false positives and false negatives. 24 , 25 A comparison was only considered significant when the P value was less than or equal to (i/m)q, where i is the rank of the P value (when all comparisons are sorted according to ascending p value), m is the total number of comparisons, and q is the false discovery rate. This resulted in significant comparisons when P < .025. Neuman‐Keuls post hoc tests were conducted to analyze comparisons among groups when there was a significant interaction. Significant post hoc comparisons between groups are shown in Figures 4, 5, 6, 7, 8. Finally, a two‐way ANOVA was used for the pyrazole control experiment to evaluate the effect of pyrazole on c‐Fos expression across several brain areas.
3. RESULTS
3.1. Ethanol drinking
For the groups given limited‐access drinking, CIE‐exposed mice consumed more ethanol as compared with AIR control mice and as compared with their own baseline intake (Figure 2). For groups that received four test weeks of drinking (AIR + DRK and CIE + DRK), analysis revealed significant main effects of group (F 1,41 = 27.78, P < .0001) and test week (F 4,164 = 14.47, P < .0001), and a Group × Test Week interaction (F 4,164 = 19.35, P < .0001). Post hoc analyses showed significant differences between AIR and CIE groups for tests 1 to 4 (P < .05 for tests 1‐2, P < .0001 for tests 3‐4), and significantly enhanced drinking for tests 1 to 4 in the CIE group as compared with baseline (P < .0001 for all test weeks). For groups that received five test weeks of drinking (AIR + DRK* and CIE + DRK*), analysis revealed significant main effects of group (F 1,7 = 5.60, P = .0498) and test week (F 5,35 = 9.78, P < .0001), and a trend for a Group × Test Week interaction (P = .0653).
FIGURE 2.
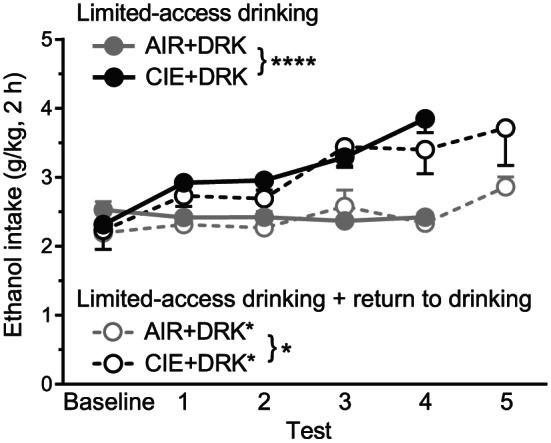
Average daily ethanol consumption for drinking groups across test weeks. CIE‐exposed mice that received four test weeks of drinking (CIE + DRK, n = 21) consumed significantly more ethanol than AIR‐exposed mice (AIR + DRK, n = 22) across test weeks (**** P < .0001). CIE‐exposed mice that received five test weeks of drinking (CIE + DRK*, n = 4) consumed significantly more ethanol than AIR‐exposed mice (AIR + DRK*, n = 5) across test weeks (* P = .0498)
3.2. c‐Fos expression
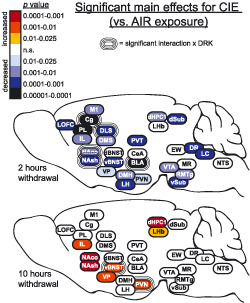
Representative images in Figure 3 show c‐Fos expression in several brain regions for animals exposed to AIR or CIE only and sacrificed at different withdrawal time points. Figures 4, 5, 6, 7, 8 show average levels of c‐Fos expression at each withdrawal time point normalized to that of the AIR group (raw c‐Fos counts and statistical values are shown in Tables S1 to S2). To assess brain‐wide changes in neuronal activity during different stages of ethanol withdrawal, Figures 9 and 10 show mouse brain sagittal sections with heat maps color‐coded to reflect significant increases and decreases in c‐Fos expression according to P values.
FIGURE 3.
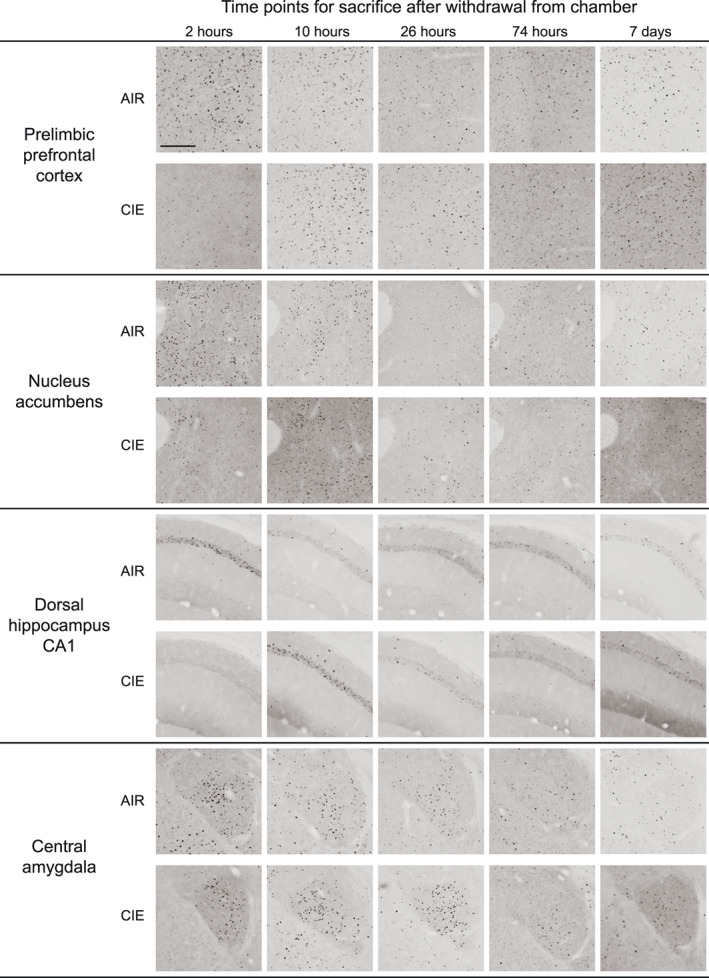
Representative images of c‐Fos expression for AIR‐ and CIE‐exposed mice at all withdrawal time points (2, 10, 26, and 74 hours or 7 days) in prelimbic prefrontal cortex, nucleus accumbens, dorsal hippocampus CA1, and central amygdala. Scale bar on first image = 200 μm
FIGURE 9.
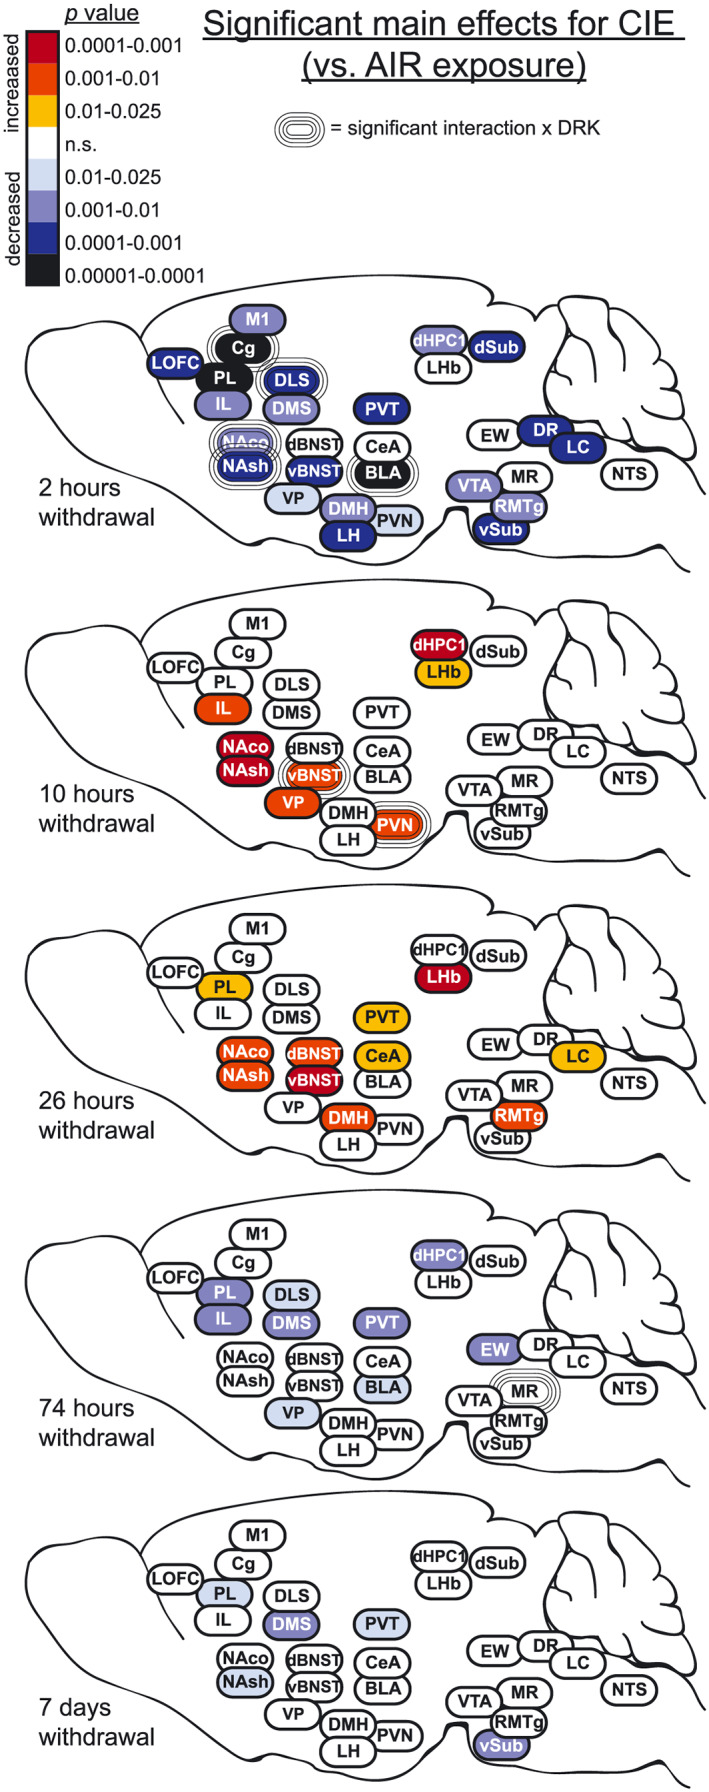
Heat density maps showing significant main effects for CIE on c‐Fos protein expression in each brain area at various sacrifice time points after withdrawal. Brain areas are color‐coded according to valence of change (as compared with AIR control) and level of statistical P value. Significant interactions with drinking (CIE × DRK) are also indicated for each brain area
3.3. Cortical areas (LOFC, PL, IL, Cg, M1)
c‐Fos was significantly reduced upon removal from CIE exposure (2‐hour withdrawal) in all cortical regions analyzed (significant main effect of CIE; Figures 4 and 9), including lateral orbitofrontal cortex (LOFC), prelimbic cortex (PL), infralimbic cortex (IL), anterior cingulate cortex (Cg), and primary motor cortex (M1). Analyses revealed a main effect for DRK in PL and Cg, and a significant CIE × DRK interaction in Cg. The CIE + DRK group showed nonsignificant elevations in c‐Fos in several cortical areas during acute withdrawal (10 and 26 hours). In PL, there was a significant main effect for CIE at most withdrawal time points, with c‐Fos expression elevated at 26‐hour withdrawal but reduced at 74‐hour and 7‐day withdrawal. IL expression was similar to PL, with a significant increase at 10 hours and significant decrease at 74‐hour withdrawal.
3.4. Striatum (NAco, NAsh, DMS, DLS) and ventral pallidum
As seen in cortical areas, c‐Fos was significantly reduced at 2‐hour withdrawal in all areas, including ventral pallidum (VP), ventral striatal subregions (nucleus accumbens core [NAco] and shell [NAsh]), and dorsal striatal subregions (dorsomedial striatum [DMS] and dorsolateral striatum [DLS]) (Figures 5 and 9). All striatal regions showed a significant main effect of DRK at 2‐hour withdrawal, with NAco, NAsh, and DLS also showing significant CIE × DRK interactions. Post hoc analyses revealed that all groups were significantly different from the control AIR group. c‐Fos expression was significantly elevated at 10‐ and 26‐hour withdrawal in CIE groups in NAco and NAsh and elevated at 10‐hour withdrawal in VP. By 74‐hour withdrawal, DMS, DLS, and VP showed significant reductions in CIE groups. At 7‐day withdrawal, significant CIE‐induced reductions in c‐Fos expression were observed in NAsh and DMS.
3.5. Bed nucleus of Stria terminalis (dBNST, vBNST), amygdala (CeA, BLA), and thalamus (PVT)
c‐Fos was significantly reduced at 2‐hour withdrawal from CIE in ventral bed nucleus of stria terminalis (vBNST), basolateral amygdala (BLA), and paraventricular nucleus of thalamus (PVT); however, there was no change from AIR control in dorsal BNST (dBNST) or central amygdala (CeA) at this same time point (Figures 6 and 9). In addition to the CIE‐induced suppression of c‐Fos at 2‐hour withdrawal in BLA, reduced c‐Fos was also observed in AIR‐exposed mice with a history of drinking (significant main effect of DRK, significant CIE × DRK interaction). There was a significant effect for CIE and significant interaction for CIE × DRK in vBNST at 10‐hour withdrawal, with the CIE only group (but not the CIE + DRK group) showing elevated c‐Fos. At 26‐hour withdrawal from CIE, dBNST, vBNST, CeA, and PVT showed significant increases in c‐Fos, despite no changes in dBNST and CeA at 2 or 10‐hour withdrawal. At 74 hours, BLA and PVT showed significant reductions for CIE, whereas dBNST showed significant reductions for DRK. c‐Fos was significantly reduced for CIE at 7 days in PVT.
3.6. Hypothalamus (PVN, LH, DMH), lateral habenula (LHb), and hippocampus (dHPC1, dSub, vSub)
c‐Fos expression was significantly reduced at 2‐hour withdrawal from CIE in all areas of hypothalamus (paraventricular nucleus [PVN], lateral hypothalamus [LH], dorsomedial hypothalamus [DMH]), and hippocampus (dorsal hippocampus CA1 [dHPC1], dorsal subiculum [dSub], ventral subiculum [vSub]) and was reduced (but not significantly) in lateral habenula (LHb) (Figures 7 and 9). vSub showed significant main effects for DRK. At 10‐hour withdrawal, c‐Fos was significantly increased in PVN, LHb, and dHPC1, with a significant interaction for CIE × DRK in PVN. Among CIE‐exposed mice at 26‐hour withdrawal, significant elevations in c‐Fos were observed in DMH and LHb. c‐Fos was significantly reduced for CIE at 74 hours in dHPC1 and at 7 days in vSub.
3.7. Brainstem nuclei (VTA, EW, RMTg, MR, DR, LC, NTS)
At 2‐hour withdrawal, c‐Fos was significantly reduced in CIE groups in ventral tegmental area (VTA), rostromedial tegmental nucleus (RMTg), dorsal raphe (DR), and locus coeruleus (LC) and was reduced (but not significantly) in median raphe (MR) and nucleus tractus solitarius (NTS; A2 region) (Figures 8 and 9). No change was observed in Edinger‐Westphal nucleus (EW). There were no significant differences found in these brainstem areas at 10‐hour withdrawal. At 26‐hour withdrawal, c‐Fos was significantly elevated in RMTg and LC among CIE‐exposed mice. At 74‐hour withdrawal from CIE, c‐Fos was significantly reduced in EW, and there was a significant CIE × DRK interaction in MR, with post hoc analyses showing that a history of ethanol consumption resulted in elevated c‐Fos in the AIR group and reduced c‐Fos in the CIE group. There were no significant changes in c‐Fos expression at 7‐day withdrawal in these brainstem nuclei.
3.8. Brain‐wide changes associated with a return to drinking
The heat map in Figure 10 shows how a return to drinking ethanol for 4 days following the fifth exposure cycle (AIR + DRK* and CIE + DRK*) altered c‐Fos expression, as compared with mice that remained abstinent from drinking in the final week of the study (AIR + DRK and CIE + DRK). In these mice, the last drinking session occurred the day before sacrifice. Animals given the opportunity to drink after the fifth CIE exposure showed significantly reduced c‐Fos in subregions of prefrontal cortex (LOFC, PL, Cg), striatum (NAco, NAsh, DMS), hypothalamus (DMH, LH), BLA, and vSub (significant main effect of return to drinking; Table S1).
PL, NAsh, and vSub showed significant interactions between CIE and return to drinking, and post hoc analyses revealed that c‐Fos expression was significantly reduced in all groups as compared to the AIR + DRK (abstinence) group. In addition, the AIR + DRK* (return to drinking) group was significantly reduced compared to the CIE + DRK (abstinence) group for PL and NAsh but significantly enhanced for vSub.
3.9. Pyrazole effects
Finally, to determine whether c‐Fos expression was affected by repeated pyrazole administration, we ran two additional groups of AIR‐exposed mice that received either pyrazole or vehicle injections daily prior to exposure to AIR chambers. c‐Fos expression was not different between pyrazole‐ and vehicle‐treated mice in representative areas, including PL, IL, M1, NAsh, DMS, dBNST, vBNST, CeA, BLA, PVT, vSub, and dSub (Figure 11). A two‐way ANOVA revealed a significant main effect for brain area (F 11,139 = 12.43, P < .0001) but no difference in c‐Fos expression between groups (P = .47).
FIGURE 11.
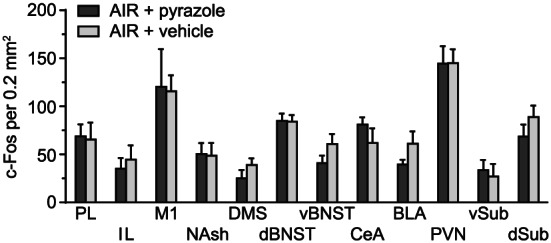
c‐Fos expression in several brain areas following 2‐hour withdrawal from chamber in AIR‐exposed mice that received either repeated pyrazole or vehicle injections
4. DISCUSSION
A number of significant findings emerge in this comprehensive analysis of brain regional and time‐dependent changes in c‐Fos expression related to ethanol dependence (CIE model) and relapse drinking. c‐Fos protein expression was markedly reduced following CIE exposure and intoxication in the majority of brain regions analyzed (mice sacrificed 2 hour after withdrawal; Figure 9). In contrast, increases in c‐Fos expression were evident during acute withdrawal (10 and 26 hours) following CIE exposure, particularly in brain regions associated with negative affect. This was followed by widespread reductions throughout the brain at the beginning of protracted withdrawal (74 hours). Finally, we observed persistent reductions in c‐Fos expression in PL, NAsh, DMS, PVT, and vSub during prolonged withdrawal (7 days). A history of ethanol drinking appeared to exacerbate acute CIE withdrawal‐related c‐Fos changes and caused widespread reductions in c‐Fos that persisted during extended abstinence even without CIE exposure (Figure 10). We found that three brain regions (PL, NAsh, and PVT) were highly responsive to CIE at the majority of withdrawal time points and that PL and NAsh were also responsive to relapse drinking during withdrawal.
The present study was aimed at identifying different brain regions involved in CIE exposure and withdrawal and determining broad effects across withdrawal that spanned acute and more protracted time points. A comprehensive set of studies like this involves potential caveats such as small sample size and a large number of comparisons. The small sample size prevented meaningful correlation analyses between c‐Fos and drinking. We controlled for multiple‐comparison testing by setting a false discovery rate of 15% to balance the potential of false positives and false negatives in this exploratory study. Another limitation of this study is that we analyzed one section per animal per brain area. As some areas are quite large, it may be that areas outside our region of interest may be different. Of note, this study was designed as an initial broad survey describing general neural activity changes across multiple conditions and brain regions. No doubt, follow‐up studies will be necessary to further interrogate identified brain regions in more detail and investigate possible sex differences.
4.1. Time‐dependent changes in c‐Fos activity following CIE exposure and withdrawal
Widespread reductions in c‐Fos protein expression were observed in CIE‐exposed mice at 2‐hour withdrawal (ie, intoxication), when mice were at the end of the final CIE exposure cycle and blood ethanol levels were approximately 200 mg% (Figure 9). In the majority of brain regions analyzed (26 out of 29), c‐Fos activity was reduced below 50% of control values, including nonsignificant reductions in LHb, MR, and NTS (Figures 4, 5, 6, 7, 8). c‐Fos was reduced below 20% of control values in all cortical and striatal areas, and in VP, BLA, vSub, VTA, and DR. Notably, c‐Fos activity was essentially quiescent (less than 5% of controls) in LOFC, dHPC1, and dSub. In contrast to these findings, previous studies have reported increased c‐Fos in several of these brain areas following acute ethanol injections or ethanol drinking, although a history of ethanol vapor exposure resulted in decreased injection‐induced c‐Fos 1 , 19 , 26 , 27 (reviewed by 20 ). These opposing observations can likely be attributed to differences in ethanol dose, route of administration, and duration of exposure. Interestingly, the only brain regions analyzed in the current study that showed resistance to CIE exposure were dBNST, CeA, and EW, with c‐Fos activity similar to AIR controls in these brain areas. This finding suggests that these brain regions may exhibit tolerance to chronic ethanol‐induced reductions in brain activity. However, evaluation of c‐Fos changes after fewer CIE exposure cycles (eg, 1 to 2 cycles) than used in the current study would be required to test this possibility. Previous data showing increased drinking‐induced c‐Fos in EW following 40 ethanol self‐administration sessions in rats may indicate that drinking and vapor exposure differentially affect EW activity. 28 A potential caveat to the current study is that all animals received daily pyrazole injections prior to entry into the vapor chambers (including AIR controls), and this may have affected c‐Fos expression; however, a control experiment revealed no differences in c‐Fos expression in AIR‐exposed mice given either repeated pyrazole or vehicle injections (Figure 11). Results from the present study demonstrate that chronic ethanol (CIE) exposure has a general depressant effect on neuronal activity in most brain areas, although the magnitude of this effect varies according to brain region.
In contrast, once ethanol was cleared from the body (10‐ and 26‐hour withdrawal), c‐Fos activity increased in many brain regions as compared with controls, likely reflecting hyperexcitability during acute withdrawal (Figure 9). Consistent with these findings, previous studies have reported brain‐wide increases in c‐Fos during acute withdrawal (2‐12 hours) from continuous ethanol vapor exposure in rats, ethanol diet in rats, or a single ethanol injection in mice. 29 , 30 , 31 , 32 , 33 Further, ΔFosB expression was increased in striatal areas and OFC during acute withdrawal (18 hours) from ethanol drinking in rats. 34 Previous studies have reported increases in evoked firing or c‐Fos expression in vBNST and DR neurons at 24‐hour CIE withdrawal. 35 , 36 , 37 Interestingly, 26‐hour withdrawal is the only time point when c‐Fos activity was altered in dBNST and CeA in the current study. It is well‐established that acute ethanol withdrawal produces a constellation of signs and symptoms reflective of hyperexcitability as well as general malaise and anxiety. 8 , 38 , 39 , 40 Accordingly, we found that c‐Fos was elevated at this time point in several areas implicated in negative affect and stress reactivity, including vBNST, CeA, PVT, DMH, LHb, RMTg, and LC. Given that this study evaluated multiple withdrawal time points, it is important to note that circadian differences may have influenced c‐Fos expression at the 10‐hour time point. Although the other time points used for analysis were at the same phase of the circadian rhythm, the 10‐hour time point is critical because it corresponds with peak withdrawal based on prior observations with handling‐induced convulsions. 38 This potential circadian influence should be somewhat mitigated in the current data set because c‐Fos expression was normalized to the corresponding control AIR group.
Following the increase in c‐Fos expression observed during acute withdrawal, widespread reductions in c‐Fos activity occurred once again during the more protracted phase of withdrawal (Figure 9). Despite reductions in c‐Fos expression, previous studies have reported enhanced extracellular glutamate, evoked firing, spike timing‐dependent synaptic plasticity, and morphological adaptations in dendritic spines in the NA and PL of ethanol‐dependent mice at this withdrawal time point, suggesting that these functional changes reflect homeostatic adaptations that oppose reductions in neural activity. 41 , 42 , 43 Overall, at 74‐hour withdrawal, c‐Fos was reduced in the current study in several dopaminergic targets, including medial prefrontal cortex, striatum, and BLA. Reductions in these areas might be due to the dampened dopaminergic tone during ethanol withdrawal that has been previously characterized. 44 , 45 , 46 , 47 Finally, at the longest CIE withdrawal time point analyzed (7 days), significant reductions in c‐Fos activity persisted in PL, NAsh, DMS, PVT, and vSub. Changes in these areas might be particularly relevant to anxiety and other negative affective symptoms commonly observed even following prolonged abstinence from chronic ethanol exposure. Time‐course studies are critical to understanding the full spectrum of alcohol withdrawal effects, and this is emphasized by recent work showing changes in dopaminergic tone throughout acute withdrawal, extended withdrawal, and long‐term abstinence. 47
4.2. Interactions between CIE exposure/withdrawal and relapse drinking
A history of ethanol drinking often caused long‐lasting changes in c‐Fos activity even without CIE exposure. Voluntary drinking increased over time in dependent mice, while it remained relatively stable in AIR‐exposed nondependent mice (Figure 2). Analysis of c‐Fos activity at 2‐hour withdrawal revealed a significant CIE × DRK interaction in Cg, NAco, NAsh, DLS, and BLA (Figure 9), which was attributed to significantly decreased c‐Fos activity in the AIR + DRK group as compared with the AIR control condition. Since AIR + DRK mice were abstinent from ethanol for 7 days (bottle access was suspended during inhalation treatment), this suggests that a history of drinking alone (without CIE) can produce persistent neural adaptations in several brain areas. This is supported by the observation that some areas showed a significant main effect for DRK at 2 hours without an interaction with CIE, including PL, DMS, and vSub. Interestingly, during acute withdrawal (10 hours), a history of drinking ameliorated acute withdrawal effects in vBNST and PVN. No significant CIE × DRK interactions were observed during 7 days protracted withdrawal.
Mice allowed to resume drinking ethanol during the week following the fifth exposure cycle (CIE + DRK* and AIR + DRK* groups) showed significant reductions in c‐Fos expression in several areas, as compared with mice with a history of drinking but denied access during this test week (Figure 10). Significant reductions in c‐Fos activity were observed in prefrontal cortex, striatum, hypothalamus, BLA, and vSub in both CIE and AIR mice, indicating that c‐Fos reductions were related to recent drinking (~21 hours prior to sacrifice) regardless of CIE exposure. The fact that c‐Fos expression was reduced throughout the brain ~21 hours after voluntary drinking but enhanced 26 hours after CIE exposure highlights differences in neuronal activity related to intensity of intoxication produced by these ethanol exposures. Further, the profile of brain areas that was affected by drinking was different than 26‐hour CIE withdrawal. Significant interactions between a return to drinking and CIE were observed in several brain areas, which were often traced to reductions in c‐Fos after resuming drinking regardless of exposure to AIR or CIE, whereas abstinent animals had reduced c‐Fos only with a history of CIE. Finally, when these data are considered together with results from CIE withdrawal alone, they reveal that PL and NAsh are unique in showing altered c‐Fos activity following CIE exposure, during acute and protracted withdrawal from CIE, and in response to the opportunity to return to drinking.
4.3. Persistent changes in extended amygdala, prefrontal cortex, and PVT
The transition to dependence and addiction is believed to manifest as a function of dysregulated reward and stress circuitry within the extended amygdala, including NAsh, vBNST, and CeA. 3 In the current study, we found long‐lasting reduced activity in NAsh, but not vBNST and CeA, at 7‐day withdrawal. We also observed long‐lasting reductions in vSub, and a recent study showed that projections from vSub to NAsh play an important role in context‐induced reinstatement of alcohol seeking after punishment. 48 Across all time points, we found vBNST to be more reactive than dBNST, as has been reported previously in DBA/2J mice. 37 Although previous studies have shown functional adaptations in extended amygdala at 48‐hour withdrawal from CIE exposure, 49 in the current study and paradigm, we found that c‐Fos activity in CeA was generally unaffected by CIE exposure or withdrawal, aside from increased activity at 26‐hour withdrawal. Neither BLA nor CeA showed significant changes in c‐Fos expression during early acute withdrawal (10 hours), which corresponds with previous observations for amygdala in this mouse strain. 50 Further, several groups have reported blunted reactivity in CeA following repeated exposure to high doses of ethanol in rats and mice. 26 , 51 Nevertheless, CeA plays an important role in ethanol drinking, as c‐Fos in CeA increased during acute withdrawal (4‐24 hours) from limited‐access drinking, c‐Fos expression in CeA correlated with drinking levels, and Daun02‐induced inactivation of CeA neuronal ensembles reversed escalation of drinking in dependent rats. 52 , 53 , 54 Although we found long‐lasting changes in baseline c‐Fos activity in NAsh, but not vBNST and CeA, at 7‐day withdrawal, it may be the case that neuroadaptations in all of these areas would be revealed upon exposure to a salient stimulus, such as stress, ethanol‐associated cues, or an ethanol priming dose.
3Reduced activity in prefrontal cortex, including PL, has been associated with compulsivity and behavioral inflexibility in addiction. 55 , 56 In the current study, PL was very sensitive to CIE and showed alterations in c‐Fos at several withdrawal time points, including persisting reductions at 7‐day withdrawal. Reduced activity in PL may play a key role in the cognitive deficits that have been reported after prolonged withdrawal from chronic ethanol in mice and rats. 41 , 57 PL plays an important role in the acquisition of goal‐directed behavior, while DMS (which also showed long‐lasting reductions at 7‐day withdrawal) is necessary for the expression of goal‐directed behavior. 58 , 59 Therefore, reduced activity in both PL and DMS during CIE withdrawal may drive enhanced formation of habitual behavior and reduced behavioral flexibility. Indeed, we have previously found that CIE exposure produces a bias toward habit‐like behavior, with CIE‐exposed mice exhibiting decreased sensitivity to lithium chloride devaluation of ethanol as compared with nondependent mice. 60
Finally, reduced activity in PVT after prolonged withdrawal (7 days) may contribute to changes in motivated behavior, and reduced activity in both PL and PVT may actually enhance reward‐seeking behavior. 61 PVT has been implicated in both appetitive and aversive behaviors. 62 , 63 , 64 PVT is connected to many limbic structures, with efferent projections to NAsh, BNST, BLA, and CeA, and afferents from medial prefrontal cortex, hypothalamus, periaqueductal gray, and innervation from monoamine systems, corticotropin‐releasing factor, and orexin. 62 , 63 , 64 The posterior PVT, in particular, plays a role in behavioral responses to acute and chronic stressors, 62 including opiate withdrawal. 65 PVT is also involved in drug seeking and reinstatement for cocaine and ethanol, 66 , 67 , 68 , 69 and the anterior PVT regulates ethanol drinking. 70 , 71 Therefore, dynamic changes in c‐Fos activity in PVT, NAsh, and PL related to CIE withdrawal and relapse drinking might stem from adaptations in reward‐ and stress‐associated brain areas.
5. CONCLUSIONS
Our data indicate that neuronal activity, indexed by c‐Fos expression, changes dramatically in numerous brain regions in response to CIE exposure and throughout the course of acute and protracted withdrawal. A history of voluntary ethanol drinking interacts with CIE exposure to influence neuronal activity in several brain areas. We found persistent adaptations in c‐Fos expression at 7‐day withdrawal in PL, NAsh, DMS, PVT, and vSub. Although the majority of areas analyzed showed no differences in baseline c‐Fos expression at this prolonged withdrawal time point, it is possible that one or more areas would show either enhanced or blunted reactivity upon exposure to a challenge or salient stimulus, such as stress or ethanol‐associated cues. In addition, it may be the case that evaluation of ΔFosB expression would reveal long‐lasting cellular adaptations to ethanol dependence and relapse drinking, 34 , 72 , 73 which may not be reflected in c‐Fos expression due to potential habituation of this immediate early gene. Future studies may explore these possibilities and may also investigate the specific cell phenotypes associated with the observed c‐Fos changes in different brain areas as well as the necessity of c‐Fos‐expressing neurons to drinking behavior using activity‐dependent ablation of neuronal ensembles. 52 , 74 Collectively, our findings provide new knowledge of the neuroadaptations that occur in a well‐established model of ethanol dependence and relapse drinking and point to new avenues of investigation for a deeper understanding of the neurobiology of alcohol use disorder.
AUTHOR CONTRIBUTIONS
RJS, RIA, HLH, PJM, WCG, MFL, and HCB were responsible for study conception and design. RJS, RIA, and HLH acquired animal and image data. RJS, RIA, and WCG drafted the manuscript. All authors provided critical revision of the manuscript and approved the final version for publication.
Supporting information
Table S1. Supporting Information
Table S2. Supporting Information
ACKNOWLEDGEMENTS
Excellent technical assistance for these studies was provided by Stacy Roudabush, Melissa Overstreet, Christina May, Lauryn Luderman, Audrey Padula, Anne Olsen, Laura Ralston, Sarah Brown, and Sarah Reasons. This work was supported by NIH grants P50 AA010761 (HCB), U01 AA014095 (HCB), U01 AA020929 (MFL), U01 AA020930 (PJM), T32 AA007474 (RIA), R21 AA024881 (WCG), and R21 DA037744 (RJS) and by VA Medical Research grant 101BX000813 (HCB).
Smith RJ, Anderson RI, Haun HL, et al. Dynamic c‐Fos changes in mouse brain during acute and protracted withdrawal from chronic intermittent ethanol exposure and relapse drinking. Addiction Biology. 2020;25:e12804 10.1111/adb.12804
The copyright line for this article was changed on 19 July 2019 after original online publication.
REFERENCES
- 1. Hansson AC, Rimondini R, Neznanova O, Sommer WH, Heilig M. Neuroplasticity in brain reward circuitry following a history of ethanol dependence. Eur J Neurosci. 2008;27(8):1912‐1922. [DOI] [PMC free article] [PubMed] [Google Scholar]
- 2. Spanagel R. Alcoholism: a systems approach from molecular physiology to addictive behavior. Physiol Rev. 2009;89(2):649‐705. [DOI] [PubMed] [Google Scholar]
- 3. Koob GF. Addiction is a reward deficit and stress surfeit disorder. Front Psych. 2013;4:72. [DOI] [PMC free article] [PubMed] [Google Scholar]
- 4. Becker HC. Animal models of excessive alcohol consumption in rodents. Curr Top Behav Neurosci. 2013;13:355‐377. [DOI] [PubMed] [Google Scholar]
- 5. Heilig M, Egli M, Crabbe JC, Becker HC. Acute withdrawal, protracted abstinence and negative affect in alcoholism: are they linked? Addict Biol. 2010;15(2):169‐184. [DOI] [PMC free article] [PubMed] [Google Scholar]
- 6. Vengeliene V, Celerier E, Chaskiel L, Penzo F, Spanagel R. Compulsive alcohol drinking in rodents. Addict Biol. 2009;14(4):384‐396. [DOI] [PubMed] [Google Scholar]
- 7. Becker HC, Lopez MF. An animal model of alcohol dependence to screen medications for treating alcoholism. Int Rev Neurobiol. 2016;126:157‐177. [DOI] [PMC free article] [PubMed] [Google Scholar]
- 8. Meinhardt MW, Sommer WH. Postdependent state in rats as a model for medication development in alcoholism. Addict Biol. 2015;20(1):1‐21. [DOI] [PubMed] [Google Scholar]
- 9. Griffin WC 3rd. Alcohol dependence and free‐choice drinking in mice. Alcohol. 2014;48(3):287‐293. [DOI] [PMC free article] [PubMed] [Google Scholar]
- 10. Chu K, Koob GF, Cole M, Zorrilla EP, Roberts AJ. Dependence‐induced increases in ethanol self‐administration in mice are blocked by the CRF1 receptor antagonist antalarmin and by CRF1 receptor knockout. Pharmacol Biochem Behav. 2007;86(4):813‐821. [DOI] [PMC free article] [PubMed] [Google Scholar]
- 11. Finn DA, Snelling C, Fretwell AM, et al. Increased drinking during withdrawal from intermittent ethanol exposure is blocked by the CRF receptor antagonist D‐Phe‐CRF(12‐41). Alcohol Clin Exp Res. 2007;31(6):939‐949. [DOI] [PubMed] [Google Scholar]
- 12. O'Dell LE, Roberts AJ, Smith RT, Koob GF. Enhanced alcohol self‐administration after intermittent versus continuous alcohol vapor exposure. Alcohol Clin Exp Res. 2004;28(11):1676‐1682. [DOI] [PubMed] [Google Scholar]
- 13. Roberts AJ, Heyser CJ, Cole M, Griffin P, Koob GF. Excessive ethanol drinking following a history of dependence: animal model of allostasis. Neuropsychopharmacology. 2000;22(6):581‐594. [DOI] [PubMed] [Google Scholar]
- 14. Becker HC, Lopez MF. Increased ethanol drinking after repeated chronic ethanol exposure and withdrawal experience in C57BL/6 mice. Alcohol Clin Exp Res. 2004;28(12):1829‐1838. [DOI] [PubMed] [Google Scholar]
- 15. Griffin WC 3rd, Lopez MF, Becker HC. Intensity and duration of chronic ethanol exposure is critical for subsequent escalation of voluntary ethanol drinking in mice. Alcohol Clin Exp Res. 2009;33(11):1893‐1900. [DOI] [PMC free article] [PubMed] [Google Scholar]
- 16. Ryabinin AE, Wang YM. Repeated alcohol administration differentially affects c‐Fos and FosB protein immunoreactivity in DBA/2J mice. Alcohol Clin Exp Res. 1998;22(8):1646‐1654. [PubMed] [Google Scholar]
- 17. Ryabinin AE, Criado JR, Henriksen SJ, Bloom FE, Wilson MC. Differential sensitivity of c‐Fos expression in hippocampus and other brain regions to moderate and low doses of alcohol. Mol Psychiatry. 1997;2(1):32‐43. [DOI] [PubMed] [Google Scholar]
- 18. Sharpe AL, Tsivkovskaia NO, Ryabinin AE. Ataxia and c‐Fos expression in mice drinking ethanol in a limited access session. Alcohol Clin Exp Res. 2005;29(8):1419‐1426. [DOI] [PubMed] [Google Scholar]
- 19. Burnham NW, Thiele TE. Voluntary binge‐like ethanol consumption site‐specifically increases c‐Fos immunoexpression in male C57BL6/J mice. Neuroscience. 2017;367:159‐168. [DOI] [PMC free article] [PubMed] [Google Scholar]
- 20. Vilpoux C, Warnault V, Pierrefiche O, Daoust M, Naassila M. Ethanol‐sensitive brain regions in rat and mouse: a cartographic review, using immediate early gene expression. Alcohol Clin Exp Res. 2009;33(6):945‐969. [DOI] [PubMed] [Google Scholar]
- 21. Noori HR, Spanagel R, Hansson AC. Neurocircuitry for modeling drug effects. Addict Biol. 2012;17(5):827‐864. [DOI] [PubMed] [Google Scholar]
- 22. Kovacs KJ. c‐Fos as a transcription factor: a stressful (re)view from a functional map. Neurochem Int. 1998;33(4):287‐297. [DOI] [PubMed] [Google Scholar]
- 23. Benjamini Y, Hochberg Y. Controlling the false discovery rate: a practical and powerful approach to multiple testing. J R Statist Soc B. 1995;57:289‐300. [Google Scholar]
- 24. McDonald JH. Handbook of Biological Statistics. 3rd ed. Baltimore, MD: Sparky House Publishing; 2014. [Google Scholar]
- 25. Benjamini Y, Drai D, Elmer G, Kafkafi N, Golani I. Controlling the false discovery rate in behavior genetics research. Behav Brain Res. 2001;125(1‐2):279‐284. [DOI] [PubMed] [Google Scholar]
- 26. Hitzemann B, Hitzemann R. Genetics ethanol and the Fos response: a comparison of the C57BL/6J and DBA/2J inbred mouse strains. Alcohol Clin Exp Res. 1997;21:1497‐1507. [PubMed] [Google Scholar]
- 27. Aimino MA, Coker CR, Silberman Y. Acute ethanol modulation of neurocircuit function in the nucleus of the tractus solitarius. Brain Res Bull. 2018;138:5‐11. [DOI] [PMC free article] [PubMed] [Google Scholar]
- 28. Weitemier AZ, Woerner A, Backstrom P, Hyytia P, Ryabinin AE. Expression of c‐Fos in Alko alcohol rats responding for ethanol in an operant paradigm. Alcohol Clin Exp Res. 2001;25(5):704‐710. [PubMed] [Google Scholar]
- 29. Kozell LB, Hitzemann R, Buck KJ. Acute alcohol withdrawal is associated with c‐Fos expression in the basal ganglia and associated circuitry: C57BL/6J and DBA/2J inbred mouse strain analyses. Alcohol Clin Exp Res. 2005;29(11):1939‐1948. [DOI] [PubMed] [Google Scholar]
- 30. Matsumoto I, Leah J, Shanley B, Wilce P. Immediate early gene expression in the rat brain during ethanol withdrawal. Mol Cell Neurosci. 1993;4(6):485‐491. [DOI] [PubMed] [Google Scholar]
- 31. Morgan PF, Nadi NS, Karanian J, Linnoila M. Mapping rat brain structures activated during ethanol withdrawal: role of glutamate and NMDA receptors. Eur J Pharmacol. 1992;225(3):217‐223. [DOI] [PubMed] [Google Scholar]
- 32. Borlikova GG, Le Merrer J, Stephens DN. Previous experience of ethanol withdrawal increases withdrawal‐induced c‐Fos expression in limbic areas, but not withdrawal‐induced anxiety and prevents withdrawal‐induced elevations in plasma corticosterone. Psychopharmacol. 2006;185(2):188‐200. [DOI] [PubMed] [Google Scholar]
- 33. Knapp DJ, Duncan GE, Crews FT, Breese GR. Induction of Fos‐like proteins and ultrasonic vocalizations during ethanol withdrawal: further evidence for withdrawal‐induced anxiety. Alcohol Clin Exp Res. 1998;22:481‐493. [PubMed] [Google Scholar]
- 34. Li J, Cheng Y, Bian W, Liu X, Zhang C, Ye JH. Region‐specific induction of FosB/DeltaFosB by voluntary alcohol intake: effects of naltrexone. Alcohol Clin Exp Res. 2010;34(10):1742‐1750. [DOI] [PMC free article] [PubMed] [Google Scholar]
- 35. Lowery‐Gionta EG, Marcinkiewcz CA, Kash TL. Functional alterations in the dorsal raphe nucleus following acute and chronic ethanol exposure. Neuropsychopharmacology. 2015;40(3):590‐600. [DOI] [PMC free article] [PubMed] [Google Scholar]
- 36. Rau AR, Chappell AM, Butler TR, Ariwodola OJ, Weiner JL. Increased basolateral amygdala pyramidal cell excitability may contribute to the anxiogenic phenotype induced by chronic early‐life stress. J Neurosci. 2015;35(26):9730‐9740. [DOI] [PMC free article] [PubMed] [Google Scholar]
- 37. Marcinkiewcz CA, Dorrier CE, Lopez AJ, Kash TL. Ethanol induced adaptations in 5‐HT2c receptor signaling in the bed nucleus of the stria terminalis: implications for anxiety during ethanol withdrawal. Neuropharmacology. 2015;89:157‐167. [DOI] [PMC free article] [PubMed] [Google Scholar]
- 38. Becker HC, Hale RL. Repeated episodes of ethanol withdrawal potentiate the severity of subsequent withdrawal seizures: an animal model of alcohol withdrawal “kindling”. Alcohol Clin Exp Res. 1993;17(1):94‐98. [DOI] [PubMed] [Google Scholar]
- 39. Breese GR, Sinha R, Heilig M. Chronic alcohol neuroadaptation and stress contribute to susceptibility for alcohol craving and relapse. Pharmacol Ther. 2011;129(2):149‐171. [DOI] [PMC free article] [PubMed] [Google Scholar]
- 40. Becker HC. Animal models of alcohol withdrawal. Alcohol Res Health. 2000;24(2):105‐113. [PMC free article] [PubMed] [Google Scholar]
- 41. Kroener S, Mulholland PJ, New NN, Gass JT, Becker HC, Chandler LJ. Chronic alcohol exposure alters behavioral and synaptic plasticity of the rodent prefrontal cortex. PLoS ONE. 2012;7(5):e37541. [DOI] [PMC free article] [PubMed] [Google Scholar]
- 42. Padula AE, Griffin WC 3rd, Lopez MF, et al. KCNN genes that encode small‐conductance Ca2+−activated K+ channels influence alcohol and drug addiction. Neuropsychopharmacology. 2015;40(8):1928‐1939. [DOI] [PMC free article] [PubMed] [Google Scholar]
- 43. Griffin WC, Ramachandra VS, Knackstedt LA, Becker HC. Repeated cycles of chronic intermittent ethanol exposure increases basal glutamate in the nucleus accumbens of mice without affecting glutamate transport. Front Pharmacol. 2015;6:27. [DOI] [PMC free article] [PubMed] [Google Scholar]
- 44. Bailey CP, O'Callaghan MJ, Croft AP, Manley SJ, Little HJ. Alterations in mesolimbic dopamine function during the abstinence period following chronic ethanol consumption. Neuropharmacology. 2001;41(8):989‐999. [DOI] [PubMed] [Google Scholar]
- 45. Diana M, Pistis M, Carboni S, Gessa GL, Rossetti ZL. Profound decrement of mesolimbic dopaminergic neuronal activity during ethanol withdrawal syndrome in rats: electrophysiological and biochemical evidence. Proc Natl Acad Sci USA. 1993;90(17):7966‐7969. [DOI] [PMC free article] [PubMed] [Google Scholar]
- 46. Shen RY, Chiodo LA. Acute withdrawal after repeated ethanol treatment reduces the number of spontaneously active dopaminergic neurons in the ventral tegmental area. Brain Res. 1993;622(1‐2):289‐293. [DOI] [PubMed] [Google Scholar]
- 47. Hirth N, Meinhardt MW, Noori HR, et al. Convergent evidence from alcohol‐dependent humans and rats for a hyperdopaminergic state in protracted abstinence. Proc Natl Acad Sci U S a. 2016;113(11):3024‐3029. [DOI] [PMC free article] [PubMed] [Google Scholar]
- 48. Marchant NJ, Campbell EJ, Whitaker LR, et al. Role of ventral subiculum in context‐induced relapse to alcohol seeking after punishment‐imposed abstinence. J Neurosci. 2016;36(11):3281‐3294. [DOI] [PMC free article] [PubMed] [Google Scholar]
- 49. Pleil KE, Lowery‐Gionta EG, Crowley NA, et al. Effects of chronic ethanol exposure on neuronal function in the prefrontal cortex and extended amygdala. Neuropharmacology. 2015;99:735‐749. [DOI] [PMC free article] [PubMed] [Google Scholar]
- 50. Chen G, Reilly MT, Kozell LB, Hitzemann R, Buck KJ. Differential activation of limbic circuitry associated with chronic ethanol withdrawal in DBA/2J and C57BL/6J mice. Alcohol. 2009;43(6):411‐420. [DOI] [PMC free article] [PubMed] [Google Scholar]
- 51. Chang SL, Patel NA, Romero AA. Activation and desensitization of Fos immunoreactivity in the rat brain following ethanol administration. Brain Res. 1995;679(1):89‐98. [DOI] [PubMed] [Google Scholar]
- 52. de Guglielmo G, Crawford E, Kim S, et al. Recruitment of a neuronal ensemble in the central nucleus of the amygdala is required for alcohol dependence. J Neurosci. 2016;36(36):9446‐9453. [DOI] [PMC free article] [PubMed] [Google Scholar]
- 53. George O, Sanders C, Freiling J, et al. Recruitment of medial prefrontal cortex neurons during alcohol withdrawal predicts cognitive impairment and excessive alcohol drinking. Proc Natl Acad Sci U S a. 2012;109(44):18156‐18161. [DOI] [PMC free article] [PubMed] [Google Scholar]
- 54. Sharko AC, Kaigler KF, Fadel JR, Wilson MA. Individual differences in voluntary ethanol consumption lead to differential activation of the central amygdala in rats: relationship to the anxiolytic and stimulant effects of low dose ethanol. Alcohol Clin Exp Res. 2013;37 Suppl 1:E172‐E180. [DOI] [PMC free article] [PubMed] [Google Scholar]
- 55. Goldstein RZ, Volkow ND. Dysfunction of the prefrontal cortex in addiction: neuroimaging findings and clinical implications. Nat Rev Neurosci. 2011;12(11):652‐669. [DOI] [PMC free article] [PubMed] [Google Scholar]
- 56. Chen BT, Yau HJ, Hatch C, et al. Rescuing cocaine‐induced prefrontal cortex hypoactivity prevents compulsive cocaine seeking. Nature. 2013;496(7445):359‐362. [DOI] [PubMed] [Google Scholar]
- 57. Brooks SP, Croft AP, Norman G, Shaw SG, Little HJ. Nimodipine prior to alcohol withdrawal prevents memory deficits during the abstinence phase. Neuroscience. 2008;157(2):376‐384. [DOI] [PubMed] [Google Scholar]
- 58. Ostlund SB, Balleine BW. Lesions of medial prefrontal cortex disrupt the acquisition but not the expression of goal‐directed learning. J Neurosci. 2005;25(34):7763‐7770. [DOI] [PMC free article] [PubMed] [Google Scholar]
- 59. Yin HH, Ostlund SB, Knowlton BJ, Balleine BW. The role of the dorsomedial striatum in instrumental conditioning. Eur J Neurosci. 2005;22(2):513‐523. [DOI] [PubMed] [Google Scholar]
- 60. Lopez MF, Becker HC, Chandler LJ. Repeated episodes of chronic intermittent ethanol promote insensitivity to devaluation of the reinforcing effect of ethanol. Alcohol. 2014;48(7):639‐645. [DOI] [PMC free article] [PubMed] [Google Scholar]
- 61. Otis JM, Namboodiri VM, Matan AM, et al. Prefrontal cortex output circuits guide reward seeking through divergent cue encoding. Nature. 2017;543(7643):103‐107. [DOI] [PMC free article] [PubMed] [Google Scholar]
- 62. Hsu DT, Kirouac GJ, Zubieta JK, Bhatnagar S. Contributions of the paraventricular thalamic nucleus in the regulation of stress, motivation, and mood. Front Behav Neurosci. 2014;8:73. [DOI] [PMC free article] [PubMed] [Google Scholar]
- 63. Kirouac GJ. Placing the paraventricular nucleus of the thalamus within the brain circuits that control behavior. Neurosci Biobehav Rev. 2015;56:315‐329. [DOI] [PubMed] [Google Scholar]
- 64. Millan EZ, Ong Z, McNally GP. Paraventricular thalamus: gateway to feeding, appetitive motivation, and drug addiction. Prog Brain Res. 2017;235:113‐137. [DOI] [PubMed] [Google Scholar]
- 65. Zhu Y, Wienecke CF, Nachtrab G, Chen X. A thalamic input to the nucleus accumbens mediates opiate dependence. Nature. 2016;530(7589):219‐222. [DOI] [PMC free article] [PubMed] [Google Scholar]
- 66. Dayas CV, McGranahan TM, Martin‐Fardon R, Weiss F. Stimuli linked to ethanol availability activate hypothalamic CART and orexin neurons in a reinstatement model of relapse. Biol Psychiatry. 2008;63(2):152‐157. [DOI] [PubMed] [Google Scholar]
- 67. Hamlin AS, Clemens KJ, Choi EA, McNally GP. Paraventricular thalamus mediates context‐induced reinstatement (renewal) of extinguished reward seeking. Eur J Neurosci. 2009;29(4):802‐812. [DOI] [PubMed] [Google Scholar]
- 68. James MH, Charnley JL, Flynn JR, Smith DW, Dayas CV. Propensity to ‘relapse' following exposure to cocaine cues is associated with the recruitment of specific thalamic and epithalamic nuclei. Neuroscience. 2011;199:235‐242. [DOI] [PubMed] [Google Scholar]
- 69. James MH, Charnley JL, Jones E, et al. Cocaine‐ and amphetamine‐regulated transcript (CART) signaling within the paraventricular thalamus modulates cocaine‐seeking behaviour. PLoS One. 2010;5(9):e12980. [DOI] [PMC free article] [PubMed] [Google Scholar]
- 70. Barson JR, Ho HT, Leibowitz SF. Anterior thalamic paraventricular nucleus is involved in intermittent access ethanol drinking: role of orexin receptor 2. Addict Biol. 2015;20(3):469‐481. [DOI] [PMC free article] [PubMed] [Google Scholar]
- 71. Barson JR, Poon K, Ho HT, Alam MI, Sanzalone L, Leibowitz SF. Substance P in the anterior thalamic paraventricular nucleus: promotion of ethanol drinking in response to orexin from the hypothalamus. Addict Biol. 2017;22(1):58‐69. [DOI] [PMC free article] [PubMed] [Google Scholar]
- 72. Ozburn AR, Mayfield RD, Ponomarev I, Jones TA, Blednov YA, Harris RA. Chronic self‐administration of alcohol results in elevated DeltaFosB: comparison of hybrid mice with distinct drinking patterns. BMC Neurosci. 2012;13(1):130. [DOI] [PMC free article] [PubMed] [Google Scholar]
- 73. Perrotti LI, Weaver RR, Robison B, et al. Distinct patterns of DeltaFosB induction in brain by drugs of abuse. Synapse. 2008;62(5):358‐369. [DOI] [PMC free article] [PubMed] [Google Scholar]
- 74. Pfarr S, Meinhardt MW, Klee ML, et al. Losing control: excessive alcohol seeking after selective inactivation of Cue‐responsive neurons in the infralimbic cortex. J Neurosci. 2015;35(30):10750‐10761. [DOI] [PMC free article] [PubMed] [Google Scholar]
Associated Data
This section collects any data citations, data availability statements, or supplementary materials included in this article.
Supplementary Materials
Table S1. Supporting Information
Table S2. Supporting Information


