

Abstract
Background:
Patients with atrial fibrillation (AF) and severely decreased kidney function were excluded from the pivotal NOAC trials, thereby raising questions about comparative safety and effectiveness in patients with reduced kidney function. The study aimed to compare oral anticoagulants across the range of kidney function in patients with AF.
Methods and Results:
Using a US administrative claims database with linked laboratory data, 34,569 new users of oral anticoagulants with AF and eGFR ≥15 ml/min/1.73 m2 were identified between 10/1/2010–11/29/2017. The proportion of patients using NOACs declined with decreasing kidney function–73.5%, 69.6%, 65.4%, 59.5%, and 45.0% of the patients were prescribed a NOAC in eGFR ≥90, 60–90, 45–60, 30–45, 15–30 ml/min per 1.73 m2 groups, respectively. Stabilized inverse probability of treatment weighting was used to balance four treatment groups (apixaban, dabigatran, rivaroxaban, and warfarin) on 66 baseline characteristics. In comparison to warfarin, apixaban was associated with a lower risk of stroke (hazard ratio [HR] 0.57 [0.43–0.75]; p<0.001), major bleeding (HR 0.51 [0.44–0.61]; p<0.001), and mortality (HR 0.68 [0.56–0.83]; p<0.001); dabigatran was associated with a similar risk of stroke but a lower risk of major bleeding (HR 0.57 [0.43–0.75]; p<0.001) and mortality (HR 0.68 [0.48–0.98]; p=0.04); rivaroxaban was associated with a lower risk of stroke (HR 0.69 [0.51–0.94]; p=0.02), major bleeding (HR 0.84 [0.72–0.99]; p=0.04), and mortality (HR 0.73 [0.58–0.91]; p=0.006). There was no significant interaction between treatment and eGFR categories for any outcome. When comparing one NOAC to another NOAC, there was no significant difference in mortality, but some differences existed for stroke or major bleeding. No relationship between treatments and falsification endpoints was found, suggesting no evidence for substantial residual confounding.
Conclusions:
Relative to warfarin, NOACs are used less frequently as kidney function declines. However, NOACs appears to have similar or better comparative effectiveness and safety across the range of kidney function.
The 33.5 million patients with atrial fibrillation (AF) worldwide are at an increased risk of stroke and mortality.1–3 Oral anticoagulants can substantially reduce these risks and are recommended for nearly 90% of patients with AF.4–6 Warfarin was the only oral anticoagulant for over a half century, but its use is cumbersome, requiring frequent blood tests, ongoing dose adjustment, and careful consideration of numerous interactions with foods and drugs. The use of warfarin is especially challenging for patients with reduced kidney function because, as compared to patients without reduced kidney function, maintaining appropriate and effective international normalized ratio (INR) control is more difficult and requires more intensive management.7, 8
Current American and European guidelines recommend non-vitamin K antagonist oral anticoagulants (NOACs) over warfarin for stroke prevention in patients with AF.5, 9 However, all NOACs rely on the kidney, to some extent, for drug elimination - 27% for apixaban, 80% for dabigatran, 35% for rivaroxaban, and 50% for edoxaban.10 The renal clearance of NOACs coupled with the inability to monitor the level of anticoagulation have raised concerns regarding the risk for excessive bleeding in patients with reduced kidney function. Furthermore, there is little evidence to guide anticoagulation decisions in patients with severely reduced kidney function, since all the key clinical trials supporting FDA approval of NOACs excluded such patients.11–14
Using a large administrative database with linked claims and laboratory data, this study compared the effectiveness and safety of apixaban, dabigatran, rivaroxaban, and warfarin across the range of kidney function in AF patients without end-stage kidney disease. Patients with end-stage kidney disease were excluded since they are fundamentally different and there are past and ongoing research specifically focused on this population.5, 9, 15
Methods
The Mayo Clinic Institutional Review Board exempted this study from review because the study used preexisting, deidentified data. The data will not be made available to other researchers, but the analytic methods have been made available within the article and its online supplementary files.
Study Population
This study was a retrospective cohort analysis using the OptumLabs Data Warehouse, which contains data on patients with private insurance or Medicare Advantage of all ages and races throughout the United States.16, 17
The cohort included adult patients (≥18 years) with nonvalvular AF who were new users of oral anticoagulants, i.e., warfarin and three NOACs (apixaban, dabigatran, and rivaroxaban), between October 1st, 2010 and November 29th, 2017 and had an estimated glomerular filtration rate (eGFR) ≥15 ml/min/1.73 m2 at baseline. Due to the low number of users, edoxaban was not included in the study. Patients were required to have at least one year of continuous medical and pharmacy insurance coverage before their first dispensed oral anticoagulant. The period before a patient’s first prescription dispensation was defined as the baseline period, which was used to capture baseline characteristics.
Patients were required to have linked serum creatinine data in the 12 months prior to the first oral anticoagulant prescription dispensation. When multiple creatinine values were available for a patient, the one closest to the first prescription was used as the baseline value. eGFR was calculated using the Chronic Kidney Disease Epidemiology Collaboration (CKD-EPI) equation.18
Patients were excluded if they had valvular AF at baseline (mechanical heart valves or moderate or severe mitral stenosis),5 or other indications for oral anticoagulants (a joint replacement within six weeks or venous thromboembolism at baseline). Patients who used dabigatran 110 mg BID and rivaroxaban 10 mg OD, doses which are not approved in the US for AF, were also excluded. The patient selection flow diagram is shown in Figure 1.
Figure 1.

Patient Selection Flow Diagram
Baseline characteristics were defined by the presence of a claim with eligible diagnosis codes, procedure codes, or prescription fills. The absence of such claims was interpreted as the absence of a condition.
Exposure
Four oral anticoagulants were studied – apixaban, dabigatran, rivaroxaban, and warfarin. Fill dates and days supplied per prescription were used to determine treatment episodes, defined as the period from the fill date to the date when there were no residual days of supply. A maximum gap of 30 days between treatment episodes was allowed. The discontinuation date was the end of the last treatment episode plus 30 days.
Outcomes
The primary outcomes were: (1) ischemic stroke or systemic embolism (hereafter referred to as stroke), (2) major bleeding, and (3) all-cause mortality. The secondary outcomes included intracranial bleeding and gastrointestinal bleeding, considered separately. The outcomes (except mortality) were defined as a primary diagnosis during an emergency room visit or an inpatient stay (Diagnosis codes are listed in eTable 1). Mortality was identified using a combination of the Social Security Death Master File and patient discharge status. Follow-up started from the initiation of oral anticoagulation until the end of the study period (November 30, 2017), the end of enrollment in health insurance plans, death, or switch or discontinuation of the initial drug, whichever happened first.
Statistical Analyses
Propensity score (PS) and inverse probability of treatment weighting (IPTW) were used to balance the differences in baseline characteristics among the four treatment groups. PS was estimated using generalized boosted models, which used an iterative process with multiple regression trees to capture complex and nonlinear relationships without over-fitting the data. This iterative estimation procedure was tuned to find a PS model that led to the best balance among treatment groups.19 This method is particularly suited to comparing more than two treatment groups and has been used in numerous previous studies.20–22 All the baseline characteristics in Table 1 were included in the PS models except the laboratory values. Stabilized weights were calculated by dividing the probability of treatment without considering covariates by the PS of treatment received.23 The PS and weights were derived to obtain estimates representing average treatment effects. The distribution of the weights is illustrated in eFigure 1. The balance in baseline characteristics among treatment groups was assessed with the use of standardized mean differences. A standardized difference of 0.1 or less was deemed to be the ideal balance, and a standardized difference of 0.2 or less was deemed to be an acceptable balance.19, 24, 25
Table 1.
Baseline Characteristics Before and After Propensity Score Weighting
| Before Propensity Score Weighting | After Propensity Score Weighting | |||||||
|---|---|---|---|---|---|---|---|---|
| Characteristic | Apixaban (N=11,350) |
Dabigatran (N=3,435) |
Rivaroxaban (N=8,597) |
Warfarin (N=11,187) |
Apixaban (N=10,880) |
Dabigatran (N=3,007) |
Rivaroxaban (N=8,269) |
Warfarin (N=10,680) |
| Age, y, mean (SD) | 72.3 (10.5) | 67.2 (11.1) | 69.4 (11) | 72.8 (9.8) | 71.4 (10.3) | 71.1 (9.7) | 71.2 (10.4) | 71.3 (10.3) |
| Female | 5,376 (47.4) | 1,251 (36.4) | 3,427 (39.9) | 4,862 (43.5) | 4,745 (43.6) | 1,267 (42.1) | 3,575 (43.2) | 4,608 (43.1) |
| Race | ||||||||
| Asian | 261 (2.3) | 96 (2.8) | 272 (3.2) | 238 (2.1) | 267 (2.5) | 78 (2.6) | 211 (2.6) | 263 (2.5) |
| Black | 1,246 (11) | 272 (7.9) | 719 (8.4) | 1,246 (11.1) | 1,097 (10.1) | 286 (9.5) | 780 (9.4) | 1,068 (10.0) |
| Hispanic/Latino | 714 (6.3) | 212 (6.2) | 621 (7.2) | 712 (6.4) | 725 (6.7) | 199 (6.6) | 554 (6.7) | 712 (6.7) |
| Other/Unknown | 1,142 (10.1) | 241 (7.0) | 698 (8.1) | 828 (7.4) | 914 (8.4) | 234 (7.8) | 704 (8.5) | 898 (8.4) |
| White | 7,987 (70.4) | 2,614 (76.1) | 6,287 (73.1) | 8,163 (73) | 7,878 (72.4) | 2,210 (73.5) | 6,019 (72.8) | 7,739 (72.5) |
| Geographic Region | ||||||||
| Midwest | 1,922 (16.9) | 439 (12.8) | 1,288 (15) | 2,176 (19.5) | 1,852 (17) | 477 (15.9) | 1,353 (16.4) | 1,837 (17.2) |
| Northeast | 1,912 (16.8) | 558 (16.2) | 1,586 (18.4) | 1,990 (17.8) | 1,906 (17.5) | 525 (17.5) | 1,452 (17.6) | 1,837 (17.2) |
| South | 6,498 (57.3) | 2,091 (60.9) | 4,840 (56.3) | 5,877 (52.5) | 6,074 (55.8) | 1,695 (56.4) | 4,654 (56.3) | 5,950 (55.7) |
| West | 1,018 (9) | 347 (10.1) | 883 (10.3) | 1,144 (10.2) | 1,048 (9.6) | 310 (10.3) | 809 (9.8) | 1,056 (9.9) |
| eGFR, ml/min/1.73 m2 | 68.5 (20.1) | 73.3 (19.0) | 72.5 (18.9) | 65.9 (21.1) | 69.2 (19.6) | 69.5 (18.1) | 69.4 (19.3) | 69 (19.6) |
| 15–30 | 327 (2.9) | 39 (1.1) | 111 (1.3) | 583 (5.2) | 308 (2.8) | 70 (2.3) | 210 (2.5) | 329 (3.1) |
| 30–45 | 1,213 (10.7) | 222 (6.5) | 607 (7.1) | 1,391 (12.4) | 1,084 (10) | 282 (9.4) | 797 (9.6) | 1,076 (10.1) |
| 45–60 | 2,278 (20.1) | 594 (17.3) | 1,523 (17.7) | 2,321 (20.7) | 2,095 (19.3) | 598 (19.9) | 1,650 (20) | 2,051 (19.2) |
| 60–90 | 5,916 (52.1) | 1,877 (54.6) | 4,764 (55.4) | 5,480 (49) | 5,757 (52.9) | 1,603 (53.3) | 4,348 (52.6) | 5,601 (52.4) |
| ≥90 | 1,616 (14.2) | 703 (20.5) | 1,592 (18.5) | 1,412 (12.6) | 1,636 (15) | 454 (15.1) | 1,264 (15.3) | 1,624 (15.2) |
| CHA2DS2-VASc, mean (SD) * | 4.5 (1.9) | 3.8 (2.0) | 4 (1.9) | 4.8 (1.9) | 4.4 (1.9) | 4.3 (1.8) | 4.4 (1.9) | 4.4 (1.9) |
| HAS-BLED, mean (SD) † | 3.1 (1.3) | 2.6 (1.3) | 2.8 (1.3) | 3.2 (1.3) | 3 (1.3) | 3 (1.2) | 3 (1.3) | 3 (1.3) |
| Medical History | ||||||||
| Heart failure | 4,227 (37.2) | 1,010 (29.4) | 2,637 (30.7) | 5,202 (46.5) | 4,041 (37.1) | 1,078 (35.8) | 3,067 (37.1) | 4,099 (38.4) |
| Hypertension | 10,560 (93) | 3,104 (90.4) | 7,865 (91.5) | 10,612 (94.9) | 10,096 (92.8) | 2,801 (93.1) | 7,701 (93.1) | 9,942 (93.1) |
| Thromboembolism | 2,562 (22.6) | 623 (18.1) | 1,535 (17.9) | 2,987 (26.7) | 2,386 (21.9) | 671 (22.3) | 1,811 (21.9) | 2,352 (22) |
| Diabetes mellitus | 4,747 (41.8) | 1,346 (39.2) | 3,435 (40) | 5,289 (47.3) | 4,598 (42.3) | 1,282 (42.6) | 3,540 (42.8) | 4,597 (43) |
| Coronary artery disease | 6,312 (55.6) | 1,822 (53) | 4,393 (51.1) | 7,021 (62.8) | 6,106 (56.1) | 1,710 (56.8) | 4,620 (55.9) | 6,094 (57.1) |
| Peripheral artery disease | 1,640 (14.4) | 396 (11.5) | 1,079 (12.6) | 2,125 (19) | 1,600 (14.7) | 454 (15.1) | 1,197 (14.5) | 1,629 (15.3) |
| Major bleeding | 2,773 (24.4) | 804 (23.4) | 1,920 (22.3) | 3,047 (27.2) | 2,636 (24.2) | 720 (23.9) | 1,975 (23.9) | 2,634 (24.7) |
| Intracranial bleeding | 256 (2.3) | 66 (1.9) | 131 (1.5) | 276 (2.5) | 236 (2.2) | 57 (1.9) | 156 (1.9) | 218 (2.0) |
| Liver disease | 1,874 (16.5) | 522 (15.2) | 1,328 (15.4) | 1,700 (15.2) | 1,719 (15.8) | 478 (15.9) | 1,295 (15.7) | 1,628 (15.2) |
| Alcoholism | 623 (5.5) | 184 (5.4) | 517 (6) | 622 (5.6) | 594 (5.5) | 154 (5.1) | 472 (5.7) | 581 (5.4) |
| Obesity | 4,214 (37.1) | 1,125 (32.8) | 3,082 (35.8) | 3,592 (32.1) | 3,837 (35.3) | 1,030 (34.3) | 2,906 (35.1) | 3,682 (34.5) |
| Smoking | 4,208 (37.1) | 1,058 (30.8) | 2,952 (34.3) | 3,891 (34.8) | 3,852 (35.4) | 1,024 (34) | 2,926 (35.4) | 3,722 (34.8) |
| Falls | 1,955 (17.2) | 362 (10.5) | 1,117 (13) | 1,823 (16.3) | 1,673 (15.4) | 434 (14.4) | 1,234 (14.9) | 1,602 (15.0) |
| Acute Kidney Injury | 2,186 (19.3) | 365 (10.6) | 1,098 (12.8) | 2,742 (24.5) | 2,023 (18.6) | 504 (16.8) | 1,461 (17.7) | 1,979 (18.5) |
| Other valvular heart disease | 5,700 (50.2) | 1,711 (49.8) | 4,081 (47.5) | 5,886 (52.6) | 5,456 (50.1) | 1,519 (50.5) | 4,158 (50.3) | 5,399 (50.5) |
| Non skin cancer | 2,344 (20.7) | 618 (18) | 1,578 (18.4) | 2,543 (22.7) | 2,216 (20.4) | 614 (20.4) | 1,636 (19.8) | 2,222 (20.8) |
| Recent major bleeding | 60 (0.5) | 21 (0.6) | 29 (0.3) | 109 (1.0) | 61 (0.6) | 21 (0.7) | 38 (0.5) | 70 (0.7) |
| Recent thromboembolism | 598 (5.3) | 134 (3.9) | 329 (3.8) | 851 (7.6) | 575 (5.3) | 149 (4.9) | 426 (5.2) | 601 (5.6) |
| Hyperlipidemia | 10,113 (89.1) | 3,074 (89.5) | 7,624 (88.7) | 10,150 (90.7) | 9,732 (89.4) | 2,713 (90.2) | 7,430 (89.9) | 9,563 (89.5) |
| Ischemic stroke | 1,837 (16.2) | 412 (12) | 1,019 (11.9) | 2,148 (19.2) | 1,705 (15.7) | 460 (15.3) | 1,238 (15) | 1,674 (15.7) |
| Myocardial infarction | 2,115 (18.6) | 519 (15.1) | 1,371 (15.9) | 2,698 (24.1) | 2,047 (18.8) | 554 (18.4) | 1,563 (18.9) | 2,093 (19.6) |
| COPD | 1,755 (15.5) | 456 (13.3) | 1,295 (15.1) | 2,235 (20) | 1,772 (16.3) | 487 (16.2) | 1,411 (17.1) | 1,806 (16.9) |
| Obstructive sleep apnea | 2,690 (23.7) | 853 (24.8) | 2,051 (23.9) | 2,310 (20.6) | 2,518 (23.1) | 686 (22.8) | 1,919 (23.2) | 2,398 (22.5) |
| Systolic heart failure | 1,850 (16.3) | 349 (10.2) | 999 (11.6) | 2,121 (19) | 1,683 (15.5) | 432 (14.4) | 1,214 (14.7) | 1,637 (15.3) |
| Cardioversion | 1,530 (13.5) | 505 (14.7) | 1,127 (13.1) | 908 (8.1) | 1,298 (11.9) | 359 (11.9) | 993 (12.0) | 1,208 (11.3) |
| Ablation | 313 (2.8) | 162 (4.7) | 288 (3.4) | 224 (2.0) | 306 (2.8) | 82 (2.7) | 236 (2.9) | 276 (2.6) |
| Pacemaker/ICD | 1,581 (13.9) | 384 (11.2) | 991 (11.5) | 1,602 (14.3) | 1,459 (13.4) | 409 (13.6) | 1,092 (13.2) | 1,403 (13.1) |
| PCI/CABG | 2,081 (18.3) | 571 (16.6) | 1,365 (15.9) | 2,776 (24.8) | 2,091 (19.2) | 561 (18.7) | 1,565 (18.9) | 2,125 (19.9) |
| Depression | 4,550 (40.1) | 1,203 (35) | 3,144 (36.6) | 4,376 (39.1) | 4,201 (38.6) | 1,122 (37.3) | 3,140 (38) | 4,096 (38.4) |
| Dementia | 939 (8.3) | 154 (4.5) | 493 (5.7) | 911 (8.1) | 789 (7.3) | 208 (6.9) | 595 (7.2) | 762 (7.1) |
| Hypothyroidism | 3,863 (34) | 1,095 (31.9) | 2,690 (31.3) | 3,821 (34.2) | 3,614 (33.2) | 988 (32.9) | 2,723 (32.9) | 3,539 (33.1) |
| Thyrotoxicosis | 586 (5.2) | 212 (6.2) | 450 (5.2) | 605 (5.4) | 561 (5.2) | 158 (5.2) | 449 (5.4) | 574 (5.4) |
| Ulcer in upper GI tract | 697 (6.1) | 204 (5.9) | 475 (5.5) | 783 (7.0) | 659 (6.1) | 189 (6.3) | 496 (6) | 662 (6.2) |
| Baseline Medication | ||||||||
| Antiplatelet | 1,386 (12.2) | 364 (10.6) | 916 (10.7) | 1,571 (14) | 1,315 (12.1) | 367 (12.2) | 1,006 (12.2) | 1,283 (12) |
| NSAIDS | 1,376 (12.1) | 444 (12.9) | 1,047 (12.2) | 1,210 (10.8) | 1,291 (11.9) | 347 (11.5) | 987 (11.9) | 1,236 (11.6) |
| Amiodarone | 1,367 (12) | 364 (10.6) | 857 (10.0) | 1,434 (12.8) | 1,277 (11.7) | 327 (10.9) | 938 (11.3) | 1,230 (11.5) |
| Dronedarone | 296 (2.6) | 169 (4.9) | 268 (3.1) | 195 (1.7) | 293 (2.7) | 81 (2.7) | 231 (2.8) | 264 (2.5) |
| Other antiarrhythmic drugs | 1,264 (11.1) | 484 (14.1) | 1,041 (12.1) | 775 (6.9) | 1,140 (10.5) | 316 (10.5) | 888 (10.7) | 1,071 (10.0) |
| Digoxin | 821 (7.2) | 371 (10.8) | 669 (7.8) | 1,339 (12) | 952 (8.7) | 280 (9.3) | 746 (9) | 1,017 (9.5) |
| Diltiazem | 2,064 (18.2) | 626 (18.2) | 1,533 (17.8) | 1,930 (17.3) | 1,954 (18.0) | 540 (18.0) | 1,481 (17.9) | 1,890 (17.7) |
| Verapamil | 161 (1.4) | 68 (2.0) | 152 (1.8) | 232 (2.1) | 176 (1.6) | 45 (1.5) | 146 (1.8) | 191 (1.8) |
| Other rate control drugs | 7,630 (67.2) | 2,171 (63.2) | 5,515 (64.2) | 7,417 (66.3) | 7,194 (66.1) | 1,955 (65) | 5,407 (65.4) | 7,005 (65.6) |
| Renin-angiotensin system antagonists | 6,201 (54.6) | 1,816 (52.9) | 4,488 (52.2) | 6,072 (54.3) | 5,874 (54.0) | 1,649 (54.8) | 4,416 (53.4) | 5,712 (53.5) |
| Other calcium channel blockers | 2,704 (23.8) | 721 (21) | 1,864 (21.7) | 2,645 (23.6) | 2,529 (23.2) | 682 (22.7) | 1,887 (22.8) | 2,437 (22.8) |
| Other adrenergic blocking agents | 608 (5.4) | 184 (5.4) | 437 (5.1) | 783 (7.0) | 597 (5.5) | 164 (5.4) | 458 (5.5) | 622 (5.8) |
| Loop diuretics | 2,831 (24.9) | 649 (18.9) | 1,718 (20.0) | 3,384 (30.2) | 2,647 (24.3) | 716 (23.8) | 2,010 (24.3) | 2,686 (25.2) |
| Thiazides | 2,692 (23.7) | 858 (25) | 1,956 (22.8) | 2,547 (22.8) | 2,528 (23.2) | 699 (23.3) | 1,902 (23) | 2,430 (22.7) |
| Cholesterol lowering drugs | 6,089 (53.6) | 1,704 (49.6) | 4,257 (49.5) | 5,900 (52.7) | 5,710 (52.5) | 1,558 (51.8) | 4,301 (52) | 5,530 (51.8) |
| Insulin | 894 (7.9) | 233 (6.8) | 574 (6.7) | 1,141 (10.2) | 883 (8.1) | 244 (8.1) | 636 (7.7) | 894 (8.4) |
| Metformin | 1,731 (15.3) | 523 (15.2) | 1,366 (15.9) | 1,669 (14.9) | 1,689 (15.5) | 463 (15.4) | 1,292 (15.6) | 1,602 (15.0) |
| Other diabetes drugs | 1,468 (12.9) | 426 (12.4) | 1,050 (12.2) | 1,594 (14.2) | 1,396 (12.8) | 397 (13.2) | 1,064 (12.9) | 1,397 (13.1) |
| Antiulcer agents | 3,189 (28.1) | 774 (22.5) | 2,034 (23.7) | 3,236 (28.9) | 2,924 (26.9) | 788 (26.2) | 2,154 (26) | 2,861 (26.8) |
| Length of Baseline Period, yr, mean (SD) | 4.4 (3.6) | 4.3 (3.2) | 4.5 (3.5) | 4.3 (3.4) | 4.4 (3.4) | 4.2 (3.1) | 4.4 (3.4) | 4.3 (3.3) |
| Laboratory results, mean (SD)‡ | ||||||||
| Serum calcium, mg/dL | 9.4 (0.5) | 9.4 (0.4) | 9.4 (0.4) | 9.4 (0.5) | 9.4 (0.5) | 9.4 (0.4) | 9.4 (0.4) | 9.4 (0.5) |
| Serum albumin, g/dL | 4.2 (0.4) | 4.2 (0.3) | 4.2 (0.3) | 4.1 (0.4) | 4.2 (0.4) | 4.2 (0.3) | 4.2 (0.4) | 4.1 (0.4) |
| Hemoglobin, g/dL | 13.5 (1.8) | 14 (1.7) | 13.9 (1.7) | 13.4 (1.9) | 13.6 (1.7) | 13.7 (1.7) | 13.7 (1.7) | 13.6 (1.8) |
| LDL-C, mg/dL | 92.3 (33.7) | 94.4 (32.2) | 94.3 (32.9) | 93 (33.5) | 92.6 (33.1) | 92.4 (29.4) | 92.9 (32.2) | 94.3 (32.9) |
| HbA1c, % | 6.6 (1.3) | 6.6 (1.3) | 6.6 (1.3) | 6.8 (1.4) | 6.6 (1.3) | 6.7 (1.3) | 6.6 (1.3) | 6.7 (1.3) |
Abbreviations: CABG, coronary artery bypass graft; COPD, chronic obstructive pulmonary disease; GI, gastrointestinal; HbA1c, hemoglobin A1c; ICD, implantable cardioverter-defibrillator; LDL-C, low-density lipoprotein cholesterol; NSAID, nonsteroidal anti-inflammatory drug; PCI, percutaneous coronary intervention.
Range, 0 to 9; higher score indicates higher risk of stroke. Point score is calculated as 1 point each for heart failure, hypertension, diabetes, vascular disease, age 65 to 74 years, and female sex; 2 points for 75 years or older and prior stroke, TIA, or thromboembolism.
Range, 0 to 9; higher score indicates higher risk of bleeding. Point score is calculated as 1 point each for hypertension, abnormal kidney function, abnormal liver function, prior stroke, prior bleeding or bleeding predisposition, labile international normalized ratio (INR), older than 65 years, medication usage predisposing to bleeding, and alcohol use. This study did not consider INR, so the range is 0 to 8.
Laboratory results were not included in PS models but were balanced after balancing on other baseline characteristics
Weighted Cox proportional hazards regression with a robust variance estimator was used to assess outcomes. The Fine and Gray method was used to consider death as a competing risk when assessing non-fatal outcomes.26 The event rates per 100 person-years and hazard ratios (HRs) were obtained in the overall population and in each of the eGFR subgroups. The interaction term between treatment and eGFR category was tested to examine whether HRs were the same across the eGFR subgroups. The proportional hazards assumption was checked by testing the interaction with time. Data management was performed using SAS 9.4 (SAS Institute Inc); propensity scores were obtained using the R version 3.2.2 (R Foundation); regression was performed using Stata 14.1 (StatCorp).
Assessment of Residual Confounding
Use of PS weighting to address confounding in the estimation of treatment effects is based on an assumption that all variables that affect treatment assignment and outcome have been measured. Because not all of these variables are available in the data, we partially test the extent to which the model aligns with this assumption by examining whether laboratory results that were not included in the PS model were balanced after balancing on the baseline characteristics included in the PS model. Such laboratory results included serum calcium, serum albumin, hemoglobin, low-density lipoprotein cholesterol, and hemoglobin A1c. Balance on these results that were not included in the model and that were not included in the complete population served as a proxy indicator for the model reducing unmeasured and measured confounding. In addition, we tested two falsification endpoints (pneumonia and fracture) that are not likely a result of treatment, but would likely be related to confounding.27
Sensitivity Analyses
First, regression analyses were performed adjusting for a few key stroke and bleeding risk factors to examine whether the results changed when further controlling for residual imbalance in baseline characteristics. Second, a sensitivity analysis was performed excluding NOAC-treated patients who were potentially over-dosed or under-dosed. Third, NOAC-treated patients were compared with warfarin-treated patients with a mean INR <2, 2–3, and >3, respectively. Fourth, we examined patients’ eGFR during follow up and compared treatments in patients who had a substantial decline in eGFR, defined as at least 20% decline.
The pre-specified analysis plan, including more details of the methods, such as the consideration of censoring and multiple testing, is available in Supplement 1.
Results
Patient Characteristics
Among 34,569 patients who were new users of oral anticoagulants, the mean age was 71.2 (SD, 10.7) years; the mean eGFR was 69.2 (SD, 20.2) ml/min/1.73 m2; 14,916 (43.2%) were women, 25,051 (72.5%) were white. The mean follow-up was 8.2 (SD, 9.0) months. The proportion of patients using warfarin monotonically increased as patients’ kidney function declined – 1,412 (26.5%), 5,480 (30.4%), 2,321 (34.6%), 1,391 (40.5%), and 583 (55.0%) of patients were prescribed warfarin in the eGFR ≥90, 60–90, 45–60, 30–45, 15–30 ml/min per 1.73 m2 groups, respectively (eTables 2 and 3). After PS weighting, patients in the four treatment groups were similar on 66 baseline characteristics (Table 1 and eTables 4 and 5).
Primary and Secondary Outcomes
In the overall population, in comparison to warfarin, apixaban was associated with a lower risk of stroke (HR 0.57 [0.43–0.75]; p<0.001), major bleeding (HR 0.51 [0.44–0.61]; p<0.001), and mortality (HR 0.68 [0.56–0.83]; p<0.001); dabigatran was associated with a similar risk of stroke (HR 0.94 [0.65–1.35]), a lower risk of major bleeding (HR 0.57 [0.43–0.75]; p<0.001) and mortality (HR 0.68 [0.48–0.98]; p=0.04); rivaroxaban was associated with a lower risk of stroke (HR 0.69 [0.51–0.94]; p=0.02), major bleeding (HR 0.84 [0.72–0.99]; p=0.04), and mortality (HR 0.73 [0.58–0.91]; p=0.006) (Figures 2–4). No significant interaction between treatment and eGFR categories was found. Cumulative risks of stroke, major bleeding and mortality were shown in Figures 5–7, and no violation of the proportional hazards assumption was found.
Figure 2.
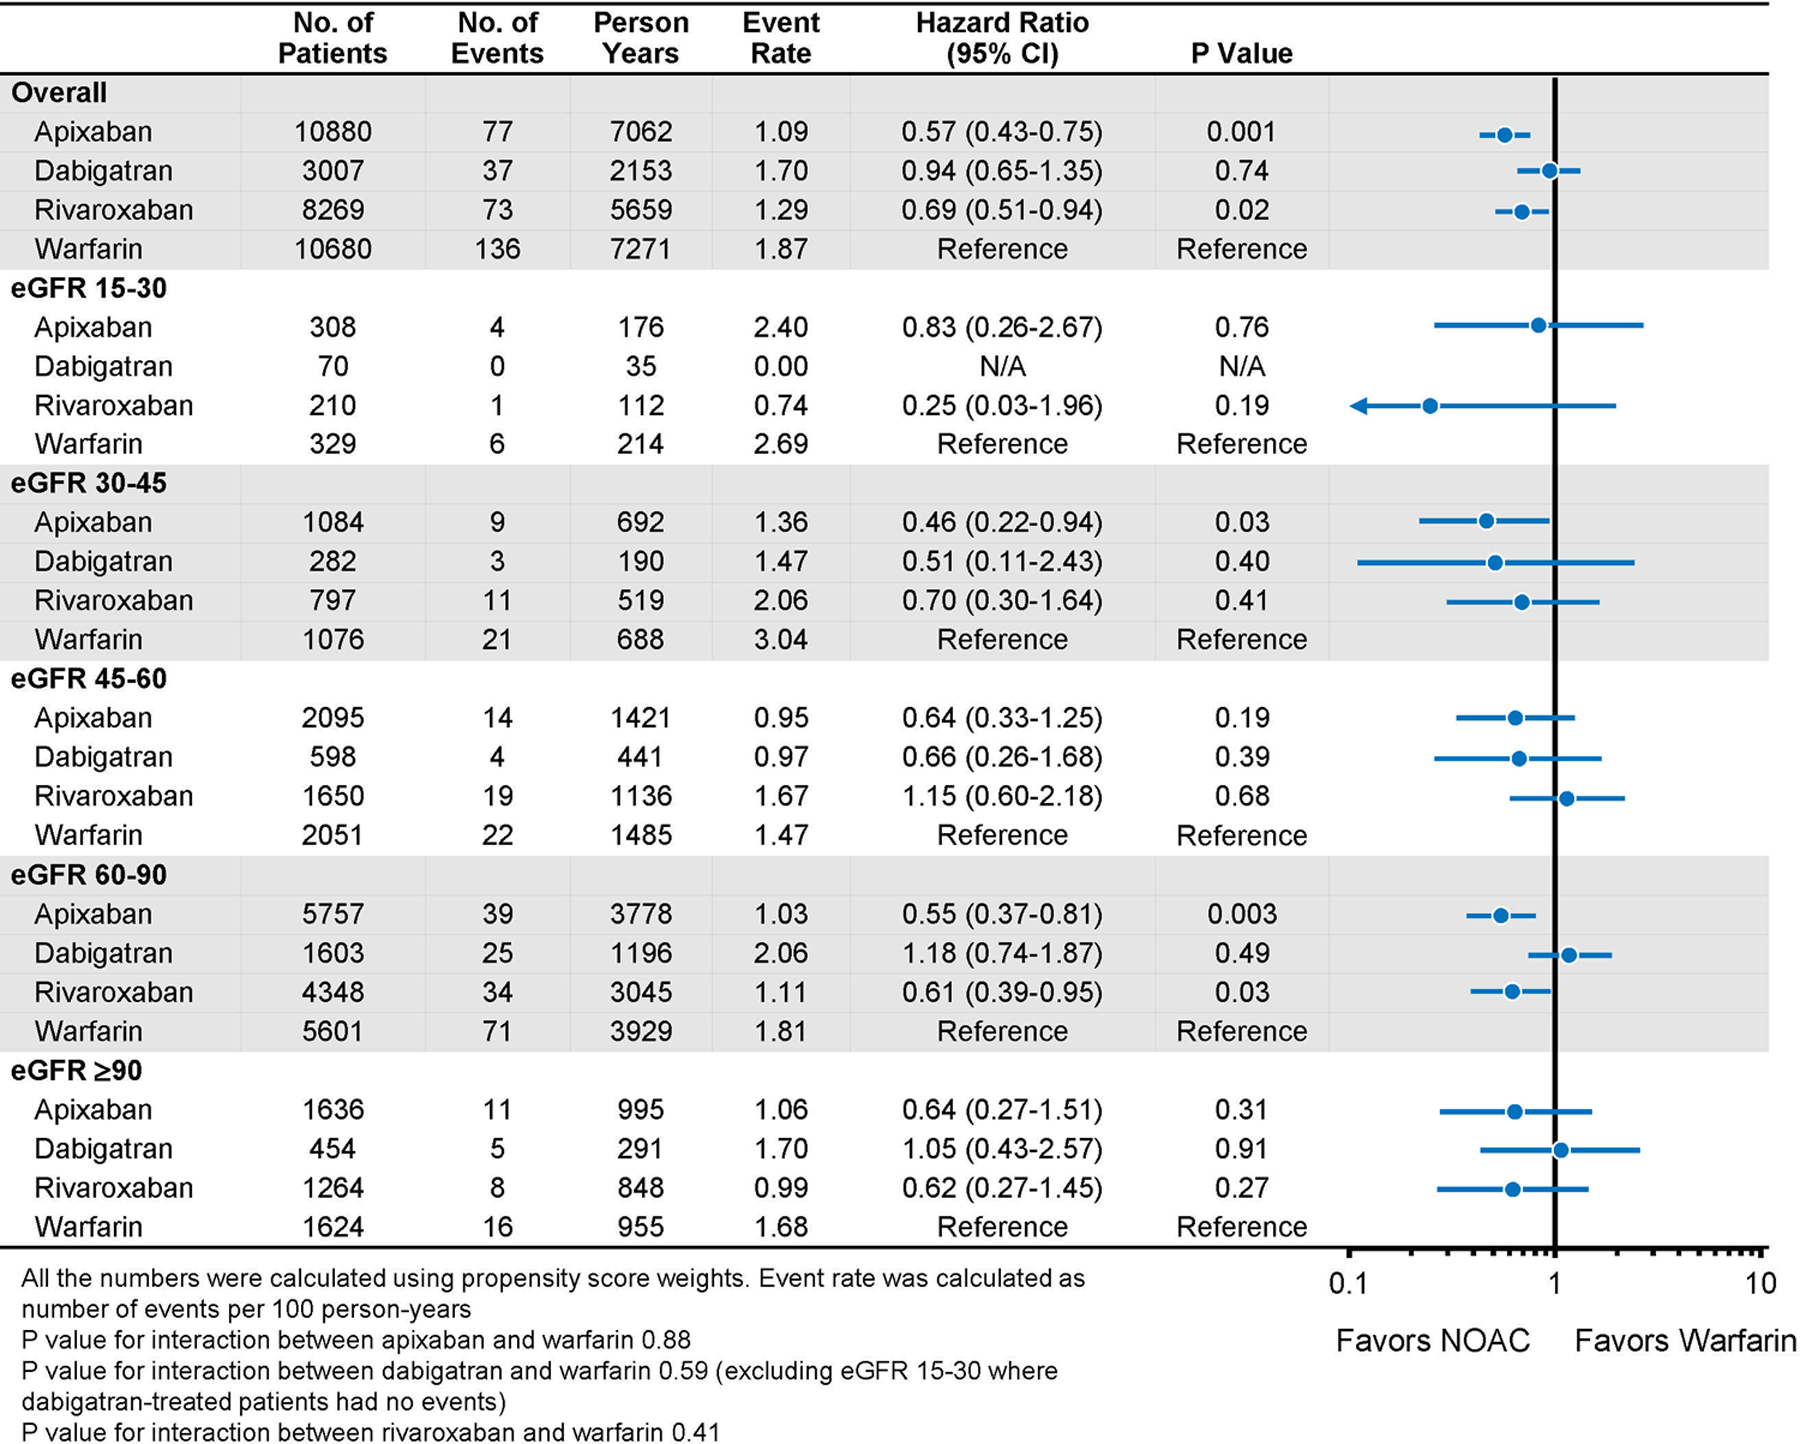
Stroke in Propensity-Score Weighted Population Stratified by Baseline Kidney Function
Figure 4.

All-Cause Mortality in Propensity-Score Weighted Population Stratified by Baseline Kidney Function
Figure 5.

Cumulative Risks of Stroke in Propensity Score-Weighted Patients
Figure 7.

Cumulative Risks of Mortality in Propensity Score-Weighted Patients
When directly comparing one NOAC to another, there was no difference in mortality in either the overall population or any eGFR subgroups (eTable 6). The mortality risk was high in patients treated with dabigatran in the eGFR 15–30 ml/min per 1.73 m2 stratum, but the confidence intervals were wide. Apixaban and dabigatran were associated with a lower risk of major bleeding than rivaroxaban (HR 0.61 [0.51–0.73]; p<0.001 for apixaban versus rivaroxaban; HR 0.67 [0.50–0.90]; p=0.007 for dabigatran versus rivaroxaban). Dabigatran was associated with a higher risk of stroke than apixaban (HR 1.65 [1.11–2.46]; p=0.01) (eTables 7 and 8). No significant interaction between treatment and eGFR categories was found for any outcome.
For secondary outcomes, apixaban, dabigatran, and rivaroxaban were associated with a lower risk of intracranial bleeding than warfarin (HR 0.44 [0.31–0.64]; p<0.001 for apixaban; HR 0.35 [0.17–0.74]; p=0.006 for dabigatran; and HR 0.47 [0.30–0.73]; p=0.001 for rivaroxaban). Apixaban and dabigatran were associated with a lower risk of gastrointestinal bleeding than warfarin (HR 0.54 [0.45–0.66]; p<0.001 for apixaban; HR 0.70 [0.51–0.96]; p=0.03 for dabigatran). Rivaroxaban was associated with a similar risk of gastrointestinal bleeding in comparison to warfarin (HR 0.98 [0.81–1.19]; p=0.87). In all the eGFR subgroups, each NOAC was associated with either significantly lower or no significantly different risk of intracranial bleeding or gastrointestinal bleeding in comparison to warfarin (eTables 9 and 10), although the confidence intervals for the 15–30 eGFR stratum were very wide for intracranial bleeding.
Assessment of Residual Confounding
First, the values and the proportion of missing values of the laboratory results were balanced by PS weighting, which provided some support to the assumption that after balancing on measured confounders, some unmeasured confounders would be balanced as well (Table 1). Second, no significant relationship between treatments and falsification endpoints (pneumonia or fracture) was found in the overall population or eGFR subgroups (eTables 11 and 12). These findings together suggested no evidence for substantial residual confounding.
Sensitivity Analyses
The baseline characteristics were well balanced in each of the eGFR subgroups, with the exception of the eGFR 15–30 ml/min/1.73 m2 group possibly due to the small number of patients. Sensitivity analyses adjusting for the residual imbalance in the regression models were nearly the same as the main findings (eTables 13–15). A total of 2,123 (9.1%) patients received a NOAC dose that was potentially inappropriate, including 595 (2.5%) patients who were overdosed and 1,528 (6.5%) patients who were underdosed. The results excluding these patients remained the same as the main analyses (eTables 16–19). 4,168 warfarin-treated patients had linked INR data, among whom 2,152 (51.6%) had a mean INR 2–3, 1,441 (34.6%) had a mean INR<2, and 575 (13.8%) had a mean INR>3. The analyses stratified by INR were largely consistent with the main findings. Each NOAC was associated with similar or lower risks of stroke, major bleeding, and mortality compared with warfarin in all INR subgroups (eTables 20–22). We only compared treatment stratified by INR and did not further stratify by both INR and eGFR subgroups, since the number of warfarin-treated patients was small and there was no event in some of the eGFR subgroups. 8,778 (25.4%) patients had ≥20% decline in eGFR during follow up. Each NOAC was still associated with similar or lower risks of stroke, major bleeding, and mortality in these patients (eTables 23–25).
Discussion
To the best of our knowledge, this is the largest study to date comparing different oral anticoagulants across the range of kidney function. The study found that, relative to warfarin, NOACs are used progressively less commonly as patients’ kidney function declines. However, each NOAC was consistently associated with similar or better outcomes compared with warfarin across the range of kidney function, a finding which suggests that NOACs may be reasonable options for stroke prevention among patients with AF regardless of the degree of kidney impairment although the statistical power is low in some eGFR subgroups.
Practice guidelines currently recommend NOACs over warfarin in most patients with AF.5 Although guidelines recommend monitoring kidney function, there is no recommendation that warfarin should be preferred in patients with reduced kidney function. However, in practice, the use of NOACs appeared to decrease even in patients with mildly decreased kidney function and further decreased as the severity of kidney disease increased. This practice pattern may partly reflect concerns that the renal clearance of NOACs coupled with the inability to monitor the level of anticoagulation may result in excess bleeding risk in patients with reduced kidney function. However, the comparative outcomes do not change across the range of kidney function. Therefore, the findings in this study do not support the preferential use of warfarin over NOACs in patients with reduced kidney function. Additional studies would be helpful to confirm our observations.
This study also provides an example of using real-world data to generate evidence where knowledge is lacking. All the pivotal NOAC trials excluded patients with severely reduced kidney function, and no trials have directly compared one NOAC with another. This study, which includes 1,060 patients with eGFR 15–30 ml/min/1.73m2, provides insight regarding the effectiveness and safety of NOACs in this population. Notably, the current study is also the largest study to date comparing NOACs across kidney function28–30 and found no difference in mortality among the three NOACs, but some differences in stroke or major bleeding in eGFR subgroups. However, the sample size was small and the confidence intervals were large, reflecting a high degree of uncertainty of evidence. Adequately powered trials should be conducted to determine the optimal treatment strategies in this population. In the absence of RCT data, the current study provides valuable real-world data to guide clinical decisions.
Our results comparing NOACs to warfarin are largely consistent with previous trials, but in the trials, the risk of major bleeding was similar when comparing dabigatran to warfarin and rivaroxaban to warfarin.12, 13 In the current study, dabigatran and rivaroxaban were associated with a lower risk of major bleeding than warfarin. This may be because the INR control is better in the trials than routine practice. In the sensitivity analysis comparing NOACs to warfarin-treated patients with INR 2–3, the risk of major bleeding was similar among patients treated with dabigatran, rivaroxaban and warfarin.
The current study was limited to patients with eGFR ≥15 ml/min/1.73 m2 since oral anticoagulants are generally recommended in most of these patients, and the main question is which drug to use.5, 9 In contrast, in patients with eGFR under 15 ml/min/1.73 m2 or on dialysis, the guidelines suggest it might be reasonable to prescribe warfarin or apixaban,9 but whether the benefit of stroke prevention outweighs the harm, and what doses to use to achieve net benefit remains unresolved. A recent study in the dialysis population found that apixaban was associated with better outcomes than warfarin.15
Limitations
This study has several limitations. First, the findings may be subject to residual confounding due to lack of randomization. However, the treatment groups were almost identical in 66 dimensions. Some of the measured variables (e.g., diabetes requiring insulin, systolic heart failure, prior treatment with ablation, cardioversion, anti-arrhythmic drugs, and medications for other chronic conditions), could be proxies for unmeasured risk factors. Furthermore, the tests of residual confounding provided some reassurance that there was no evidence for residual confounding.
Second, our study relied on administrative data to ascertain treatment episodes, baseline characteristics, and outcomes, but it is unlikely there is any systematic difference in the ascertainment of comorbidities and outcomes among different treatment groups, and thus, the misclassification should not meaningfully impact our comparisons between drugs.
Third, we did not calculate CrCl using the Cockcroft-Gault method due to the lack of body weight and height data. However, the CKD-EPI equation is recommended by current guidelines for evaluating kidney function and is widely used in clinical practice. The CKD-EPI equation has been used in a number of previous studies in this population.20, 31, 32
Fourth, the sample size for some of the subgroups was small and the confidence intervals of the point estimates were large which indicates uncertainty of evidence. This was especially the case for the eGFR 15–30 ml/min/1.73 m2 stratum.
Conclusions
In routine clinical practice, relative to warfarin, NOACs are used progressively less commonly as kidney function declines. However, each NOAC was consistently associated with at least equivalent effectiveness and safety compared with warfarin across the range of kidney function. Future randomized clinical trials are needed to provide more definitive data on the comparative efficacy and safety of different oral anticoagulant drugs, especially in patients with severely reduced kidney function.
Supplementary Material
Figure 3.
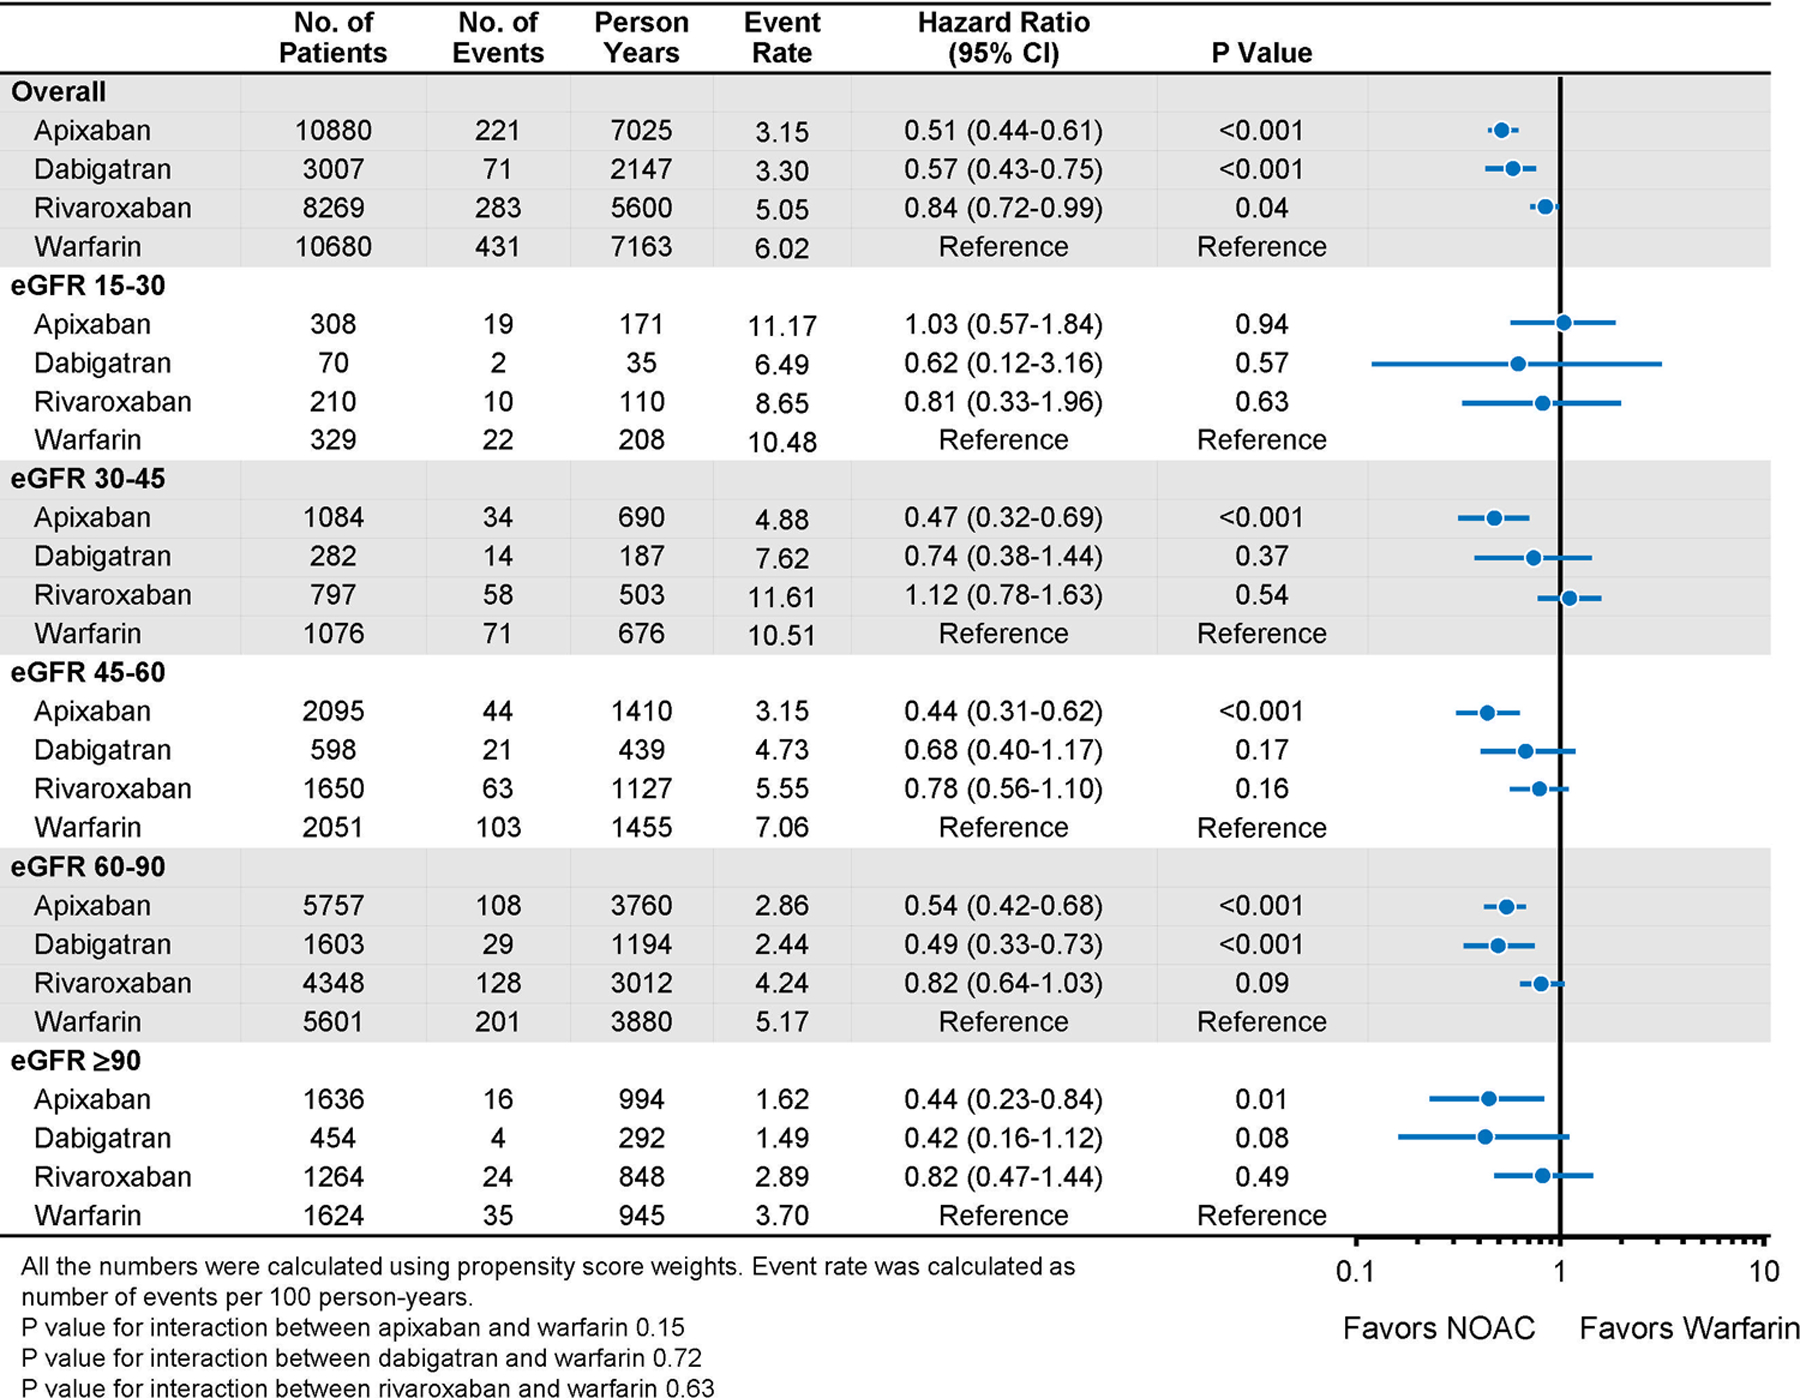
Major Bleeding in Propensity-Score Weighted Population Stratified by Baseline Kidney Function
Figure 6.

Cumulative Risks of Major Bleeding in Propensity Score-Weighted Patients
What is known?
Current practice guidelines recommend NOACs over warfarin for stroke prevention in patients with AF.
However, NOACs have greater renal clearance than warfarin and patients with severely decreased kidney function were excluded from the pivotal NOAC trials.
What the study adds
In routine clinical practice, NOACs were used less frequently than warfarin in patients with reduced kidney function.
NOACs were consistently associated with similar or better effectiveness and safety than warfarin in patients with different degrees of kidney impairment.
Acknowledgments
Xiaoxi Yao and Jonathan W. Inselman had full access to all the data in the study and take responsibility for the integrity of the data and the accuracy of the data analysis.
Funding/Support:
This study was funded by a Center of Excellence in Regulatory Science and Innovation (CERSI) grant to Yale University and Mayo Clinic from the US Food and Drug Administration (U01FD005938). Its contents are solely the responsibility of the authors and do not necessarily represent the official views of the HHS or FDA.
Role of the Funder/Sponsor:
Some of the authors (DJG, DBM, AMT, and MRS) are employees of the FDA; however, other officials at the FDA had no role in the design and conduct of the study; the collection, analysis, and interpretation of the data; the preparation of the manuscript; or the decision to submit the manuscript for publication. The manuscript was subject to administrative review prior to submission, but the content was not altered by this review.
Conflict of Interest Disclosures:
JSR has received research support through Yale University from Medtronic, Inc., the Food and Drug Administration (FDA) (U01FD004585), from the Centers of Medicare and Medicaid Services (CMS) (HHSM-500-2013-13018I), the Blue Cross Blue Shield Association from the Medical Device Innovation Consortium as part of the National Evaluation System for Health Technology (NEST), from the Agency for Healthcare Research and Quality (R01HS022882), from the National Heart, Lung and Blood Institute of the National Institutes of Health (NIH) (R01HS025164), and from the Laura and John Arnold Foundation. NDS has received research support through Mayo Clinic from the Centers of Medicare and Medicaid Innovation, from the Agency for Healthcare Research and Quality (R01HS025164; R01HS025402; R03HS025517; U19HS024075), from the National Heart, Lung and Blood Institute of the National Institutes of Health (NIH) (R56HL130496; R01HL131535), National Science Foundation, and from the Patient Centered Outcomes Research Institute (PCORI). NRD works under contract with CMS and reports consults for Amgen, Boehringer Ingelheim, Cytokinetics, Relypsa, and Novartis. BKN is a principal investigator or co-investigator on research grants from the NIH, VA HSR&D, the American Heart Association, Apple, Inc, and Toyota, receives compensation as Editor-in-Chief of Circulation: Cardiovascular Quality & Outcomes, a journal of the American Heart Association. He is a co-inventor on U.S. Utility Patent Number US15/356,012 (US20170148158A1), held by the University of Michigan and licensed to AngioInsight, Inc., in which he holds ownership shares (although it has yet to be funded). Disclosures provided by BKN in compliance with American Heart Association’s annual Journal Editor Disclosure Questionnaire are available at https://www.ahajournals.org/pb-assets/COI_09-2019.pdf. No other disclosures were reported
References:
- 1.Benjamin EJ, Wolf PA, D’Agostino RB, Silbershatz H, Kannel WB and Levy D. Impact of atrial fibrillation on the risk of death the Framingham Heart Study. Circulation. 1998;98:946–952. [DOI] [PubMed] [Google Scholar]
- 2.Chugh SS, Havmoeller R, Narayanan K, Singh D, Rienstra M, Benjamin EJ, Gillum RF, Kim YH, McAnulty JH Jr., Zheng ZJ, Forouzanfar MH, Naghavi M, Mensah GA, Ezzati M and Murray CJ. Worldwide epidemiology of atrial fibrillation: a Global Burden of Disease 2010 Study. Circulation. 2014;129:837–47. [DOI] [PMC free article] [PubMed] [Google Scholar]
- 3.Kannel WB, Wolf PA, Benjamin EJ and Levy D. Prevalence, incidence, prognosis, and predisposing conditions for atrial fibrillation: population-based estimates. The American journal of cardiology. 1998;82:2N–9N. [DOI] [PubMed] [Google Scholar]
- 4.Hart RG, Pearce LA and Aguilar MI. Meta-analysis: antithrombotic therapy to prevent stroke in patients who have nonvalvular atrial fibrillation. Annals of internal medicine. 2007;146:857–867. [DOI] [PubMed] [Google Scholar]
- 5.Kirchhof P, Benussi S, Kotecha D, Ahlsson A, Atar D, Casadei B, Castella M, Diener HC, Heidbuchel H, Hendriks J, Hindricks G, Manolis AS, Oldgren J, Popescu BA, Schotten U, Van Putte B, Vardas P, Agewall S, Camm J, Baron Esquivias G, Budts W, Carerj S, Casselman F, Coca A, De Caterina R, Deftereos S, Dobrev D, Ferro JM, Filippatos G, Fitzsimons D, Gorenek B, Guenoun M, Hohnloser SH, Kolh P, Lip GY, Manolis A, McMurray J, Ponikowski P, Rosenhek R, Ruschitzka F, Savelieva I, Sharma S, Suwalski P, Tamargo JL, Taylor CJ, Van Gelder IC, Voors AA, Windecker S, Zamorano JL and Zeppenfeld K. 2016 ESC Guidelines for the management of atrial fibrillation developed in collaboration with EACTS. Europace : European pacing, arrhythmias, and cardiac electrophysiology : journal of the working groups on cardiac pacing, arrhythmias, and cardiac cellular electrophysiology of the European Society of Cardiology. 2016;18:1609–1678. [DOI] [PubMed] [Google Scholar]
- 6.O’Brien EC, Kim S, Hess PL, Kowey PR, Fonarow GC, Piccini JP and Peterson ED. Effect of the 2014 atrial fibrillation guideline revisions on the proportion of patients recommended for oral anticoagulation. JAMA internal medicine. 2015;175:848–850. [DOI] [PubMed] [Google Scholar]
- 7.Yang F, Hellyer JA, Than C, Ullal AJ, Kaiser DW, Heidenreich PA, Hoang DD, Winkelmayer WC, Schmitt S, Frayne SM, Phibbs CS and Turakhia MP. Warfarin utilisation and anticoagulation control in patients with atrial fibrillation and chronic kidney disease. Heart (British Cardiac Society). 2017;103:818–826. [DOI] [PMC free article] [PubMed] [Google Scholar]
- 8.Kleinow ME, Garwood CL, Clemente JL and Whittaker P. Effect of chronic kidney disease on warfarin management in a pharmacist-managed anticoagulation clinic. Journal of managed care pharmacy : JMCP. 2011;17:523–30. [DOI] [PMC free article] [PubMed] [Google Scholar]
- 9.January CT, Wann LS, Calkins H, Chen LY, Cigarroa JE, Cleveland JC Jr., Ellinor PT, Ezekowitz MD, Field ME, Furie KL, Heidenreich PA, Murray KT, Shea JB, Tracy CM and Yancy CW. 2019 AHA/ACC/HRS Focused Update of the 2014 AHA/ACC/HRS Guideline for the Management of Patients With Atrial Fibrillation: A Report of the American College of Cardiology/American Heart Association Task Force on Clinical Practice Guidelines and the Heart Rhythm Society. J Am Coll Cardiol. 2019;74:104–132. [DOI] [PubMed] [Google Scholar]
- 10.Heidbuchel H, Verhamme P, Alings M, Antz M, Diener H-C, Hacke W, Oldgren J, Sinnaeve P, Camm AJ and Kirchhof P. Updated European Heart Rhythm Association Practical Guide on the use of non-vitamin K antagonist anticoagulants in patients with non-valvular atrial fibrillation. Europace. 2015;17:1467–507. [DOI] [PubMed] [Google Scholar]
- 11.Granger CB, Alexander JH, McMurray JJ, Lopes RD, Hylek EM, Hanna M, Al-Khalidi HR, Ansell J, Atar D and Avezum A. Apixaban versus warfarin in patients with atrial fibrillation. The New England journal of medicine. 2011;365:981–992. [DOI] [PubMed] [Google Scholar]
- 12.Connolly SJ, Ezekowitz MD, Yusuf S, Eikelboom J, Oldgren J, Parekh A, Pogue J, Reilly PA, Themeles E and Varrone J. Dabigatran versus warfarin in patients with atrial fibrillation. The New England journal of medicine. 2009;361:1139–1151. [DOI] [PubMed] [Google Scholar]
- 13.Patel MR, Mahaffey KW, Garg J, Pan G, Singer DE, Hacke W, Breithardt G, Halperin JL, Hankey GJ and Piccini JP. Rivaroxaban versus warfarin in nonvalvular atrial fibrillation. The New England journal of medicine. 2011;365:883–891. [DOI] [PubMed] [Google Scholar]
- 14.Giugliano RP, Ruff CT, Braunwald E, Murphy SA, Wiviott SD, Halperin JL, Waldo AL, Ezekowitz MD, Weitz JI and Špinar J. Edoxaban versus warfarin in patients with atrial fibrillation. The New England journal of medicine. 2013;369:2093–2104. [DOI] [PubMed] [Google Scholar]
- 15.Siontis KC, Zhang X, Eckard A, Bhave N, Schaubel DE, He K, Tilea A, Stack AG, Balkrishnan R, Yao X, Noseworthy PA, Shah ND, Saran R and Nallamothu BK. Outcomes Associated With Apixaban Use in Patients With End-Stage Kidney Disease and Atrial Fibrillation in the United States. Circulation. 2018;138:1519–1529. [DOI] [PMC free article] [PubMed] [Google Scholar]
- 16.Wallace PJ, Shah ND, Dennen T, Bleicher PA and Crown WH. Optum Labs: building a novel node in the learning health care system. Health affairs (Project Hope). 2014;33:1187–1194. [DOI] [PubMed] [Google Scholar]
- 17.Optum. Optum Research Data Assets. 2015. Accessed 6/22/2015 Available from: https://www.optum.com/content/dam/optum/resources/productSheets/5302_Data_Assets_Chart_Sheet_ISPOR.pdf.
- 18.Levey AS, Stevens LA, Schmid CH, Zhang YL, Castro AF, Feldman HI, Kusek JW, Eggers P, Van Lente F and Greene T. A new equation to estimate glomerular filtration rate. Annals of internal medicine. 2009;150:604–612. [DOI] [PMC free article] [PubMed] [Google Scholar]
- 19.McCaffrey DF, Griffin BA, Almirall D, Slaughter ME, Ramchand R and Burgette LF. A tutorial on propensity score estimation for multiple treatments using generalized boosted models. Statistics in medicine. 2013;32:3388–3414. [DOI] [PMC free article] [PubMed] [Google Scholar]
- 20.Yao X, Tangri N, Gersh BJ, Sangaralingham LR, Shah ND, Nath KA and Noseworthy PA. Renal Outcomes in Anticoagulated Patients With Atrial Fibrillation. J Am Coll Cardiol. 2017;70:2621–2632. [DOI] [PubMed] [Google Scholar]
- 21.Larsen TB, Skjøth F, Nielsen PB, Kjældgaard JN and Lip GY. Comparative effectiveness and safety of non-vitamin K antagonist oral anticoagulants and warfarin in patients with atrial fibrillation: propensity weighted nationwide cohort study. BMJ (Clinical research ed). 2016;353:i3189. [DOI] [PMC free article] [PubMed] [Google Scholar]
- 22.Nielsen PB, Skjoth F, Sogaard M, Kjaeldgaard JN, Lip GY and Larsen TB. Effectiveness and safety of reduced dose non-vitamin K antagonist oral anticoagulants and warfarin in patients with atrial fibrillation: propensity weighted nationwide cohort study. BMJ (Clinical research ed). 2017;356:j510. [DOI] [PMC free article] [PubMed] [Google Scholar]
- 23.Xu S, Ross C, Raebel MA, Shetterly S, Blanchette C and Smith D. Use of stabilized inverse propensity scores as weights to directly estimate relative risk and its confidence intervals. Value in health : the journal of the International Society for Pharmacoeconomics and Outcomes Research. 2010;13:273–7. [DOI] [PMC free article] [PubMed] [Google Scholar]
- 24.Goldstone AB, Chiu P, Baiocchi M, Lingala B, Patrick WL, Fischbein MP and Woo YJ. Mechanical or Biologic Prostheses for Aortic-Valve and Mitral-Valve Replacement. The New England journal of medicine. 2017;377:1847–1857. [DOI] [PMC free article] [PubMed] [Google Scholar]
- 25.Austin PC. Balance diagnostics for comparing the distribution of baseline covariates between treatment groups in propensity-score matched samples. Statistics in medicine. 2009;28:3083–3107. [DOI] [PMC free article] [PubMed] [Google Scholar]
- 26.Fine JP and Gray RJ. A proportional hazards model for the subdistribution of a competing risk. Journal of the American statistical association. 1999;94:496–509. [Google Scholar]
- 27.Prasad V and Jena AB. Prespecified falsification end points: can they validate true observational associations? Jama. 2013;309:241–242. [DOI] [PubMed] [Google Scholar]
- 28.Noseworthy PA, Yao X, Abraham NS, Sangaralingham LR, McBane RD and Shah ND. Direct comparison of dabigatran, rivaroxaban, and apixaban for effectiveness and safety in nonvalvular atrial fibrillation. Chest. 2016;150:1302–1312. [DOI] [PubMed] [Google Scholar]
- 29.Graham DJ, Reichman ME, Wernecke M, Hsueh YH, Izem R, Southworth MR, Wei Y, Liao J, Goulding MR, Mott K, Chillarige Y, MaCurdy TE, Worrall C and Kelman JA. Stroke, Bleeding, and Mortality Risks in Elderly Medicare Beneficiaries Treated With Dabigatran or Rivaroxaban for Nonvalvular Atrial Fibrillation. JAMA internal medicine. 2016;176:1662–1671. [DOI] [PubMed] [Google Scholar]
- 30.Graham DJ, Baro E, Zhang R, Liao J, Wernecke M, Reichman ME, Hu M, Illoh O, Wei Y, Goulding MR, Chillarige Y, Southworth MR, MaCurdy TE and Kelman JA. Comparative Stroke, Bleeding, and Mortality Risks in Older Medicare Patients Treated with Oral Anticoagulants for Nonvalvular Atrial Fibrillation. Am J Med. 2019;132:596–604. [DOI] [PubMed] [Google Scholar]
- 31.Yao X, Shah ND, Sangaralingham LR, Gersh BJ and Noseworthy PA. Non-vitamin K antagonist oral anticoagulant dosing in patients with atrial fibrillation and renal dysfunction. J Am Coll Cardiol. 2017;69:2779–2790. [DOI] [PubMed] [Google Scholar]
- 32.Yao X, Shah ND, Sangaralingham LR, Gersh BJ and Noseworthy PA. Reply: NOAC Dosing in Patients With Atrial Fibrillation and Renal Dysfunction. J Am Coll Cardiol. 2017;70:2734–2735. [DOI] [PubMed] [Google Scholar]
Associated Data
This section collects any data citations, data availability statements, or supplementary materials included in this article.