

Summary
Anti-virulence therapies are under active investigation as antibiotic alternatives; however, their identification from large-scale chemical libraries poses a unique challenge. The dispensability of virulence factors for growth in vitro precludes conventional, optical density-based screening methods. Here, we provide a protocol for high-throughput screening with a cell-based, promoter reporter platform. We describe the use of this method for the identification of anti-SPI-2 inhibitors specific to Salmonella Typhimurium, which may be modified to investigate other virulence factors.
For complete details on the use and execution of this protocol, please refer to Tsai et al. (2020).
Graphical Abstract
Highlights
-
•
An optimized protocol to identify inhibitors of Salmonella pathogenicity island 2
-
•
Considerations for target selection and high-throughput screen design
-
•
Guidelines for statistical analysis of chemical screening data
Anti-virulence therapies are under active investigation as antibiotic alternatives; however, their identification from large-scale chemical libraries poses a unique challenge. The dispensability of virulence factors for growth in vitro precludes conventional, optical density-based screening methods. Here, we provide a protocol for high-throughput screening with a cell-based, promoter reporter platform. We describe the use of this method for the identification of anti-SPI-2 inhibitors specific to Salmonella Typhimurium, which may be modified to investigate other virulence factors.
Before You Begin
Experimental Design
Note: In this protocol, we describe a chemical screening approach to find inhibitors of sseA promoter activity, as a proxy for two-component system (TCS) inhibitors against SPI-2 in Salmonella Typhimurium. We selected the sseA promoter in order to maximize the accessible target space of our chemical screen, and to serve as a proxy for the SPI-2 virulence locus. sseA receives transcriptional input from multiple TCSs (e.g. SsrA-SsrB, PhoQ-PhoP), so we reasoned that inhibitors of sseA were likely to act at or upstream of its promoter.
-
1.
To select a regulatory region of interest for a similar screening effort, consider diversity in target space – this may be supported by multiple genotypic deletions being deficient for promoter activity.
-
2.
If desired, this approach can be adapted to screen for inhibitors of non-virulence pathways, to guide other target-based chemical screening efforts (e.g. a similar promoter reporter plasmid can be generated to approximate a specific bacterial stress response, to enrich for a desired mechanism of action among screening compounds).
Key Resources Table
| REAGENT or RESOURCE | SOURCE | IDENTIFIER |
|---|---|---|
| Bacterial and Virus Strains | ||
| Wild-type Salmonella Typhimurium | Lab stock | SL1344 |
| Escherichia coli TOP10 | Invitrogen | Cat#C404010 |
| Wild-type Salmonella Typhimurium pGEN-luxCDABE | (Lane et al., 2007), Addgene | Cat#44918 |
| Wild-type Salmonella Typhimurium pGEN-PsseA-luxCDABE | (Osborne and Coombes, 2011) | N/A |
| Chemicals, Peptides, and Recombinant Proteins | ||
| Potassium chloride (KCl) | BioShop Canada | Cat#POC888.500 |
| Ammonium sulfate ((NH4)2SO4) | BioShop Canada | Cat#AMP303.500 |
| Potassium sulfate (K2SO4) | Sigma-Aldrich | Cat#P0772 |
| MES sodium salt | BioShop Canada | Cat#MES504 |
| Potassium phosphate dibasic (K2HPO4) | BioShop Canada | Cat#PPD303.1 |
| Potassium phosphate monobasic (KH2PO4) | Fisher Scientific | Cat#P380 |
| Casein acid hydrolysate (casamino acids) | BioShop Canada | Cat#CAA503 |
| Glycerol | BioShop Canada | Cat#GLY004.4 |
| Magnesium chloride (MgCl2) | Sigma-Aldrich | Cat#M2670 |
| Luria-Bertani broth (LB) mix | BioShop Canada | Cat#LBL407.5 |
| Agar | BioShop Canada | Cat#AGR003.5 |
| 10× PBS Buffer | BioShop Canada | Cat#PBS415.1 |
| FastDigest KpnI | ThermoFisher | Cat#FD0054 |
| FastDigest Eco105I (SnaBI) | ThermoFisher | Cat#FD0404 |
| 10× FastDigest Buffer | ThermoFisher | Cat#B64 |
| 10× T4 DNA Ligase Buffer | ThermoFisher | Cat#B69 |
| T4 DNA Ligase | ThermoFisher | Cat#15224041 |
| ATP | Sigma-Aldrich | Cat#A1852-1VL |
| Dimethyl sulfloxide (DMSO) | Sigma-Aldrich | Cat#2650 |
| Ampicillin | Sigma-Aldrich | Cat#A0166 |
| Rifampicin | Sigma-Aldrich | Cat#R3501 |
| Critical Commercial Assays | ||
| Presto™ Mini Plasmid Kit | FroggaBio | Cat#PDH300 |
| GenepHlow™ Gel/PCR Kit | FroggaBio | Cat#FDH300 |
| Phusion™ High-Fidelity DNA Polymerase | ThermoFisher | Cat#F530S |
| Taq DNA Polymerase | ThermoFisher | Cat#EP0402 |
| QIAamp DNA Mini Kit | Qiagen | Cat#51304 |
| Oligonucleotides | ||
| Promoter fwd (KpnI restriction site): 5′-ggggtaccgcaaggttcaaccattacttg-3′ | (Osborne and Coombes, 2011) | N/A |
| Promoter rev (SnaBI restriction site): 5′-cgatacgtattacgcagcctttttctttatca-3′ | (Osborne and Coombes, 2011) | N/A |
| Screening fwd: 5′-gctctgtcattttctgaaactcttc-3′ | This paper | N/A |
| Screening rev: 5′-tggattgcactaaatcatcactttc-3′ | This paper | N/A |
| Recombinant DNA | ||
| pGEN-luxCDABE | (Lane et al., 2007) | N/A |
| pGEN-PsseA-luxCDABE | (Osborne and Coombes, 2011) | N/A |
| Software and Algorithms | ||
| R version 3.2.2 | CRAN | r-project.org |
| GraphPad Prism 8.0 | GraphPad | N/A |
| RStudio version 1.0.143 | RStudio | www.rstudio.com |
| Other | ||
| Biomek FXP Automated Workstation | Beckman Coulter Life Sciences | N/A |
| Labcyte® Echo® 525 Acoustic Liquid Handler | Beckman Coulter Life Sciences | N/A |
| 384-well, black, clear flat bottom microplates | Corning | Cat#3542 |
| 96-well, black, clear flat bottom microplates | Corning | Cat#3614 |
| Synergy Neo2 multi-mode reader | Biotek | N/A |
| Gene Pulser Xcell™ Electroporation System | Bio-Rad | Cat#165-2660 |
| Gene Pulser®/MicroPulser™ 0.2 cm cuvette | Bio-Rad | Cat#165-2082 |
| Centrifuge for 1.5, 15, 50 mL tubes | N/A | N/A |
| Thermocycler | N/A | N/A |
| Agarose/DNA gel station | N/A | N/A |
| PCR tubes, 8-well strips | VWR | Cat#93001-118 |
| 1.5 mL Eppendorf tubes | N/A | N/A |
| 15, 50 mL Falcon conical tubes | N/A | N/A |
Materials and Equipment
Alternatives: Throughout this protocol, we refer to several specific kits for many standard molecular biology techniques. Investigators may substitute other commercially available kits as needed.
5× LPM Salts
| Reagent | Stock Concentration | Final Concentration | Add to 500 mL |
|---|---|---|---|
| KCl | N/A | 25 mM | 0.932 g |
| (NH4)2SO4 | N/A | 37.5 mM | 2.478 g |
| K2SO4 | N/A | 2.5 mM | 0.218 g |
| MES sodium salt | N/A | 400 mM | 43.44 g |
| ddH20 | Up to 500 mL |
0.1 M PO43− Buffer
| Reagent | Stock Concentration | Final Concentration | Add to 1 L |
|---|---|---|---|
| K2HPO4 | 1 M | 80.2 mM | 80.2 mL |
| KH2PO4 | 1 M | 19.8 mM | 19.8 mL |
| ddH2O | Up to 1 L, pH 7.4 |
LPM Growth Media
| Reagent | Stock Concentration | Final Concentration | Add to 500 mL |
|---|---|---|---|
| 5× LPM salts | 5× | 1× | 100 mL |
| Casamino acids | 10% (w/v) | 0.1% v/v | 5 mL |
| Glycerol | 50% (v/v) | 38 mM (0.3% v/v) | 3 mL |
| MgCl2 | 25 mM | 24 μM | 480 μL |
| PO43− buffer | 0.1 M | 337 μM PO43− | 1.685 mL |
| ddH2O | Up to 500 mL |
LPM growth media is low in pH and Mg2+ levels and is known to induce SPI-2 gene expression in Salmonella Typhimurium (Coombes et al., 2004). Prepare the 5× LPM salts and 0.1 M PO43− buffer as separate solutions and autoclave to sterilize. To prepare LPM growth media, combine the salts solution, casamino acids, glycerol, MgCl2, and phosphate buffer. Adjust the pH to 5.8 and filter sterilize prior to use. Once filter sterilized, LPM can be stored at 22–25°C for several months.
Step-By-Step Method Details
Generate Promoter Reporter Strain
Timing: 4–5 days
Introduce the sseA promoter into a luciferase reporter plasmid. The division of steps across days is as follows: steps 1–8 (day 1), steps 9–11 (day 2), steps 12–18 (day 3), step 19 (day 4), step 20 (day 5).
-
1.
Extract genomic DNA from a 5 mL overnight culture of wild-type S. Typhimurium grown in LB. Follow instructions in the manufacturer’s protocol (QIAamp DNA Mini Kit).
CRITICAL:S. Typhimurium is a biosafety level 2 pathogen. Employ standard biosafety procedures while working with this organism.
-
2.
Miniprep the luciferase reporter plasmid from a 5 mL overnight culture of wild-type S. Typhimurium harboring pGEN-luxCDABE grown in LB supplemented with 100 μg/mL ampicillin. Follow instructions in the manufacturer’s protocol (Presto™ Mini Plasmid Kit), but elute in ∼30 μL water. From a 5 mL culture, a yield of 10–40 μg plasmid DNA is expected.
Note: The pGEN-luxCDABE plasmid can also be propagated in other common bacterial strains, such as E. coli.
-
3.
Amplify the regulatory region upstream of the sseA gene using the “Promoter fwd” and “Promoter rev” primers (which contain the KpnI and SnaBI restriction sites) with Phusion™ DNA Polymerase according to the manufacturer’s protocol, using the following cycling conditions:
| PCR Cycling Conditions | |||
|---|---|---|---|
| Steps | Temperature | Time | Cycles |
| Initial Denaturation | 98°C | 30 s | 1 |
| Denaturation | 98°C | 10 s | 30 |
| Annealing | 55°C | 30 s | |
| Extension | 72°C | 30 s | |
| Final extension | 72°C | 5 min | 1 |
| Hold | 4°C | Forever | |
4 μL 5× Phusion™ High-Fidelity Buffer
1.4 μL 10 mM dNTPs
1 μL 10 μM forward primer
1 μL 10 μM reverse primer
50–250 ng template (wild-type S. Typhimurium genomic DNA)
ddH2O up to 20 μL
-
4.
Run an agarose gel to verify the size and purity of the PCR product, which should be ∼1,000 bp (see Problem 1). Purify the remaining PCR product following instructions in the manufacturer’s protocol (GenepHlow™ Gel/PCR Kit), but elute in ∼30 μL water.
-
5.
Digest both the luciferase plasmid and the PCR product in separate reactions. Incubate each mixture at 37°C for 30–60 min.
2 μL FastDigest KpnI
2 μL FastDigest Eco105I (SnaBI)
4 μL 10× FastDigest Buffer
2–4 μg plasmid DNA or 0.2–0.4 μg PCR product
ddH2O up to 40 μL
-
6.
Run an agarose gel to purify both the digested PCR product and plasmid, which should be ∼11,000 bp and ∼1,000 bp, respectively. Follow instructions in the manufacturer’s protocol (GenepHlow™ Gel/PCR Kit), but elute in ∼30 μL water.
-
7.
Ligate the digested PCR product into the luciferase plasmid. Leave the ligation reaction at 22°C for 15 min - 1 h.
1 μL 10× T4 DNA Ligase Buffer
0.5 μL 10 mM ATP
0.1 μL T4 DNA Ligase
20–100 ng digested plasmid
5:1 (molar ratio over plasmid) digested PCR product
2.4 μL ddH2O
Pause Point: Ligation reactions may be temporarily stored at 4°C. It is also possible to perform this ligation by incubating at 22°C for 2 h, then leaving for ∼18–20 h in a thermocycler at 16°C.
-
8.
Transform the entire ligation reaction (∼10 μL) into 50 μL of E. coli TOP10 competent cells according to the manufacturer’s protocol. After recovering for 45–60 min at 37°C (shaking at 250 rpm), plate cells onto an LB agar plate supplemented with 200 μg/mL ampicillin. Incubate the plate at 37°C for ∼18 h.
Note: It is possible to eliminate the recovery time from this step, as the pGEN-luxCDABE plasmid is ampicillin-resistant.
-
9.
Pick several colonies at random (see Problem 2) to verify the successful cloning of the sseA promoter by colony PCR with Taq DNA Polymerase, using the “Screening fwd” and “Screening rev” primers. Set up the following mix:
2.5 μL 10× Taq Buffer
2.5 μL dNTP Mix
1 μL 10 μM forward primer
1 μL 10 μM reverse primer
2 μL 25 mM MgCl2
0.75 μL Taq DNA Polymerase
ddH2O up to 25 μL
Aliquot into PCR tubes, then (using a pipette tip) inoculate each tube with an individual colony. Swirl tip in each tube briefly prior to removal.
-
10.
Use the following parameters to perform the colony PCR protocol in a thermocycler.
| PCR Cycling Conditions | |||
|---|---|---|---|
| Steps | Temperature | Time | Cycles |
| Initial Denaturation | 95°C | 10 min | 1 |
| Denaturation | 95°C | 30 s | 30 |
| Annealing | 55°C | 30 s | |
| Extension | 72°C | 1 min | |
| Final extension | 72°C | 5 min | 1 |
| Hold | 4°C | Forever | |
Note: The 10 min initial denaturation stage is specific to colony PCR.
-
11.
Run an agarose gel to verify the size of the PCR product (successful clones should be ∼1,000 bp). Select 1–2 positive colonies that have been confirmed via colony PCR, and inoculate into 5 mL LB containing 100 μg/mL ampicillin. Incubate the cultures at 37°C for ∼18 h with shaking at 250 rpm.
-
12.
Miniprep the luciferase reporter plasmid (pGEN-PsseA-luxCDABE) from the overnight culture. Follow instructions in the manufacturer’s protocol (Presto™ Mini Plasmid Kit), but elute in ∼30 μL water.
Note: Before proceeding, the plasmid should be Sanger sequenced to verify the sequence of the inserted promoter.
-
13.
Prepare electrocompetent S. Typhimurium cells for transformation.
-
a.
Grow a 5 mL antibiotic-free LB culture of wild-type S. Typhimurium by incubating at 37°C for ∼18 h with shaking at 250 rpm.
-
b.
Dilute 1 mL of overnight culture into 50 mL of LB, and incubate the culture at 37°C with shaking at 250 rpm until an OD of 0.5–0.6 (mid-log phase, ∼2.5 h).
-
c.
Transfer the cells to two 50 mL Falcon conical tubes (∼25 mL culture per tube). Pellet by centrifugation for 10 min at 3,600 g in a pre-chilled (4°C) centrifuge. Remove promptly and discard supernatant.
-
d.
Wash the cells by vigorously resuspending in 10 mL ice-cold sterile ddH2O. Pellet by centrifugation for 10 min at 3,600 g in a pre-chilled (4°C) centrifuge. Remove promptly and discard supernatant.
-
e.
Repeat step d once.
-
f.
Resuspend each pellet in ∼250 μL ice-cold, sterile 10% (v/v) glycerol. Divide into 50 μL aliquots in cold 1.5 mL Eppendorf tubes, kept on ice.
-
14.
If proceeding directly from step 13, immediately add ∼3–4 μL of the pGEN-PsseA-luxCDABE plasmid to one tube of electrocompetent cells and incubate on ice briefly (∼3 min). If using previously made, frozen electrocompetent cells, first thaw on ice for ∼5 min.
-
15.
Carefully transfer the competent cell/plasmid mixture into a pre-chilled electroporation cuvette and perform the electroporation using a Gene Pulser Xcell™ Electroporation System at 2.5 kV.
-
16.
After the pulse, immediately transfer the mixture out of the cuvette and into a sterile 1.5 mL Eppendorf tube containing ∼1 mL LB.
-
17.
Incubate the LB mixture for ∼1 h at 37°C with shaking at 250 rpm.
-
18.
Plate 100 μL of the transformed cells onto an LB agar plate supplemented with 200 μg/mL ampicillin. Incubate the plate at 37°C for ∼18 h.
-
19.
Pick a single colony of the pGEN-PsseA-luxCDABE-harboring S. Typhimurium strain and inoculate 5 mL of LB with 100 μg/mL ampicillin. Incubate the culture at 37°C for ∼18 h with shaking at 250 rpm.
-
20.
Prepare a glycerol stock of the pGEN-PsseA-luxCDABE-harboring S. Typhimurium strain with ∼1 mL of the overnight culture and ∼500 μL of 50% (v/v) sterile glycerol. Store at −80°C for long-term usage.
Verify Inducing Conditions for Promoter Activity
Validate the optimal growth conditions for sseA promoter induction and measure bioluminescence production (Figure 1A). The division of steps across days is as follows: step 21 (day 1), steps 22–26 (day 2), step 27 (day 3–4).
Note: These growth conditions are specific to inducing SPI-2 gene expression in S. Typhimurium and may be modified by investigators to suit a different regulatory region of interest.
-
21.
Grow a 5 mL LB culture of pGEN-PsseA-luxCDABE-harboring S. Typhimurium supplemented with 100 μg/mL ampicillin.
-
22.
Dilute 100 μL of overnight culture into 5 mL of LB, and incubate the culture at 37°C with shaking at 250 rpm until an OD of 0.5–0.6 (mid-log phase, ∼2.5 h).
-
23.
Remove 10 μL of mid-log phase cells from the growing culture and add to a sterile 1.5 mL Eppendorf tube. Pellet by centrifugation for 2 min at ∼14,000 g in a centrifuge, then resuspend in 10 μL of PBS. Repeat once, then add the entire cell suspension into 1 mL of LPM. Aliquot 100 μL of this mixture into each of 3 wells in a 96-well black, clear flat bottom microplate.
Note: Any brand of microplate may be used, but it is essential that the plate be opaque between wells to avoid luminescence signal contamination between samples.
-
24.
Immediately read luminescence and OD600 of the 3 wells using a Synergy Neo2 multi-mode reader.
Note: Any other plate reader (with an appropriate luminescence filter and the ability to read absorbance) may be substituted.
-
25.
Incubate the plate at 37°C (without shaking) for ∼6 h. Read luminescence and OD600 every 60 min.
-
26.
Normalize luminescence values to OD600 values at each time point and plot these data against time. The curve should reach a maximum normalized luminescence value after ∼5–6 h of growth. This will be the time point at which promoter activity will be measured during the chemical screen.
Note: This time point may be different for other target promoters.
-
27.
Repeat this assay in biological triplicate to validate the conditions required for promoter induction.
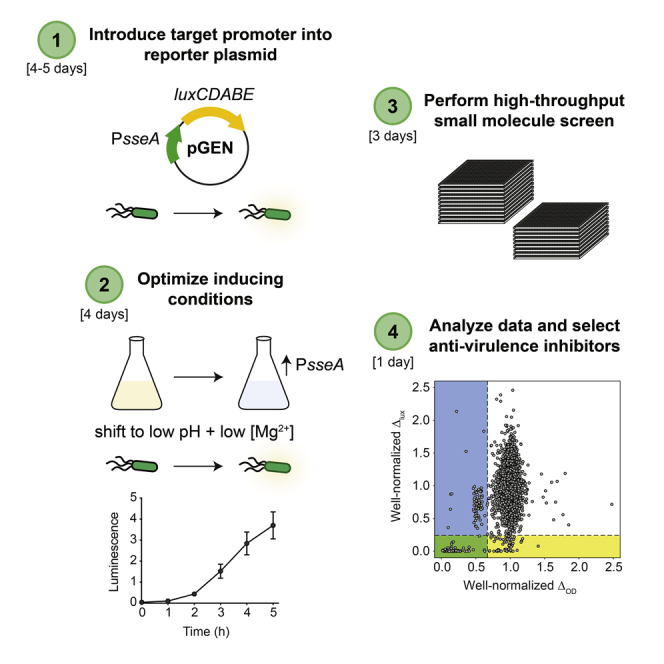
Figure 1.

Overview of the High-Throughput Screening Approach
(A) Schematic of inducing conditions for sseA promoter activity.
(B) Illustration of experimental conditions for Z-prime determination and high-throughput screening. T0lux is the luminescence read immediately after bacterial addition (0 h), T6lux is the luminescence read after a 6 h incubation, T0OD is the OD600 read immediately after bacterial addition, T18OD is the OD600 read after a 18 h incubation. Δlux is calculated by subtracting T0lux from T6lux, ΔOD is calculated by subtracting T0OD from T18OD.
Determine Z-prime
The Z-prime is a statistical parameter to determine the degree of sensitivity in a particular assay. High-throughput screens require an easily detectable window between low and high signals, which is approximated by Z-prime calculation. For more details on the applications of this statistical effect size on high-throughput screening, see (Zhang et al., 1999). The division of steps across days is as follows: step 28 (day 1), steps 29–32 (day 2), steps 33–35 (day 3).
Note: At this stage, the assay is transitioned into 384-well plate format for compatibility with the well density of the compound plates in the chemical library. Investigators may adjust this as needed.
-
28.
Grow a 5 mL LB culture of pGEN-PsseA-luxCDABE-harboring S. Typhimurium supplemented with 100 μg/mL ampicillin. Incubate the culture at 37°C with shaking at 250 rpm for ∼18 h.
-
29.
Dilute 100 μL of overnight culture into 5 mL of LB supplemented with 100 μg/mL ampicillin. Incubate the culture at 37°C with shaking at 250 rpm until an OD of 0.5–0.6 (mid-log phase, ∼2.5 h).
-
30.
During this incubation step, prepare two 384-well black, clear flat bottom microplates to determine the Z-prime for the high-throughput screen.
-
a.
Designate rows A-P/columns 1–12 as “high signal” wells and rows A-P/columns 13–24 as “low signal” wells.
-
b.
Using the Labcyte® Echo® 525 Acoustic Liquid Handler, fill all “high signal” wells with 60 nL DMSO and all “low signal” wells with 60 nL rifampicin (50 mg/mL dissolved in DMSO). Follow the manufacturer’s protocol for guidelines on volume transfer.
Note: The Labcyte® Echo® 525 Acoustic Liquid Handler is one of several instruments that may be used for low-volume transfer of screening compounds into assay plates. Other machines may be substituted.
Note: Any antibiotic that the bacterial strain is susceptible to may be substituted for rifampicin in “low signal” wells. Although a growth-inhibitory antibiotic is imperfect as a positive control for this assay (as we are interested in compounds that affect only sseA promoter activity and not viability), this is sufficient to approximate the potential for reduced luminescence signal.
-
31.
Remove 700 μL of mid-log phase cells from the growing culture and add to a sterile 1.5 mL Eppendorf tube. Pellet by centrifugation for 2 min at ∼14,000 g in a centrifuge, then resuspend in 700 μL of PBS. Repeat once, then add the entire cell suspension into 70 mL of LPM. With the Biomek FXP Automated Workstation, fill all wells of both 384-well plates with this cell mixture, dispensing 30 μL per well. Follow the manufacturer’s protocol for guidelines on liquid handling.
Note: The Biomek FXP Automated Workstation is one of several instruments that may be used for liquid handling for growth media during screening assays. Other machines or forms of pipette automation may be substituted.
Note: At this point, antibiotic selection in LPM to maintain the luciferase plasmid is no longer possible, as the presence of ampicillin may interfere with the accuracy of chemical screening through unexpected drug-drug interactions. The pGEN plasmid (Lane et al., 2007) contains the hok/sok toxin-antitoxin system for maintenance.
-
32.
Immediately read luminescence (T0lux) and OD600 (T0OD) of both 384-well plates using a Synergy Neo2 multi-mode reader. Incubate the plates at 37°C (without shaking) for ∼18 h. Read luminescence at ∼6 h after the first read (T6lux).
-
33.
Remove plates from the incubator and read OD600 (T18OD).
-
34.
Quantify luminescence production (Δlux) by subtracting T0lux from T6lux. Quantify growth (ΔOD) by subtracting T0OD from T18OD. These two parameters are the functional readouts that will be monitored in the chemical screen (Figure 1B).
Note: OD600 is not recorded at the 6 h time point in this protocol to decrease the time required to read each plate, for better synchrony across assay plates. For the purposes of this first stage of compound identification, T18OD serves as a crude estimate of growth-inhibitory activity per compound. In later stages of experimentation, we recommend that investigators kinetically monitor bacterial growth in the presence of each hit compound to determine full dose-response profiles (MacNair et al., 2016).
-
35.
Calculate the Z-prime for both Δlux and ΔOD and using the following equation:
A Z-prime between 0.5 and 1 is considered to be sufficient for proceeding with the screening assay (see Problem 3).
Perform High-Throughput Screen
Conduct high-throughput small molecule screen to identify anti-virulence inhibitors (Figure 1B). The division of steps across days is as follows: step 36 (day 1), steps 37–41 (day 2), steps 42–43 (day 3).
Note: The implementation of this protocol in (Tsai et al., 2020) involved a chemical screen of 48,787 compounds, which included diverse small synthetic molecules, known biological actives, and natural products. Here, we describe the screening and data analysis process for a subset of 3,921 known biological actives from this compound collection. In our high-throughput screening facility, the compounds in this subset are arrayed across 13 unique chemical library plates, which include several empty wells.
-
36.
Grow a 5 mL LB culture of pGEN-PsseA-luxCDABE-harboring S. Typhimurium supplemented with 100 μg/mL ampicillin. Incubate the culture at 37°C with shaking at 250 rpm for ∼18 h.
-
37.
At least 3–4 h before screening, remove all chemical library plates from frozen storage to allow compounds in DMSO to thaw.
-
38.
Dilute 200 μL of overnight culture into 10 mL of LB supplemented with 100 μg/mL ampicillin. Incubate the culture at 37°C with shaking at 250 rpm until an OD of 0.5–0.6 (mid-log phase, ∼2.5 h).
-
39.
During this incubation step, fill all assay plates (384-well black, clear flat bottom microplates) with compounds. Each compound plate should be assayed in technical duplicate (13 unique assay plates, 26 total plates).
-
a.
Use the Labcyte® Echo® 525 Acoustic Liquid Handler to transfer 60 nL of each compound from 5 mM library stocks (to a final concentration of 10 μM compound per well).
-
b.
While loading plates, protect those that have already been filled from light due to the varied sensitivity of certain compounds.
Note: Volume transferred per well can be adjusted depending on the stock concentrations of screening compounds in the library.
-
40.
Remove 4 mL of mid-log phase cells from the growing culture and add to a sterile 15 mL Falcon conical tube. Pellet by centrifugation for 10 min at 3,600 g in a centrifuge, then resuspend in 4 mL of PBS. Repeat once, then add the entire cell suspension into 400 mL of LPM. With the Biomek FXP Automated Workstation, fill all wells of each assay plate with this cell mixture, dispensing 30 μL per well. Follow the manufacturer’s protocol for guidelines on liquid handling.
-
41.
Immediately read luminescence (T0lux) and OD600 (T0OD) of all 384-well plates using a Synergy Neo2 multi-mode reader. Incubate the plates at 37°C (without shaking) for ∼18 h. Read luminescence at ∼6 h after the first read (T6lux).
-
42.
Remove plates from the incubator and read OD600 (T18OD).
-
43.
Quantify luminescence production (Δlux) by subtracting T0lux from T6lux. Quantify growth (ΔOD) by subtracting T0OD from T18OD (see Problem 4).
Note: For this protocol, we recommend a maximum of ∼50 total assay plates per day (25 compound plates in technical duplicate). Steps 36–43 may be repeated across a number of days to process more compounds. An assay plate should be reserved for determining the Z-prime for each day of screening, to ensure consistency in luminescence production across days.
Expected Outcomes
The procedures described in this protocol can serve as a reference point to design high-throughput screens to identify compounds that perturb regulatory signaling in other bacterial species. The “Before You Begin” section describes the rationale underlying target selection for this sseA promoter-based screen, and similar reasoning may be applied for investigators to adapt this approach to their hypotheses. The number of hit compounds identified from a screen of this nature will depend largely on both the target promoter selected as well as the types of compounds in the screening library. In the research article associated with this protocol (Tsai et al., 2020), we obtained a 0.95% hit rate (out of 48,787 total compounds) of non-antimicrobial, PsseA-inhibiting compounds, prior to reconfirmation. In the subset of this dataset described and analyzed in the “Quantification and Statistical Analysis”, we observed a 1.5% hit rate (out of 3,921 total compounds).
After compounds have been prioritized (data normalization, hit identification), hits should be re-tested by repeating steps 36–43, before purchasing increased quantities of any hit compound directly from the appropriate chemical supplier.
Quantification and Statistical Analysis
First, all Δlux data and ΔOD data should be analyzed separately:
-
1.
Data files should first be annotated with information regarding empty wells and compound names. Empty wells or those that did not receive compounds may be removed at this stage.
-
2.
Reproducibility should be examined first by plotting the two replicates against one another. This can be done in a graphing software such as GraphPad Prism or using the base plot functions in R. Concordant replicates may be averaged before proceeding with data analysis, or kept as individuals and analyzed separately.
-
3.
Next, data should be normalized to ensure accurate hit identification, by accounting for positional effects from biased well or plate locations. For the purposes of this dataset (Data S1), we implemented interquartile mean-based normalization, which reduces variation between plates by normalizing data to the mean of the middle 50% of ordered values (Mangat et al., 2014).
-
a.
These formulas can all be implemented in Excel with the function =TRIMMEAN(start:end,0.5) where start and end mark the data location. Alternatively, a custom R script may be used; here, we implemented modified functions provided in (French et al., 2016).
-
b.
Figure 2A depicts index plots of raw Δlux and ΔOD data prior to normalization.
Figure 2.

Data Normalization for Luminescence and Growth Readings
(A–C) Data from a subset of 3921 biological actives. Individual data points represent values in each well. Point colors indicate data from unique compound library plates (13 total). (A) Raw luminescence production (Δlux) and growth (ΔOD) values. (B) Interquartile mean-based plate normalization for Δlux and ΔOD values. (C) Interquartile mean-based well normalization for Δlux and ΔOD values.
-
c.
Wells should first be normalized within plates using the following formula:
where Sample is the value in each well prior to normalization, and IQM (plate) is the mean of the interquartile data of each assay plate in the screen. Figure 2B depicts index plots of plate-normalized Δlux and ΔOD data.
-
d.
Optionally, wells can be normalized a second time using the following formula:
where IQM (well) is the mean of the interquartile values of each well position across all assay plates in the screen. Figure 2C depicts index plots of well-normalized Δlux and ΔOD data.
Note: This normalization method is one of several that may be implemented (alternatives include B, Z, or R score normalization, or matrix error amendment and partial mean polish).
Next, Δlux data can be evaluated in parallel with ΔOD data to identify hit compounds:
-
4.
Hit compounds can be identified as those with Δlux values significantly below the mean of the dataset, and ΔOD values not significantly below the mean of the dataset. These statistical cutoffs can be benchmarked by calculating the standard deviation of the dataset: i.e. Assuming that 95% of the data falls within 2 standard deviations of the mean of the dataset, hit compounds may be considered those with Δlux values less than 2 standard deviations below the mean of the dataset (i.e. negative effect on sseA promoter activity) and ΔOD values more than 2 standard deviations below the mean of the dataset (i.e. no effect on bacterial growth).
-
5.
Figure 3 depicts well-normalized ΔOD data plotted against well-normalized Δlux data, wherein the yellow box includes compounds with Δlux values less than 2 standard deviations below the mean of the dataset, the blue box includes compounds with ΔOD values less than 2 standard deviations below the mean of the dataset, and the green box includes compounds with both Δlux and ΔOD values less than 2 standard deviations below the means of their respective datasets. All dots that fall within the yellow (but not green) box are considered hits.
Figure 3.

Hit Identification for Luminescence Dataset
Data from a subset of 3921 biological actives. Individual data points represent values in each well. Well-normalized ΔOD data plotted against well-normalized Δlux data. The yellow box indicates compounds with Δlux values less than 2 standard deviations below the mean of the dataset, the blue box indicates compounds with ΔOD values less than 2 standard deviations below the mean of the dataset, the green box indicates compounds with both Δlux and ΔOD values less than 2 standard deviations below the means of their respective datasets. All dots that fall within the yellow (but not green) box are considered hits.
Note: It will be possible to analyze raw, plate-normalized, or well-normalized values in each well to identify hit compounds. Performing the same analysis to identify compounds with appropriate Δlux and ΔOD values on each independent dataset (raw, plate-normalized, well-normalized) should yield concordant results. For example, in this dataset we were able to identify 51 hits by analyzing plate-normalized data (Data S2) and 59 hits by analyzing well-normalized data (Data S3), most of which overlap. However, given the tendency for high variability in luminescence-based screening data (see Problem 4), we recommend using well-normalizing data for hit analysis.
Limitations
The most critical aspect of executing this protocol is access to facilities and instruments for high-throughput screening – although possible with a medium-throughput pipette automation approach, liquid handling instruments and a form of acoustic dispenser for compound transfer are preferable. Another limitation is the composition of the chemical library used for screening. Ideally, such a collection would be comprised of diverse synthetic small molecules, natural products, and compounds with previously demonstrated biological activity, which will serve to maximize the number of identifiable hits. Finally, it is important to consider the potential addition of positive or negative controls into a screening library. The chemical collection screened in this study did not contain any positive controls (as no sseA promoter inhibitors were previously available); however, the presence of empty wells served as a negative control.
This protocol may also be complicated by target selection. In our model system, the sseA promoter serves as a proxy for the SPI-2 virulence locus in Salmonella, and the redundancy in regulatory inputs toward this locus broadens the accessible target space of this chemical screen. Moreover, the expression kinetics and inducing conditions for SPI-2 have both been previously interrogated in depth, which simplified our optimization steps. For other bacterial species and virulence targets, more experimentation may be required prior to designing the screening assay, so as to ensure a large enough target space and a feasible method for expression induction.
Troubleshooting
Problem 1
No bands, or multiple bands, appear on gel.
Potential Solution 1
If no bands appear on the gel, amplification of the PCR product has failed. Repeat step 3 and increase the number of cycles (no greater than 35), or modify the annealing temperature. If multiple bands appear on gel, use the GenepHlow™ Gel/PCR Kit (follow manufacturer’s instructions) to excise the band of interest prior to proceeding.
Problem 2
No colonies appear.
Potential Solution 2
The cloning process can be repeated using the digested PCR product and plasmid that have already been generated, with a modified ratio of PCR product to plasmid in the ligation (in step 7, a 1:5 ratio is used, this may be varied from 1:1 to 1:10). The ligation reaction may also be left for a longer period of time to increase efficiency.
Problem 3
Luminescence signal is low.
Potential Solution 3
Opaque, 384-well clear/flat bottom plates are required for this assay, to avoid signal contamination between wells. However, the use of black plates, as described in this protocol, may dampen signal. If the luminescence signal is too low to yield a valid Z-prime result, white plates may be substituted for black. However, we note that this substitution may reduce the sensitivity of the screen by decreasing the signal-to-noise ratio.
Problem 4
Screening data is noisy or variable.
Potential Solution 4
Luminescence-based high-throughput screens are susceptible to variability. This is often due to the causal relation between oxygen concentration and luminescence intensity. To help minimize these effects, the organization of plates within stacks in the incubator should be kept consistent between time points for plate reading. Interquartile mean-based normalization within and between all assay plates during data analysis will assist in minimalizing variability. If problems with noisy data persist, the total number of plates screened per day may be decreased in order to prevent delays in the time before all plates are read (specifically at the 6 h point after initial bacterial addition).
Resource Availability
Lead Contact
Further information and requests for resources and reagents should be directed to and will be fulfilled by the Lead Contact, Brian Coombes (coombes@mcmaster.ca).
Materials Availability
All unique reagents generated in this study are available from the Lead Contact without restriction.
Data and Code Availability
The source data underlying Figures 2 and 3 are provided in Data S1. The complete dataset generated from the larger chemical screen that this protocol was applied to was published in (Tsai et al., 2020). Custom R scripts are available from the Technical Contact without restriction.
Acknowledgments
We are grateful to the McMaster Centre for Microbial Chemical Biology for assistance with high-throughput screening. C.N.T. was supported by a Frederick Banting and Charles Best Canada Graduate Scholarship. This work was supported by grants to B.K.C. from the Canadian Institutes of Health Research (FRN-156361) and from the Boris Family Fund for Health Research Excellence.
Author Contributions
C.N.T. performed the experimental protocol and analyzed all data. C.N.T. and B.K.C. wrote and edited the manuscript.
Declaration of Interests
The authors declare no competing interests.
Footnotes
Supplemental Information can be found online at https://doi.org/10.1016/j.xpro.2020.100057.
Contributor Information
Caressa N. Tsai, Email: tsaic2@mcmaster.ca.
Brian K. Coombes, Email: coombes@mcmaster.ca.
Supplemental Information
Raw luminescence (Δlux) and growth (ΔOD), plate-normalized Δlux and ΔOD, well-normalized Δlux and ΔOD (source data underlying Figures 2 and 3).
Raw luminescence (Δlux) and growth (ΔOD), plate-normalized Δlux and ΔOD, well-normalized Δlux and ΔOD.
Raw luminescence (Δlux) and growth (ΔOD), plate-normalized Δlux and ΔOD, well-normalized Δlux and ΔOD.
References
- Coombes B.K., Brown N.F., Valdez Y., Brumell J.H., Finlay B.B. Expression and secretion of Salmonella pathogenicity island-2 virulence genes in response to acidification exhibit differential requirements of a functional type III secretion apparatus and SsaL. J. Biol. Chem. 2004;279:49804–49815. doi: 10.1074/jbc.M404299200. [DOI] [PubMed] [Google Scholar]
- French S., Mangat C., Bharat A., Cote J.P., Mori H., Brown E.D. A robust platform for chemical genomics in bacterial systems. Mol. Biol. Cell. 2016;27:1015–1025. doi: 10.1091/mbc.E15-08-0573. [DOI] [PMC free article] [PubMed] [Google Scholar]
- Lane M.C.C., Alteri C.J., Smith S.N., Mobley H.L.T. Expression of flagella is coincident with uropathogenic Escherichia coli ascension to the upper urinary tract. Proc. Natl. Acad. Sci. U S A. 2007;104:16669–16674. doi: 10.1073/pnas.0607898104. [DOI] [PMC free article] [PubMed] [Google Scholar]
- MacNair C.R., Stokes J.M., French S., Myers C.L., Iyer K.R., Brown E.D. A cell-based approach to characterize antimicrobial compounds through kinetic dose response. Bioorg. Med. Chem. 2016;24:6315–6319. doi: 10.1016/j.bmc.2016.09.053. [DOI] [PubMed] [Google Scholar]
- Mangat C.S., Bharat A., Gehrke S.S., Brown E.D. Rank ordering plate data facilitates data visualization and normalization in high-throughput screening. J. Biomol. Screen. 2014;19:1314–1320. doi: 10.1177/1087057114534298. [DOI] [PMC free article] [PubMed] [Google Scholar]
- Osborne S.E., Coombes B.K. Transcriptional priming of Salmonella pathogenicity island-2 precedes cellular invasion. PLoS One. 2011;6:e21648. doi: 10.1371/journal.pone.0021648. [DOI] [PMC free article] [PubMed] [Google Scholar]
- Tsai C.N., MacNair C.R., Cao M.P.T., Perry J.N., Magolan J., Brown E.D., Coombes B.K. Targeting two-component systems uncovers a small-molecule inhibitor of Salmonella virulence. Cell Chem. Biol. 2020;27:1–13. doi: 10.1016/j.chembiol.2020.04.005. [DOI] [PubMed] [Google Scholar]
- Zhang J.H.H., Chung T.D., Oldenburg K.R. A simple statistical parameter for use in evaluation and validation of high throughput screening assays. J. Biomol. Screen. 1999;4:67–73. doi: 10.1177/108705719900400206. [DOI] [PubMed] [Google Scholar]
Associated Data
This section collects any data citations, data availability statements, or supplementary materials included in this article.
Supplementary Materials
Raw luminescence (Δlux) and growth (ΔOD), plate-normalized Δlux and ΔOD, well-normalized Δlux and ΔOD (source data underlying Figures 2 and 3).
Raw luminescence (Δlux) and growth (ΔOD), plate-normalized Δlux and ΔOD, well-normalized Δlux and ΔOD.
Raw luminescence (Δlux) and growth (ΔOD), plate-normalized Δlux and ΔOD, well-normalized Δlux and ΔOD.
Data Availability Statement
The source data underlying Figures 2 and 3 are provided in Data S1. The complete dataset generated from the larger chemical screen that this protocol was applied to was published in (Tsai et al., 2020). Custom R scripts are available from the Technical Contact without restriction.