Abstract
Epithelial – mesenchymal transition (EMT) is a developmental program of signaling pathways that determine commitment to epithelial and mesenchymal phenotypes. In the prostate, EMT processes have been implicated in benign prostatic hyperplasia and prostate cancer progression. In a model of Pten- and TP53-null prostate adenocarcinoma that progresses via transforming growth factor β-induced EMT, mesenchymal transformation is characterized by plasticity, leading to various mesenchymal lineages and the production of bone. Here we show that SLUG is a major regulator of mesenchymal differentiation. As microRNAs (miRs) are pleiotropic regulators of differentiation and tumorigenesis, we evaluated miR expression associated with tumorigenesis and EMT. Mir-1 and miR-200 were reduced with progression of prostate adenocarcinoma, and we identify Slug as one of the phylogenetically conserved targets of these miRs. We demonstrate that SLUG is a direct repressor of miR-1 and miR-200 transcription. Thus, SLUG and miR-1/miR-200 act in a self-reinforcing regulatory loop, leading to amplification of EMT. Depletion of Slug inhibited EMT during tumorigenesis, whereas forced expression of miR-1 or miR-200 inhibited both EMT and tumorigenesis in human and mouse model systems. Various miR targets were analyzed, and our findings suggest that miR-1 has roles in regulating EMT and mesenchymal differentiation through Slug and functions in tumor-suppressive programs by regulating additional targets.
Keywords: prostate cancer, EMT, SLUG, miR-1, miR-200
INTRODUCTION
Epithelial – mesenchymal transition (EMT) is a developmental regulatory program that mediates plasticity between epithelial and mesenchymal phenotypes in normal and pathological settings.1 An irreversible EMT program leads to pathological fibrosis. A reversible EMT program that is characterized by a partial EMT phenotype has been implicated as a common mechanism associated with invasion and metastasis.2 EMT plays an important role in various pathological processes within the prostate, especially prostate cancer progression. Individual invasive prostate cancer cells within high Gleason grade tumors are indicative of EMT. Consistent with this, the analysis of prostate cancer tissue arrays has shown that loss of the epithelial marker, E-cadherin (CDH1), and gain of the mesenchymal marker, N-cadherin (CDH2), is associated with multiple end points of progression and cancer-associated death.3,4 In addition, benign prostatic hyperplasia, an enlargement of the prostate characterized by increased stromal and glandular elements, demonstrates evidence of the accumulation of mesenchymal-like cells derived from prostate epithelium.5
A set of transcription factors, including SNAI1, SNAI2 (SLUG), TWIST and ZEB1/2, were initially identified as regulating epithelial–mesenchymal plasticity in embryonic morphogenesis, and subsequently have been shown to be capable of inducing EMTs on their own when expressed in epithelial cells.1
During cancer progression, a variety of signaling pathways, originating in the carcinoma cells or the microenvironment, induce EMT. Members of the transforming growth factor β (TGFβ) family are principal extracellular inducers of EMT.6 Although TGFβ is recognized as a tumor suppressor in transformation of prostate epithelia, it can also promote invasion and malignant progression of prostate cancer.7,8 In late-stage prostate cancer, TGFβ expression is elevated in prostate tumors and the circulation, with expression levels negatively correlated with patient prognosis.9,10
In addition to EMT transcription factors, microRNAs (miRs) have been shown to be regulators of EMT and cancer cell invasion. The miR- 200 family is a prominent group where high and low miR-200 expression levels correlate with epithelial and mesenchymal phenotypes, respectively.11,12 Elements of the EMT program including increased EMT transcription factor expression and decreased miR-200 expression are associated with the acquisition of cancer stem cell traits and tumor-initiating capacity.2,13–14
We previously have characterized the PB-Cre4Ptenfl/flTP53fl/fl model of aggressive prostate cancer that demonstrates prostatic intraepithelial neoplasia at 8 weeks, adenocarcinoma formation by 4 months and the progressive development of EMT and sarcomatoid carcinoma, leading to the death of most animals at about 7 months of age.15 We noted the presence of heterologous chondrosarcomatous and osteosarcomatous elements in some tumors, similar to prostatic sarcomatoid carcinomas that have been described in patients.16 To investigate the origin of tumor heterogeneity, clonal epithelial cell lines were established from tumors to evaluate the differentiation potential of clonally derived tumor-initiating cells.15 Upon in vivo inoculation, some luminal epithelial lines underwent progressive sarcomatoid carcinoma formation, formally demonstrating an epithelial-to-mesenchymal transition origin for sarcomatoid carcinomas.
Using the AC3 clonal cell line, which undergoes TGFβ-induced EMT in vitro, we previously have shown that depletion of Slug inhibited EMT, whereas depletion of Snail was significantly less rate limiting.17 Here we have investigated the role of miR families in Slug regulation and determined that a mutually inhibitory feedback circuit exists for miR-1 and miR-200 with Slug. The functional roles of these interacting molecular pathways were evaluated with respect to EMT, mesenchymal differentiation and tumorigenicity.
RESULTS
Pten/TP53 deletion in prostate epithelium leads to adenocarcinoma, which progresses to sarcomatoid carcinoma with mesenchymal stem cell characteristics
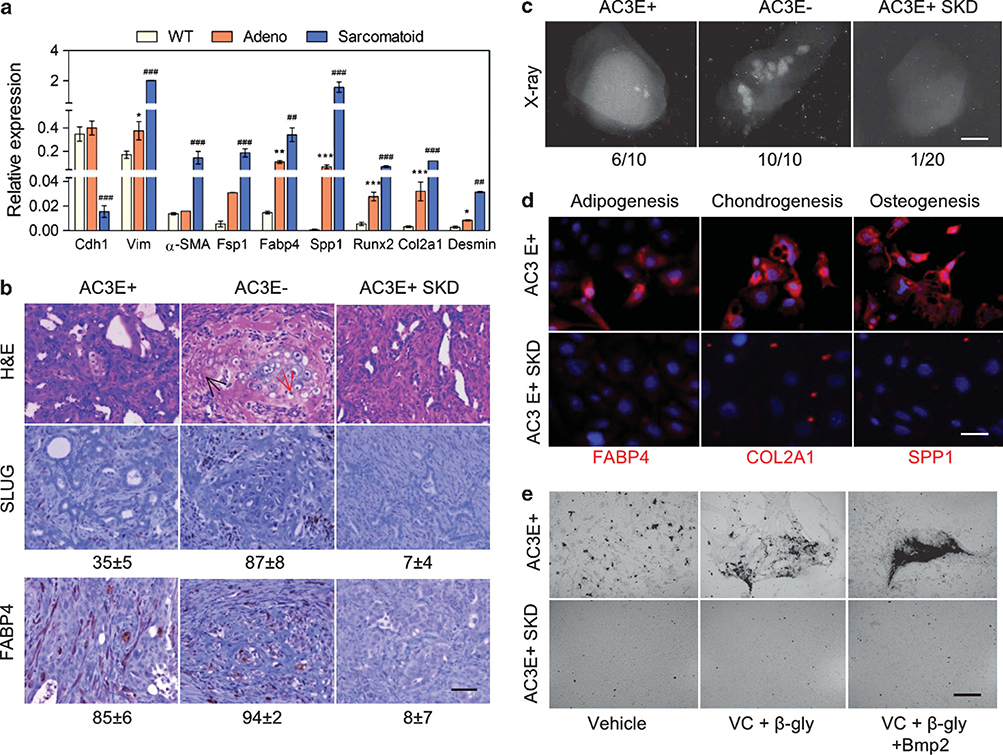
Our previous observation of bone and cartilage elements in PB-Cre4Ptenfl/flTP53fl/fl prostate tumors suggested a potentially high degree of EMT-related plasticity. Therefore, we evaluated the range of mesenchymal differentiation markers expressed in prostatic adenocarcinomas and sarcomatoid carcinomas. As shown in Figure 1a, adenocarcinomas characteristically expressed high levels of Cdh1, and sarcomatoid carcinomas expressed reduced levels of Cdh1 and significantly increased levels of Vim. The differentiation markers included general (Fsp1) and lineage-dependent myofibroblasts (α-SMA), adipocyte (Fabp4), osteoblast (Spp1 and Runx2), chondrocyte (Col2a1) and skin fibroblast (Desmin) mesenchymal markers. All mesenchymal markers were highly increased in sarcomatoid carcinoma tumors. Interestingly, adenocarcinomas also expressed, relative to wild-type prostates, elevated levels of Fabp4, Spp1, Runx2 and Col2a1. Thus, it appeared that in vivo EMT involved differentiation plasticity overlapping with the range of differentiated cell types produced by mesenchymal stem cells (MSCs).
Figure 1.
Pten/TP53-deleted adenocarcinoma undergoes EMT with MSC characteristics. (a) Expression of epithelial and mesenchymal differentiation markers as determined by qPCR in wild-type (WT) prostate tissue and individual prostate adenocarcinoma (adeno) tumors from 4-month-old mice and individual sarcomatoid carcinoma tumors from 7-month-old mice. Data represent means±s.e.m., n=3. *: vs WT, #: vs adeno. *P<0.05, **P<0.01 and ***P<0.001. (b) Histological images of sections from AC3E+, AC3E− and Slug-depleted (SKD) AC3E+ subcutaneous tumors at 4 weeks. Hematoxylin and eosin (H&E)-stained sections (upper panels) and immunohistochemistry-stained sections for SLUG (middle panels) and FABP4 (bottom panels) are shown. The average percentage of SLUG- and FABP4-positive cells as determined by histomorphometric analysis is indicated. Data represent means±s.e.m., n= 10. Scale bars represent 100μm. The red arrow identifies chondrocytes; the black arrow identifies osteocytes. (c) Radiographic images of representative tumors derived from different AC3 cell lines. The numbers of tumors with bone components are indicated. Scale bars represent 0.1 cm. (d) Expression of mesenchymal differentiation markers as determined by immunofluorescent images of FABP4, COL2A1 and SPP1 from AC3E+ and Slug-depleted (SKD) AC3E+ cells cultured in differentiation medium for 21 days. Nuclei were visualized with 4′,6-diamidino-2-phenylindole (DAPI) staining (blue). Scale bars represent 50μm. (e) Deposits of calcium in AC3E+ or AC3E+ SKD cells cultured in various osteoblast differentiation medium (VC: ascorbic acid; β-gly: β-glycerophosphate) for 21 days.
To investigate mesenchymal differentiation in a tractable system, we used the clonal AC3 cell line, which is an EpCAM+, CK8+ epithelial cell line that undergoes spontaneous TGFβ-dependent EMT in vitro. We previously determined that fluorescence-activated cell sorting (FACS)-separated EpCAM+ (E+) epithelial cells expressing CK8 produce EpCAM negative (E−) mesenchymal-like cells expressing VIM.17 In addition, we also determined that EMT is dependent on Slug expression, and therefore, we anticipated that Slug-depleted AC3 cells (AC3+SKD) would lack MSC-like characteristics. To characterize their in vivo mesenchymal differentiation potential, AC3 cells were injected subcutaneously. The tumors resulting from AC3E+ cells contained a mixture of epithelial and mesenchymal cells, including populations of cells expressing the SLUG EMT marker and the FABP4 adipocyte marker, and 60% of tumors showed evidence of calcified bone-like material (Figures 1b and c). Thus, epithelial ACE+ cells underwent EMT and heterogeneous mesenchymal differentiation. In tumors initiated from AC3E− cells, the proportion of cells expressing SLUG and FABP4 was increased, and there was evidence of bone in all the tumors that were analyzed. The mesenchymal markers were almost completely absent in Slug-depleted AC3 tumors.
To determine their autonomous differentiation potential, AC3 cells were placed in culture media with additives that stimulate MSC differentiation to adipocytes, chondrocytes or osteoblasts, and the cultured cells were subsequently stained with the respective lineage markers FABP4, COL2A1 or SPP1 (osteopontin). As shown in Figure 1d, AC3 cells demonstrated induced, SLUG-dependent expression of the three mesenchymal lineages. To evaluate bone formation function, AC3 cells were cultured in osteogenic media with or without bone morphogenetic protein-2. As shown in Figure 1e, induced osteoblast-like cells produced mineralized matrix and were responsive to additional bone morphogenetic protein-2-stimulated differentiation. We conclude that the heterologous elements in prostatic Pten/TP53-null sarcomatoid tumors are consistent with MSC-like plasticity of epithelial tumor cells that have undergone an EMT.
Mesenchymal differentiation is induced by TGFβ
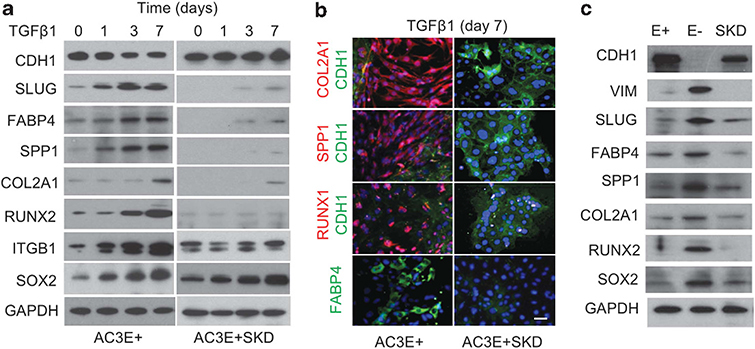
To determine whether the expression of mesenchymal lineage markers could be initiated by TGFβ, kinetic analyses of TGFβ-treated AC3E+ and AC3E+SKD cells were performed. Adipocyte, osteoblast and to a lesser degree chondrocyte markers increased over time following TGFβ incubation of AC3E+, but not AC3E+SKD (Figure 2a). The specificity of Slug depletion was shown by reconstitution of the TGFβ-dependent mesenchymal phenotypes by Slug re-expression (Supplementary Figure S1). Western blot results were confirmed by immunofluorescent cell staining of TGFβ-treated AC3E+ and AC3E+ SKD cells (Figure 2b). Also, when AC3 cultures that had undergone spontaneous EMT over time were separated into E+ and E− populations, mesenchymal lineage markers were observed in the E− cells (Figure 2c). Of interest, two fate-determining transcription factors, the stem cell factor SOX2 and the osteoblast/chondrocyte differentiation factor RUNX2, were expressed in TGFβ-induced mesenchymal cells.
Figure 2.
TGFβ induces expression of mesenchymal lineage markers in Pten/TP53-deleted adenocarcinoma. (a) Representative western blots of mesenchymal lineage markers in AC3E+ cells and Slug-depleted (SKD) AC3E+ cells at various time points following 2 ng/ml TGFβ1 treatment. (b) Double immunofluorescent images of chondrocyte (Col2a1), osteoblast (Spp1 and Runx2) and epithelial (Cdh1) markers or single immunofluorescent image of the adipocyte (Fabp4) marker in AC3E+ cells treated with 2 ng/ml TGFβ1 for 7 days. Nuclei were visualized with 4′,6-diamidino-2-phenylindole (DAPI) staining (blue). Scale bars represent 100 μm. (c) Representative western blots of epithelial (CDH1) and various mesenchymal markers in AC3E+ (E+), AC3E− (E−) and Slug-depleted (SKD) AC3E+ cells.
Slug is regulated through a mutually inhibitory feedforward loop by miR-1 and miR-200b
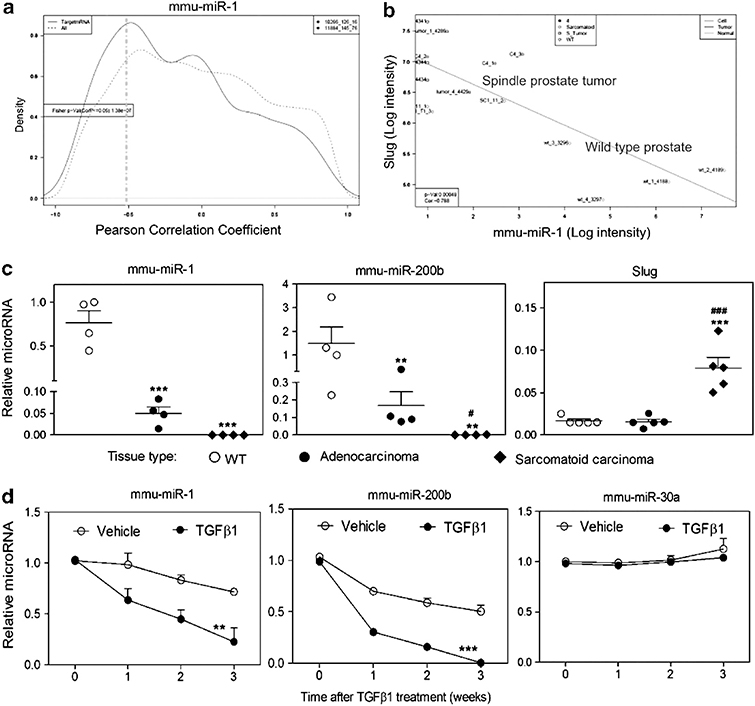
Gene and miR profiles were analyzed to address potential regulatory mechanisms of TGFβ-induced Slug increases. MiRs, differentially expressed between normal prostate epithelium and Pten/TP53-null prostate sarcomatoid carcinomas and cell lines, were individually analyzed by plotting the global distribution of the Pearson correlation coefficients between the miRNA of interest and either all mRNAs that are probed by the Affymetrix GeneChip (430 2.0) or only those mRNAs that are predicted targets of the miRNA. miR-1, miR-200b/c and miR-30a are shown (Figure 3a and Supplementary Figure S2). For these miRNAs, the distribution curve of the correlation coefficients indicates that the tissue transcript levels of a subset of mRNAs, which have the respective predicted miRNA target sequence in the 3′-untranslated region (3′-UTR), are elevated during tumor progression by the reduced expression of miR-1, miR-200b/c or miR-30a (Figure 3a and Supplementary Figure S2). A specific target of interest, Slug, showed significant inverse correlations with miR-1, miR-200b/c and miR-30a, which have predicted target sequences in the Slug 3′-UTR (Figure 3b and Supplementary Figure S2). A comparison of normal prostate and Pten/TP53-null adenocarcinoma and sarcomatoid carcinoma tumors showed step-wise decreases in miR levels during tumor progression (Figure 3c). Treatment of AC3E+ cells with TGFβ led to decreased levels of miR-1, miR-200a/b/c, but not miR-30a, suggesting that miR-1 and miR-200, but not miR-30a, were regulated in association with EMT (Figure 3d and Supplementary Figure S2). It is widely appreciated that miR-200 levels decrease with EMT, and the miR-200 targets ZEB1/2 have been investigated.12,18 To the best of our knowledge, Slug has not been shown to be a direct miR-200 or an miR-1 target. However, miR-1 and miR-200 target sequences in the Slug 3′-UTR are well conserved across multiple species (Supplementary Figure S3).
Figure 3.
TGFβ induces decreased levels of miR-1 and miR-200b expression. (a) Analysis of inverse relationship between transcript level of mmu-miR-1 and its putative mRNA targets. The curves shown represent the global distribution of Pearson correlation coefficients between mRNAs and mmu-miR-1. The dashed line shows the distribution of the correlation coefficients for all mRNAs, whereas the solid line shows the correlation coefficient distribution for only those mRNAs that are predicted targets of mmu-miR-1. The solid line has an additional shoulder towards the left side indicating an enrichment of target mRNAs, whose transcript levels are negatively correlated with the transcript levels of mmu-miR-1. (b) Negative correlation of Slug and mmu-miR-1 expression levels. mRNA and miRNA levels in normal prostate and Pb-Cre, Ptenfl/flTp53fl/fl-derived primary sarcomatoid carcinomas and cell lines were analyzed using Affymetrix GeneChip Mouse Genome 430 2.0 microarrays and Agilent mouse miRNA microarrays. Matched individual samples from normal prostate (wild type (WT)) (n=4) and Pb-Cre, Ptenfl/flTp53fl/fl-derived primary sarcomatoid carcinomas (n=5) or prostate spindle tumor cell lines, C4 (n=3) and SC1 (n=3), are plotted. The WT samples are in the lower right and the sarcomatoid samples are in the upper left. R=−0.788, P ⩽0.00048. (c) qPCR of mmu-miR-1, mmu-miR-200b and Slug levels determined for normal prostates (WT), adenocarcinomas and sarcomatoid carcinomas. Each symbol represents an individual animal. Data represent means±s.e.m., n=4. *: vs WT, #: vs adenocarcinomas. *P<0.05, **P<0.01 and ***P<0.001. (d) Time course after 2 ng/ml TGFβ1 treatment of qPCR-determined levels of mmu-miR-1, mmu-miR-200b and mmu-miR-30a in AC3E+ cells. Data represent means±s.e.m., n=3. *: vs vehicle. **P<0.01 and ***P<0.001.
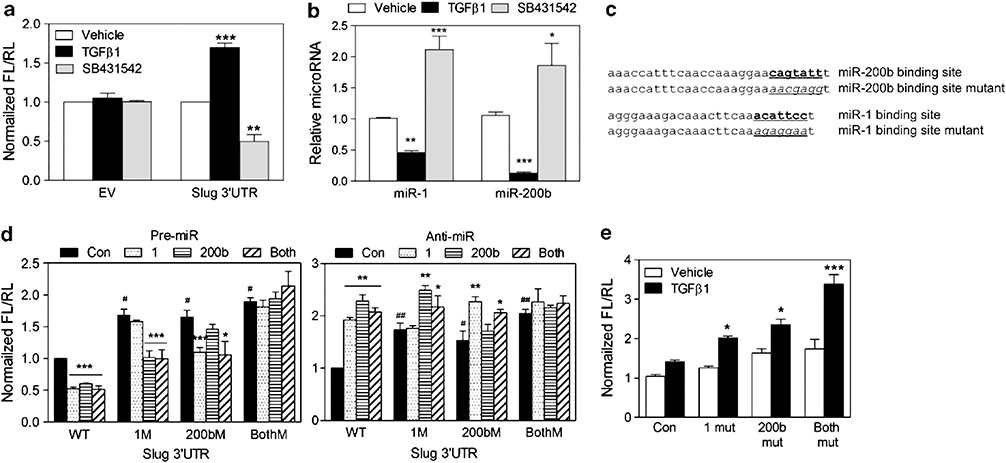
To further investigate miR-dependent regulation of Slug in AC3 cells, a full-length Slug 3′-UTR reporter, which contains miR-1 and miR-200 homology sites, was analyzed. In AC3E+ cells, increased and decreased luciferase activities, corresponding to decreased and increased miR levels, were seen upon treatment with TGFβ and the TGFβ receptor (ALK5) inhibitor SB431542, respectively (Figures 4a and b). The potential for repression of Slug expression by miR-1 and/or miR-200 targeting of the Slug 3′-UTR was analyzed. To determine the relative contribution of miR-1- and miR-200-dependent regulation, constructs were made with mutations in the miR-1, the miR-200 or both miR target sites (Figure 4c). The wild-type or mutated Slug 3′-UTR-Luc reporter was co-transfected with either miR precursors or inhibitors (anti-miRs), and we observed miR binding site-dependent decreased or increased luciferase activity, respectively (Figure 4d). TGFβ-stimulated reporter assays demonstrated individual repressive roles for miR-1 and miR-200b (Figure 4e). Increased TGFβ-stimulated activity in the reporter with no miR-1 or miR-200b target sites suggested that additional miR’s, whose levels were effected by TGFβ, can regulate the Slug 3′-UTR. We conclude that miR-1 and miR-200b can directly regulate the stability and/or translation of Slug RNA.
Figure 4.
MiR-1 and miR-200b directly regulate the stability or translation of of Slug RNA. (a) The normalized reporter activity of pMT01 containing the Slug 3′-UTR in AC3E+ cells after 72 h treatment with vehicle, TGFβ1 (2 ng/ml) or SB431542 (1 μM). Empty pMT01 vector (EV) was used as a control. The data represent the means±s.e.m. of separate transfections, n=6. *: vs Vehicle. **P<0.01 and ***P<0.001. (b) qPCR of mmu-miR-1 and mmu-miR-200b levels determined in AC3E+ cells after 72 h treatment with vehicle, TGFβ1 or SB431542. Data represent means±s.e.m., n=3. *: vs Vehicle. *P<0.05, **P<0.01 and ***P<0.001. (c) Schematic of the predicted, conserved mmu-miR-200b site and the mmu-miR-1 binding site and the introduced binding site mutants in the Slug 3′-UTR. (d) Transient expression of mmu-miR-1 and/or mmu-miR-200b precursors (pre-miR) decreased Slug 3′-UTR reporter activity (left). Transient expression of mmu-miR-1 and/or mmu-miR-200b inhibitors (anti-miR) increased Slug 3′-UTR reporter activity (right). Wild-type (WT) and mutated 3′-UTRs were co-transfected with pre-miRs or anti-miRs into AC3E+ cells. Luciferase/Renilla activities were measured 72 h after transfection. Data represent means±s.e.m., n=5. #: vs WT; *: vs control.*P<0.05, **P<0.01 and ***P<0.001. (e) Decreased turnover or translation of transcripts containing the Slug 3′-UTR with mutations in target sites for mmu-miR-1 (1 mut), mmu-miR-200b (200b mut) or both miR-1 and miR-200b (both mut), measured 72 h after no (vehicle) or TGFβ1 treatment. Data represent means±s.e.m., n=5. *: vs Control. *P<0.05 and ***P<0.001.
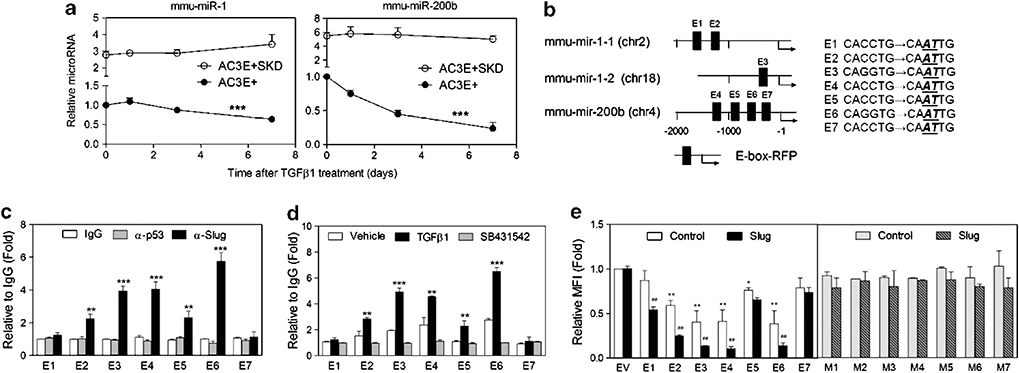
Slug progressively accumulates and miR-1 and miR-200b progressively decrease following TGFβ treatment of AC3E+ cells. Therefore, we investigated whether Slug and miR-1/miR-200b function in mutually inhibitory regulatory loops. Slug-depleted AC3 cells expressed significantly more miR-1 and miR-200b than AC3E+ cells (Figure 5a), and miR-1 and miR-200b levels did not decrease following TGFβ treatment of Slug-depleted cells, demonstrating SLUG-dependent regulation of miR-1 and miR-200 levels. To investigate whether SLUG directly regulates miR-1 and/or miR-200b transcription, E-boxes were mapped within the putative promoter regions upstream of the primary miR (pri-miR) transcripts encoding miR-1–1 and miR-1–2, located on chromosomes 2 and 18, respectively, and within the miR-200b cluster on chromosome 4 (Figure 5b). For the predicted E-box elements, chromatin immunoprecipitation (ChIP) analyses were performed in AC3E− cells (Figure 5c) and in AC3E+ cells treated with TGFβ or SB431542 (Figure 5d), establishing that significant SLUG binding occurs at miR-1–1 E2, miR-1–2 E3 and miR-200b E4, E5 and E6. DNA fragments containing individual E-boxes that exist in the pri-miR-1–1, miR-1–2 and miR-200b promoters were cloned into a promoter-RFP reporter. Specificity for the cloned E-box elements was assayed using paired constructs containing point mutations within the E-box sequence element (Figure 5b). Cotransfection of the E-box reporters and a Slug expression vector strongly suppressed reporter activity for E1, E2, E3, E4 and E6 containing constructs, in a manner that was dependent on an intact E-box sequence (Figure 5e). These data imply that miR-1–1, miR-1–2 and miR-200b transcription is subject to TGFβ-induced SLUG-dependent suppression and mutually repressive regulation exists for miR’s 1/200b and Slug.
Figure 5.
Pri-miR-1 and pri-miR-200b are regulated through a mutually inhibitory feedforward loop by Slug. (a) Kinetic analysis of endogenous mmu-miR-1 and mmu-miR-200b expression in AC3E+ and Slug-depleted (SKD) AC3E+ cells following TGFβ1 treatment for various time periods. Data are means±s.e.m., n=3. * Responsiveness to TGFβ1. ***P<0.001. (b) Schematic of predicted SLUG binding E-boxes and their constructed mutations in the mmu-mir-1–1, mmu-mir-1–2 and mmu-miR-200a/b pri-miR promoters. (c) qChIP analysis of SLUG binding to predicted E-boxes in the pri-miR-1–1, pri-miR-1–2 and pri-miR-200a/b promoter regions measured in AC3E− cells. The binding activity of each protein to each site is given as a percentage of total input then normalized to each immunoglobulin G (IgG). Data are means±s.e.m., n=3. *: vs IgG. (d) qChIP analysis of SLUG binding activity to predicted E-boxes in the pri-miR-1–1, pri-miR-1–2 and pri-miR-200a/b promoter regions in AC3E+ following treatment with TGFβ1 or SB431542 for 7 days. Data are means±s.e.m., n=3. *: vs Vehicle. (e) Wild-type (WT) (E1-E7) and mutated (M1-M7) E-box reporters (in pPs-LCS-mCMV-RFP) were co-transfected with Slug or empty expression vectors into AC3E+ cells. The median fluorescent intensity value for RFP was measured by FACS and normalized to the value of the empty vector after 72 h. Data are means±s.e.m., n=3. *: vs Empty vector (EV); #: vs control. *P<0.05 and **P<0.01.
Both increased Slug expression and reduction of miR-1 and miR-200b are required to initiate EMT and mesenchymal differentiation
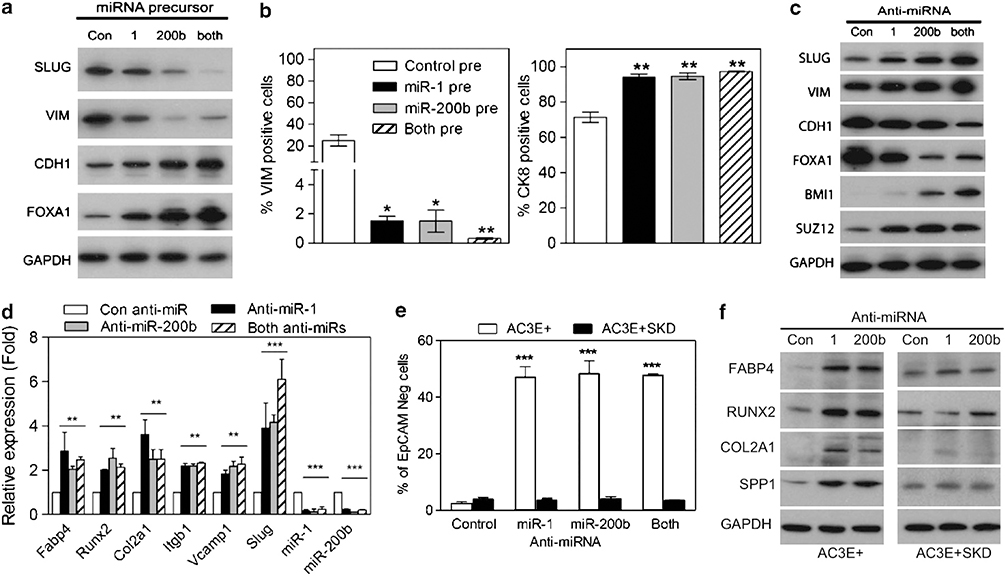
To investigate whether miR-1 and/or miR-200b can directly regulate EMT, AC3E+ cells were transiently transfected with miRNA precursor, miR-1 pre, miR-200b pre or the above combined precursor miRNA’s. Increased levels of miR-1 and miR-200b individually inhibited SLUG expression and induced an epithelial phenotype as shown by increased CDH1 protein, increased numbers of CK8+ cells and decreased VIM protein levels and numbers of VIM+ cells (Figures 6a and b). Conversely, the introduction of anti-miR’s for miR-1 and/or miR-200b into AC3E+, treated with SB431542 to stabilize the epithelial phenotype, stimulated EMT and mesenchymal differentiation as demonstrated by the loss of epithelial and the induction of mesenchymal lineage markers (Figures 6c and d). MiR-200 family members have been shown to target Bmi1 and Suz-12, and consistent with this, decreased miR-200 resulted in increased BMI1 and SUZ12 protein levels (Figure 6c). Of interest, decreased miR-1 led to increased SUZ12 as well. Importantly, inhibition of miR-1 or miR-200b in AC3E+ cells depleted of Slug did not induce EMT as measured by continued EpCAM expression (Figure 6e) and the lack of mesenchymal lineage marker expression (Figure 6f). In addition, anti-miR-1- and/or anti-miR-200b-treated AC3E+SKD cells maintained their epithelial morphology and CDH1 expression, as well as demonstrating a lack of VIM induction (Supplementary Figure S4). Even though miR-1 and miR-200b levels are suppressed in response to Slug expression, artificial suppression of miR-1/200b alone is not sufficient to induce EMT, but requires the continuous presence of Slug. This may result from a requisite for SLUG to amplify a feedforward loop initiated by transient miRNA suppression. It also is likely that SLUG is required for functions in addition to miR-1 and miR-200b suppression.
Figure 6.
MiR-1 or miR-200b expression reduces EMT and expression of mesenchymal differentiation markers. (a) Western blot analysis of EMT markers in AC3E+ cells transiently transfected with miRNA precursors and analyzed 7 days later. (b) Percentage of VIM-positive (left) and CK8-positive (right) cells in AC3E+ cells stably transfected with miRNA precursors. (c) Western blot analysis of EMT markers following anti-miR transfection of AC3E+ cells pre-treated with SB43152 and analyzed 7 days later. (d) qPCR analysis of mesenchymal differentiation marker expression in AC3E+ cells following anti-miRs transfection. Data represent means±s.e.m., n=3. *: vs Control miR (con miR). **P<0.01 and ***P<0.001. (e) Percentage of total cells that are CD24+/EpCAM− as determined by FACS analysis following anti-miR transfection of AC3E+ cells pre-treated with SB431542 or Slug-depleted (SKD) AC3E+ cells. Cells were cultured for 7 days. Data represent means±s.e.m., n=3. *AC3E+ vs AC3E+ SKD. ***P<0.001. (f) Representative western blots of mesenchymal lineage markers in AC3E+ and Slug-depleted (SKD) AC3E+ cells following anti-miRs transfection for 7 days.
MiR-1 expression in human prostate cells leads to a mesenchymal-to-epithelial transition
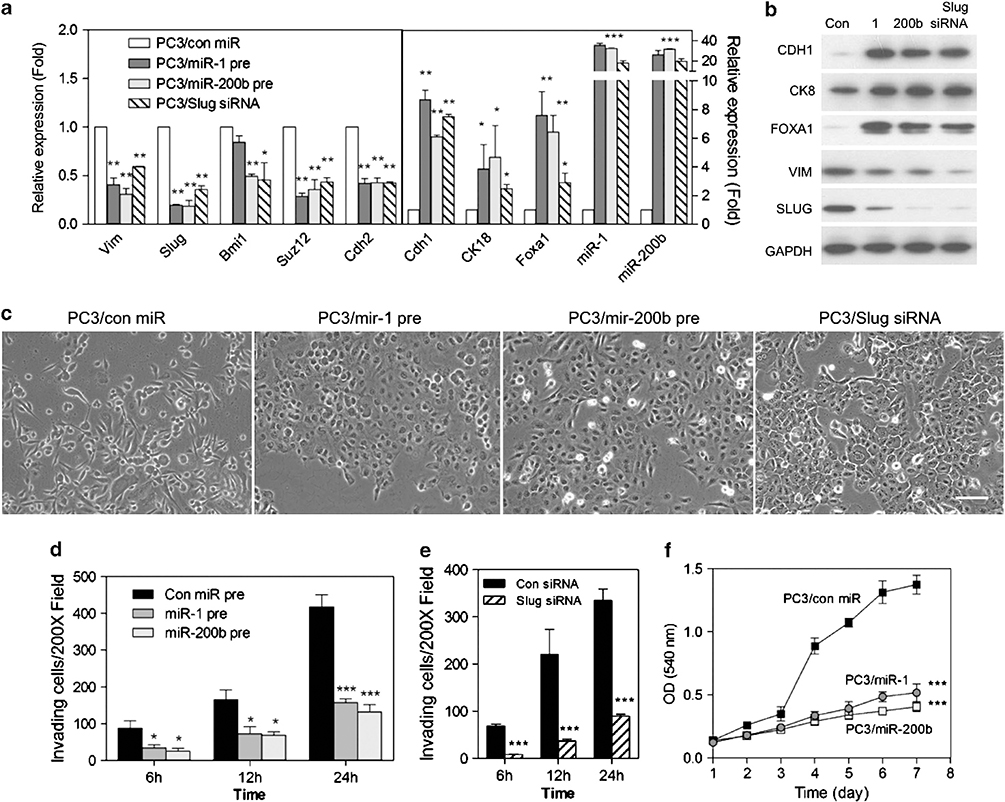
To determine whether miR-1 and/or miR-200b regulate EMT in human prostate cancer cells, we used PC3 cells to analyzed miR-1/miR-200b effects upon EMT markers, morphology, invasiveness and growth. Ectopic expression of precursors for miR-1 or miR-200b significantly reduced mesenchymal markers, including Slug, and increased epithelial markers (Figures 7a and b), demonstrating a mesenchymal-to-epithelial transition (MET). Consistent with this, depletion of Slug led to an MET, including elevated miR-1 and miR-200 levels. Of interest and similarly to mouse AC3 cells, BMI1 and SUZ12 levels were inhibited, respectively, by miR-200b and by both miR-1 and miR-200b (Figure 7a). MiR-1 or miR-200b expression or Slug depletion led to a loss of a migratory mesenchymal morphology and to significantly less invasive ability (Figures 7c – e). In addition, miR-1 and miR-200b expression slowed the rate of growth (Figure 7f), consistent with modulating gene(s) regulating proliferation. Taken together, these data show that miR-1 and miR-200b suppress a variety of mesenchymal properties as well as growth rate in advanced human prostate cancer cells.
Figure 7.
Mir-1 and miR-200b induces Slug loss and leads to MET, reduced invasion and growth inhibition in human prostate cancer cells. (a) qPCR analysis of mesenchymal and epithelial markers expression in PC3 cells following control miR (con pre), miR-1 (miR-1 pre) or miR-200b (miR-200b pre) precursor lentivirus stable infection or Slug short interfering RNA (siRNA) transfection. Data represent means±s.e.m., n=3. *: vs Control miR (con miR). *P<0.05, **P<0.01 and ***P<0.001. (b) Representative western blots of EMT markers in PC3 cells after miR precursor lentivirus infection or Slug siRNA transfection. (c) Phase-contrast images of PC3 cells following expression of stable miR precursors or Slug siRNA transfection after 7 days. Scale bars represent 100 μm. (d and e) Cellular invasion of PC3 cells infected with miR precursor lentivirus particles (d) or transfected with Slug siRNA after 7 days (e). Cells that invaded the Matrigel-coated transwells after the indicated times were fixed and counted at × 200. Data represent means±s.e.m., n=5. *: vs Con miR. *P<0.05, **P<0.01 and ***P<0.001. (f) In vitro growth rate of PC3 cells stably expressing miR-1 and miR-200b and control miR precursor lentivirus. Data represents means±s.e.m., n=6. *: vs Con miR. ***P<0.001.
Slug levels determine mesenchymal or epithelial lineage commitment in tumors while elevated miR-1 or miR-200b expression delays tumorigenicity
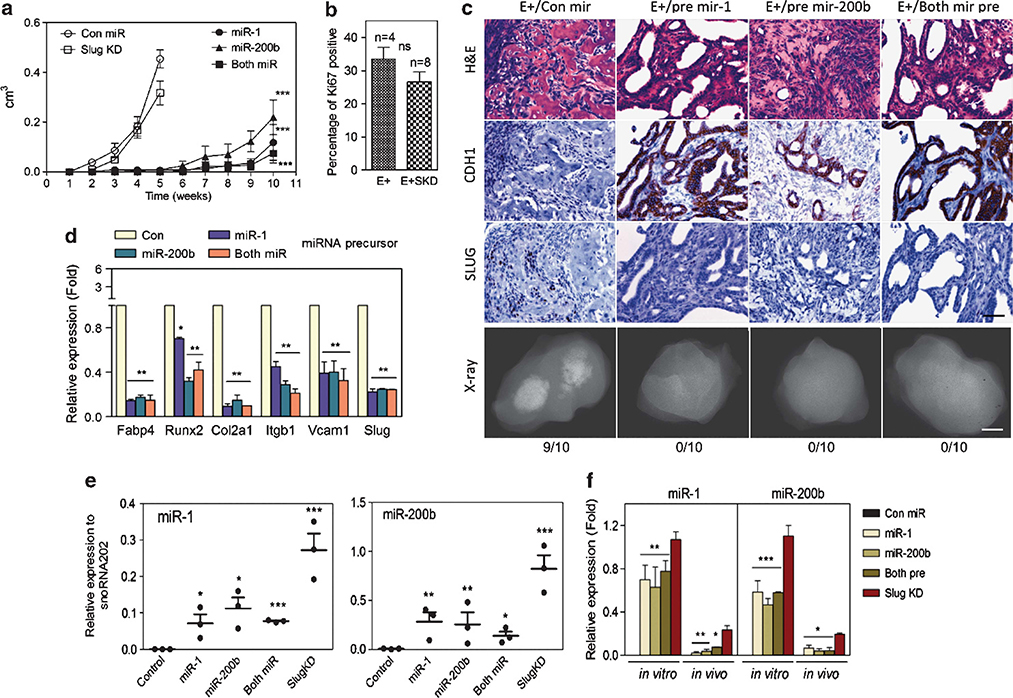
To evaluate the role of miR-1 and miR-200 in tumorigenicity, AC3 cells expressing miR-1 and/or miR-200 were injected subcutaneously and compared with parental AC3E+ cells or to AC3E+ SKD cells (Figure 8a). We have shown previously that AC3E+ and AC3E+ SKD cells demonstrated tumorigenicity, but had distinct EMT phenotypes.17 As an additional measure of tumor growth rate, AC3E+ and AC3E+ SKD tumor sections were stained for the proliferation marker, Ki-67 (Figure 8b). The two tumor types demonstrated statistically similar proliferation indices. As shown in Figure 8c, AC3E+ cells injected subcutaneously formed tumors with mixed epithelial and mesenchymal histologies, while AC3E+ SKD cells produced well-differentiated adenocarcinomas. By contrast to Slug-depleted cells, AC3E+ cells expressing lentivirus-encoded miR-1 and/or miR-200b precursors had significantly less tumorigenic potential as demonstrated by delayed tumor formation and slow growth of the resulting tumors (Figure 8a). The small tumors that did form had a well-differentiated epithelial morphology and showed decreased levels of Slug and mesenchymal lineage markers relative to control miR-treated cells (Figures 8c and d). A comparison (Figure 8f) of miR-1 and miR-200b levels in injected cell lines and tumors (Figure 8e) showed that the tumors that eventually arose from pre-miR or Slug-depleted lines expressed significantly lower miR-1 and miR-200b levels than the injected cell lines. This suggests that selection for low miR levels associated with tumor growth had occurred (Figures 8d and e). These data imply that miR-1 and miR-200 have tumor suppressor activity.
Figure 8.
MiR-1 or miR-200b expression delays tumorigenicity and inhibits in vivo MSC lineage marker expression. (a) Subcutaneous tumor growth as measured by total volume over time in AC3 cells modified as indicated: control miR (con miR) (n=8), Slug-depleted (Slug KD) (n=10) or overexpressing miR-1 (n=10), miR-200b (n=10) or miR-1 + miR-200b (n=10) precursors. *: vs Con miR. **P<0.01 and ***P<0.001. (b) Percentage of Ki-67-positive cells. The percentage of Ki-67-immunolabeled cells was determined in sections from 5-week AC3E+ (n=4) and AC3E+SKD (n=8) tumors by counting until 200 cells were assessed. Quantitative immunostain differences were evaluated with a two-tailed Student’s t-test. NS: no significance. (c) Histological images of subcutaneous tumor sections at 4 weeks from AC3E+ cells with con miR, or at 10 weeks from AC3E+ cells overexpressing miR-1, miR-200b or miR-1 + miR-200b precursors. Hematoxylin and eosin (H&E)-stained sections (upper panels), immunohistochemistry-stained sections (middle panels) for CDH1 and SLUG, and radiographic images of excised tumors (bottom panels) are shown. The numbers of tumors with bone components are indicated. Black scale bars represent 100 μm and white scale bars represent 0.1 cm. (d) qPCR analysis of mesenchymal differentiation marker expression in AC3E+ cells following miRNA precursor transfection. Data represent means±s.e.m., n=3.*: vs Con miR. **P<0.01 and ***P<0.001. (e) qPCR analysis of the indicated miRs measured in RNA isolated from subcutaneous tumors formed by genetically altered AC3E+ cells as indicated in (a). Data represent means±s.e.m., n=3. *: vs Con miR. *<0.05, **P<0.01 and ***P<0.001. (f) qPCR analysis of the indicated miRs measured in RNA isolated from genetically altered AC3E+ cells as indicated in (d) (in vitro) and the average for subcutaneous tumors as indicated in (e) (in vivo). Data are means±s.e.m., n=3. *miR-1, miR-200b or both pre vs SKD. *P<0.05, **P<0.01 and ***P<0.001.
MiR-1 regulates EMT and mesenchymal commitment via Slug and appears to independently act as a tumor suppressor by regulating additional targets
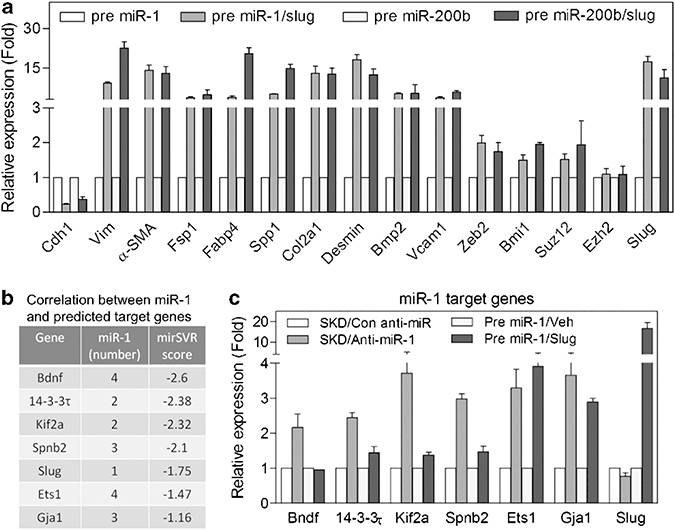
We asked whether the suppression of Slug by miR-1 and miR-200 was the main determinant that inhibited mesenchymal commitment. We engineered SLUG expression in miR-1- and miR-200b-overexpressing cells using a Slug DNA construct missing the 3′-UTR. In these cells, we observed significant expression of mesenchymal lineage markers (Figure 9a), implying that Slug expression is sufficient for mesenchymal commitment, and therefore is the major miR-1 or miR-200 target responsible for the mesenchymal differentiation phenotype. Conversely, the accelerated tumor formation by Slug-depleted cells compared with miR-1- or miR-200b-expressing cells suggest that miR-1 and miR-200 inhibit expression of targets that function to promote tumorigenesis independent of Slug and mesenchymal commitment. To validate the presence of Slug-independent miR targets, we focused upon miR-1 and assayed a number of predicted miR-1 targets listed in Figure 9b. As shown in Figure 9c, these targets are induced by miR-1 depletion in the absence of Slug as assayed in anti-miR-1-infected AC3E+ SKD cells. In contrast to the mesenchymal lineage markers shown in Figure 9a, Bndf, Spnb2, 14–3-3τ and Kif2a were minimally effected or unaffected by Slug overexpression in cells with forced expression of miR-1. Interestingly, Ets1 and Gja1 appeared to have both Slug-dependent and -independent components in their regulation. Taken together, it appears that miR-1 regulates EMT and mesenchymal commitment via Slug and acts independently as a tumor suppressor by regulating additional targets.
Figure 9.
MiR-1 regulates EMT and mesenchymal commitment via Slug and acts independently as a tumor suppressor by regulating additional targets. (a) qPCR analysis of mesenchymal differentiation markers expression in precursor miR-1 and miR-200b AC3E+ cells or precursor miRs AC3E+ cells reconstituted with Slug expression vector (miRs/Slug). Data represent means±s.e.m., n=3. (b) Predicted miR-1 target genes. Data represent numbers of miR-1 binding sites and miRSVR score. (c) qPCR analysis of miR-1 target genes expression in Slug-depleted (SKD) AC3E+ cells with or without anti-miR-1 expression or precursor miR-1-expressing AC3E+ cells with or without Slug cDNA overexpression. Data represent means±s.e.m., n=3.
DISCUSSION
We describe here a model of progressive prostate cancer that demonstrates TGFβ-dependent EMT and associated plasticity leading to variable mesenchymal differentiation. SLUG depletion prevents the subsequent induction of Snail and Zeb1/2 and inhibits EMT in this model.17 We have analyzed the regulatory interactions of Slug with the miR-200 and miR-1 families and their respective functional roles in EMT, mesenchymal differentiation and tumorigenesis. MiR-1 and/or miR-200 expression led to MET in mouse and human prostate cancer cells. We show an amplifying regulatory loop involving the direct interaction of miR-200 and miR-1 with the Slug 3′-UTR and the transcriptional suppression of the miR-1 and miR-200a/b families by SLUG. Similar, mutually inhibitory interactions of the ZEB1/2 transcription factors and miR-200 family are well-established and have been shown to influence EMT and tumorigenicity.12,18 Here we show that SLUG is an additional transcriptional regulatory factor for miR-200. Our data also establish the parallel regulation of miR-200 and miR-1 through SLUG.
Progressive EMT of prostate adenocarcinomas in the PB-Cre4Ptenfl/flTP53fl/fl model demonstrated osteosarcomas and chondrosarcomas in some sarcomatoid carcinoma tumors.15 Consistent with this, EMT of the AC3 cell line showed plasticity of mesenchymal differentiation, demonstrating inducible adipocyte, chondrocyte and osteocyte lineage markers. Sarcomatoid carcinoma of the prostate in humans is a rare cancer, which usually is diagnosed following hormonal or radiation treatment of prostate adenocarcinoma.16 The human tumors share many histological characteristics with the mouse tumors described here, with 30% of human cases containing heterologous elements such as chondrosarcomas and osteosarcomas.16 The mesenchymal differentiation observed in AC3 cells is consistent with the proposed role for Slug in normal MSCs. Increasing Slug expression is functionally associated with chondrocyte hypertrophy and osteoblast differentiation.19–20 In addition, TP53 has been demonstrated to control the proliferation and differentiation of MSCs.21 Because loss of TP53 leads to elevated SLUG expression,22–23 it is reasonable to suggest that TP53 deletion, increased Slug and mesenchymal differentiation plasticity are mechanistically linked.
We have shown previously that depletion of Slug in AC3 cells led to an MET in vitro and in vivo, consistent with the required role for Slug in EMT.17 Slug-depleted AC3 cells retained tumorigenicity, similar to the recently described tumorigenic MET in a human breast cancer model.24 In AC3 cells, miR-200 or miR-1 overexpression led to an MET, but in contrast to Slug depletion, also delayed tumor development. We have shown that miR-200 and miR-1 suppression of Slug expression was predominantly responsible for MET. Slug reconstitution of miR-1- and miR-200-expressing cells led to their morphological transformation and expression of EMT (vimentin) and various mesenchymal differentiation markers. These data suggest that Slug expression is sufficient to induce EMT in this system, and that the loss of mesenchymal markers following miR-200 and miR-1 expression is indirect and secondary to loss of Slug.
Taken together, one reasonable interpretation of these data is that there are Slug-independent miR-1 and miR-200 target genes that are required for tumorigenesis, although other possibilities exist. In support of prostate cancer tumorigenesis being associated with decreased miR-1 levels, miR-1–2 has been found to be differentially downregulated in prostate cancer clinical cases relative to normal prostate,25 and PC3 cells were inhibited in their growth rate by miR-1 expression (Figure 7e). Downregulation of miR-1 is not unique to prostate cancer and has been described in a number of cancers, including lung, hepatocellular and colorectal cancers.26–28 MET, FOXP1 and HDAC4 among others have been proposed as relevant targets, but the constellation of targets that regulate tumorigenicity has yet to be determined. Of the miR-1 targets shown in Figures 9b and c, miR-1-mediated decreased expression of Kif2a can be anticipated to be growth inhibitory. KIF2A is a microtubule depolymerase that plays a non-redundant role in bipolar spindle formation. RNA interference-mediated loss of Kif2a results in the inhibition of cell cycle progression.29 We have shown evidence for direct miR-1 targets that are either not influenced by Slug expression (for example, Bndf, Kif2a) or positively influence by Slug expression (for example, Ets1, Gja1). The latter category may be synergistically affected by the regulatory loop of miR-1 depletion and Slug overexpression.
In conclusion, we have shown that Slug is a central regulator of TGFβ-initiated prostatic EMT and mesenchymal differentiation associated with sarcomatoid carcinoma formation. miR-1/miR-200 and Slug exist in a mutually inhibitory regulatory loop, resulting in decreased miR-1 and miR-200 associated with EMT. In addition, miR-1 and miR-200 regulate Slug-independent targets whose functions are required for tumorigenesis. Thus, miR-1, miR-200 and Slug compose a regulatory network, whose balance is anticipated to effect prostatic tumorigenesis and progression.
MATERIALS AND METHODS
Reagents
PrEGM with supplements was from Lonza (Walkersville, MD, USA); BD Matrigel was from BD Biosciences (San Jose, CA, USA); TGFβ1 was from R&D Systems (Minneapolis, MN, USA); and TGFβR1 inhibitor (SB431542) was from Sigma (St Louis, MO, USA). Mir inhibitors (control, mmu-miR-1 and mmu-miR-200b) were from GeneCopoeia (Rockville, MD, USA). All inhibitor sequences are listed in Supplementary Materials (Supplementary Table S1). Primers used to construct wild type and mutant reporters are listed in Supplementary Table S2. Human SNAI2 short interfering RNA (siRNA) (5′-ACAGCGAACUGGACACACA-3′) was from Thermo Scientific (Lafayette, CO, USA).
Cell culture
AC3 clonal cell lines were isolated, characterized and maintained as described.17 PC3 cell lines were from ATCC and cultured in RPMI 1640 media supplemented with 10% fetal calf serum. Transient transfections with PC3 cells were carried out using Lipofectamine RNAiMAX reagent (Invitrogen, Carlsbad, CA, USA).
FACS and sorting
FACS staining and analysis were as described previously. Promoter functional analysis using FACS and relative median fluorescent intensity value was measured as described.30
Histological staining
Antibodies used for immunofluorescence are listed in Supplementary Materials (Supplementary Table S3). For mesenchymal differentiation markers, staining was performed using the Mouse Mesenchymal Stem Cell Functional Identification Kit (R&D Systems). Cells were cultured in 24-well plates or 8-well chamber slides (Nunc, New York, NY, USA) with α-MEM or Dulbecco’s modified Eagle’s medium/F12 basal medium with adipogenic, osteogenic or chondrogenic supplements for 21 days, and subsequently fixed and stained as described.15,31 Immunohistochemistry was performed using the antibodies and antigen retrieval methods indicated in Supplementary Materials (Supplementary Table S4). Staining was as described.15,31
Real-Time reverse transcription–PCR
Total RNA was isolated using mirVana PARIS RNA isolation system (Ambion, Austin, TX, USA). Reverse transcription of cDNA and PCR were performed as described.15,31 All reactions were normalized to mouse Gapdh and run in triplicate using primers listed in Supplementary Materials (Supplementary Table S5). MiR reverse transcription and PCR reactions were performed using TaqMan MicroRNA Assays kit (Applied Biosystems, Foster City, CA, USA). All values were normalized to mouse snoRNA202 or human RUX48 endogenous control and run in triplicate (Applied Biosystems).
Western blot analysis
Western blots were carried out as described.15,31 Primary antibodies were incubated overnight at 4 °C using the dilutions listed in Supplementary Materials (Supplementary Table S6).
In vitro bone formation assay
For in vitro osteogenesis, AC3E+ SKD or AC3E+ cells were cultured in 24-well plates with osteoblast-inducing medium containing 10% fetal bovine serum, 5 mM β-glycerophosphate and 100 μg/ml ascorbic acid in the presence or absence of 40 μg/ml bone morphogenetic protein-2. After culturing cells for 21 days, cells were fixed and evaluated using von Kossa staining.
Chromatin immunoprecipitation
Chromatin immunoprecipitation (ChIP) assays were performed using the EZ magna ChIP A kit (Millipore, Temecula, CA, USA) with a modified protocol as described in Supplementary Experimental Procedures. Quantitative PCR (QPCR) was performed in triplicate with 2 μl of eluted chromatin. ChIP antibodies and PCR primers are listed in Supplementary Materials (Supplementary Table S7). Predictions for transcription factor binding sites within promoter regions were adopted from the AliBaba 2.1 program (http://www.gene-regulation.com/pub/programs.html).
MiR luciferase assay
MiR luciferase assays were performed as described in Supplementary Materials. Predictions for miR binding sites on the Slug 3′-UTR were made using the Computational Biology Center, Memorial Sloan Kettering Cancer Center website (www.microRNA.org).
Invasion assay
Invasion assays were carried out as described previously using 1 × 10⁶ cells and RPMI 1640 media supplemented with 10% fetal calf serum in both chambers.32
In vitro growth curves
In vitro growth curves were performed as described previously using a density of 2 × 10³ cells per well.33
Tumorigenicity assays
Tumorigenicity assays were performed as previously described using 1 × 10⁶ tumor cells in 50% Matrigel (Falcon, Hillsborough, NJ, USA).33 Tumors were radiographed ex vivo using an MX-20 Faxitron X-ray system (Faxitron XRay Corp., Lincolnshire, IL, USA).
Gene microarrays (miRNA and mRNA)
Methods to obtain and process array data were essentially as described.34 miR-mRNA-negative correlation and enrichment analysis are described in ref.,34 except that a P-value of correlation ⩽0.05 was used.
Statistical analysis
Statistical calculations were performed with GraphPad Prism analysis tools. Differences between individual groups were analyzed by one- or two-way analysis of variance test. Bonferroni’s post-test was used for comparisons among three or more groups.
Supplementary Material
ACKNOWLEDGEMENTS
We acknowledge the support of the Intramural Research Program of the NIH, National Cancer Institute, Center for Cancer Research, USA. We thank Dr Chi-Ping Day, Dr Yvona Ward and Ross Lake for assistance.
Footnotes
CONFLICT OF INTEREST
The authors declare no conflict of interest.
Supplementary Information accompanies the paper on the Oncogene website (http://www.nature.com/onc)
REFERENCES
- 1.Thiery JP, Acloque H, Huang RY, Nieto MA. Epithelial - mesenchymal transitions in development and disease. Cell 2009; 139: 871–890. [DOI] [PubMed] [Google Scholar]
- 2.Polyak K, Weinberg RA. Transitions between epithelial and mesenchymal states: acquisition of malignant and stem cell traits. Nat Rev Cancer 2009; 9: 265–273. [DOI] [PubMed] [Google Scholar]
- 3.Gravdal K, Halvorsen OJ, Haukaas SA, Akslen LA. A switch from E-cadherin to N-cadherin expression indicates epithelial to mesenchymal transition and is of strong and independent importance for the progress of prostate cancer. Clin Cancer Res 2007; 13: 7003–7011. [DOI] [PubMed] [Google Scholar]
- 4.Jaggi M, Nazemi T, Abrahams NA, Baker JJ, Galich A, Smith LM et al. N-cadherin switching occurs in high Gleason grade prostate cancer. Prostate 2006; 66: 193–199. [DOI] [PubMed] [Google Scholar]
- 5.Alonso-Magdalena P, Brossner C, Reiner A, Cheng G, Sugiyama N, Warner M et al. A role for epithelial - mesenchymal transition in the etiology of benign prostatic hyperplasia. Proc Natl Acad Sci USA 2009; 106: 2859–2863. [DOI] [PMC free article] [PubMed] [Google Scholar]
- 6.Xu J, Lamouille S, Derynck R. TGF-beta-induced epithelial to mesenchymal transition. Cell Res 2009; 19: 156–172. [DOI] [PMC free article] [PubMed] [Google Scholar]
- 7.Ao M, Williams K, Bhowmick NA, Hayward SW. Transforming growth factor-beta promotes invasion in tumorigenic but not in nontumorigenic human prostatic epithelial cells. Cancer Res 2006; 66: 8007–8016. [DOI] [PMC free article] [PubMed] [Google Scholar]
- 8.Jones E, Pu H, Kyprianou N. Targeting TGF-beta in prostate cancer: therapeutic possibilities during tumor progression. Expert Opin Ther Targets 2009; 13: 227–234. [DOI] [PubMed] [Google Scholar]
- 9.Adler HL, McCurdy MA, Kattan MW, Timme TL, Scardino PT, Thompson TC. Elevated levels of circulating interleukin-6 and transforming growth factor-beta1 in patients with metastatic prostatic carcinoma. J Urol 1999; 161: 182–187. [PubMed] [Google Scholar]
- 10.Wikstrom P, Stattin P, Franck-Lissbrant I, Damber JE, Bergh A. Transforming growth factor beta1 is associated with angiogenesis, metastasis, and poor clinical outcome in prostate cancer. Prostate 1998; 37: 19–29. [DOI] [PubMed] [Google Scholar]
- 11.Burk U, Schubert J, Wellner U, Schmalhofer O, Vincan E, Spaderna S et al. A reciprocal repression between ZEB1 and members of the miR-200 family promotes EMT and invasion in cancer cells. EMBO Rep 2008; 9: 582–589. [DOI] [PMC free article] [PubMed] [Google Scholar]
- 12.Gregory PA, Bert AG, Paterson EL, Barry SC, Tsykin A, Farshid G et al. The miR-200 family and miR-205 regulate epithelial to mesenchymal transition by targeting ZEB1 and SIP1. Nat Cell Biol 2008; 10: 593–601. [DOI] [PubMed] [Google Scholar]
- 13.Iliopoulos D, Lindahl-Allen M, Polytarchou C, Hirsch HA, Tsichlis PN, Struhl K. Loss of miR-200 inhibition of Suz12 leads to polycomb-mediated repression required for the formation and maintenance of cancer stem cells. Mol Cell 2010; 39: 761–772. [DOI] [PMC free article] [PubMed] [Google Scholar]
- 14.Shimono Y, Zabala M, Cho RW, Lobo N, Dalerba P, Qian D et al. Downregulation of miRNA-200c links breast cancer stem cells with normal stem cells. Cell 2009; 138: 592–603. [DOI] [PMC free article] [PubMed] [Google Scholar]
- 15.Martin P, Liu Y, Pierce R, Abou-Kheir WG, Casey O, Seng V et al. Prostate epithelial Pten/TP53 loss leads to transformation of multipotential progenitors and epithelial to mesenchymal transition. Am J Pathol 2011; 179: 422–435. [DOI] [PMC free article] [PubMed] [Google Scholar]
- 16.Hansel DE, Epstein JI. Sarcomatoid carcinoma of the prostate: a study of 42 cases. Am J Surg Pathol 2006; 30: 1316–1321. [DOI] [PubMed] [Google Scholar]
- 17.Liu YN, Abou-Kheir W, Yin JJ, Fang L, Hynes P, Casey O et al. Critical and reciprocal regulation of KLF4 and SLUG in TGFβeta-initiated prostate cancer EMT. Mol Cell Biol 2011; 32: 941–953. [DOI] [PMC free article] [PubMed] [Google Scholar]
- 18.Wellner U, Schubert J, Burk UC, Schmalhofer O, Zhu F, Sonntag A et al. The EMT-activator ZEB1 promotes tumorigenicity by repressing stemness-inhibiting microRNAs. Nat Cell Biol 2009; 11: 1487–1495. [DOI] [PubMed] [Google Scholar]
- 19.Lambertini E, Lisignoli G, Torreggiani E, Manferdini C, Gabusi E, Franceschetti T et al. Slug gene expression supports human osteoblast maturation. Cell Mol Life Sci 2009; 66: 3641–3653. [DOI] [PMC free article] [PubMed] [Google Scholar]
- 20.Torreggiani E, Lisignoli G, Manferdini C, Lambertini E, Penolazzi L, Vecchiatini R et al. Role of Slug transcription factor in human mesenchymal stem cells. J Cell Mol Med 2011; (e-pub ahead of print 7 June 2011; doi: 10.1111/j.1582-4934.2011.01352.x.). [DOI] [PMC free article] [PubMed] [Google Scholar]
- 21.Molchadsky A, Shats I, Goldfinger N, Pevsner-Fischer M, Olson M, Rinon A et al. P53 plays a role in mesenchymal differentiation programs, in a cell fate dependent manner. PLoS One 2008; 3: e3707. [DOI] [PMC free article] [PubMed] [Google Scholar]
- 22.Chang CJ, Chao CH, Xia W, Yang JY, Xiong Y, Li CW et al. P53 regulates epithelial-mesenchymal transition and stem cell properties through modulating miRNAs. Nat Cell Biol 2011; 13: 317–323. [DOI] [PMC free article] [PubMed] [Google Scholar]
- 23.Wang SP, Wang WL, Chang YL, Wu CT, Chao YC, Kao SH et al. P53 controls cancer cell invasion by inducing the MDM2-mediated degradation of Slug. Nat Cell Biol 2009; 11: 694–704. [DOI] [PubMed] [Google Scholar]
- 24.Casas E, Kim J, Bendesky A, Ohno-Machado L, Wolfe CJ, Yang J. Snail2 is an essential mediator of Twist1-induced epithelial mesenchymal transition and metastasis. Cancer Res 2011; 71: 245–254. [DOI] [PMC free article] [PubMed] [Google Scholar]
- 25.Ambs S, Prueitt RL, Yi M, Hudson RS, Howe TM, Petrocca F et al. Genomic profiling of microRNA and messenger RNA reveals deregulated microRNA expression in prostate cancer. Cancer Res 2008; 68: 6162–6170. [DOI] [PMC free article] [PubMed] [Google Scholar]
- 26.Datta J, Kutay H, Nasser MW, Nuovo GJ, Wang B, Majumder S et al. Methylation mediated silencing of microRNA-1 gene and its role in hepatocellular carcinogenesis. Cancer Res 2008; 68: 5049–5058. [DOI] [PMC free article] [PubMed] [Google Scholar] [Retracted]
- 27.Nasser MW, Datta J, Nuovo G, Kutay H, Motiwala T, Majumder S et al. Downregulation of micro-RNA-1 (miR-1) in lung cancer. Suppression of tumorigenic property of lung cancer cells and their sensitization to doxorubicin-induced apoptosis by miR-1. J Biol Chem 2008; 283: 33394–33405. [DOI] [PMC free article] [PubMed] [Google Scholar] [Retracted]
- 28.Suzuki H, Takatsuka S, Akashi H, Yamamoto E, Nojima M, Maruyama R et al. Genome-wide profiling of chromatin signatures reveals epigenetic regulation of microRNA genes in colorectal cancer. Cancer Res 2011; 71: 5646–5658. [DOI] [PubMed] [Google Scholar]
- 29.Ganem NJ, Compton DA. The KinI kinesin Kif2a is required for bipolar spindle assembly through a functional relationship with MCAK. J Cell Biol 2004; 166: 473–478. [DOI] [PMC free article] [PubMed] [Google Scholar]
- 30.Day CP, Carter J, Bonomi C, Esposito D, Crise B, Ortiz-Conde B et al. Lentivirus-mediated bifunctional cell labeling for in vivo melanoma study. Pigment Cell Melanoma Res 2009; 22: 283–295. [DOI] [PMC free article] [PubMed] [Google Scholar]
- 31.Abou-Kheir WG, Hynes PG, Martin PL, Pierce R, Kelly K. Characterizing the contribution of stem/progenitor cells to tumorigenesis in the Pten−/−TP53−/− prostate cancer model. Stem Cells 2010; 28: 2129–2140. [DOI] [PMC free article] [PubMed] [Google Scholar]
- 32.Ward Y, Lake R, Yin JJ, Heger CD, Raffeld M, Goldsmith PK et al. LPA receptor heterodimerizes with CD97 to amplify LPA-initiated RHO-dependent signaling and invasion in prostate cancer cells. Cancer Res 2011; 71: 7301–7311. [DOI] [PMC free article] [PubMed] [Google Scholar]
- 33.Yin J, Pollock C, Tracy K, Chock M, Martin P, Oberst M et al. Activation of the RalGEF/Ral pathway promotes prostate cancer metastasis to bone. Mol Cell Biol 2007; 27: 7538–7550. [DOI] [PMC free article] [PubMed] [Google Scholar]
- 34.Zhu M, Yi M, Kim CH, Deng C, Li Y, Medina D et al. Integrated miRNA and mRNA expression profiling of mouse mammary tumor models identifies miRNA signatures associated with mammary tumor lineage. Genome Biol 2011; 12: R77. [DOI] [PMC free article] [PubMed] [Google Scholar]
Associated Data
This section collects any data citations, data availability statements, or supplementary materials included in this article.


