

Dietary nondigestible carbohydrates, or dietary fiber, have long been recognized for their beneficial health effects. However, recent studies have revealed that fermentation of nondigestible carbohydrates by gut bacteria is critical in mediating many of the health-promoting properties of dietary fibers. Whole grains are excellent candidates to supply the microbiome with a plentiful source of nondigestible carbohydrates, although unfortunately a majority of these carbohydrates in whole grains are not available to gut bacteria for fermentation. Processing is known to alter the structural characteristics of nondigestible carbohydrates in whole grains, yet the relationship between these effects and gut microbial fermentation is unknown. This research aimed to address this important research gap by identifying interactions between whole-grain processing and gut bacteria, with the ultimate goal of increasing the availability of nondigestible carbohydrates for fermentation to enhance host health.
KEYWORDS: Lachnospiraceae, Ruminococcaceae, butyrate, dietary fiber, wheat
ABSTRACT
Whole grains are generally low in nondigestible carbohydrates that are available for fermentation by the gut microbiota, or microbiota-accessible carbohydrates (MAC). However, there is potential to increase MAC in whole grains through food processing. Five processing methods: boiling, extrusion, sourdough bread, unleavened bread, and yeast bread, were applied to whole wheat flour and then subjected to in vitro digestion followed by fermentation using fecal microbiomes from 10 subjects. The microbiomes separated into 2 groups: those that showed high carbohydrate utilization (CU) and those that exhibited low CU. The former exhibited not only enhanced CU but also increased butyrate production (MAC, 31.1 ± 1.1% versus 19.3 ± 1.2%, P < 0.001; butyrate, 5.26 ± 0.26 mM versus 3.17 ± 0.27 mM, P < 0.001). Only the microbiomes in the high-CU group showed significant differences among processing methods: extrusion and sourdough bread led to dichotomous results for MAC and short-chain fatty acid production, where extrusion resulted in high MAC but low butyrate production while sourdough bread resulted in low MAC but high butyrate production. Extrusion led to a noticeable decrease in α-diversity and some members of the families Ruminococcaceae and Lachnospiraceae, with increases in Acinetobacter, Enterococcus, and Staphylococcaceae. This study demonstrated that only microbiomes that exhibited high CU responded to the effects of processing by showing significant differences among processing methods. In these microbiomes, extrusion was able to increase accessibility of the cell wall polysaccharides but did not increase butyrate production. In contrast, sourdough bread led to high butyrate production by supporting important butyrate-producers in the families Lachnospiraceae and Ruminococcaceae.
IMPORTANCE Dietary nondigestible carbohydrates, or dietary fiber, have long been recognized for their beneficial health effects. However, recent studies have revealed that fermentation of nondigestible carbohydrates by gut bacteria is critical in mediating many of the health-promoting properties of dietary fibers. Whole grains are excellent candidates to supply the microbiome with a plentiful source of nondigestible carbohydrates, although unfortunately a majority of these carbohydrates in whole grains are not available to gut bacteria for fermentation. Processing is known to alter the structural characteristics of nondigestible carbohydrates in whole grains, yet the relationship between these effects and gut microbial fermentation is unknown. This research aimed to address this important research gap by identifying interactions between whole-grain processing and gut bacteria, with the ultimate goal of increasing the availability of nondigestible carbohydrates for fermentation to enhance host health.
INTRODUCTION
Dietary, nondigestible carbohydrates, mainly from dietary fiber, are the major energy sources for the microbiome (1). Fermentation of these carbohydrates by the microbiota results in numerous metabolites, including short-chain fatty acids (SCFA), that are absorbed by the host and have pleiotropic local effects on intestinal function as well as systemic roles in insulin secretion, lipid metabolism, and inflammation, among others (2–4).
Unfortunately, a large proportion of nondigestible carbohydrates in whole grains are not metabolically available to gut microbes for fermentation (5–7). Human feeding trials have suggested that only about one-third of the nondigestible carbohydrates in grains are accessible for fermentation by the microbiota, compared with 75 to 90% for fruit and vegetable fibers (6). Therefore, although whole grains are rich sources of nondigestible carbohydrates, they may not be good sources of microbiota-accessible carbohydrates (MAC) (8).
Processing has been proposed as a way to manipulate carbohydrate utilization (CU) by the microbiome (9). For example, boiling is a minimal form of grain processing that involves moderate temperatures (100°C), atmospheric pressure, minimal shear, and an abundance of water. During boiling, water swells the starch granules, resulting in gelatinization, but the structure of the principal nondigestible carbohydrates, β-glucan and arabinoxylan, appears to be unaffected (10). In contrast, extrusion is a severe form of processing that uses high heat (>120°C), pressure, and mechanical shear at low moisture contents to process grains. This process results in not only gelatinization but also partial depolymerization of the starch and nondigestible carbohydrates (10). Furthermore, extrusion enables the conversion of some insoluble fibers to soluble fibers, which exhibit increased fermentability (11). Accordingly, extrusion has been shown to increase the metabolism of dietary fibers from grains by gut bacteria both in vitro using human fecal microbiota (12) and in vivo in rat feeding studies (13).
Another form of grain processing, bread making, is the most common processing technique for wheat (14). The breadmaking process has been shown to increase soluble dietary fiber at the expense of insoluble fiber (15). Spontaneous fermentation of wheat bran increased solubility of arabinoxylan with a lower average degree of arabinose substitution than native bran, which is thought to be more easily degradable by intestinal microbiota (16). Bread making techniques were compared in whole-grain rye bread, yeast-fermented crispbread, unfermented crispbread, and sourdough bread (10). In all breads, β-glucan and arabinoxylan were distributed as small fragments throughout the starch matrix. The unfermented crispbread had larger pieces of bran and intact cell structures compared with the other breads. For sourdough, starch granules were less swollen and surrounded by more leached amylose, which was proposed to act as a protective layer against starch hydrolysis during digestion. Furthermore, prefermentation of wheat bran with yeast and enzymes in bread making resulted in increased SCFA production during in vitro fermentation compared with no prefermentation (17).
Clearly, the variety of processing methods of grains affect the chemical and physical structures of nondigestible carbohydrates in differential ways. While most of these chemical and physical changes would likely increase MAC, no studies have compared processing methods to determine which method might result in the greatest improvement in CU by the microbiome. Thus, the purpose of this study was to evaluate how different common food processing techniques change MAC in whole grains and shift the microbiota during in vitro fermentation.
(This research was conducted by Caroline Smith in partial fulfillment of the requirements for a Master of Science degree from the University of Nebraska–Lincoln [18].)
RESULTS
Whole-wheat processing and digestion.
Because grain processing is known to affect the physical and, in some cases, the chemical composition of the nondigestible carbohydrates in whole grains, whole-wheat flour was processed using five common grain processing methods—boiling, extrusion, and making sourdough bread, unleavened bread, and yeast bread—to determine how these processes may affect MAC and thus change CU by the microbiome during fermentation. As expected, processing did not significantly affect the total carbohydrate concentration among samples. All samples contained a mean of 61.6% total carbohydrate (range, 56.5% to 66.7%), of which 83% was starch and 17% was nonstarch polysaccharides. Following processing, whole-wheat samples were subject to in vitro digestion and dialysis to remove digestible sugars, starch, and protein. After digestion, the freeze-dried, processed wheat samples contained similar concentrations of total nondigestible carbohydrates, but with significant differences in resistant starch due to processing: boiled wheat and sourdough bread had more residual starch than the other products (Fig. 1).
FIG 1.
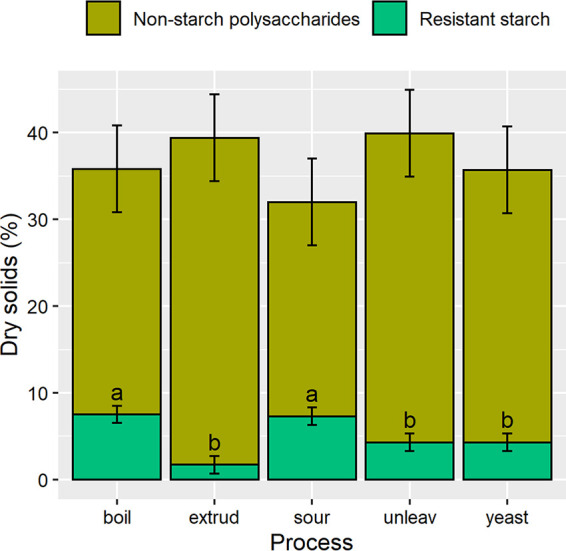
Carbohydrates remaining after in vitro digestion of processed whole-wheat flour. Boil, boiled wheat; extrud, extruded wheat; sour, sourdough bread; unleav, unleavened bread; yeast, yeast-leavened bread. Different letters (a, b) indicate significant differences among processing methods.
Microbiota-accessible carbohydrates in processed whole-wheat samples.
Different grain processing methods resulted in significant differences in MAC in processed whole-wheat samples during in vitro fermentation using microbiomes collected from 10 subjects (Fig. 2A). Extrusion resulted in higher levels of MAC than boiling wheat and making sourdough bread.
FIG 2.
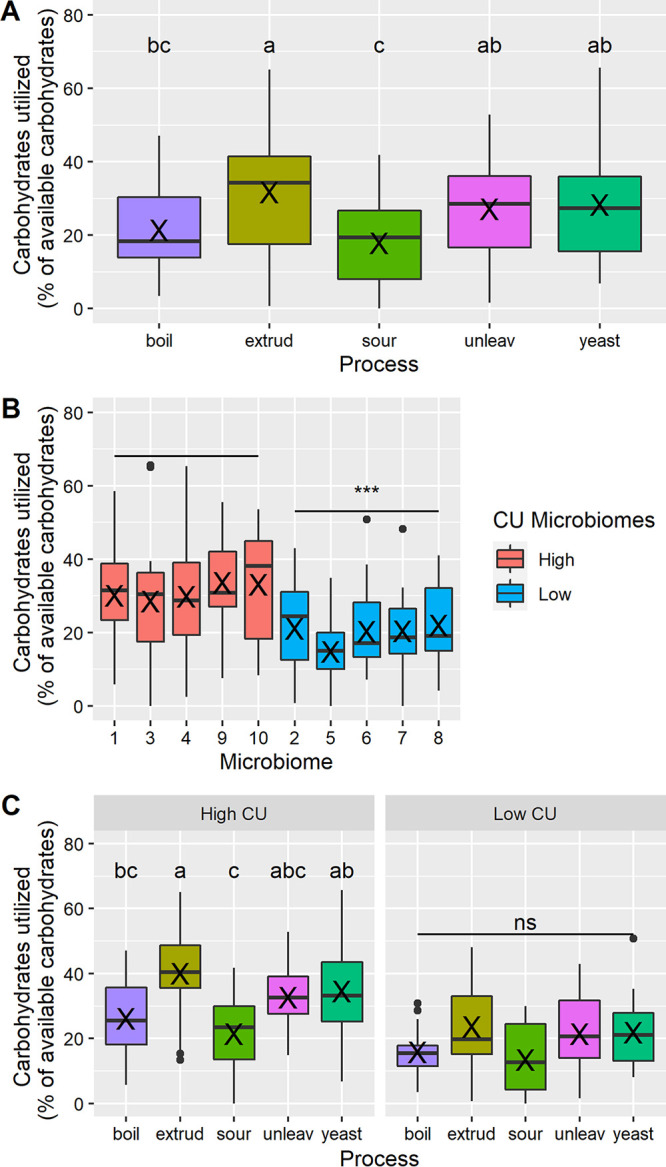
Microbiota-accessible carbohydrates in processed whole-wheat samples. Results are presented according to processing method (A), microbiome (B), and processing method and carbohydrate utilization (CU) group (C). Boil, boiled wheat; extrud, extruded wheat; sour, sourdough bread; unleav, unleavened bread; yeast, yeast-leavened bread. Within box plots, X indicates the mean. Different letters (a, b, c) indicate significant differences among processing methods. ns, no significant differences among processing methods; ***, P < 0.001 for high-CU group versus low-CU group.
Examining the results by microbiome, it was evident that CU across 5 microbiomes (1, 3, 4, 9, 10) was higher than that of the other 5 microbiomes (2, 5–8) (Fig. 2B). Indeed, the microbiomes exhibiting high CU fermented 31.1 ± 1.1% of the total carbohydrates during fermentation, compared with only 19.3 ± 1.2% for the low-CU microbiomes (P < 0.001). Thus, microbiomes 1, 3, 4, 9, and 10 were termed “high-CU” and 2, 5, 6, 7, and 8 were termed “low-CU” microbiomes in some subsequent analyses.
An analysis of the proportion of carbohydrates fermented by CU group revealed that the significant differences among processing methods were driven by the high-CU microbiomes; the microbiomes with low CU showed no significant differences among processed samples (Fig. 2C). Notably, however, the differently processed samples ranked the same across CU groups (i.e., extrusion > yeast > unleavened > boiling > sourdough). Therefore, although both CU groups responded similarly to the processed samples, the high-CU microbiomes responded to a greater magnitude than the low-CU microbiomes did.
Comparison of fecal microbiota composition between high- and low-carbohydrate-utilization groups.
Because MAC utilization was the primary outcome of this research, it was relevant to identify features of the fecal microbiota that were associated with high CU during in vitro fermentation of the processed grains. First, the relationship between diversity metrics and CU group was examined. Principal-coordinate analysis based on the Bray-Curtis β-diversity distance matrix did not group, cluster, or separate microbiomes (0 h fermentation) based on CU group (Fig. S1A). However, α-diversity was different among microbiome groups: high-CU microbiomes had significantly more amplicon sequence variants (ASVs) and were more phylogenetically diverse than the low-CU microbiomes (Fig. 3A). Shannon diversity was not significantly different between high- and low-CU microbiomes.
FIG 3.

Comparison of fecal microbiota composition between high- and low-carbohydrate-utilization (CU) groups. (A) α-diversity; (B to D) differentially abundant ASVs by phylum (B) and within the phyla Bacteroidetes (C) and Firmicutes (D); (E) α-diversity of the Lachnospiraceae and Ruminococcaceae families (E). Boil, boiled wheat; extrud, extruded wheat; sour, sourdough bread; unleav, unleavened bread; yeast, yeast-leavened bread. Within box plots, X indicates the mean. **, P < 0.01, and ***, P < 0.001, for high-CU group versus low-CU group.
Microbiota composition was compared between the high- and low-CU groups. There were 154 differential ASVs between the high- and low-CU microbiomes, with 97 ASVs being significantly associated with the high-CU microbiomes and 57 associated with the low-CU microbiomes (Fig. 3C). There was one ASV in each of the three low-abundance phyla, Cyanobacteria, Synergistetes, and Verrucomicrobia, that was associated with the high-CU microbiomes. Most of the differentially abundant ASVs were from the phyla Bacteroidetes and Firmicutes.
Within the phylum Bacteroidetes, ASVs assigned to Butyricimonas, Odoribacter, and Alistipes and several unassigned genera were associated with the high-CU microbiomes, while CF231 (a member of the Paraprevotellaceae) and Paraprevotella were associated with the low-CU microbiomes (Fig. 3D). The high-CU microbiomes also had five differentially abundant ASVs in the genus Prevotella, while the low-CU microbiomes had only one differentially abundant ASV in this genus. Indeed, at the genus level, the high-CU group had significantly higher relative abundance of Prevotella, while the low-CU group had higher Bacteroides abundance (Prevotella: high CU, 17.5% ± 0.9%, versus low CU, 0.9% ± 0.5%, Wilcoxon P = 0.002; Bacteroides: high CU, 12.0% ± 2.1%, versus low CU, 24.2% ± 3.8%, Wilcoxon P = 0.03).
Within the phylum Firmicutes, the composition within the most abundant families, Lachnospiraceae and Ruminococcaceae, was very different between the high- and low-CU microbiomes (Fig. 3E). Within the family Lachnospiraceae, the high-CU microbiome had one differential ASV in the genus Dorea but also had seven differentially abundant ASVs in the genus Coprococcus, compared with three in the low-CU group. The low-CU microbiomes had differentially abundant ASVs in Ruminococcus, Blautia, and Lachnospira. Each CU group had seven unassigned Lachnospiraceae that differed between the two groups. Within the family Ruminococcaceae, the high-CU microbiomes had 30 differentially abundant ASVs, compared to only 9 in the low-CU group. The differential ASVs in the high-CU microbiomes were mainly from Oscillospira, Ruminococcus, and unassigned genera. Apart from the families Lachnospiraceae and Ruminococcaceae, ASVs assigned to Catenibacterium, Megamonas, and Megasphaera and an unassigned member of the Mogibacteriaceae were associated with high-CU microbiomes, while ASVs from Enterococcus, Streptococcus, Veillonella, and a few unassigned genera were associated with low-CU microbiomes.
Since there were evident differences at the ASV level between CU groups within the families Lachnospiraceae and Ruminococcaceae, we examined the diversity and abundance of each family. The relative abundances of these two families were not significantly different between the high-CU and low-CU microbiomes (Lachnospiraceae: high CU, 22.5% ± 2.5%, versus low CU, 28.1% ± 1.3%, Wilcoxon P = 0.1; Ruminococcaceae: high CU, 21.0% ± 2.1%, versus low CU, 21.2% ± 3.7%, Wilcoxon P = 0.9). Likewise, the α-diversity within the family Lachnospiraceae was not different between the two CU groups; however, Ruminococcaceae was significantly more diverse in the high-CU group than the low-CU group by all α-diversity metrics analyzed (Fig. 3B).
Relationships among grain processing method, carbohydrate utilization microbiome group, and microbiome diversity after fermentation.
As seen for the fecal samples, principal-coordinate analysis based on the Bray-Curtis β-diversity distance matrix did not group, cluster, or separate microbiomes based on grain processing method or CU group after fermentation (Fig. S1B and C). However, to determine if there were differences in the magnitude of shift in microbiota composition during fermentation among processing methods or CU groups, we examined Bray-Curtis distance between the fecal samples and the fermented samples. Extrusion of wheat caused the greatest shift in microbiota composition, measured in terms of Bray-Curtis distance from the fecal sample, among processing methods, and this shift was significantly greater than that seen with boiled wheat and unleavened bread (Fig. 4A). Between CU groups, the low-CU microbiomes had greater shifts in composition during fermentation than the high-CU microbiomes (Fig. 4B).
FIG 4.

Microbiome diversity after fermentation. (A and B) Bray-Curtis distance from fecal sample; (C and D) α-diversity; (E and F) α-diversity within the families Lachnospiraceae and Ruminococcaceae. Boil, boiled wheat; extrud, extruded wheat; sour, sourdough bread; unleav, unleavened bread; yeast, yeast-leavened bread. Within box plots, X indicates the mean. Different letters (a, b) indicate significant difference among processing methods. **, P < 0.01, and ***, P < 0.001, for high-CU group versus low-CU group.
Extrusion resulted in lower α-diversity after fermentation than unleavened bread (Fig. 4C). The other processing methods fell between these two processing methods. The high-CU microbiomes were more diverse than the low-CU microbiomes by all diversity metrics analyzed (Fig. 4D), including Shannon diversity, which was not different between the fecal microbiomes (Fig. 3A).
Diversity within the families Lachnospiraceae and Ruminococcaceae was also examined across processing methods and between CU groups. Within the family Lachnospiraceae, grain processing resulted in significant differences in observed ASVs and Shannon diversity, with extrusion supporting generally lower diversity than the other samples (Fig. 4E). Extrusion also supported lower diversity in the family Ruminococcaceae using observed ASVs. The high-CU microbiomes were more diverse than the low-CU microbiomes by all diversity metrics analyzed, including Lachnospiraceae diversity (Fig. 4F), which was not different between the fecal microbiomes (Fig. 3B).
Changes in microbiota composition during fermentation.
Fermentation resulted in 31 differentially abundant ASVs across the five grain processing methods. In a clustered heat map generated using these 31 differential ASVs, the minimally processed samples of boiled wheat and unleavened bread clustered together and the fermented breads (yeast and sourdough) clustered together, with extruded wheat being separated from the other samples (Fig. 5A). The 31 differential ASVs could be grouped into five clusters, each representing ASVs that distinguish the five processing methods. The first 2 clusters contained the ASVs associated with the minimally processed samples. These clusters included all of the ASVs belonging to the phylum Bacteroidetes as well as a few from other phyla. The next cluster represented ASVs that were associated with the extruded wheat. ASVs that were increased on extruded wheat included one from the phylum Proteobacteria (Acinetobacter) as well as two in the phylum Firmicutes not normally associated with complex carbohydrate degradation (Enterococcus and an unassigned member of the Staphylococcaceae). The extruded wheat also resulted in a noticeable dearth of ASVs in the other clusters, namely, from the genus Prevotella in the phylum Bacteroidetes and, in the phylum Firmicutes, several ASVs from Lachnospiraceae (Coprococcus, Anaerostipes, Lachnospira, Pediococcus, and unassigned) and Ruminococcaceae (Oscillospira and Ruminococcus). The fourth cluster consisted of ASVs belonging mostly to the order Lactobacillales that were associated with the sourdough bread. The last cluster, representing ASVs associated with the yeast-leavened bread, contained the single ASV from Actinobacteria, a member of the genus Eggerthella, and a number of carbohydrate-degrading Firmicutes, including Coprococcus, Ruminococcus, and an unassigned member of the Lachnospiraceae.
FIG 5.

Clustered heat maps of differentially abundant ASVs among processing methods after fermentation. (A) All microbiomes; (B) high-carbohydrate-utilization (CU) microbiomes; (C) low-CU microbiomes. Centered and scaled data were clustered by Euclidian distance using Ward’s method; ASVs were named by genus (or lowest taxonomic rank available) followed by the first 4 characters of the feature ID generated from QIIME2.
When data were analyzed by CU group, 16 of the 31 differential ASVs remained significantly different across processing methods in the high-CU microbiomes, while 12 were significant in the low-CU group. A heat map of the high-CU microbiomes showed that extrusion resulted in a distinct composition compared with the other samples (Fig. 5B). Selectivity for Acinetobacter, Enterococcus, and an unassigned member of the Staphylococcaceae was evident, which was similar to the full data set. In contrast, the clustering of the processed samples was very different from the full data set when only the low-CU microbiomes were used (Fig. 5C). In this case, sourdough was separated from the other processed samples and led to increases in several ASVs assigned to the order Lactobacillales.
Relationships among grain processing method, carbohydrate utilization microbiome group, and short-chain fatty acid production during fermentation.
Even though processing method resulted in significant differences in MAC and microbiota composition during fermentation, no differences in SCFA production were evident when data were analyzed across all 10 microbiomes (Fig. 6A). However, between the high and low-CU microbiomes, the high-CU microbiomes produced more butyrate and the low-CU microbiomes produced more propionate (Fig. 6B). When the differences among processing methods were analyzed within CU groups, the high-CU microbiomes were able to distinguish among processed samples, with sourdough bread resulting in higher butyrate production than extruded wheat (Fig. 6C). The low-CU microbiomes showed no significant differences among processed wheat samples.
FIG 6.

Short-chain fatty acid (SCFA) production during 12 h of in vitro fermentation of processed whole-wheat samples. (A) Processing method; (B) carbohydrate utilization (CU) group; (C) processing method within CU group. Boil, boiled wheat; extrud, extruded wheat; sour, sourdough bread; unleav, unleavened bread; yeast, yeast-leavened bread. Within box plots, X is the mean. Different letters (a, b) indicate significant difference among processing methods. ns, no significant differences among processing methods; ***, P < 0.001 for high-CU group versus low-CU group.
DISCUSSION
Due to the effect of processing on the physicochemical composition of the nondigestible carbohydrates in whole grains, five common processing methods for whole wheat were evaluated for their influence on MAC. Across the 10 microbiomes, extrusion resulted in the highest level of MAC and sourdough bread the lowest. However, microbiomes differed significantly in the magnitude of CU, where high-CU microbiomes exhibited, on average, 37.5% more carbohydrate fermentation than those in the low-CU group. It was only these high-CU microbiomes that were able to distinguish (significantly) among the differently processed samples in terms of both MAC and butyrate production; the low-CU microbiomes showed no significant differences between processed samples. Although there were no significant differences in MAC among processed samples when they were fermented with the low-CU microbiomes, the numeric ranking of the samples was the same as for the high-CU microbiomes (i.e., extruded wheat > yeast-leavened bread > unleavened bread > boiled wheat > sourdough bread). Therefore, the processing methods induced similar but diminished responses in the low-CU microbiomes compared to the high-CU microbiomes.
These results are similar to those of a previous study performed in our laboratory (using different fecal donors) where only microbiomes in the high-CU group showed significant differences in MAC and butyrate production among different types of grain (19). This provides some possible insight into why some individuals “respond” in terms of improvements in host health, while others are “nonresponders” (20). Since fermentation by the microbiome is considered critical for bringing about the health benefits of many dietary fibers (8), diminished fiber fermentation may attenuate these effects. Others have noted that food science and food processing will play a central role in the development of foods that target the microbiome (21). However, judging from the present results, it may be that only people who harbor microbiomes that are capable of high CU will be able to realize the benefits of such foods derived from whole wheat.
The microbiomes in the high-CU group exhibited some important differences compared to the low-CU microbiomes in the fecal samples that help explain why the high-CU microbiomes were able to ferment more carbohydrates. First, the high-CU microbiomes were significantly more diverse in terms of observed ASVs, but not Shannon diversity, than the low-CU microbiomes. Since observed ASVs takes into account only presence or absence of ASVs without considering abundance, while Shannon diversity takes into account the abundance (evenness), this suggests that the high-CU microbiomes had more low-abundance ASVs than low-CU microbiomes. Indeed, when differentially abundant ASVs were analyzed between the two CU groups, many more ASVs were significantly associated with the high-CU microbiomes than the low-CU microbiomes. In general, having a diverse microbial community results in a broader range of carbohydrate fermenters that are able to hydrolyze a wider range of glycosidic bonds and carbohydrate configurations (22). Upon examination of the differentially abundant ASVs between CU groups, it was immediately evident that the composition within the families Lachnospiraceae and Ruminococcaceae in particular was very different (not in terms of overall relative abundance but in terms of types of ASVs present). This was especially relevant because members of these families have been identified as important complex-fiber degraders (23).
Although we did not collect dietary data from the subjects that donated fecal samples for this study, the differences in microbiota composition between the high- and low-CU microbiomes suggest that the high-CU microbiomes may have come from fecal donors with higher diet quality, including higher fiber intakes. Several previous studies have shown associations between host dietary fiber intake and abundance of Prevotella and certain fiber-degrading members of the families Lachnospiraceae and Ruminococcaceae (24–26), which were notable distinguishing differences between the high- and low-CU microbiomes in this study. Furthermore, in a previous study, we did differentiate microbiomes on the basis of fiber intake and found that only the microbiomes from donors with high fiber intake showed significant differences between different types of grain, which is analogous to different processing methods in the present study (19).
Although important differences in microbiome diversity and composition between the high- and low-CU microbiomes were noted in fecal samples, the changes that occurred during fermentation exaggerated these differences. For instance, in the fecal samples, Shannon diversity across the entire microbiota was not different between the high- and low-CU microbiomes, nor were any of the measures of α-diversity within the family Lachnospiraceae. However, after fermentation, all of these metrics were significantly different. The high-CU microbiomes not only were more diverse before fermentation but also maintained that diversity even during fermentation. In contrast, the low-CU microbiomes started with less diversity and ended with even less diversity. This was evident in the β-diversity results, where the high-CU microbiomes exhibited a smaller shift during fermentation than the low-CU microbiomes.
The smaller shift could be framed as microbiota “resilience.” Previous research has shown that when the microbiome undergoes a severe perturbation, such as an antibiotic regimen, a fiber-rich diet increases resilience; i.e., it reduces loss of taxa and speeds the time until the microbiota recovers (27). Using a stool sample in an in vitro fermentation experiment could certainly be classified as a severe perturbation to the microbiota, where it is taken from its normal environment and moved to a test tube.
Within the high-CU group, some important significant differences were exhibited between processing methods. At the outset of the study we hypothesized that extrusion would result in the highest MAC, since previous researchers have shown that extrusion leads to modifications in the carbohydrates, such as increased porosity and fineness of cell wall structures and the conversion of a portion of the insoluble fiber to soluble fiber, which is generally considered more fermentable (22). This is indeed what we found. Surprisingly, however, this was not accompanied by higher butyrate production. This may be explained by the decreases in α-diversity and carbohydrate-degrading bacteria from the families Ruminococcaceae and Lachnospiraceae, which are important butyrate producers in the gut (28). Instead, extrusion resulted in increases in Acinetobacter, Enterococcus, and Staphylococcaceae, some members of which grow rapidly and prolifically in fermentation media but are not butyrate producers (29).
Therefore, the disruption of the cell wall matrix by extrusion may change the competition dynamics among bacteria such that the microbiota is less reliant on specialized complex carbohydrate-degrading microorganisms to initiate cell wall metabolism; i.e., cell wall breakdown is already initiated by the extrusion process. This would mean that fast-growing microbes could outcompete other bacteria for the newly available MAC, leading to decreased diversity and decreases in butyrate producers (Fig. 7).
FIG 7.

Schematic of proposed fermentation of nondigestible carbohydrates from whole grains processed through sourdough versus extrusion.
The unexpected dichotomy between high carbohydrate fermentation and low butyrate production introduces the importance of microbiota-accessible-carbohydrate quality rather than just quantity. There are several papers and reviews that discuss the importance of fiber structure for fermentation properties (30). In these papers, authors argue that the structure of the fiber, rather than simply the quantity, should be considered when selecting a dietary fiber to promote gut health. Here, extrusion was effective in increasing fermentable fiber, but the fiber that was released was not associated with positive outcomes. Therefore, food processing operations that are designed to increase carbohydrate fermentation should increase accessibility of “quality” carbohydrates, i.e., carbohydrates that will support beneficial microbes (such as butyrate producers) in the gut, rather than just increasing carbohydrate fermentation in general.
The high CU and low butyrate production during fermentation of the extruded wheat are different from results of a previous study conducted in our laboratory using wheat bran instead of whole grain (12). In our previous study, extrusion led to increased CU but also showed increases in butyrate production compared to boiling wheat bran. The contrasting results could be due to the different substrates (whole wheat versus wheat bran). Wheat bran, which primarily consists of nonstarch polysaccharides, has an increased concentration of cell wall components. Thus, the effect of extrusion on MAC and SCFA production could have been diminished in the present study due to the dilution of the cell wall components in whole grains compared to what bran. Indeed, in the previous study, the extruded bran was reconstituted to whole-wheat flour to make whole-grain breads and there were no significant differences in MAC or SCFA production between the whole-grain breads after fermentation.
Importantly, the extrusion conditions selected in this study were very severe. These were chosen based on our previous study with wheat bran to maximize the effects of the processing method (12). However, the combination of very low moisture and high temperature and screw speed would be unlikely to be used in a typical food product. Therefore, the effect of extrusion on gut microbial fermentation in real food products may not be as pronounced as shown in this study.
In contrast to extrusion, the sourdough bread making process resulted in lower CU yet resulted in higher butyrate production in the high-CU microbiomes. Sourdough bread, along with the other breads, resulted in increased abundance of beneficial microbes from the families Ruminococcaceae and Lachnospiraceae that ferment complex carbohydrates to SCFA (23). Sourdough-like fermentation of wheat bran with enzyme mixtures and yeast has been previously shown to promote SCFA production in vitro compared to native wheat bran (17).
The especially high butyrate production from fermentation of the sourdough samples could be a result of the changes in the starch that occur during the sourdough process. Sourdough has been shown to increase the leaching of amylose during bread making, which is rapidly retrograded during cooling and is associated with resistant starch (10, 31). Indeed, together with the boiled wheat, the sourdough bread samples had the most resistant starch among samples from all of the processing methods.
Although resistant starch may explain some of the positive effects noted during fermentation of the sourdough samples, it cannot explain everything. As mentioned, the boiled samples contained concentrations of resistant starch similar to those in the sourdough samples, yet boiling resulted in only moderate butyrate production, maintenance of microbial diversity, and increases in Lachnospiraceae and Ruminococcaceae. Therefore, the sourdough process must induce some additional effects, likely on the cell wall polysaccharides (10), that help maintain microbial diversity and enable high butyrate production (Fig. 7).
In summary, it is hypothesized that severe extrusion changes the microstructure of carbohydrates in whole grains by breaking down the cell wall components. These changes in structure result in easier access to the cell wall polysaccharides by microbiotas with high capacity for CU. This changes the competition dynamics among the microbes such that the fastest-growing taxa can outcompete specialized cell wall-degrading bacteria that typically break down cell wall polysaccharides but may grow more slowly. This leads to decreased diversity and production of beneficial metabolites such as butyrate. In contrast, during sourdough bread making, increased resistant starch together with minor modifications to the cell wall matrix creates higher-quality MAC in terms of both variety and complexity. These phenomena lead to a more diverse microbiome that has increased capacity to produce SCFA, especially butyrate, in microbiomes with high CU. Similar trends can be seen in microbiomes with low CU, but the differences are diminished. This information can be used to better understand how to use food processing to create microbiota-directed foods that promote a healthy microbiome.
MATERIALS AND METHODS
Whole wheat processing.
Hard red wheat was obtained from Bay State Milling (Quincy, MA). Wheat kernels were dried at 40°C for 16 h before milling as described previously (32). All milled fractions obtained from the mill were mixed together to obtain whole-wheat flour.
For boiling, water (530 g) was brought to a boil on a gas range. Once the water was boiling, the heat was reduced to a simmer, and 1 g of salt and 100 g of whole-wheat flour were added with rapid manual stirring for 5 min. The boiled wheat porridge was then cooled to room temperature before being frozen at −80°C and then freeze-dried. This procedure was performed in triplicate.
For extrusion, whole-wheat flour (1 kg) was mixed for 10 min with 1% salt (wt/wt) and water to adjust to a 20% moisture content (dry weight basis) in a stand mixer (c-100; Hobart, Troy, OH). The mixtures were equilibrated in closed containers at 4°C overnight. The moisture-adjusted whole-wheat flours were then extruded using a benchtop-scale twin-screw extruder (C.W. Brabender Instruments, NJ, USA) equipped with a single-stage mixing zone and a 3-mm outlet die at 250 rpm, a 3:1 compression ratio, and a 20:1 length/diameter (L/D) ratio. The extruder was operated by a direct current drive unit (Intelli-Torque Plasti-Corder lab station; C.W. Brabender) with a 5.6-kW motor. The flour was fed into the extruder using a volumetric feeder (FW 40 Plus; C.W. Brabender) set at a constant flow rate of ∼50 g/min. Barrel temperatures were set at 60°C (zone 1; inlet), 70°C (zone 2), 120°C (zone 3), and 120°C (zone 4; die assembly). Samples were collected from the extruder die once steady state had been reached. Extrudates were then dried in a convection oven overnight at 70°C to complete the extrusion processing. Although the product contained very low moisture at this stage (∼3%), the dried extrudates were subject to freeze-drying (model 3600 freeze dryer; Freeze Dry Co., Pine River, MN) because the other processed wheat products were freeze-dried following processing. The whole-wheat flour was extruded in triplicate.
For bread making, this study employed an in-house method for bread making that involved production of flatbreads. Flatbread-type breads were selected because they can be made using any of the three selected fermentation procedures: unleavened, baker’s yeast fermentation, or sourdough fermentation. The procedures were planned to unify the essential bread making procedures and vary only the steps that were unique to each fermentation procedure. For the baker’s yeast fermentation, instant dry yeast was used (Saf Instant Red; Lesaffre, Milwaukee, WI). For the sourdough fermentation, a type 1 spontaneous sourdough starter culture was used. To prepare the culture, 50 g of whole-wheat flour and 50 g of water (100% absorption) were incubated at 30°C for 24 h, whereupon 50 g of that mixture was mixed with 50 g of fresh whole-wheat flour and 50 g of water and then allowed to ferment for another 24 h at 30°C. After 5 days, the starter culture was sampled for yeast and lactic acid bacteria using standard methods (33, 34). At this point, the culture contained 107 CFU/g of lactic acid bacteria and 106 CFU/g of yeast, measured using standard methods. During the analysis, daily feeding of the starter culture was continued. Once sufficient numbers of yeast and lactic acid bacteria were confirmed, the starter culture was used to make breads, which was on day 9.
All breads were prepared on the same day in triplicate 500-g batches with 70% absorption (70 g water/100 g whole-wheat flour on a 14% moisture basis). The doughs were prepared by kneading for 10 min in an electric stand mixer with a dough hook at speed 2 (KitchenAid; Whirlpool, Benton Harbor, MI, USA). The dough was then rounded by hand, covered, and allowed to rest for 20 min (unleavened) or ferment for 90 min (baker’s yeast) or 240 min (sourdough). The dough was then divided into five 100-g pieces, rounded by hand, covered, and allowed to rest for 20 min. The dough was then sheeted by passing through a dough sheeting device (KitchenAid) to a thickness of 6 mm. A fork was then used to poke holes in the top of the dough piece uniformly 5 cm apart (docking) to prevent bubbling up during baking. The flatbreads were then baked for 4 min at 232°C. The baked flatbread was cooled overnight at room temperature inside a plastic bag once the flatbreads were at room temperature and then freeze-dried.
In vitro digestion.
Samples were digested following established procedures (35). Briefly, freeze-dried processed whole-wheat products were broken into small pieces by hand. Twenty-five grams of sample were then stomached with 300 ml of water for 1 min. Then, the pH was adjusted to 2.5 with 1 M HCl followed by the addition of 10 ml of 10% (wt/vol) pepsin (P7000; Sigma, St. Louis, MO) in 50 mM HCl. The slurry was then incubated for 30 min at 37°C with orbital shaking at 150 rpm. Following pepsinolysis, 50 ml of 0.1 M sodium maleate buffer (pH 6, containing 1 mM CaCl2) was added, and the pH was adjusted to 6.9 with 1 M NaHCO3. Next, 50 ml of 12.5% (wt/vol) pancreatin (P7545; Sigma) in sodium maleate buffer was added followed by 2 ml of amyloglucosidase (3,260 U/ml; Megazyme, Bray, Ireland). The slurry was then incubated for 6 h 37°C with orbital shaking at 150 rpm. Following digestion, the material was transferred to dialysis tubing (molecular weight cutoff, 12,000 to 14,000) and dialyzed against distilled water for 4 days at 4°C with a water change at least every 12 h. The retentate from dialysis was collected and freeze-dried.
In vitro fermentation.
Fresh fecal samples from 10 healthy adults with no history of gastrointestinal abnormalities and no prebiotic, probiotic, or antibiotic consumption within the past 6 months were collected. All procedures involving human subjects were approved by the Institutional Review Board of the University of Nebraska–Lincoln before initiating the study (approval number 20160816311EP). A fecal slurry was prepared in an anaerobic hood (Bactron X [Sheldon Manufacturing, Cornelius, OR, USA]; containing 5% H2, 5% CO2, and 90% N2) within 2 h of defecation by blending (model 2774 blender; Sunbeam) each fresh fecal sample separately with sterile phosphate-buffered saline, pH 7.0 (1:9 wt/vol), containing 10% glycerol as a cryoprotectant for 1 min. The slurry was then filtered through 4 layers of sterile cheesecloth and then frozen at −80°C until fermentation was performed. Two fecal slurries from fecal samples collected on different days (from 1 day to 2 weeks apart) were prepared from each individual.
In vitro batch fecal fermentation was performed as described previously (35). Briefly, inside the anaerobic hood, 15 mg of the freeze-dried material obtained after in vitro digestion and dialysis of the processed whole-wheat products was suspended in 1 ml of sterile fermentation medium containing (per liter) peptone (2 g; Fisher Scientific, Waltham, MA), yeast extract (2 g; Fisher Scientific, Waltham, MA), bile salts (0.5 g; Oxoid, Cheshire, England), NaHCO3 (2 g), NaCl (0.1 g), K2HPO4 (0.08 g), MgSO4·7H2O (0.01 g), CaCl2·6H2O (0.01 g), l-cysteine hydrochloride (0.5 g; Fisher Scientific, Waltham, MA), hemin (50 mg dissolved in dimethyl sulfoxide [DMSO]), Tween 80 (2 ml, Fisher Scientific, Waltham, MA), vitamin K (10 μl, dissolved in ethanol; Alfa Aesar, Haverhill, MA), and 0.025% (wt/vol) resazurin solution (4 ml, dissolved in water; Alfa Aesar, Haverhill, MA), capped, and hydrated for 1 h. Tubes were then inoculated with 0.1 ml of fecal slurry, capped, and incubated at 37°C with orbital shaking (140 rpm) for 12 h before being flash frozen in liquid nitrogen. Samples that were immediately flash frozen in liquid nitrogen following inoculation were used as controls (0 h fermentation). After freezing in liquid nitrogen, tubes were stored at −80°C until analysis. Because most of the dietary fibers in whole grains are not soluble, separate fermentation tubes were prepared for analysis of carbohydrates versus microbiota composition and SCFA.
A 12-h fermentation time was selected because previous in vivo carbohydrate balance studies have reported that (on average) one third of the nondigestible carbohydrates in grains are fermented by gut bacteria (6, 7). Therefore, we performed preliminary studies to determine how long fermentation should proceed to reach fermentation of one-third of the carbohydrates. Based on fermentation using 49 separate microbial communities, we found that this was 12 h (Fig. S2). Therefore, even though this represents a shorter time than typical transit time, it represents the time required to ferment approximately the proportion of carbohydrates that would be fermented in vivo, which was our primary objective.
Carbohydrate analysis.
For analysis of the proportion of nondigestible carbohydrates fermented by the microbiota, a modified version of the procedure used by Arcila et al. (12). The entire contents of the tubes designated for carbohydrate analysis were freeze-dried. The freeze-dried samples were then treated with 0.3 ml of 12 M sulfuric acid for 1 h at 30°C with periodic vortex mixing to begin the hydrolysis. One milliliter of a fucose solution (5 mg/ml) was then added as an internal standard, and 7.7 ml of water was added to bring the final sulfuric acid concentration to 0.4 M. The samples were then autoclaved at 121°C for 1 h, cooled, and filtered through a 0.45-μm membrane filter. Ten microliters was injected into a high-performance anion-exchange chromatograph (ICS-5000+ SP; Dionex) equipped with an anion-exchange column (CarboPac PA1; Dionex) operating at 30°C with a 1-ml/min flow rate. The eluent was 200 mM NaOH for column cleaning followed by 10 min of equilibration of 3 mM NaOH before injection of the sample. The sugars were detected over 22 min with pulsed amperometry waveform (ICS-5000+ SP chromatograph; Dionex). Sugar residues were quantified by calculating response factors for each sugar relative to fucose using injections of pure standards. The concentration of each sugar residue was corrected for its weight as it occurs in a polysaccharide (0.88 × weight for pentose sugars and 0.9 × weight for hexose sugars). The percent change in the amount of carbohydrates measured was calculated to determine the proportion of MAC. Total carbohydrates were measured with the same procedure using 100 mg of raw, processed, or digested whole wheat. Total starch in the processed whole-grain samples and after digestion was measured using a kit according to the manufacturer’s directions (K-TSTA; Megazyme, Bray, Ireland). The starch remaining in the processed samples after digestion was considered resistant starch.
Microbiota composition.
Changes in microbial population were observed using 16S rRNA sequencing. A kit from Biovet (BioSprint 96 One-For-All Vet kit; Biovet, Quebec, Canada) was used for bacterial DNA extraction. Microbiome characterization was performed by amplicon sequencing of the V4 region of the 16S rRNA gene on the Illumina MiSeq platform using the MiSeq reagent kit v2 (2 × 250 bp) following the protocol of Kozich et al. (36). Sequences were demultiplexed and barcodes were removed prior to sequence analysis with the QIIME 2 platform (37). Sequence quality control, trimming, chimera removal, and denoising were performed with DADA2 (38). Forward and reverse reads were truncated to 245 and 160 bp, respectively, to maintain sequence qualities above a phred score of 30. Using DADA2, sequences were dereplicated into 100% ASVs for exact sequence matching. Taxonomy was assigned using the Greengenes database (39). Reads were rarefied to a sampling depth of 9,000 prior to statistical and diversity analyses. Diversity metrics of the fecal and fermented samples were calculated using QIIME2.
Short-chain fatty acid analysis.
SCFA were extracted and measured by gas chromatography as described previously (40). In brief, 0.4 ml of fermented sample, 0.1 ml of 7 mM 2-ethylbutyric acid in 2 M potassium hydroxide, 0.2 ml of 9 M sulfuric acid, and ∼0.1 g of sodium chloride were mixed together. Then, 0.5 ml of diethyl ether was added and mixed. The top layer was injected into a gas chromatograph (Clarus 580; PerkinElmer, MA, USA) equipped with a capillary column (Nukol; 30 m by 0.25 mm [inner diameter] by 0.25 μm [film thickness]; Supelco, Bellefonte, PA) and flame ionization detector. SCFA were quantified by calculating response factors for each SCFA relative to 2-ethylbutyric acid using injections of pure standards.
Statistical analysis.
Two-factor analysis of variance (ANOVA) was used to determine the effect of process and microbiome (or CU microbiome group) and their interaction on MAC, SCFA, and α-diversity of the microbiota (SAS version 9.4; SAS Institute, Cary, NC, USA). Tukey’s honestly significant difference (HSD) test was used to determine significant differences among samples within a factor, where a P value of <0.05 was considered significant. To determine differential ASVs between CU groups or among processing methods, the DESeq2 package in R (version 4) was used (41). To plot the differential ASVs among processing methods, a clustered heat map was generated where the centered and scaled data were clustered by Euclidian distance using Ward’s method (pheatmap package in R).
Data availability.
Raw sequence reads and metadata from fecal samples and in vitro fermentations are available in the SRA under accession no. PRJNA603983.
Supplementary Material
ACKNOWLEDGMENTS
We gratefully acknowledge funding from the Nebraska Agricultural Experiment Station Hatch Multistate Research capacity funding program (accession number 224073) and from the Nebraska Food for Health Center.
Footnotes
Supplemental material is available online only.
REFERENCES
- 1.Koropatkin NM, Cameron EA, Martens EC. 2012. How glycan metabolism shapes the human gut microbiota. Nat Rev Microbiol 10:323–325. doi: 10.1038/nrmicro2746. [DOI] [PMC free article] [PubMed] [Google Scholar]
- 2.Den Besten G, Van Eunen K, Groen AK, Venem AK, Venema K, Reijngoud DJ, Bakker BM. 2013. The role of short-chain fatty acids in the interplay between diet, gut microbiota, and host energy metabolism. J Lipid Res 54:2325–2340. doi: 10.1194/jlr.R036012. [DOI] [PMC free article] [PubMed] [Google Scholar]
- 3.Kasubuchi M, Hasegawa S, Hiramatsu T, Ichimura A, Kimura I. 2015. Dietary gut microbial metabolites, short-chain fatty acids, and host metabolic regulation. Nutrients 7:2839–2849. doi: 10.3390/nu7042839. [DOI] [PMC free article] [PubMed] [Google Scholar]
- 4.Puertollano E, Kolida S, Yaqoob P. 2014. Biological significance of short-chain fatty acid metabolism by the intestinal microbiome. Curr Opin Clin Nutr Metab Care 17:139–144. doi: 10.1097/MCO.0000000000000025. [DOI] [PubMed] [Google Scholar]
- 5.Daniel M, Wisker E, Rave G, Feldheim W. 1997. Fermentation in human subjects of nonstarch polysaccharides in mixed diets, but not in a barley fiber concentrate, could be predicted by in vitro fermentation using human fecal inocula. J Nutr 127:1981–1988. doi: 10.1093/jn/127.10.1981. [DOI] [PubMed] [Google Scholar]
- 6.Nyman M, Asp NG, Cummings J, Wiggins H. 1986. Fermentation of dietary fibre in the intestinal tract: comparison between man and rat. Br J Nutr 55:487–496. doi: 10.1079/bjn19860056. [DOI] [PubMed] [Google Scholar]
- 7.Wisker E, Daniel M, Rave G, Feldheim W. 1998. Fermentation of non-starch polysaccharides in mixed diets and single fibre sources: comparative studies in human subjects and in vitro. Br J Nutr 80:253–261. doi: 10.1017/S0007114598001305. [DOI] [PubMed] [Google Scholar]
- 8.Sonnenburg ED, Sonnenburg JL. 2014. Starving our microbial self: The deleterious consequences of a diet deficient in microbiota- accessible carbohydrates. Cell Metab 20:779–786. doi: 10.1016/j.cmet.2014.07.003. [DOI] [PMC free article] [PubMed] [Google Scholar]
- 9.Awika JM, Rose DJ, Simsek S. 2018. Complementary effects of cereal and pulse polyphenols and dietary fiber on chronic inflammation and gut health. Food Funct 9:1389–1409. doi: 10.1039/c7fo02011b. [DOI] [PubMed] [Google Scholar]
- 10.Johansson DP, Vázquez Gutiérrez JL, Landberg R, Alminger M, Langton M. 2018. Impact of food processing on rye product properties and their in vitro digestion. Eur J Nutr 57:1651–1666. doi: 10.1007/s00394-017-1450-y. [DOI] [PMC free article] [PubMed] [Google Scholar]
- 11.Rose DJ, Patterson JA, Hamaker BR. 2010. Structural differences among alkali-soluble arabinoxylans from maize (Zea mays), rice (Oryza sativa), and wheat (Triticum aestivum) brans influence human fecal fermentation profiles. J Agric Food Chem 58:493–499. doi: 10.1021/jf9020416. [DOI] [PubMed] [Google Scholar]
- 12.Arcila JA, Weier SA, Rose DJ. 2015. Changes in dietary fiber fractions and gut microbial fermentation properties of wheat bran after extrusion and bread making. Food Res Int 74:217–223. doi: 10.1016/j.foodres.2015.05.005. [DOI] [PubMed] [Google Scholar]
- 13.Aoe S, Nakaoka M, Ido K, Tamai Y, Ohta F, Ayano Y. 1989. Availability of dietary fiber in extruded wheat bran and apparent digestibility in rats of coexisting nutrients. Cereal Chem 66:252–255. [Google Scholar]
- 14.Reicks M, Jonnalagadda S, Albertson AM, Joshi N. 2014. Total dietary fiber intakes in the US population are related to whole grain consumption: results from the National Health and Nutrition Examination Survey 2009 to 2010. Nutr Res 34:226–234. doi: 10.1016/j.nutres.2014.01.002. [DOI] [PubMed] [Google Scholar]
- 15.Cleemput G, Booij C, Hessing M, Gruppen H, Delcour JA. 1997. Solubilisation and changes in molecular weight distribution of arabinoxylans and protein in wheat flours during bread-making, and the effects of endogenous arabinoxylan hydrolysing enzymes. J Cereal Sci 26:55–66. doi: 10.1006/jcrs.1996.0099. [DOI] [Google Scholar]
- 16.Damen B, Verspreet J, Pollet A, Broekaert WF, Delcour JA, Courtin CM. 2011. Prebiotic effects and intestinal fermentation of cereal arabinoxylans and arabinoxylan oligosaccharides in rats depend strongly on their structural properties and joint presence. Mol Nutr Food Res 55:1862–1874. doi: 10.1002/mnfr.201100377. [DOI] [PubMed] [Google Scholar]
- 17.Nordlund E, Katina K, Aura AM, Poutanen K. 2013. Changes in bran structure by bioprocessing with enzymes and yeast modifies the in vitro digestibility and fermentability of bran protein and dietary fibre complex. J Cereal Sci 58:200–208. doi: 10.1016/j.jcs.2013.05.006. [DOI] [Google Scholar]
- 18.Smith C. 2019. M.S. thesis. University of Nebraska-Lincoln, Lincoln, NE. [Google Scholar]
- 19.Brahma S, Martínez I, Walter J, Clarke J, Gonzalez T, Menon R, Rose DJ. 2017. Impact of dietary pattern of the fecal donor on in vitro fermentation properties of whole grains and brans. J Funct Foods 29:281–289. doi: 10.1016/j.jff.2016.12.042. [DOI] [Google Scholar]
- 20.Kovatcheva-Datchary P, Nilsson A, Akrami R, Lee YS, De Vadder F, Arora T, Hallen A, Martens E, Björck I, Bäckhed F. 2015. Dietary fiber-induced iImprovement in glucose metabolism is associated with increased abundance of Prevotella. Cell Metab 22:971–982. doi: 10.1016/j.cmet.2015.10.001. [DOI] [PubMed] [Google Scholar]
- 21.Barratt MJ, Lebrilla C, Shapiro HY, Gordon JI. 2017. The gut microbiota, food science, and human nutrition: a timely marriage. Cell Host Microbe 22:134–141. doi: 10.1016/j.chom.2017.07.006. [DOI] [PMC free article] [PubMed] [Google Scholar]
- 22.Holscher HD. 2017. Dietary fiber and prebiotics and the gastrointestinal microbiota. Gut Microbes 8:172–184. doi: 10.1080/19490976.2017.1290756. [DOI] [PMC free article] [PubMed] [Google Scholar]
- 23.Biddle A, Stewart L, Blanchard J, Leschine S. 2013. Untangling the genetic basis of fibrolytic specialization by Lachnospiraceae and Ruminococcaceae in diverse gut communities. Diversity 5:627–640. doi: 10.3390/d5030627. [DOI] [Google Scholar]
- 24.Wu GD, Chen J, Hoffmann C, Bittinger K, Chen YY, Keilbaugh SA, Bewtra M, Knights D, Walters WA, Knight R, Sinha R, Gilroy E, Gupta K, Baldassano R, Nessel L, Li H, Bushman FD, Lewis JD. 2011. Linking long-term dietary patterns with gut microbial enterotypes. Science 334:105–108. doi: 10.1126/science.1208344. [DOI] [PMC free article] [PubMed] [Google Scholar]
- 25.Schnorr SL, Candela M, Rampelli S, Centanni M, Consolandi C, Basaglia G, Turroni S, Biagi E, Peano C, Severgnini M, Fiori J, Gotti R, De Bellis G, Luiselli D, Brigidi P, Mabulla A, Marlowe F, Henry AG, Crittenden AN. 2014. Gut microbiome of the Hadza hunter-gatherers. Nat Commun 5:1–12. doi: 10.1038/ncomms4654. [DOI] [PMC free article] [PubMed] [Google Scholar]
- 26.De Filippis F, Pellegrini N, Vannini L, Jeffery IB, La Storia A, Laghi L, Serrazanetti DI, Di Cagno R, Ferrocino I, Lazzi C, Turroni S, Cocolin L, Brigidi P, Neviani E, Gobbetti M, O'Toole PW, Ercolini D. 2016. High-level adherence to a Mediterranean diet beneficially impacts the gut microbiota and associated metabolome. Gut 65:1812–1821. doi: 10.1136/gutjnl-2015-309957. [DOI] [PubMed] [Google Scholar]
- 27.Ng KM, Aranda-Díaz A, Tropini C, Frankel MR, Van Treuren W, O'Laughlin CT, Merrill BD, Yu FB, Pruss KM, Oliveira RA, Higginbottom SK, Neff NF, Fischbach MA, Xavier KB, Sonnenburg JL, Huang KC. 2019. Recovery of the gut microbiota after antibiotics depends on host diet, community context, and environmental reservoirs. Cell Host Microbe 26:650–665.e4. doi: 10.1016/j.chom.2019.10.011. [DOI] [PMC free article] [PubMed] [Google Scholar]
- 28.Vital M, Karch A, Pieper DH. 2017. Colonic butyrate-producing communities in humans: an overview using omics data. mSystems 2:e00130-17. doi: 10.1128/mSystems.00130-17. [DOI] [PMC free article] [PubMed] [Google Scholar]
- 29.de Vos P, Garrity G, Jones D, Krieg NR, Ludwig W, Rainey FA, Schleifer K-H, Whitman W, (ed). 2009. Bergey’s manual of systematic bacteriology, vol 3 The Firmicutes. Springer, New York, NY. [Google Scholar]
- 30.Hamaker BR, Tuncil YE. 2014. A perspective on the complexity of dietary fiber structures and their potential effect on the gut microbiota. J Mol Biol 426:3838–3850. doi: 10.1016/j.jmb.2014.07.028. [DOI] [PubMed] [Google Scholar]
- 31.Salmenkallio-Marttila MK, Katina K, Autio K. 2001. Effects of bran fermentation on quality and microstructure of high-fiber wheat bread. Cereal Chem 78:429–435. doi: 10.1094/CCHEM.2001.78.4.429. [DOI] [Google Scholar]
- 32.Doblado-Maldonado AF, Flores RA, Rose DJ. 2013. Low moisture milling of wheat for quality testing of wholegrain flour. J Cereal Sci 58:420–423. doi: 10.1016/j.jcs.2013.08.006. [DOI] [Google Scholar]
- 33.Njongmeta NA, Hall PA, Ledenbach L, Flowers RS. 2015. Acid-producing microorganisms In Salfinger Y, Tortorello ML (ed), Compendium of methods for the microbiological examination of foods, 5th ed American Public Health Association, Washington, DC. [Google Scholar]
- 34.Tournas V, Stack ME, Mislivec PB, Koch HA, Bandler R. 2013. Yeasts, molds and mycotoxins In Bacteriological analytical manual, 8th ed Food and Drug Administration, Washington, DC. [Google Scholar]
- 35.Yang J, Keshavarzian A, Rose DJ. 2013. Impact of dietary fiber fermentation from cereal grains on metabolite production by the fecal microbiota from normal weight and obese individuals. J Med Food 16:862–867. doi: 10.1089/jmf.2012.0292. [DOI] [PubMed] [Google Scholar]
- 36.Kozich JJ, Westcott SL, Baxte NT, Highlander SK, Schloss PD. 2013. Development of a dual-index sequencing strategy and curation pipeline for analyzing amplicon sequence data on the MiSeq Illumina sequencing platform. Appl Environ Microbiol 79:5112–5120. doi: 10.1128/AEM.01043-13. [DOI] [PMC free article] [PubMed] [Google Scholar]
- 37.Bolyen E, Rideout JR, Dillon MR, Bokulich NA, Abnet CC, Al-Ghalith GA, Alexander H, Alm EJ, Arumugam M, Asnicar F, Bai Y, Bisanz JE, Bittinger K, Brejnrod A, Brislawn CJ, Brown CT, Callahan BJ, Caraballo-Rodríguez AM, Chase J, Cope EK, Da Silva R, Diener C, Dorrestein PC, Douglas GM, Durall DM, Duvallet C, Edwardson CF, Ernst M, Estaki M, Fouquier J, Gauglitz JM, Gibbons SM, Gibson DL, Gonzalez A, Gorlick K, Guo J, Hillmann B, Holmes S, Holste H, Huttenhower C, Huttley GA, Janssen S, Jarmusch AK, Jiang L, Kaehler BD, Kang KB, Keefe CR, Keim P, Kelley ST, Knights D, Koester I, Kosciolek T, et al. . 2019. Reproducible, interactive, scalable and extensible microbiome data science using QIIME 2. Nat Biotechnol 37:852–857. doi: 10.1038/s41587-019-0209-9. [DOI] [PMC free article] [PubMed] [Google Scholar]
- 38.Callahan BJ, McMurdie PJ, Rosen MJ, Han AW, Johnson AJA, Holmes SP. 2016. DADA2: high-resolution sample inference from Illumina amplicon data. Nat Methods 13:581–583. doi: 10.1038/nmeth.3869. [DOI] [PMC free article] [PubMed] [Google Scholar]
- 39.DeSantis TZ, Hugenholtz P, Larsen N, Rojas M, Brodie EL, Keller K, Huber T, Dalevi D, Hu P, Andersen GL. 2006. Greengenes, a chimera-checked 16S rRNA gene database and workbench compatible with ARB. Appl Environ Microbiol 72:5069–5072. doi: 10.1128/AEM.03006-05. [DOI] [PMC free article] [PubMed] [Google Scholar]
- 40.Hartzell AL, Maldonado-Gomez MX, Hutkins RW, Rose DJ. 2013. Synthesis and in vitro digestion and fermentation of acylated inulin. Bioact Carbohydrates Diet Fibre 1:81–88. doi: 10.1016/j.bcdf.2013.01.004. [DOI] [Google Scholar]
- 41.Love MI, Huber W, Anders S. 2014. Moderated estimation of fold change and dispersion for RNA-seq data with DESeq2. Genome Biol 15:550. doi: 10.1186/s13059-014-0550-8. [DOI] [PMC free article] [PubMed] [Google Scholar]
Associated Data
This section collects any data citations, data availability statements, or supplementary materials included in this article.
Supplementary Materials
Data Availability Statement
Raw sequence reads and metadata from fecal samples and in vitro fermentations are available in the SRA under accession no. PRJNA603983.