

Abstract
BACKGROUND
Obesity shortens life expectancy. Bariatric surgery is known to reduce the long-term relative risk of death, but its effect on life expectancy is unclear.
METHODS
We used the Gompertz proportional hazards regression model to compare mortality and life expectancy among patients treated with either bariatric surgery (surgery group) or usual obesity care (control group) in the prospective, controlled Swedish Obese Subjects (SOS) study and participants in the SOS reference study (reference cohort), a random sample from the general population.
RESULTS
In total, 2007 and 2040 patients were included in the surgery group and the control group, respectively, and 1135 participants were included in the reference cohort. At the time of the analysis (December 31, 2018), the median duration of follow-up for mortality was 24 years (interquartile range, 22 to 27) in the surgery group and 22 years (interquartile range, 21 to 27) in the control group; data on mortality were available for 99.9% of patients in the study. In the SOS reference cohort, the median duration of follow-up was 20 years (interquartile range, 19 to 21), and data on mortality were available for 100% of participants. In total, 457 patients (22.8%) in the surgery group and 539 patients (26.4%) in the control group died (hazard ratio, 0.77; 95% confidence interval [CI], 0.68 to 0.87; P<0.001). The corresponding hazard ratio was 0.70 (95% CI, 0.57 to 0.85) for death from cardiovascular disease and 0.77 (95% CI, 0.61 to 0.96) for death from cancer. The adjusted median life expectancy in the surgery group was 3.0 years (95% CI, 1.8 to 4.2) longer than in the control group but 5.5 years shorter than in the general population. The 90-day postoperative mortality was 0.2%, and 2.9% of the patients in the surgery group underwent repeat surgery.
CONCLUSIONS
Among patients with obesity, bariatric surgery was associated with longer life expectancy than usual obesity care. Mortality remained higher in both groups than in the general population. (Funded by the Swedish Research Council and others; SOS ClinicalTrials.gov number, NCT01479452.)
OBESITY IS ASSOCIATED WITH LIFE-threatening diseases and premature death1 and reduces life expectancy by 5 to 20 years.1–3 Bariatric surgery leads to durable weight loss and reduces the risk of cardiovascular disease, type 2 diabetes, and cancer.4 In 2007, we reported that bariatric surgery reduced overall mortality — the primary end point in the prospective, controlled Swedish Obese Subjects (SOS) study — by 29% over a mean follow-up of 10.9 years.5 Lower mortality in association with bariatric surgery has also been observed in retrospective cohort studies, and a recent meta-analysis indicated 41% lower all-cause long-term (≥2 years) mortality.6 However, a recent retrospective study indicated that the relative risk of death remained higher among patients who underwent bariatric surgery than in the general background population.7
Despite the beneficial effects of bariatric surgery, only a minority of eligible patients undergo such surgery.8 It is recommended that patients considering bariatric surgery be given appropriate information to make an informed choice.9 A major motivation to undergo bariatric surgery is to reduce the risks of deteriorating health and premature death.10 However, the extent to which the reduced relative risk of death after bariatric surgery increases the life span in patients with obesity is unclear.
In this study, we investigated mortality over a period of as long as three decades. In addition, we estimated life expectancy after bariatric surgery and usual obesity care in comparison with that in the general population.
METHODS
STUDY DESIGN
Our ongoing study is conducted at 25 public surgical departments and 480 primary health care centers in Sweden.4 Seven regional ethics review boards in Sweden approved the study protocol. Written or oral informed consent was obtained from all participants.
In brief,4 2010 participants who underwent bariatric surgery and 2037 matched controls were recruited between September 1, 1987, and January 31, 2001 (see the Supplementary Appendix, available with the full text of this article at NEJM.org). The inclusion criteria were an age between 37 and 60 years and a body-mass index (BMI, the weight in kilograms divided by square of the height in meters) of at least 34 for men and at least 38 for women. The exclusion criteria were identical in the treatment groups and were selected to enroll patients who could undergo surgery.4 Participants in the surgery group underwent banding, vertical banded gastroplasty, or gastric bypass. Participants in the control group received conventional obesity treatment.
Our database was cross-checked against the Swedish Population and Address Register to obtain information on all deaths from the time of study initiation until December 31, 2018, and against the Swedish Cause of Death Register to obtain the official (underlying) cause of death. In addition, relevant case sheets and autopsy reports were assessed independently by two authors who were unaware of any participant’s study-group assignment. If the study-determined cause of death and the official cause of death differed, the study-determined direct cause of death was used, because the official cause of death reflects the underlying preventable cause (e.g., obesity) in the chain of events leading to death.11 Data from participants who emigrated, had a change in the obesity intervention (i.e., bariatric surgery in control-group participants or surgery to restore normal anatomy in surgery-group participants), withdrew consent, or were alive at the end of follow-up were censored on the corresponding date.
SOS REFERENCE STUDY
Participants from the SOS reference study, which was conducted between 1994 and 1999, served as a population-based reference cohort for the present study.12 A random sample of 1135 persons 37 to 60 years of age was obtained from the Swedish population registry, and each participant was given a questionnaire that was identical and a health examination that was similar to those used in this study. Participants who underwent bariatric surgery during follow-up were not excluded from the analyses. Information on deaths that occurred up to December 31, 2018, was obtained from the Swedish Cause of Death Register.
STUDY OVERSIGHT
The first author wrote the first draft of the manuscript. All the authors had access to the data, vouch for the completeness and accuracy of the data, and agreed to submit the manuscript for publication. The study sponsors had no role in the interpretation of data.
STATISTICAL ANALYSES
Patients were included in the analysis according to the intervention they received (i.e., as treated). A sensitivity analysis with the patients included in their assigned treatment group was also performed. Data are presented as mean values with standard deviations or as percentages. Baseline comparisons between the groups were performed with an analysis of covariance for continuous variables and with Fisher’s exact test or a logistic-regression model for dichotomous variables.
The differences in the changes in BMI between the surgery group and the control group were analyzed with multilevel mixed-effects regression models. The observations were considered nested within the participants. Tests for treatment-by-time interactions were conducted to evaluate between-group differences in changes.
Kaplan-Meier estimates of survival were calculated for each group. Because the aim of the analyses was to estimate differences in survival in terms of life-years, a parametric approach was adapted to model the time to death. Models based on Weibull, generalized gamma, and Gompertz distributions were evaluated; the Gompertz proportional-hazards regression model was chosen on the basis of Akaike’s information criteria (Table S1 in the Supplementary Appendix). The results are presented as hazard ratios for death and differences in estimated median life expectancy between the groups with corresponding confidence intervals. Adjusted analyses included adjustment for preselected predictors (age, sex, level of education, civil status [i.e., whether the participant was married or living with a partner], smoking status, year of inclusion in the study, BMI, waist:hip ratio, history of cardiovascular disease, glucose tolerance, hypertension, serum insulin level, serum total cholesterol level, history of substance abuse, and history of psychiatric care or psychiatric drug use). Glucose tolerance was classified as normal (fasting blood glucose level, <90 mg per deciliter [<5.0 mmol per liter]), impaired fasting glucose (fasting blood glucose level, ≥90 to <110 mg per deciliter [≥5.0 to <6.0 mmol per liter]), or type 2 diabetes (fast ing blood glucose level, ≥110 mg per deciliter [≥6.1 mmol per liter]).
The proportional-hazards assumption was evaluated by assessing the interaction between treatment and the logarithm of time. Analyses of cause-specific mortality were conducted with the competing-risks regression models suggested by Fine and Gray,13 in which deaths for other reasons were treated as competing events. The number needed to treat to prevent one death during 20 years was calculated in various subgroups as the reciprocal of the absolute difference in risk between the surgery group and the control group.
The consistency of the treatment effect on mortality was assessed in subgroups defined on the basis of 11 baseline characteristics, including the European SCORE (Systematic Coronary Risk Evaluation) model.14 No adjustment for multiple confidence intervals was performed. All 11 subgroup analyses are reported here.
All statistical tests were two-sided, and P values of less than 0.05 were considered to indicate statistical significance. Stata software, version 15.1 (StataCorp), was used for all analyses.
RESULTS
PARTICIPANTS
Three patients in the surgery group did not undergo the intended surgical intervention and are therefore included in the control group. Thus, the numbers of patients were 2007 and 2040 in the as-treated surgery and control groups, respectively. Patients in the surgery group underwent banding (18%), vertical banded gastroplasty (69%), or gastric bypass (13%). In total, 56 patients emigrated, 392 had a change in the obesity intervention (290 control-group patients underwent bariatric surgery, and 102 surgery-group patients underwent surgery to restore normal anatomy), 3 patients withdrew consent, and 2600 patients were alive at the end of follow-up; data from these patients were censored on the corresponding date.
In the present study, patients in the surgery group were younger (mean age, 47.2 vs. 48.7 years), were less likely to have a university education, and had a higher mean BMI (42.4 vs. 40.1), a larger mean waist:hip ratio (0.992 vs. 0.978), higher prevalences of hypertension and diabetes, higher mean insulin levels and total cholesterol levels, and a higher prevalence of smoking than patients in the control group (Table 1).
Table 1.
Baseline Characteristics of the Study Participants and Reference Cohort.*
| Characteristic | Surgery Group (N = 2007) |
Control Group (N = 2040) |
Reference Cohort (N = 1135) |
|---|---|---|---|
| Age — yr | 47.2±5.9 | 48.7±6.3 | 49.5±7.0 |
| Male sex — no. (%) | 587 (29.2) | 593 (29.1) | 524 (46.2) |
| Body-mass index† | 42.4±4.5 | 40.1±4.7 | 25.2±3.8 |
| Waist:hip ratio | 0.992±0.078 | 0.978±0.074 | 0.881±0.082 |
| Cardiovascular disease before baseline — no. (%) | 46 (2.3) | 49 (2.4) | 22 (1.9) |
| Cancer before baseline — no. (%) | 25 (1.2) | 22 (1.1) | 24 (2.1) |
| Hypertension — no./total no. (%) | 1571/2004 (78.4) | 1301/2038 (63.8) | 312/1129 (27.6) |
| Glucose tolerance — no./total no. (%)‡ | |||
| Normal | 1355/2000 (67.8) | 1483/2036 (72.8) | 999/1132 (88.3) |
| Impaired | 301/2000 (15.0) | 290/2036 (14.2) | 95/1132 (8.4) |
| Type 2 diabetes | 344/2000 (17.2) | 263/2036 (12.9) | 38/1132 (3.4) |
| Insulin level — mU/liter | 21.5±13.7 | 18.0±11.4 | 8.6±5.1 |
| Total cholesterol level — mmol/liter | 5.9±1.1 | 5.6±1.1 | 5.5±1.0 |
| Daily smoking — no./total no. (%) | 518/2005 (25.8) | 422/2030 (20.8) | 235/1134 (20.7) |
| University education — no./total no. (%) | 257/2007 (12.8) | 431/2040 (21.1) | 375/1134 (33.1) |
| Married or living with a partner — no./total no. (%) | 1460/2002 (72.9) | 1527/2029 (75.3) | 911/1133 (80.4) |
| History of substance abuse — no. (%) | 58 (2.9) | 50 (2.5) | 10 (0.9) |
| Psychiatric care or medication before baseline — no. (%) | 355 (17.7) | 324 (15.9) | 83 (7.3) |
Plus-minus values are means ±SD. There were imbalances (P<0.05) between the surgery and control groups with respect to age, body-mass index, waist:hip ratio, hypertension, glucose tolerance, insulin level, total cholesterol level, smoking status, and university education, and between the reference cohort and the control group with respect to all variables except cardiovascular disease and smoking.
The body-mass index is the weight in kilograms divided by the square of the height in meters.
Glucose tolerance was classified as normal (fasting blood glucose level, <90 mg per deciliter [<5.0 mmol per liter]), impaired (≥90 to <110 mg per deciliter [≥5.0 to <6.0 mmol per liter]), or type 2 diabetes (≥110 mg per deciliter [≥6.1 mmol per liter]).
The SOS reference cohort was older and had a higher percentage of men than the control group in the present study; the BMI was lower, the prevalences of hypertension and diabetes were lower, and a university education was more common than in the control group (Table 1). However, a history of cancer was more common in the reference cohort. A total of 5 of 1135 participants (0.4%) from the reference cohort underwent bariatric surgery during follow-up.
BMI CHANGES DURING FOLLOW-UP
BMI over the duration of up to 20 years of follow-up in the present study is shown in Figure 1. Changes in BMI were small on average in the control group. In the surgery group, a mean BMI reduction of approximately 11 was observed 1 year after surgery, followed by a gradual weight regain on average until year 8. Thereafter, the mean BMI stabilized at approximately 7 less than the baseline BMI.
Figure 1. Body-Mass Index over a Period of 20 Years in the Control and Surgery Groups.
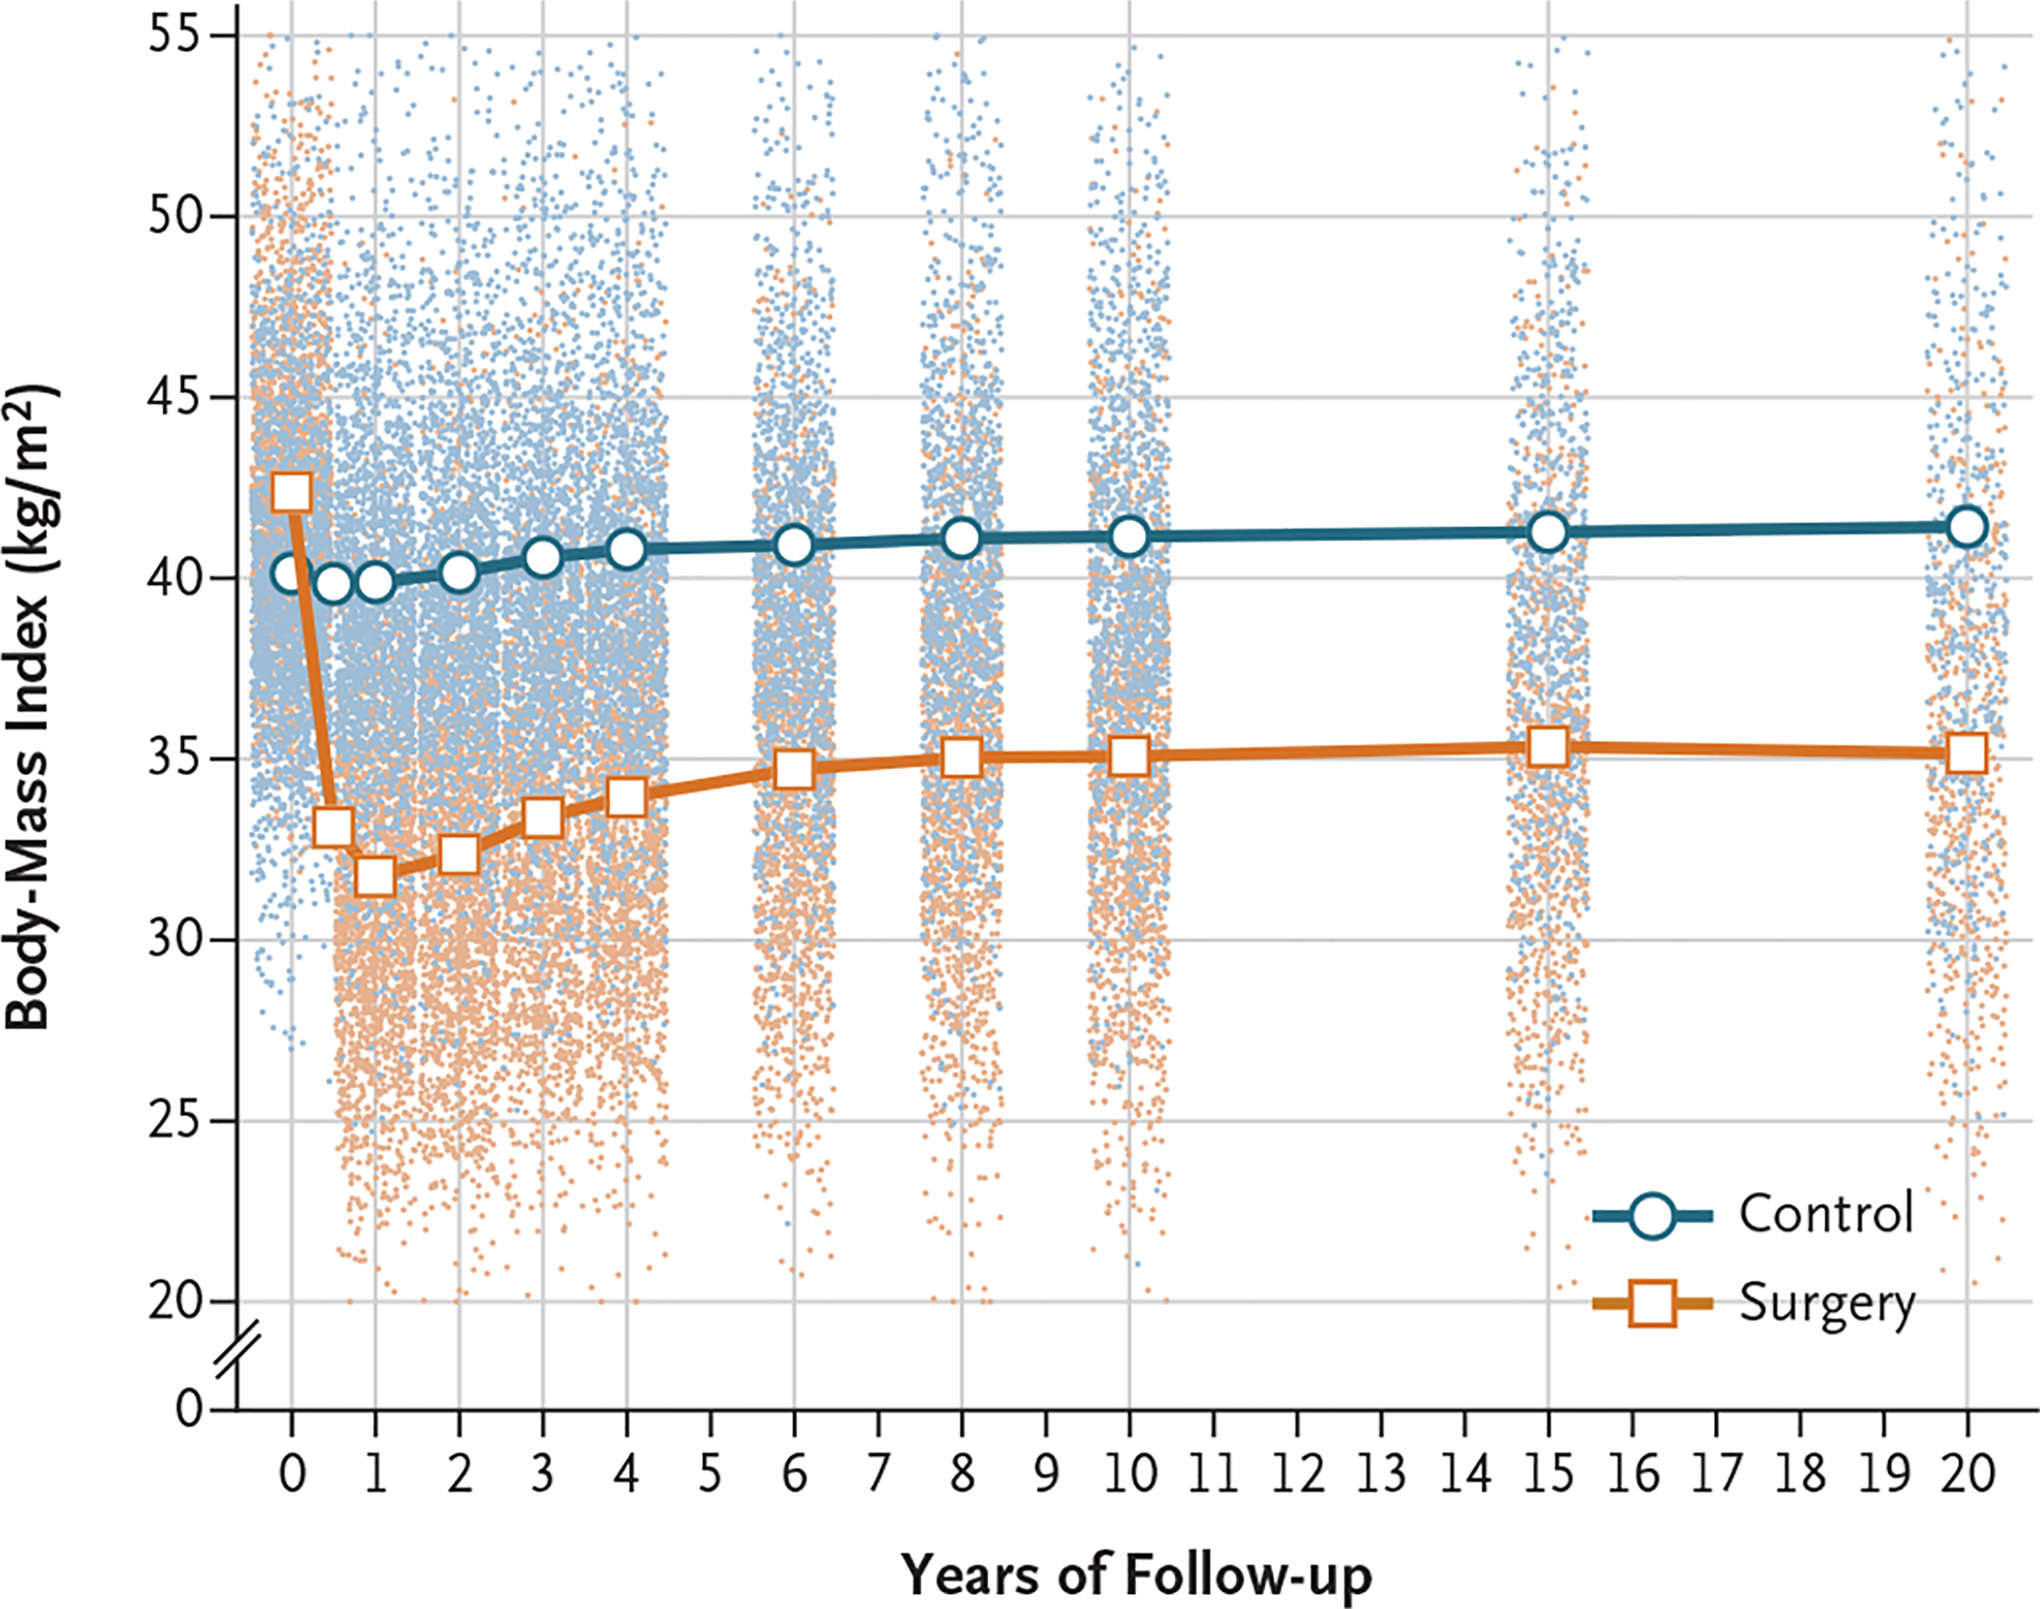
Lines are estimated means from a mixed model with adjustment for sex and age. Dots represent observed values from individual participants. The y axis is truncated at a body-mass index (the weight in kilograms divided by the square of the height in meters) of 20 and of 55, but all observations were used in the estimation of means.
OVERALL MORTALITY AND LIFE EXPECTANCY
In the present study, the median duration of follow-up for mortality was 24 years (interquartile range, 22 to 27) in the surgery group and 22 years (interquartile range, 21 to 27) in the control group, and data on mortality were available for 99.9% of patients. In the reference cohort, the median duration of follow-up was 20 years (interquartile range, 19 to 21) and data on mortality were available for 100% of participants.
Figure 2 shows cumulative survival rates and predicted survival based on a model of the time to death. During follow-up, there were 457 deaths in the surgery group, 539 deaths in the control group, and 125 deaths in the reference cohort, which corresponded to a number of deaths per 1000 person-years of 10.7 (95% confidence interval [CI], 9.7 to 11.7) and 13.2 (95% CI, 12.1 to 14.3) in the surgery and control groups, respectively, and 5.2 (95% CI, 4.4 to 6.2) in the reference cohort (Table 2). Mortality was lower in the surgery group than in the control group (hazard ratio, 0.77; 95% CI, 0.68 to 0.87; P<0.001) and was also lower in the reference cohort than in the control group (hazard ratio, 0.44; 95% CI, 0.31 to 0.48; P<0.001).
Figure 2. Survival in the Surgery and Control Groups and in the Reference Cohort.
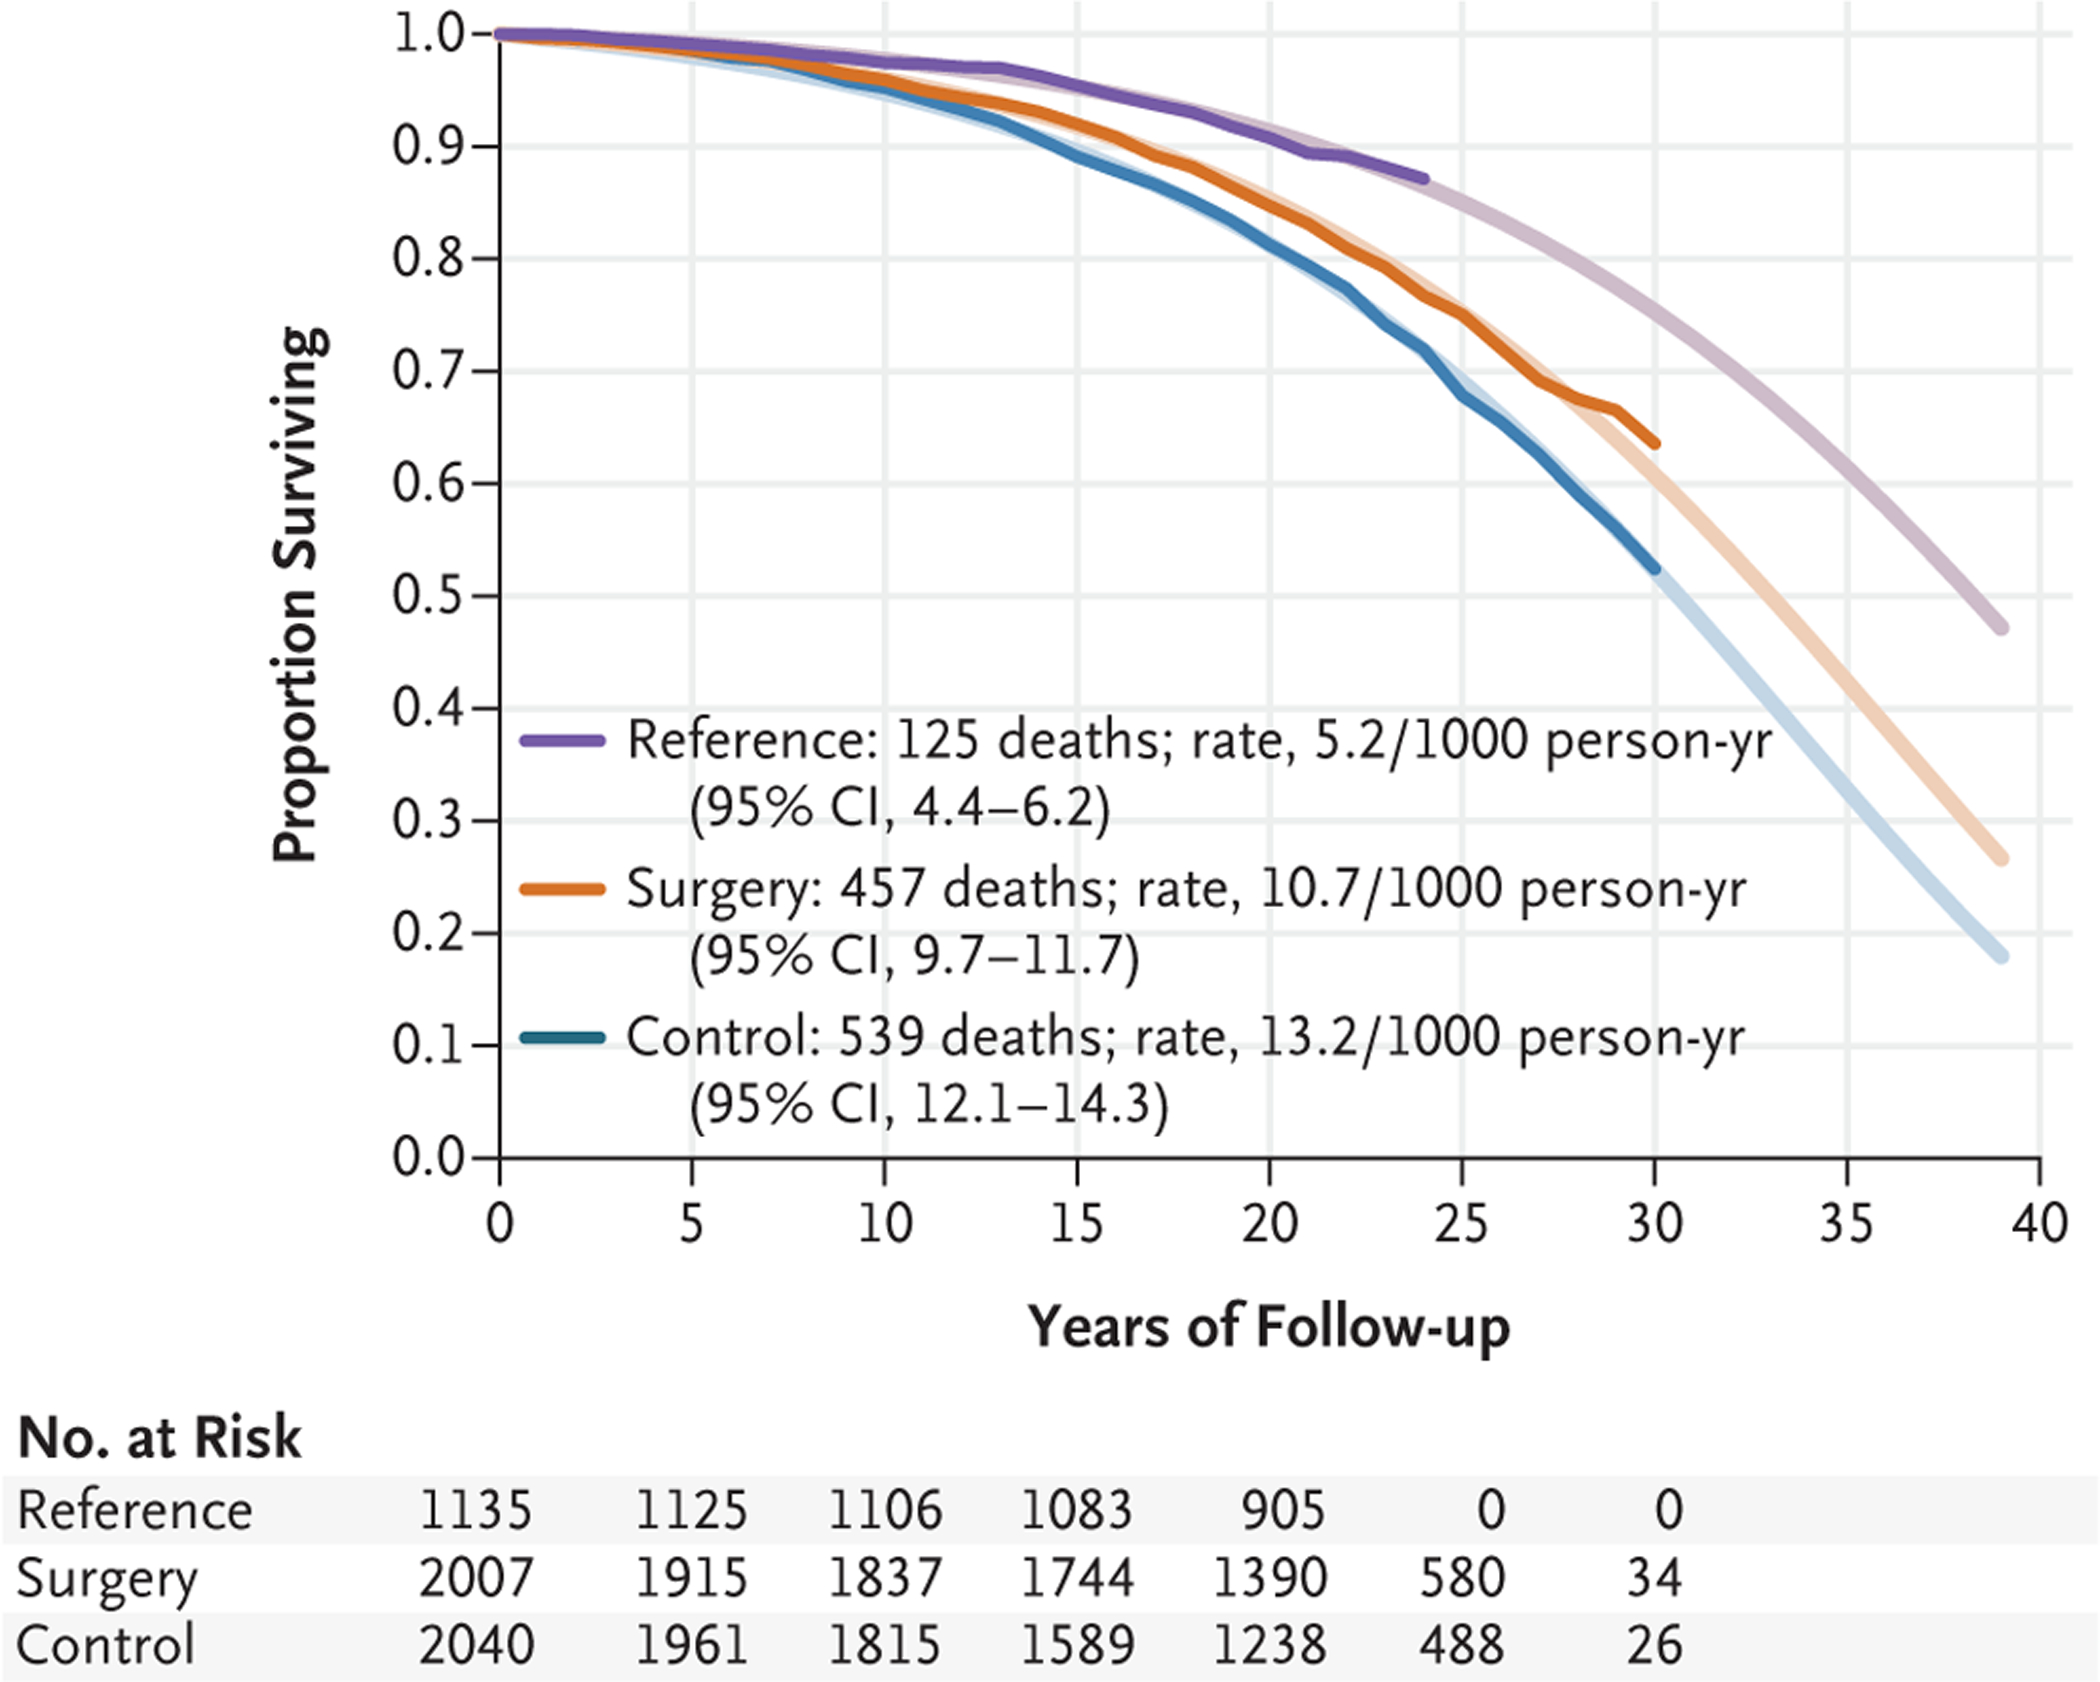
Shown are the Kaplan-Meier estimate of survival (opaque lines) and the estimate of survival from an unadjusted Gompertz regression model extrapolated up to 40 years (fainter lines).
Table 2.
Mortality, Hazard Ratios, and Differences in Median Life Expectancy from a Gompertz Proportional-Hazards Regression Model.
| Measure | Surgery Group (N = 2007) |
Control Group (N = 2040) |
Reference Cohort (N = 1135) |
|---|---|---|---|
| Mortality | |||
| No. of deaths | 457 | 539 | 125 |
| No. of person-yr | 42,814 | 40,912 | 24,112 |
| Deaths per 1000 person-yr (95% CI) | 10.7 (9.7–11.7) | 13.2 (12.1–14.3) | 5.2 (4.4–6.2) |
| Hazard ratio (95% CI) | 0.77 (0.68–0.87) | Reference | 0.44 (0.31–0.48) |
| P value | <0.001 | <0.001 | |
| Adjusted hazard ratio (95% CI)* | 0.70 (0.61–0.81) | Reference | 0.38 (0.31–0.47) |
| P value | <0.001 | <0.001 | |
| Life expectancy | |||
| Difference in median life expectancy (95% CI) — yr | 2.4 (1.2–3.5) | Reference | 7.4 (5.4–9.4) |
| P value | <0.001 | <0.001 | |
| Adjusted difference in median life expectancy (95% CI) — yr* | 3.0 (1.8–4.2) | Reference | 8.5 (6.4–10.5) |
| P value | <0.001 | <0.001 | |
Comparisons between the surgery group and the control group were adjusted for age, sex, level of education, marriage or partner status, smoking status, year of inclusion, body-mass index, waist:hip ratio, history of cardiovascular disease, glucose tolerance (normal, impaired, or type 2 diabetes), hypertension, insulin level, total cholesterol level, history of substance abuse, and history of psychiatric care or psychiatric drug use. The comparison between the reference cohort and the control group was adjusted for age, sex, smoking status, and year of inclusion.
Similar results were obtained in sensitivity analyses based on as-assigned surgery and control groups (Table S2). After adjustment for baseline risk factors, the hazard ratio for the comparison of the surgery group with the control group was 0.70 (95% CI, 0.61 to 0.81; P<0.001), and the hazard ratio for the comparison of the reference cohort with the control group was 0.38 (95% CI, 0.31 to 0.47; P<0.001). There was no indication of violation of the proportional hazards assumption (P = 0.40 for the test of interaction with time).
The median life expectancy was 2.4 years (95% CI, 1.2 to 3.5) longer in the surgery group than in the control group (P<0.001) (adjusted difference, 3.0 years; 95% CI, 1.8 to 4.2; P<0.001) and was 7.4 years (95% CI, 5.4 to 9.4) longer in the reference cohort than in the control group (P<0.001) (adjusted difference, 8.5 years; 95% CI, 6.4 to 10.5; P<0.001). In the surgery group, the median life expectancy was 5.5 years (95% CI, 3.4 to 7.6) shorter (adjusted difference) than in the reference cohort (P<0.001).
CAUSES OF DEATH
The most common causes of death in the present study were cardiovascular diseases (388 deaths) and cancers (301 deaths) (Table S3). Cardiovascular diseases caused 167 deaths in the surgery group and 221 in the control group; the hazard ratios for the surgery group as compared with the control group were 0.70 (95% CI, 0.57 to 0.85) for any cardiovascular disease, 0.51 (95% CI, 0.33 to 0.79) for myocardial infarction, 0.52 (95% CI, 0.31 to 0.88) for heart failure, and 0.45 (95% CI, 0.24 to 0.84) for stroke. There were 135 and 165 deaths caused by cancers in the surgery group and the control group, respectively (hazard ratio, 0.77; 95% CI, 0.61 to 0.96). Furthermore, 38 deaths in the surgery group and 20 deaths in the control group were caused by factors other than disease (alcoholism, suicide, and trauma) (hazard ratio, 1.85; 95% CI, 1.08 to 3.17).
Since life expectancy was shorter in the surgery group than in the reference cohort, we compared causes of death between these groups to determine which life-threatening diseases remained overrepresented in the surgery group (Table S4). The hazard ratio for death from cardiovascular causes in the surgery group as compared with the reference cohort was 2.64 (95% CI, 1.78 to 3.91); the most common cardiovascular causes of death were myocardial infarction, heart failure, and sudden death. The hazard ratio for noncardiovascular causes of death in the surgery group as compared with the reference cohort was 1.50 (95%, 1.18 to 1.91); these causes of death were mainly infections, complications after surgery, and other factors (alcoholism, suicide, and trauma).
SUBGROUP ANALYSES AND ADVERSE EVENTS
Overall mortality after bariatric surgery as compared with usual care in subgroups defined according to baseline risk factors is shown in Figure S1. The treatment benefit of bariatric surgery with respect to overall mortality was similar in high-risk and low-risk subgroups.
Table 3 shows adverse events that occurred during the 90 days after bariatric surgery. Within 90 days, 5 patients (0.2%) died, 59 (2.9%) underwent repeat surgery, and 292 (14.5%) had at least one complication.
Table 3.
Deaths and Complications during the First 90 Days after Bariatric Surgery in the SOS Study.
| Adverse Event | Surgery Group (N = 2007) |
|---|---|
| no. of patients (%) | |
| Death | 5 (0.2) |
| Pulmonary event | 89 (4.4) |
| Thromboembolism | 16 (0.8) |
| Vomiting | 61 (3.0) |
| Wound infection | 43 (2.1) |
| Other infection | 28 (1.4) |
| Hemorrhage | 26 (1.3) |
| Anastomotic leak, peritonitis, or abscess | 30 (1.5) |
| Ileus | 10 (0.5) |
| Wound dehiscence | 14 (0.7) |
| Other complication | 21 (1.0) |
| At least one complication | 292 (14.5) |
| Repeat surgery during the first 90 days | 59 (2.9) |
DISCUSSION
In 2007, our group provided prospectively collected data showing that mortality in a group of patients who underwent bariatric surgery was lower than in a matched control group of patients who were given usual care.5 After an additional 13 years of follow-up, we now report that the difference in mortality persisted and that bariatric surgery was associated with a lower risk of death from both cardiovascular diseases and cancer. In addition, we show that life expectancy among patients with obesity who were given usual care was approximately 8 years shorter than in the general population, and this difference was decreased by bariatric surgery, which was associated with life expectancy that was approximately 3 years longer than that associated with usual care.
The mean increase in life expectancy after an intervention used for prevention of an outcome is generally lowest in populations at average risk, higher in populations with an elevated risk, and greatest among persons with established disease.15 When viewed in the context of life-years gained with a variety of interventions in populations at elevated risk,15 the 3-year mean prolongation of life after bariatric surgery in our study is large. However, the SOS study at baseline includes persons who have an elevated risk of serious and potentially life-threatening diseases, as well as persons with established conditions, such as type 2 diabetes and hypertension.5 Therefore, it is important to emphasize that the reported gain in life expectancy is for our entire study population and cannot be translated into a survival benefit for a particular patient or for other populations beyond the study participants.
The 8-year-shorter life expectancy in the control group than in the general Swedish population is within the range previously reported for persons with severe obesity relative to those of healthy weight.1–3 Although life expectancy was longer in association with bariatric surgery, survival was still lower than in the general population. This finding is consonant with a recent report from the Nordic countries showing that overall mortality among patients who had undergone bariatric surgery remained higher than in the general population.7 Possible explanations for the remaining higher mortality in the surgery group include the above-normal BMI even after bariatric surgery, irreversible effects of obesity-related metabolic dysfunction that may have begun processes that lead to atherosclerosis or microvascular disease, and surgical complications and other factors causing death (alcoholism, suicide, and trauma). More frequent occurrence of alcoholism, suicide, and trauma16–18 and a larger number of related deaths have previously been observed among patients with obesity who undergo bariatric surgery than among those who do not undergo surgery.19 In the SOS study, we have found a higher risk of alcohol abuse, suicide and self-harm, and serious fall-related injuries among patients with obesity who have undergone bariatric surgery than among those who have not.20–23
A limitation of the present study is that the intervention of bariatric surgery was not randomly assigned because of ethical considerations in the 1980s related to high postoperative mortality at that time.4 Today, bariatric surgery is viewed as a treatment with risks similar to those of cholecystectomy and hysterectomy,24 and randomization has been used in trials designed to examine remission of type 2 diabetes.25,26 However, data on survival from randomized, controlled trials are lacking. In the foreseeable future, we will therefore have to rely on large observational studies to estimate the effects of bariatric surgery on longevity.9 Another limitation of the present study is that it included surgical techniques that are rarely used today. However, the inclusion of older methods is difficult to avoid in studies with long follow-up periods. Our study is also limited by the age of the patients at inclusion. It is possible that the average gain in life expectancy would be greater in a younger study population than in the middle-aged cohort we have examined. However, our study shows that the benefit of bariatric surgery with respect to mortality persists in our aging cohort.
A major strength of our study is the virtually complete long-term follow-up of surgically treated patients with obesity and matched controls, which enables reliable estimation of the treatment benefit of bariatric surgery in terms of life expectancy. Although many studies have shown that bariatric surgery is associated with a benefit with respect to the relative risk of death, our study, with its lengthy follow-up period, provides an estimate of life-years gained in association with surgery.
We attempted to identify groups of patients who may have particularly benefited from surgery, because such subgrouping can be used to classify patients who might be considering surgery into categories with high or low treatment benefit in terms of gains in life-years. However, the treatment benefit of bariatric surgery was surprisingly even across subgroups defined on the basis of classic risk factors (including BMI-related and cardiovascular risk factors, such as hypertension or cholesterol level). Thus, when it comes to longevity, we would infer that classic risk factors cannot be used for precision medicine. However, it is well known that genetic predisposition contributes to obesity,27 and body-weight and body-composition responses to changes in energy balance are heritable traits.28,29 We speculate that future studies will reveal genetic markers that predict treatment response, thereby facilitating the decision-making process. In addition, it is possible that improvements in the identification of patients who are at increased risk for substance abuse or self-harm could further improve survival in association with bariatric surgery through targeted follow-up or advising against surgical treatment.
In our study, bariatric surgery was associated with lower overall mortality than usual obesity care. In middle-aged patients with severe obesity, life expectancy was approximately 3 years longer among patients who underwent surgery than among those who received usual care.
Supplementary Material
Acknowledgments
Supported by grants from the Swedish Research Council (2017-01707), the Swedish state under an agreement between the Swedish government and the county councils, the ALF (Avtal om Läkarutbildning och Forskning) agreement (ALFGBG-717881 and ALFGBG-717891), the Swedish Diabetes Foundation (2019-417), the Swedish Heart-Lung Foundation (20180410), the Novo Nordisk Foundation (NNF 19OC0057184), and the National Institute of Diabetes and Digestive and Kidney Diseases of the National Institutes of Health (R01DK105948).
Dr. L. Carlsson reports receiving consulting fees from Johnson & Johnson Healthcare Systems and grant support, paid to her institution, from the Novo Nordisk Foundation; and Dr. B. Carlsson, being employed by and owning stock in AstraZeneca. No other potential conflict of interest relevant to this article was reported.
We thank the staff members at the 480 primary health care centers and 25 surgical departments in Sweden that participated in the Swedish Obese Subjects (SOS) study, Christina Torefalk and Björn Henning for administrative support, and Rosie Perkins (Institute of Medicine, University of Gothenburg, Gothenburg, Sweden) for editing an earlier version of the manuscript.
Footnotes
The content of this article is solely the responsibility of the authors and does not necessarily represent the official views of the National Institutes of Health.
Disclosure forms provided by the authors are available with the full text of this article at NEJM.org.
A data sharing statement provided by the authors is available with the full text of this article at NEJM.org.
REFERENCES
- 1.Prospective Studies Collaboration. Body-mass index and cause-specific mortality in 900 000 adults: collaborative analyses of 57 prospective studies. Lancet 2009; 373: 1083–96. [DOI] [PMC free article] [PubMed] [Google Scholar]
- 2.Fontaine KR, Redden DT, Wang C, Westfall AO, Allison DB. Years of life lost due to obesity. JAMA 2003; 289: 187–93. [DOI] [PubMed] [Google Scholar]
- 3.Bhaskaran K, Dos-Santos-Silva I, Leon DA, Douglas IJ, Smeeth L. Association of BMI with overall and cause-specific mortality: a population-based cohort study of 3·6 million adults in the UK. Lancet Diabetes Endocrinol 2018; 6: 944–53. [DOI] [PMC free article] [PubMed] [Google Scholar]
- 4.Sjöström L. Review of the key results from the Swedish Obese Subjects (SOS) trial — a prospective controlled interven tion study of bariatric surgery. J Intern Med 2013; 273: 219–34. [DOI] [PubMed] [Google Scholar]
- 5.Sjöström L, Narbro K, Sjöström CD, et al. Effects of bariatric surgery on mortality in Swedish obese subjects. N Engl J Med 2007; 357: 741–52. [DOI] [PubMed] [Google Scholar]
- 6.Cardoso L, Rodrigues D, Gomes L, Carrilho F. Short- and long-term mortality after bariatric surgery: a systematic review and meta-analysis. Diabetes Obes Metab 2017; 19: 1223–32. [DOI] [PubMed] [Google Scholar]
- 7.Kauppila JH, Tao W, Santoni G, et al. Effects of obesity surgery on overall and disease-specific mortality in a 5-country population-based study. Gastroenterology 2019; 157(1): 119–127. e1. [DOI] [PubMed] [Google Scholar]
- 8.Westerveld D, Yang D. Through thick and thin: identifying barriers to bariatric surgery, weight loss maintenance, and tailoring obesity treatment for the future. Surg Res Pract 2016; 2016: 8616581. [DOI] [PMC free article] [PubMed] [Google Scholar]
- 9.Arterburn DE, Courcoulas AP. Bariatric surgery for obesity and metabolic conditions in adults. BMJ 2014; 349: g3961. [DOI] [PMC free article] [PubMed] [Google Scholar]
- 10.Brantley PJ, Waldo K, Matthews-Ewald MR, et al. Why patients seek bariatric surgery: does insurance coverage matter? Obes Surg 2014; 24: 961–4. [DOI] [PMC free article] [PubMed] [Google Scholar]
- 11.Brooke HL, Talbäck M, Hörnblad J, et al. The Swedish cause of death register. Eur J Epidemiol 2017; 32: 765–73. [DOI] [PMC free article] [PubMed] [Google Scholar]
- 12.Larsson I, Bertéus Forslund H, Lindroos AK, et al. Body composition in the SOS (Swedish Obese Subjects) reference study. Int J Obes Relat Metab Disord 2004; 28: 1317–24. [DOI] [PubMed] [Google Scholar]
- 13.Fine JP, Gray RJ. A proportional hazards model for the subdistribution of a competing risk. J Am Stat Assoc 1999; 94: 496–509. [Google Scholar]
- 14.Conroy RM, Pyörälä K, Fitzgerald AP, et al. Estimation of ten-year risk of fatal cardiovascular disease in Europe: the SCORE project. Eur Heart J 2003; 24: 987–1003. [DOI] [PubMed] [Google Scholar]
- 15.Wright JC, Weinstein MC. Gains in life expectancy from medical interventions — standardizing data on outcomes. N Engl J Med 1998; 339: 380–6. [DOI] [PubMed] [Google Scholar]
- 16.Castaneda D, Popov VB, Wander P, Thompson CC. Risk of suicide and self-harm is increased after bariatric surgery — a systematic review and meta-analysis. Obes Surg 2019; 29: 322–33. [DOI] [PubMed] [Google Scholar]
- 17.Azam H, Shahrestani S, Phan K. Alcohol use disorders before and after bariatric surgery: a systematic review and meta-analysis. Ann Transl Med 2018; 6: 148. [DOI] [PMC free article] [PubMed] [Google Scholar]
- 18.Kanji S, Wong E, Akioyamen L, Melamed O, Taylor VH. Exploring pre-surgery and post-surgery substance use disorder and alcohol use disorder in bar iatric surgery: a qualitative scoping review. Int J Obes (Lond) 2019; 43: 1659–74. [DOI] [PubMed] [Google Scholar]
- 19.Adams TD, Gress RE, Smith SC, et al. Long-term mortality after gastric bypass surgery. N Engl J Med 2007; 357: 753–61. [DOI] [PubMed] [Google Scholar]
- 20.Svensson PA, Anveden Å, Romeo S, et al. Alcohol consumption and alcohol problems after bariatric surgery in the Swedish Obese Subjects study. Obesity (Silver Spring) 2013; 21: 2444–51. [DOI] [PubMed] [Google Scholar]
- 21.Neovius M, Bruze G, Jacobson P, et al. Risk of suicide and non-fatal self-harm after bariatric surgery: results from two matched cohort studies. Lancet Diabetes Endocrinol 2018; 6: 197–207. [DOI] [PMC free article] [PubMed] [Google Scholar]
- 22.Konttinen H, Sjöholm K, Jacobson P, Svensson P-A, Carlsson LMS, Peltonen M. Prediction of suicide and nonfatal self-harm after bariatric surgery: a risk score based on sociodemographic factors, lifestyle behavior, and mental health: a non-randomized controlled trial. Ann Surg 2019. December 10 (Epub ahead of print). [DOI] [PMC free article] [PubMed] [Google Scholar]
- 23.Carlsson LMS, Sjöholm K, Ahlin S, et al. Long-term incidence of serious fall-related injuries after bariatric surgery in Swedish obese subjects. Int J Obes (Lond) 2019; 43: 933–7. [DOI] [PMC free article] [PubMed] [Google Scholar]
- 24.Wolfe BM, Kvach E, Eckel RH. Treatment of obesity: weight loss and bariatric surgery. Circ Res 2016; 118: 1844–55. [DOI] [PMC free article] [PubMed] [Google Scholar]
- 25.Mingrone G, Panunzi S, De Gaetano A, et al. Bariatric-metabolic surgery versus conventional medical treatment in obese patients with type 2 diabetes: 5 year follow-up of an open-label, single-centre, randomised controlled trial. Lancet 2015; 386: 964–73. [DOI] [PubMed] [Google Scholar]
- 26.Schauer PR, Bhatt DL, Kirwan JP, et al. Bariatric surgery versus intensive medical therapy for diabetes — 5-year outcomes. N Engl J Med 2017; 376: 641–51. [DOI] [PMC free article] [PubMed] [Google Scholar]
- 27.Farooqi IS, O’Rahilly S. Mutations in ligands and receptors of the leptin-melanocortin pathway that lead to obesity. Nat Clin Pract Endocrinol Metab 2008; 4: 569–77. [DOI] [PubMed] [Google Scholar]
- 28.Bouchard C, Tremblay A, Després JP, et al. The response to long-term overfeeding in identical twins. N Engl J Med 1990; 322: 1477–82. [DOI] [PubMed] [Google Scholar]
- 29.Bouchard C, Tremblay A, Després JP, et al. The response to exercise with constant energy intake in identical twins. Obes Res 1994; 2: 400–10. [DOI] [PubMed] [Google Scholar]
Associated Data
This section collects any data citations, data availability statements, or supplementary materials included in this article.