

Abstract
The COVID-19 pandemic forced India as a whole to lockdown from 24 March 2020 to 14 April 2020 (first phase), extended to 3 May 2020 (second phase) and further extended to 17 May 2020 (third phase) and 31 May 2020 (fourth phase) with only some limited relaxation in non-hot spot areas. This lockdown has strictly controlled human activities in the entire India. Although this long lockdown has had a serious impact on the social and economic fronts, it has many positive impacts on environment. During this lockdown phase, a drastic fall in emissions of major pollutants has been observed throughout all the parts of India. Therefore, in this research study we have tried to establish a relationship among the fall in emission of pollutants and their impact on reducing regional temperature. This analysis was tested through the application of Mann–Kendall and Sen’s slope statistical index with air quality index and temperature data for several stations across the country, during the lockdown period. After the analysis, it has been observed that daily emissions of pollutants (PM10, PM2.5, CO, NO2, SO2 and NH3) decreased by − 1– − 2%, allowing to reduce the average daily temperature by 0.3 °C compared with the year of 2019. Moreover, this lockdown period reduces overall emissions of pollutants by − 51– − 72% on an average and hence decreases the average monthly temperature by 2 °C. The same findings have been found in the four megacities in India, i.e., Delhi, Kolkata, Mumbai and Chennai; the rate of temperature fall in the aforementioned megacities is close to 3 °C, 2.5 °C, 2 °C and 2 °C, respectively. It is a clear indicator that a major change occurs in air quality, and as a result it reduced lower atmospheric temperature due to the effect of lockdown. It is also a clear indicator that a major change in air quality and favorable temperature can be expected if the strict implementations of several pollution management measures have been implemented by the concern authority in the coming years.
Keywords: COVID-19, Air quality index, Air pollutant, Climate
Introduction
The new emergence of COVID-19 was first identified in Wuhan, China, in late December 2019 and on 30th January 2020, the World Health Organization (WHO) declared it a global public health emergency (Sohrabi et al. 2020). After the outbreak of COVID-19 in Iran, Italy, France, USA and other western countries, on 11th March the Wuhan epidemic became the world’s largest pandemic in 2020 (Muhammad et al. 2020). This COVID-19 pandemic also well-known as coronavirus pandemic, and yet it is an ongoing epidemic caused by severe acute respiratory syndrome coronavirus 2 (SARS-CoV-2), stated by WHO. People with low immunity are more vulnerable with SARS-CoV-2, basically novel coronavirus mostly prone to the people of pregnant women, elderly people and patients influenced by chronic diseases. Some of the basic symptoms such as fever, cough, fatigue, loss of smell and taste are found among the COVID-19 affected people. There are yet no such verified vaccines or proper treatment facilities for COVID-19. The disease spreads very easily among the people during the time of their close proximity. Therefore, in order to stop the rapid spread of the COVID-19 infection, strict measures have been implemented by the government of (Nussbaumer-Streit et al. 2020) different countries. Thus, several kinds of prevention measures have been incorporated such as recurrent hand washing, maintain social distancing, home isolation, always wearing a mask, etc. (Nussbaumer-Streit et al. 2020). Initially, the transmission of the virus from people to the community and after slowing down the number of COVID-19 cases, the government bans the mass gathering in different social and economic places such as school, universities, industries, public transport, market and religious sites and strains people’s social distance and home prison methods. Recent data indicate that until 21 September 2020, 30.9 million people have been affected by COVID-19 in 188 countries around the world. As a result of the COVID-19 pandemic, global social and economic disturbances have taken place. Beside this, the social distancing and home confinement of people has led to a drastic change in gas and pollutant emissions worldwide (Le Quéré et al. 2020).
Nowadays, climate change is happening and has a global impact, such as rising temperatures, changing precipitation patterns and extreme weather conditions etc. (Djalante 2019). According to the latest report of the Inter-Governmental Panel on Climate Change (IPCC) (2018), the global temperatures rose by about 1 °C from the pre-industrial levels and are likely to reach 1.5 °C between 2030 and 2052. And the rising temperatures and global warming have an impact on rising sea-levels, increasing drought and floods, heat waves and cyclones around the world. World air pollution has a greenhouse effect, and the average temperature in the world is changing, which means temperatures are rising (Didenko et al. 2017). The IPCC reports showed that temperature increases are due to the radiative forcing, and this force is primarily caused by the high concentration of atmospheric pollutants (CO2, CO, NO2, SO2 and O3) (Figueres et al. 2018; Stips et al. 2016).
The real-time observation of various air pollutants asserts that the different gas emission rate drastically falls during the month of April and May 2020 caused by COVID-19 lockdown. The fossil fuels burning have been recorded low consumptions, and daily global CO2 emissions in April decreased by -17 per cent compared to the average of 2019 (Le Quéré et al. 2020). The others countrywide research shows the major air pollutants have drastically fallen during the COVID-19 lockdown improving the air and water quality (Mahato et al. 2020; Sharma et al. 2020; Yunus et al. 2020). There is a strong relationship between ambient air pollutant and the meteorological attribute like temperature, humidity, wind speed, thunderstorm, etc., in an urban area (Akpinar et al. 2008; Hu et al. 2018). The research study also found that, due to the long lockdown period, the prevention of social distances has had a significant impact on the climate of several micro regions by improving air quality and as a result of this significant decrease in lighting activity in India (Chowdhuri et al. 2020).
In India, the nationwide lockdown was implemented one day after the government of India announced Janata Curfew on 22nd March 2020.1 Following a lockdown of 68th days (24th March to 31st May 2020) in four different phases, the government has declared unlocking phase, with the exception of the high alert of COVID-19 containment zones. Due to low energy consumption, India has witnessed a significant decline in major air pollutants monitored during the lockdown period (Mahato et al. 2020; Sharma et al. 2020).
The study therefore focused on reducing air pollutants (PM2.5, PM10, NO2, SO2, CO and O3) with a view to improving air quality and impacting regional temperatures (minimum, maximum and average temperatures) as well as India's climate during the lockdown period (April and May 2020) compared to previous years. Basically, this study emphasized on temporary reduction of the concentration of several air pollutants in the lower atmosphere, and as a result it significantly affects the climate of micro regions. Our study has given particular importance to the four megacity temperature reductions in India due to dramatic changes in air pollutants over a period of time. Further research can be carried out on several climatic parameters, such as the relationship between low air pollutants and wind speed, pressure, lighting activities, etc., and finally influence the climate of the micro region on the basis of the relationship between the above criteria, i.e., the reduction of air pollutants also significantly reduced temperatures. The study has indeed added new knowledge in literature broadly in earth science and particularly in temperature and atmospheric study. Apart from this, current study would add new information in our understanding of dynamics of air pollution and pollutants in the lower atmosphere or air controlling strategy of pollution.
Database and methodology
Data availability
The major pollutants data such as PM2.5, PM10, NO2, NH3, SO2, CO and O3 are available at https://app.cpcbccr.com/AQI_India/, https://safar.tropmet.res.in/index.php, and https://app.cpcbccr.com/ccr/. The daily maximum, minimum and average temperature data are available at https://www.iari.res.in/. Monthly temperature data for the month of May during the period of 1980–2019 are available at https://www.indiawaterportal.org/.
Methods
AQI is an index through which the air quality of the lower atmosphere is reported on a daily basis. It is generally measured to know how local air quality affects human health and how it affects the regional climate. The measurement of AQI is based on the particulate matters (PM10 and PM2.5), carbon monoxide (CO), nitrogen dioxide (NO2), sulfur dioxide (SO2), Ozone (O3) and ammonia (NH3). Several countries have their own air quality indices, so India also has its own national AQI categories. In India, the National Air Monitoring Program (NAMP) has been operated by the Central Pollution Control Board (CPCB) in cooperation with the Satellite Pollution Control Boards, covering more than 342 monitoring stations across the country. AQI values have been measured using the sub-index values for 223 stations across the country. The sub-index value was determined using the following equation (Gupta and Dhir 2019; Kumar and Goyal 2011).
| 1 |
where, q = Quality Rating, V = Observed values of the parameter, and Vs = Standard value recommended for the parameter. Thus, one of the pollutant’s sub-indexes has the highest value, and it is responsible for air quality in a station. Alongside the highest sub-index’s pollutant concentration value is the AQI. The value of AQI ranges from 0 to 500, and it is categorized into six categories, i.e., good, satisfactory, moderately polluted, poor, very poor and severe with their AQI ranges from 0–50, 51–100, 101–200, 201–300, 301–400 and 401–500, respectively.
The Mann–Kendall test is a method of nonparametric statistical technique to identify data series patterns (Kendall 1975). The principal advantages of this test are that no outer data properties or non-normal data sequence influence this test (Kendall 1975). The most famous test used by Man-Kendall is to grasp the hydrological, weather-related phenomena. However, this measure has been primarily used in this analysis to assess the direction of the air quality index. The monotone air quality pattern of the time series data was observed here. This method has generally been used to prove the hypothesis where the null hypothesis (H0) indicates that there is no such pattern of air quality and temperature over time. However, the alternative hypothesis (H1) indicates that there is a clear pattern in the air quality and temperature (increase or decrease) over time. A rank-based nonparametric technique is used to measure this test that can be used with skewed variables. The method used to measure Mann–Kendall tests has been shown. The Mann–Kendall statistical S test is calculated (Kendall 1975; Mann 1945) as follows
| 2 |
| 3 |
Here, and are rank of observation in and time series. The Mann and Kendall have reported that statistics S, with the mean and variance, and the variance is computed (Kendall, 1975; Mann, 1945) as
| 4 |
| 5 |
| 6 |
where n is the number of observations, m is the number of groups of tied ranks, each with tied observations. When the number of observation became large, the significance of trend can be computed comparing the standardized variable as followed.
| 7 |
The positive u value in the Mann–Kendall test shows a growing trend in the data series and a negative downward trend in the data series. The emission and the temperature parameters of the research region concerned were therefore determined on the basis of the u meaning. The estimate of the value u is then compared to the tabulated value to show the conclusion. The probability is contrasted with the one-to-one percent, which means the standard. In this case, if the measured value of u is greater than │u│ ≥ │u1 − α/2α│, the null hypothesis (H0) is rejected.
Sen's slope showed a pattern of intensity, where there is also a nonparametric approach to median utilization (Gilbert 1987). In this process, the data were sorted in an ascending manner (Gilbert1987). The first sub-series will be placed on the X-axis, while the Cartesian coordinate system will cover about half of the subseries on the Y-axis. The 45° straight line shows no data patterns, but the patterns below show a declining pattern beyond trends (Gilbert 1987). The slope estimates of N datasets were computed by the following equation.
| 8 |
where ,…, are the value of data at the time j and k (), respectively. The median of slope or Sen’s slope estimator of odd and even data is computed as
| 9 |
| 10 |
where is median of data trend. Equation (5) applied if N is odd data, and if N is even Eq. (6) is used. When the median slope is statistically different than zero, the confidence interval of at specific probability (Da Silva et al. 2015; Gilbert, 1987) is estimated as
| 11 |
where Var (S) is calculated from Eq. (6) and is obtained from the standard normal distribution.
It is also a well-known fact that every statistical technique has some limitations in its applied side. Therefore, the Man–Kendall test also has some limitations, which give a negative result in shorter datasets and periodicity data, i.e., seasonal variations. On the other hand, Sen's slope also produces a negative result in a short dataset. Therefore, in both of cases longer the time series data give much more effective result in trend analysis. Thus, here we used a long-term climatic data to meet our objective with special emphasis on, during and after lockdown period. Moreover, the AQI and the Mann–Kendall statistical method both will be suitable to understand the trend and internal dynamics of temporary improvement in ambient-air-quality reduced temperature during the COVID-19 lockdown period in India.
Results
Throughout this study, data on pollutants were used to show the improvement in air quality available from February 2016 to 20 May 2020 to estimate changes in daily emissions during the forced closure of the COVID-19 pandemic and its impact on the regional climate during the pandemic phase (2020) compared to previous years. This change in pollutants and air quality was compared with the average daily pollutants of previous available years (2016–2019 across the country) in order to provide a quantitative study of relative improvement compared to pre-lockdown conditions. Changes in daily atmospheric pollutants and temperatures have been estimated at five different types of forced lockdown phases (Table 1) across the country due to improved levels of pollutants and temperatures in accordance with strict government regulations and their impact on the regional climate and environment [Eqs. (1)–(11) in Methods]. The study is carried out across India as a whole, with 4 most polluted mega-cities (Delhi, Mumbai, Kolkata and Chennai) accounting for 1.4 billion people worldwide (18.5%), 15% of pollution and 12.5% of global deaths (Gurjar et al. 2016). The strict lockdown form of government intervention is specified on a scale of 1–5 and specifies the degree to which a negligible relaxation of 1.4 billion people has been permitted (Table 1). Scale 1 indicates that all kinds of activities are strictly prohibited throughout the country, e.g., 'Janata Curfew' from 7 a.m. To 9:00 p.m. Sunday 22 March 2020 to control the outbreak of COVID-19. Scale 2 shows that, despite the opening of the market, almost all services and factories have been declared suspended, the consequences of nationwide arrests for violating the lockdown regulation have been witnessed, but daily emissions have dropped substantially (5%). Scale 3 reflects that the relaxation has been introduced to agricultural businesses, livestock, aquaculture and forestry, and to shops selling agricultural goods, etc., which has boosted the daily level of emissions by 2%. However, the lockdown has also been extended to 3 May 2020. Scale 4 reveals the continuation of the enforced lockdown duration until 17 May 2020, where the red zones will remain under strict lockdown; however, then the orange zones would allow only private and hired vehicles with no public transport while, as usual, bus travel is permitted in green zones with a limited capacity of 50%. Scale 5 demonstrates extended relaxation and lockdown until 31 May 2020 in the red hot spot zones. This shows a gradual improvement in daily pollutants and air quality, resulting in a declining temperature trend across the country.
Table 1.
Lockdown types, its Prohibition and relaxation
| Scale | Lockdown type | Duration | Prohibition | Relaxation |
|---|---|---|---|---|
| Scale 1 | Janata Curfew | 22 March, 2020 (14-h) | Restriction on people stepping out from their homes; Road, air and rail transport services; educational institution; industrial establishments and hospitality services were suspended | Transportation services such as essential goods, fire, police along with emergency services, i.e., food shops, petrol pumps, ATMs were exempted |
| Scale 2 | Phase-I | 25 March–14 April, 2020 | Nearly all services and factories were suspended | Special parcel trains were allowed to transport essential goods |
| Scale 3 | Phase-II | 15 April–3 May, 2020 | Transports such as rail, Metro services, air, buses; inter-district and inter-state movements; educational institution; religious places, cinema halls, bars, shopping complexes; sports; industrial activities; etc. | Medical services with specific permitted, agricultural activities, online teaching, data and call centers for government activities only |
| Scale 4 | Phase-III | 4 May–17 May 2020 | Railway and Metro services, educational institutions, cinema halls, malls, places of worship, non-essential movement between 7 P. M.–7 A.M., inter/intra-district buses with 50% capacity | Shops/e-commerce dealing essential goods, private offices with 33%capacity, two-wheelers without pillion rider, four-wheelers with 1 driver and 2 passengers, inter-states movement of goods |
| Scale 5 | Phase-IV | 18 May–31 May 2020 | Metro, air and rail services remain suspended, religious and political gatherings prohibited; vulnerable groups such as those above 65 years, pregnant women and children below 10 to remain at home; schools, colleges, malls to remain shut | Buses, auto-rickshaws, cabs can operate; barber shops and salons can open; restaurants can function, but only for take-away; weddings cannot have more than 50 guests and funerals not more than 20; delivery of essential and non-essential items allowed through online shopping platforms; Cap on 33% strength in offices done away with, work from home to be encouraged; social distancing and staggered work hours to be followed in offices |
Daily changes in pollutants levels and air quality
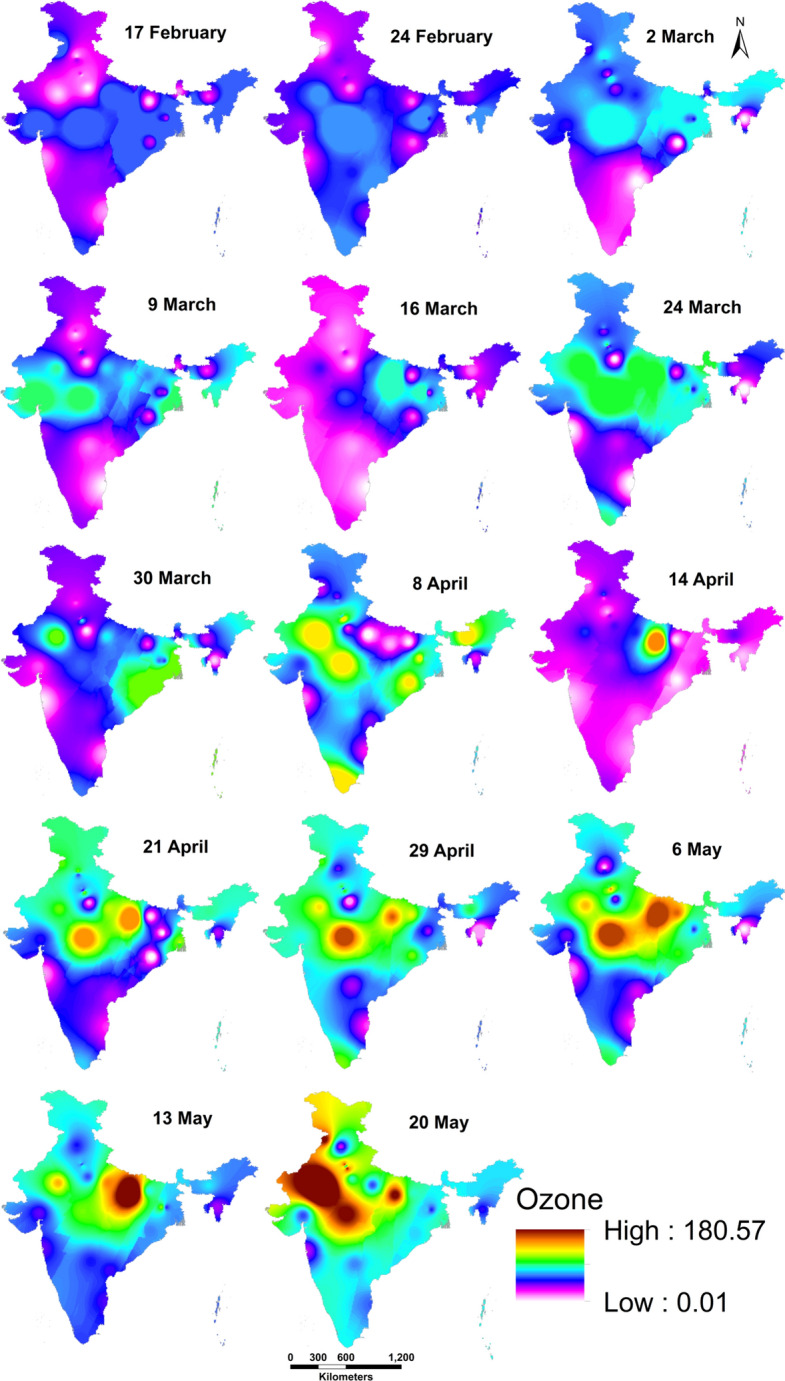
The strict lockdown policy was introduced by the Government of India to mitigate and monitor the Covid-19 pandemic. It was a common consensus to develop a policy of social distancing and to avoid a public meeting. In addition to the above policies, strict measures have been taken to put an end to the transport networks (air, rail and road) and the closure of major factories. As a result of this drastic improvement in air quality, especially among vital pollutants such as PM10, PM2.5, CO, NO2, SO2, NH3 and O3 have been observed (Fig. 1). The result of the strict lockdown was to decrease emissions of pollutants by − 12% (− 8– − 16%) per day across the nation by 22 March 2020 onwards compared to the average amount of pollution in 2019 (Fig. 2). The 21 March 2020 change in pollutants was the maximum daily average change from 1 January to 20 May 2020. In particular, the quantity of pollutants decreased from ‘Janata Curfew’ to lockdown (22 March 2020 to 31 March 2020) just below the permitted limit within one week, whereas the concentration of O3 increased in the manufacturing and transport areas (Fig. 3). Atmospheric pollution emissions such as PM10 and PM2.5 were decreased by − 48.56% and − 57.09%, respectively (Figs. 4 and 5). Other pollutants that showed significant improvements during pre-lockdown and lockdown are NO2 (− 46.95%), SO2 (− 32.11%), while CO (− 22.82%) and NH3 (− 30.61%) showed very small reductions compared to other pollutants (Fig. 6, 7, 8, 9 and Table 2). This resulted in a significant improvement in air quality (− 42.90% with a net decrease of − 65.85) during the lockdown period from ‘Janata Curfew’ to lockdown phase 4 (22 March–31 May 2020) (Fig. 10 and Table 2). It has been observed that the level of emissions has indeed improved in metropolitan areas. PM10 and PM2.5 decreased by − 43.91% and − 61.35% in Delhi (Table 3), while PM10 and PM2.5 decreased by − 58.04% and − 71.56%, respectively, in Mumbai (Table 4). PM10 and PM2.5 concentrations in Kolkata decreased by − 71.72% and − 81.25%, respectively (Table 5), while PM10 and PM2.5 concentrations in Chennai decreased by − 47.08% and -59.26%, respectively (Table 6), owing to the COVID-19 pandemic. Other pollutants with notable changes during the pandemic period are SO2 (− 32.10%) and NO2 (− 31.14%), though CO (− 25.17%) shows a rather slight decrease compared to other contaminants in Delhi (Table 3). Besides this, in Mumbai, CO (− 29.55%) and NO2 (− 77.56%) were the pollutants that showed substantial improvements, whereas SO2 (− 19.62%) saw a rather slight decrease relative to other pollutants (Table 4). Similarity, CO (− 59.83%) and NO2 (− 62.64%) are contaminants in Kolkata, which has seen a significant decrease in the pre-locking and lockdown period (Table 5). Similarity, CO (− 48.31%) and NO2 (− 33.43%) are contaminants in Chennai, which has seen a sharp decline during these phases (Table 6). This is due to a different pollution challenge in Chennai than the other megacities in India. Basically, this megacity has a unique coastal location, sea breeze is being developed, and all pollutants will disappear from the city and move inland. However, motorization in public transport is very high compared to many other megacities and therefore adds enormous pollution to the lower atmosphere, basically CO and NO2. However, due to a strict lockdown, the public transport system, i.e., road motorization, has been totally stopped. As a result, a sharp decrease in the level of CO and NO2 pollutants in the Chennai megacity has been observed.
Fig. 1.
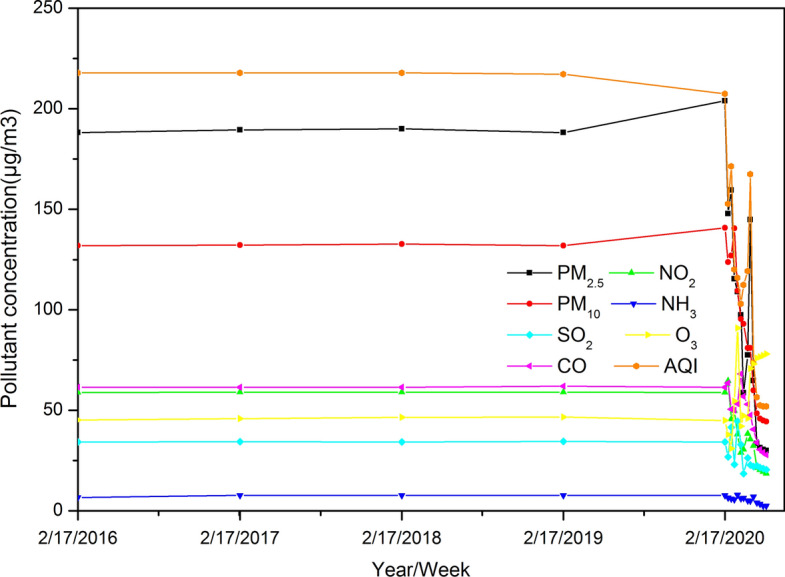
Trend of major pollutants during pre-lockdown (2016–2020) and lockdown period
Fig. 2.
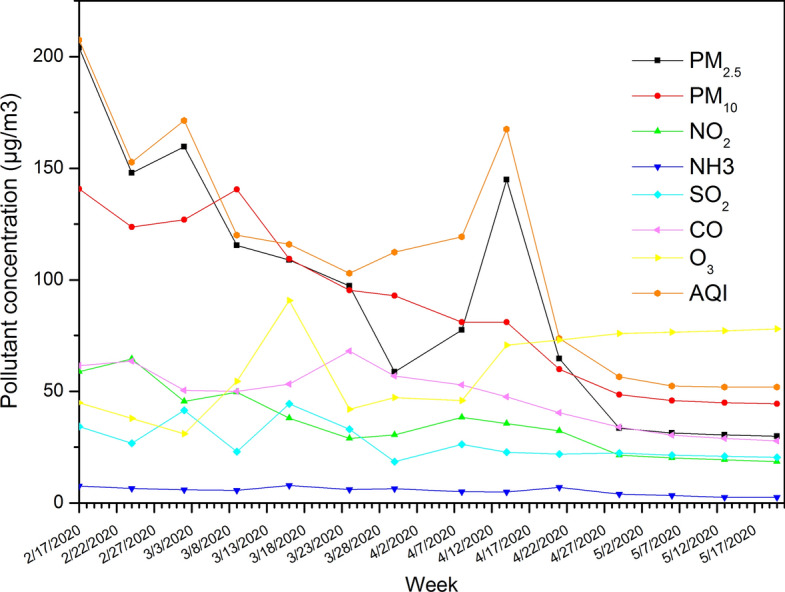
Trend of major pollutants during pre-lockdown (17 February–21 march, 2020) and lockdown period
Fig. 3.
Spatial distribution of O3 in before (17th February–16th March) and during lockdown (24th March–20th May) period
Fig. 4.

Spatial distribution of PM2.5 in before (17th February–16th March) and during lockdown (24th March–20th May) period
Fig. 5.
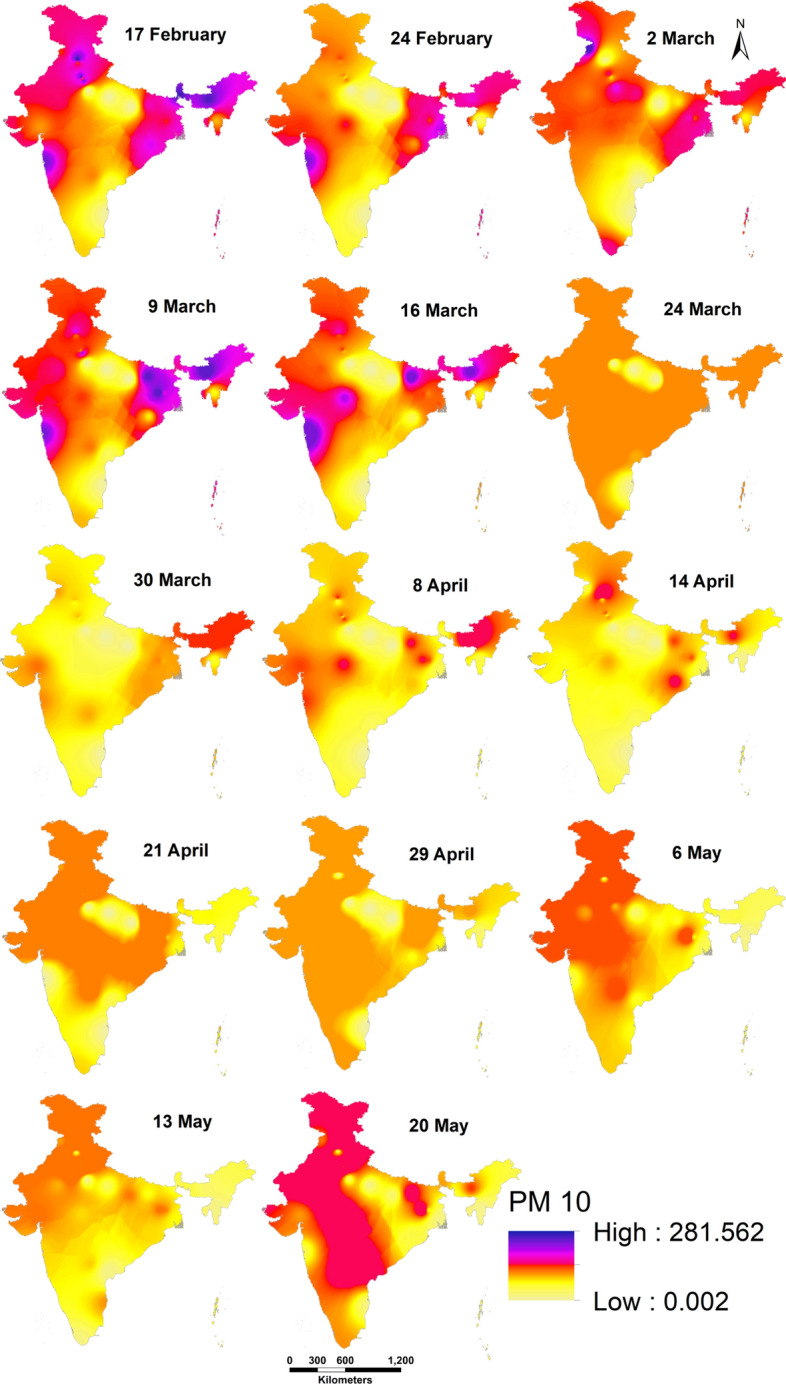
Spatial distribution of PM10 in before (17th February–16th March) and during lockdown (24th March–20th May) period
Fig. 6.
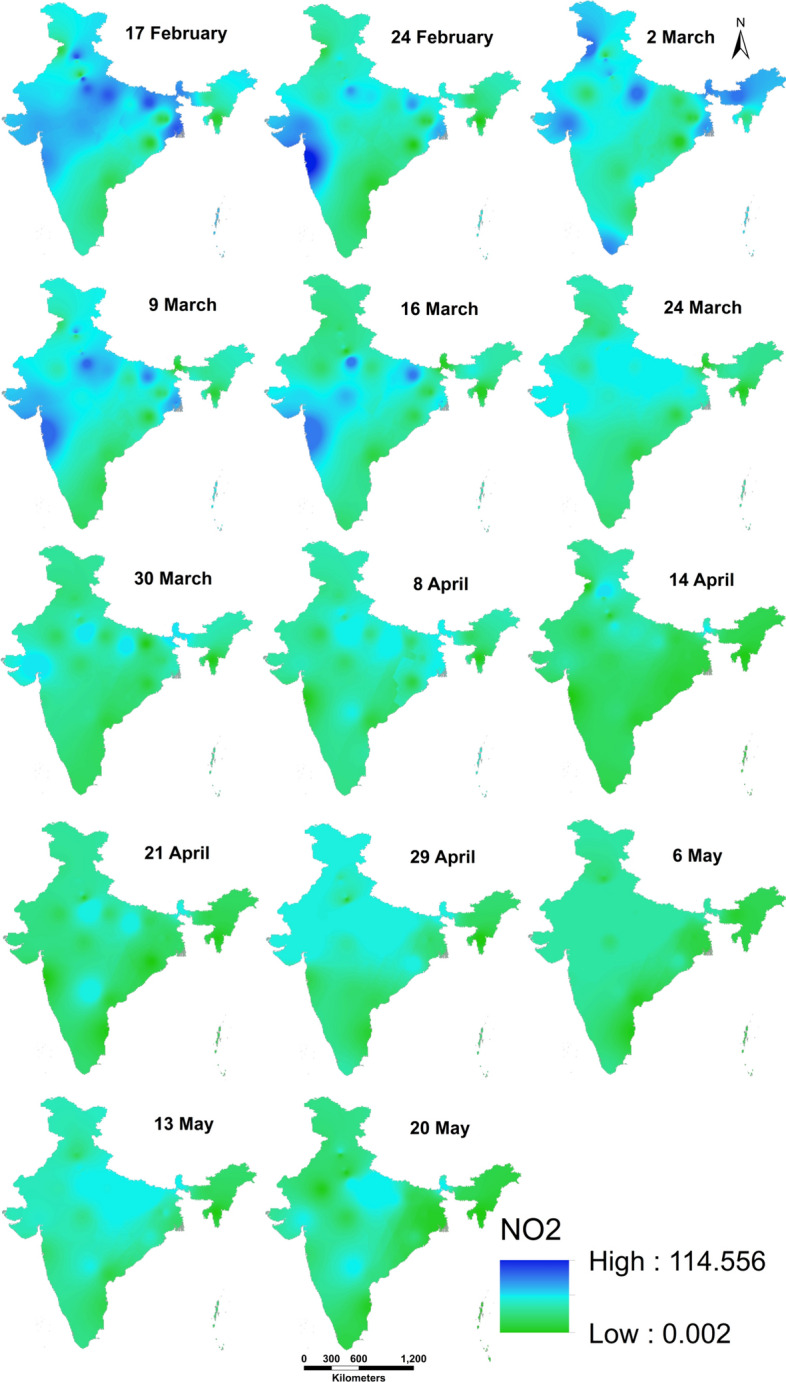
Spatial distribution of NO2 in before (17th February–16th March) and during lockdown (24th March–20th May) period
Fig. 7.
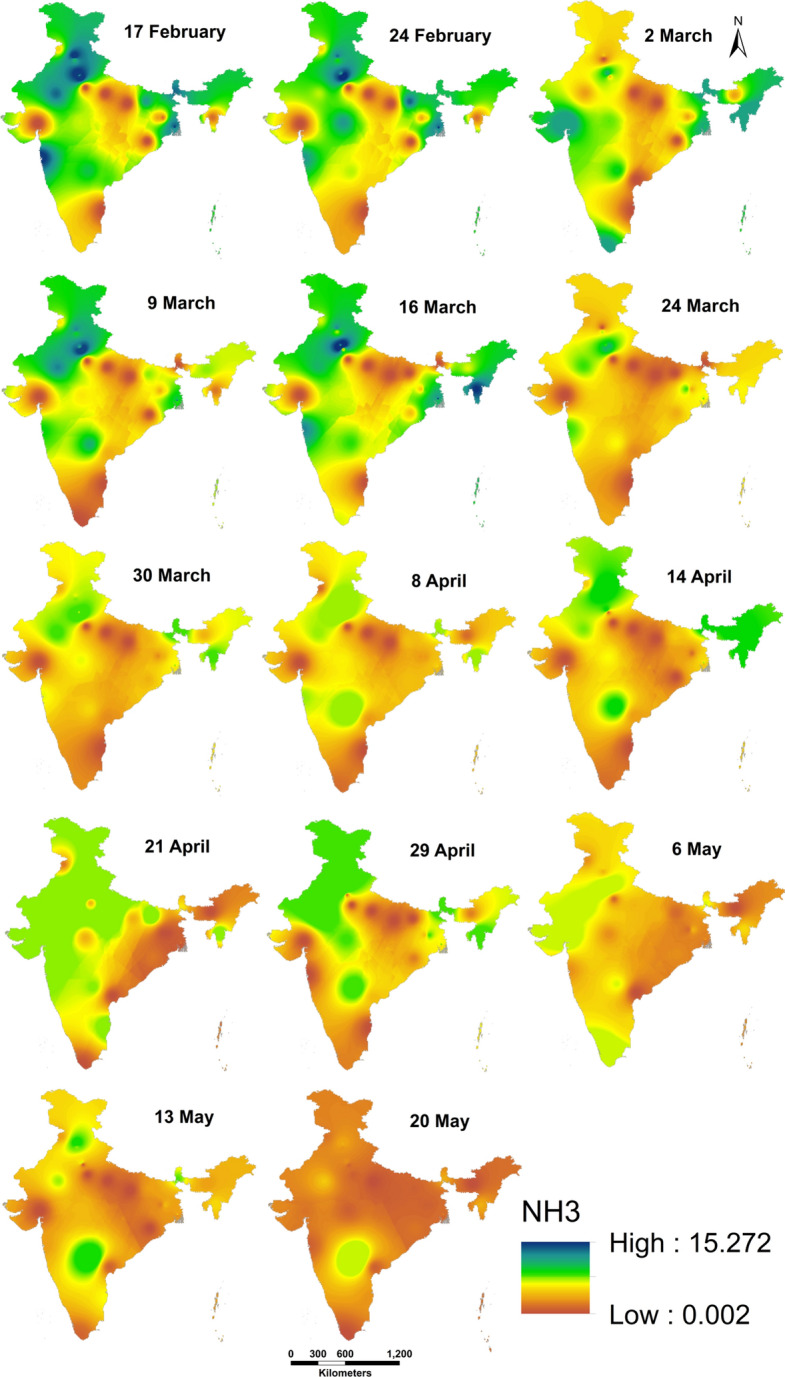
Spatial distribution of NH3 in before (17th February–16th March) and during lockdown (24th March–20th May) period
Fig. 8.
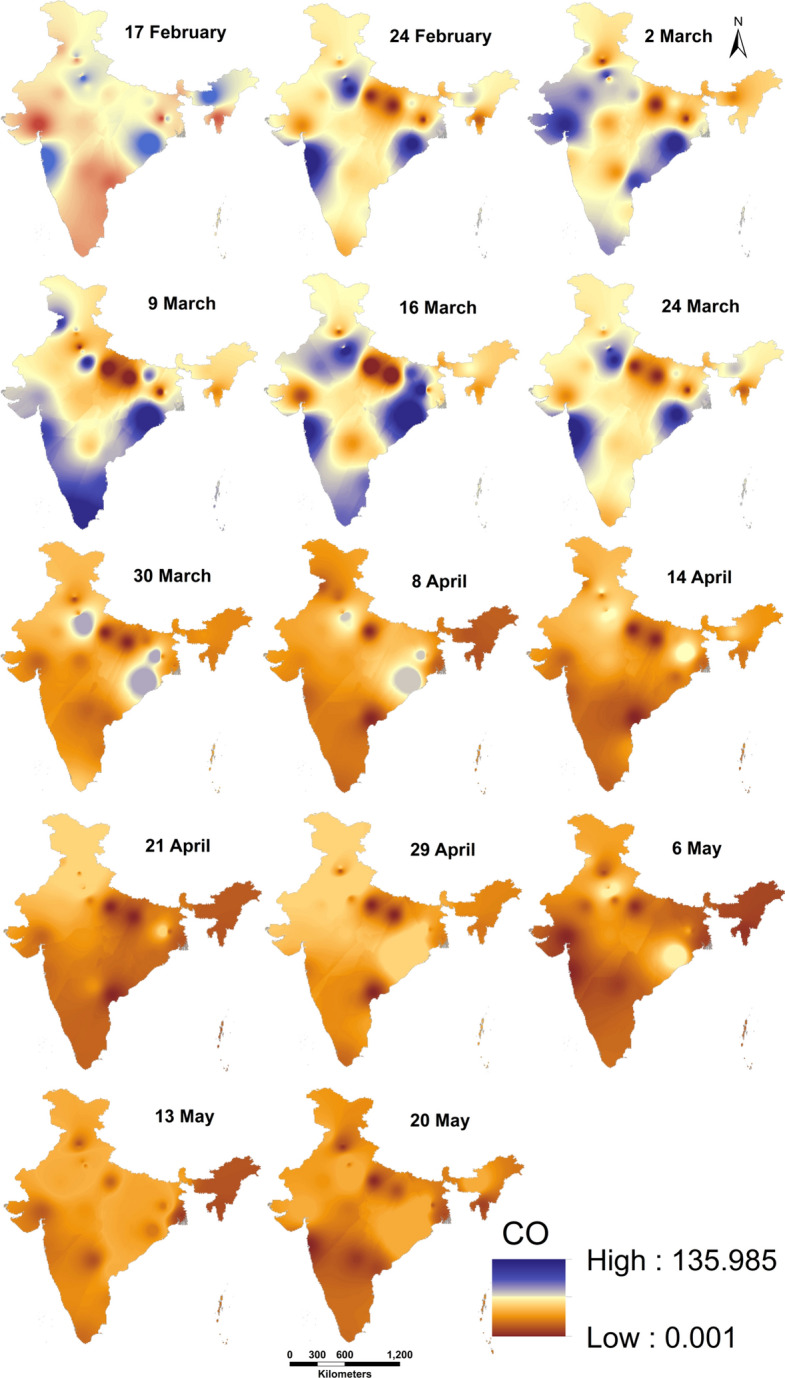
Spatial distribution of CO in before (17th February–16th March) and during lockdown (24th March–20th May) period
Fig. 9.
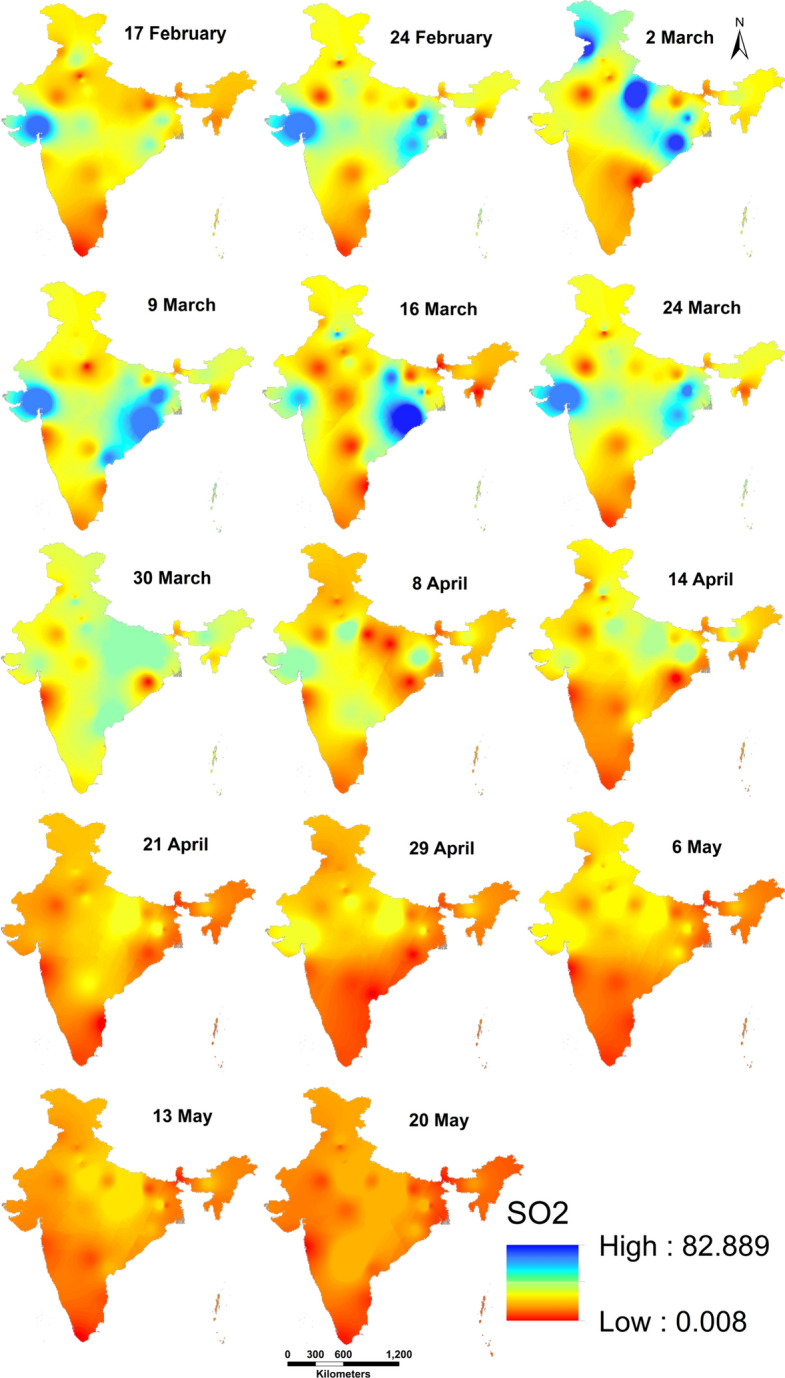
Spatial distribution of SO2 in before (17th February–16th March) and during lockdown (24th March–20th May) period
Table 2.
Pollutant matter and gases before and after lockdown in India, 2020
| Types of pollutants | Before lockdown | |||||||||
|---|---|---|---|---|---|---|---|---|---|---|
| 17-Feb-2020 | 24-Feb-2020 | 02-Mar-2020 | 09-Mar-2020 | 16-Mar-2020 | ||||||
| High | Low | High | Low | High | Low | High | Low | High | Low | |
| PM2.5 | 362.811 | 45.004 | 250.869 | 44.89 | 281.917 | 37.285 | 209.849 | 21.002 | 185.852 | 32.064 |
| PM10 | 281.562 | 0.02 | 247.435 | 0.017 | 253.908 | 0.004 | 281.057 | 0.012 | 218.757 | 0.013 |
| NO2 | 114.556 | 3.151 | 122.967 | 6.091 | 85.977 | 5.078 | 99.252 | 0.087 | 75.98 | 0.074 |
| NH3 | 15.272 | 0.009 | 13.001 | 0.007 | 11.95 | 0.002 | 11.253 | 0.005 | 15.745 | 0.006 |
| SO2 | 66.946 | 1.586 | 52.958 | 0.62 | 82.917 | 0.008 | 45.954 | 0.124 | 82.889 | 6.003 |
| CO | 106.885 | 16.043 | 127.022 | 0.001 | 100.888 | 0.131 | 99.856 | 0.001 | 106.526 | 0.001 |
| O3 | 82.752 | 7.133 | 75.695 | 0.01 | 57.94 | 4.068 | 104.955 | 4.004 | 180.57 | 1.007 |
| AQI | 362.812 | 52.004 | 257.106 | 48.376 | 281.918 | 60.753 | 210.122 | 30.002 | 185.956 | 46.002 |
| Types of pollutants | After lockdown | Overall variation | ||||||||||||||||||
|---|---|---|---|---|---|---|---|---|---|---|---|---|---|---|---|---|---|---|---|---|
| 24-Mar-2020 | 30-Mar-2020 | 08-Apr-2020 | 14-Apr-2020 | 21-Apr-2020 | 29-Apr-2020 | 6-May-2020 | 13-May-2020 | 20-May-2020 | Net | % | ||||||||||
| High | Low | High | Low | High | Low | High | Low | High | Low | High | Low | High | Low | High | Low | High | Low | |||
| PM2.5 | 163.655 | 31.001 | 117.316 | 0.085 | 154.839 | 0.022 | 289.776 | 0.029 | 129.258 | 0.055 | 66.972 | 0.029 | 62.789 | 0.027 | 60.89 | 0.025 | 59.798 | 0.024 | − 84.0104 | − 57.09 |
| PM10 | 190.831 | 0.011 | 185.95 | 0.013 | 161.907 | 0.011 | 161.907 | 0.011 | 119.696 | 0.008 | 96.943 | 0.008 | 91.69 | 0.005 | 89.89 | 0.002 | 88.79 | 0.002 | − 62.2966 | − 48.5635 |
| NO2 | 57.729 | 0.052 | 60.903 | 0.056 | 76.627 | 0.008 | 70.983 | 0.087 | 64.506 | 0.008 | 42.726 | 0.026 | 40.521 | 0.021 | 38.789 | 0.002 | 36.988 | 0.002 | − 24.0972 | − 46.9536 |
| NH3 | 12.168 | 0.006 | 12.764 | 0.005 | 10.159 | 0.006 | 9.968 | 0.005 | 13.985 | 0.003 | 7.995 | 0.004 | 6.889 | 0.002 | 5.01 | 0.004 | 5.02 | 0.005 | − 2.05844 | − 30.6088 |
| SO2 | 65.94 | 0.023 | 36.935 | 0.03 | 52.605 | 0.025 | 45.482 | 0.027 | 43.908 | 0.003 | 44.891 | 0.003 | 42.907 | 0.002 | 41.89 | 0.005 | 40.79 | 0.005 | − 10.9188 | − 32.1136 |
| CO | 135.985 | 0.069 | 113.814 | 0.051 | 105.86 | 0.001 | 94.971 | 0.051 | 80.917 | 0.001 | 67.923 | 0.027 | 60.789 | 0.025 | 57.937 | 0.002 | 55.789 | 0.003 | − 12.7235 | − 22.8283 |
| O3 | 78.993 | 5.064 | 88.126 | 6.253 | 91.789 | 0.029 | 141.282 | 0.045 | 145.89 | 0.058 | 151.789 | 0.071 | 152.369 | 0.659 | 153.789 | 0.5 | 155.89 | 0.002 | 32.91671 | 63.52934 |
| AQI | 163.885 | 42.001 | 190.852 | 34.058 | 218.76 | 20.006 | 289.997 | 45.002 | 129.509 | 18.005 | 99.895 | 13.051 | 92.889 | 12.01 | 90.79 | 13.01 | 90.89 | 13.05 | − 65.8573 | − 42.9024 |
Source: National Air quality Index portal, Central Pollution Control Board, Govt. of India, 2020
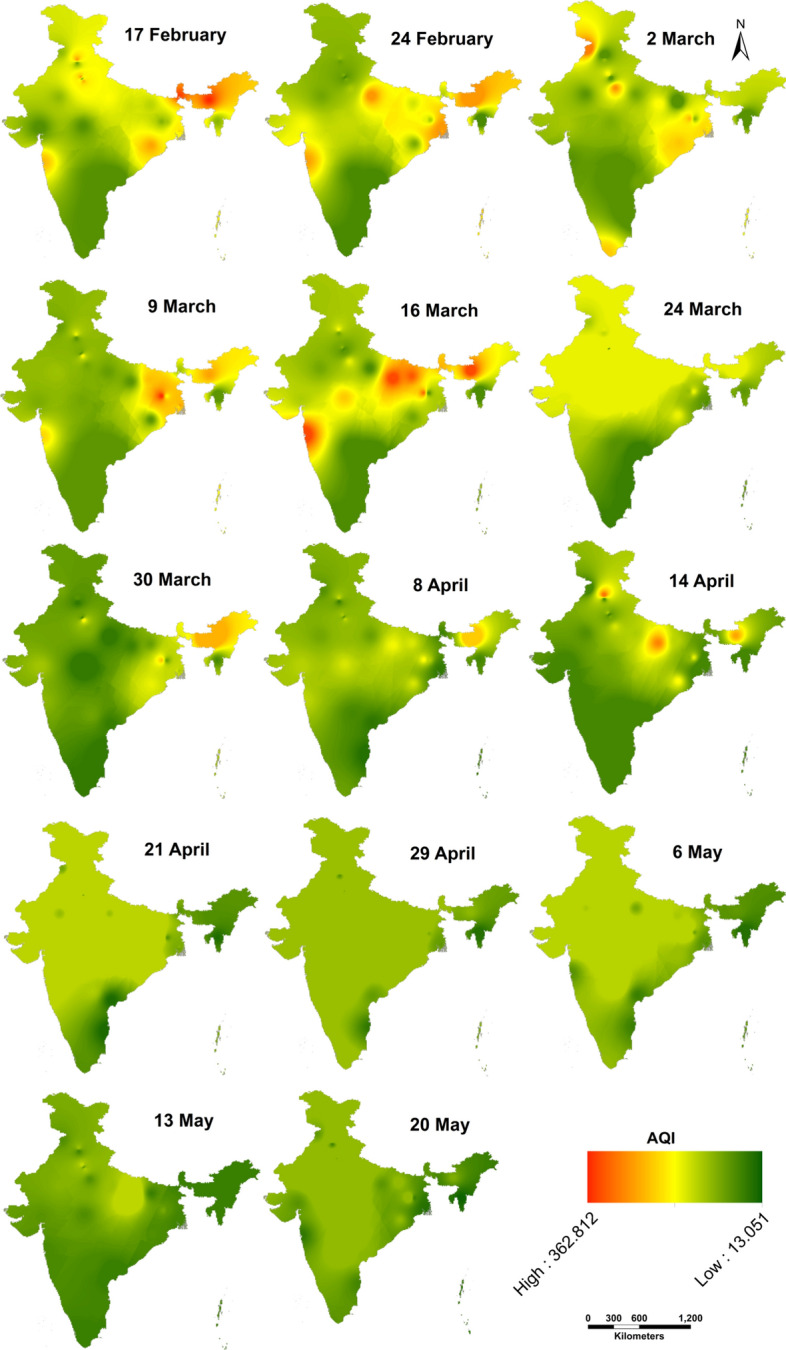
Fig. 10.
Spatial distribution of Air Quality Index (AQI) in before (17th February–16th March) and during lockdown (24th March–20th May) period
Table 3.
Pollutant matter and gases before and after lockdown in Delhi, 2020
| Types of pollutants | Before lockdown | |||||||||
|---|---|---|---|---|---|---|---|---|---|---|
| 17-Feb-2020 | 24-Feb-2020 | 02-Mar-2020 | 09-Mar-2020 | 16-Mar-2020 | ||||||
| High | Low | High | Low | High | Low | High | Low | High | Low | |
| PM2.5 | 360.998 | 237.014 | 206.997 | 83.0983 | 246.746 | 100.014 | 185.979 | 7.085 | 245.963 | 8.089 |
| PM10 | 330.997 | 46.044 | 197.977 | 85.004 | 260.124 | 11.1415 | 218.968 | 50.1346 | 204.978 | 88.044 |
| NO2 | 120.932 | 6.015 | 78.976 | 28.057 | 85.9892 | 8.81 | 76.9671 | 6.04546 | 69.974 | 22.021 |
| NH3 | 12.994 | 0.015 | 12.999 | 3.006 | 11.999 | 4.005 | 9.999 | 2.004 | 13.994 | 1.002 |
| SO2 | 41.981 | 5.28 | 29.999 | 1.002 | 36.995 | 6.014 | 45.9934 | 6.012 | 33.792 | 7.001 |
| CO | 123.928 | 31.006 | 108.908 | 19.041 | 104.972 | 14.012 | 96.9816 | 5.006 | 103.948 | 12.008 |
| O3 | 42.999 | 30 | 65.987 | 8.008 | 28.849 | 5.013 | 73.97 | 3.016 | 42.968 | 4.019 |
| AQI | 361.998 | 42.59 | 364.89 | 45.32 | 355.489 | 52.13 | 312.35 | 40.89 | 319.89 | 42.39 |
| Types of pollutants | After lockdown | Overall variation | ||||||||||||||||||
|---|---|---|---|---|---|---|---|---|---|---|---|---|---|---|---|---|---|---|---|---|
| 24-Mar-2020 | 30-Mar-2020 | 08-Apr-2020 | 14-Apr-2020 | 21-Apr-2020 | 29-Apr-2020 | 06-May-2020 | 13-May-2020 | 20-May-2020 | ||||||||||||
| High | Low | High | Low | High | Low | High | Low | High | Low | High | Low | High | Low | High | Low | High | Low | Net | % | |
| PM2.5 | 163.652 | 10.068 | 98.998 | 40.0045 | 90.998 | 29.025 | 118.98 | 35.002 | 107.789 | 32.001 | 110.23 | 38.8475 | 97.32 | 1.0078 | 96.89 | 1.198 | 95.98 | 2.02 | − 103.198 | − 61.3548 |
| PM10 | 142.985 | 53.037 | 90.999 | 45.02 | 118.999 | 68.0165 | 182.997 | 0.033 | 118.998 | 44.002 | 146.999 | 51.0328 | 123.989 | 33.008 | 112.59 | 32.09 | 109.89 | 33.08 | − 65.5765 | − 43.9105 |
| NO2 | 55.977 | 2.023 | 78.947 | 4.002 | 63.961 | 3.001 | 78.956 | 13.023 | 78.9491 | 6.002 | 78.948 | 10.001 | 41.999 | 9.001 | 42.58 | 8.02 | 41.39 | 7.59 | − 15.6914 | − 31.147 |
| NH3 | 11.39 | 3.001 | 9.993 | 2.001 | 5.999 | 2.014 | 10.99 | 3 | 10.94 | 0.0014 | 8.98 | 1.001 | 7.89 | 4.009 | 5.89 | 1.01 | 5.69 | 1.012 | − 1.9344 | − 26.8603 |
| SO2 | 40.73 | 9.001 | 29.98 | 1.003 | 24.98 | 4.00218 | 28.98 | 7.0004 | 21.999 | 1.008 | 20.89 | 1.009 | 19.89 | 9.0013 | 19.01 | 2.01 | 20.12 | 1.02 | − 6.87172 | − 32.1005 |
| CO | 100.23 | 2 | 74.813 | 7.026 | 75.89 | 9.053 | 76.89 | 20 | 77.78 | 16.007 | 75.89 | 16.9307 | 76.89 | 25.759 | 76.23 | 14.25 | 75.89 | 13.24 | − 15.605 | − 25.1771 |
| O3 | 46.996 | 5.019 | 55.958 | 5.023 | 73.944 | 5.031 | 157.985 | 5.0534 | 52.999 | 6.04 | 168.985 | 17.0367 | 66.9553 | 14.029 | 66.89 | 12.39 | 65.98 | 12.98 | 16.14457 | 52.9627 |
| AQI | 218.59 | 21.89 | 210.58 | 22.89 | 201.89 | 22.69 | 200.79 | 21.69 | 189.89 | 22.89 | 169.87 | 18.98 | 152.39 | 18.79 | 132.89 | 18.29 | 112.59 | 18.01 | − 95.1493 | − 49.0982 |
Table 4.
Pollutant matter and gases before and after lockdown in Mumbai, 2020
| Types of pollutants | Before lockdown | |||||||||
|---|---|---|---|---|---|---|---|---|---|---|
| 17-Feb-2020 | 24-Feb-2020 | 02-Mar-2020 | 09-Mar-2020 | 16-Mar-2020 | ||||||
| High | Low | High | Low | High | Low | High | Low | High | Low | |
| PM2.5 | 292.98 | 133.028 | 224.98 | 71.027 | 168.992 | 58.0096 | 65.9991 | 37.0005 | 131.997 | 48.0012 |
| PM10 | 301.988 | 118.022 | 238.99 | 13.0162 | 195.992 | 41.0102 | 156.996 | 12.0027 | 240.991 | 41.0144 |
| NO2 | 108.993 | 1.0012 | 122.997 | 11.0017 | 81.9965 | 21.0048 | 70.9981 | 4.0009 | 116.983 | 8.0012 |
| NH3 | 8.9996 | 1.0004 | 11.9976 | 2.0003 | 56.9928 | 1.0024 | 8.9981 | 1.0001 | 10.9994 | 0.0013 |
| SO2 | 41.9953 | 4.0002 | 3.997 | 1.0008 | 89.9913 | 4.0004 | 54.9935 | 3.0006 | 58.9936 | 5.0005 |
| CO | 92.9973 | 24.0117 | 106.989 | 2.0016 | 91.9966 | 19.0008 | 75.9933 | 9.0065 | 114.982 | 24.0008 |
| O3 | 57.9958 | 13.0002 | 83.917 | 0.0009 | 36.9991 | 3.0037 | 45.9992 | 9.0003 | 57.9903 | 8.0054 |
| AQI | 301.993 | 133.028 | 238.994 | 110.018 | 195.995 | 79.006 | 156.996 | 76.0061 | 240.991 | 48.0023 |
| Types of pollutants | After lockdown | Overall variation | ||||||||||||||||||
|---|---|---|---|---|---|---|---|---|---|---|---|---|---|---|---|---|---|---|---|---|
| 24-Mar-2020 | 30-Mar-2020 | 08-Apr-2020 | 14-Apr-2020 | 21-Apr-2020 | 29-Apr-2020 | 06-May-2020 | 13-May-2020 | 20-May-2020 | ||||||||||||
| High | Low | High | Low | High | Low | High | Low | High | Low | High | Low | High | Low | High | Low | High | Low | Net | % | |
| PM2.5 | 63.9949 | 32.0005 | 53.9995 | 24.0029 | 64.9976 | 20.0021 | 51.99 | 13.0053 | 52.9983 | 26.0016 | 37.9998 | 19.0002 | 36.9987 | 19.0001 | 38.49 | 19.01 | 37.19 | 20.01 | − 88.163 | − 71.5601 |
| PM10 | 98.9978 | 41.0048 | 92.9965 | 4.0065 | 115.997 | 41.0054 | 92.9827 | 5.0166 | 95.9966 | 38.0032 | 77.9979 | 27.009 | 75.0001 | 26.0098 | 74.89 | 27.01 | 72.189 | 21.01 | − 78.9399 | − 58.0431 |
| NO2 | 30.9944 | 1.0011 | 21.9989 | 4.0002 | 16.999 | 2.0001 | 15.9992 | 3.0001 | 30.9968 | 3.0012 | 21.9998 | 2.00297 | 20.9998 | 2.0001 | 20.89 | 2.01 | 19.89 | 1.09 | − 42.427 | − 77.5662 |
| NH3 | 6.9998 | 1.0001 | 4.9998 | 1.0005 | 4.4998 | 1.0003 | 2.9999 | 1.0001 | 7.9994 | 1.0001 | 3.9998 | 1.0003 | 3.9998 | 1.0001 | 4.01 | 1.0001 | 3.98 | 1.012 | − 7.38243 | − 71.6796 |
| SO2 | 51.47 | 2.0008 | 54.79 | 1.0008 | 42.89 | 1.0009 | 28.9937 | 3.0006 | 28.9943 | 2.0011 | 79.9823 | 2.0025 | 28.3339 | 1.9998 | 27.49 | 1.59 | 27.69 | 1.01 | − 5.2395 | − 19.6256 |
| CO | 74.9926 | 12.0006 | 81.9914 | 11.0013 | 83.9906 | 6.0018 | 88.9795 | 12.0003 | 94.9792 | 7.0031 | 57.9945 | 5.00177 | 54.9998 | 4.0001 | 54.01 | 4.49 | 53.89 | 4.0001 | − 16.5798 | − 29.5551 |
| O3 | 62.9892 | 6.0002 | 81.9845 | 7.001 | 18.9991 | 2.0017 | 21.9996 | 4.0014 | 38.9924 | 7.0027 | 162.984 | 1.0028 | 89.0027 | 2.9998 | 87.59 | 2.01 | 88.59 | 2.0001 | 6.583877 | 20.84086 |
| AQI | 98.9979 | 55.0029 | 92.9978 | 56.0021 | 115.998 | 78.0003 | 92.994 | 62.0059 | 95.9977 | 42.0006 | 79.9981 | 38.0108 | 78.89 | 37.01 | 68.01 | 35.89 | 66.59 | 34.0001 | − 89.8587 | − 56.8356 |
Table 5.
Pollutant matter and gases before and after lockdown in Kolkata, 2020
| Types of Pollutants | Before lockdown | |||||||||
|---|---|---|---|---|---|---|---|---|---|---|
| 17-Feb-2020 | 24-Feb-2020 | 02-Mar-2020 | 09-Mar-2020 | 16-Mar-2020 | ||||||
| High | Low | High | Low | High | Low | High | Low | High | Low | |
| PM2.5 | 294.815 | 145.278 | 289.808 | 137.249 | 289.836 | 148.305 | 170.968 | 71.2055 | 94.919 | 21.1054 |
| PM10 | 286.527 | 133.145 | 272.601 | 115.089 | 253.942 | 136.049 | 180.949 | 73.049 | 102.969 | 34.1038 |
| NO2 | 122.907 | 55.047 | 92.934 | 52.1404 | 93.967 | 47.036 | 71.9765 | 11.129 | 67.9675 | 5.07228 |
| NH3 | 17.949 | 2.025 | 14.963 | 1.03 | 13.964 | 2.019 | 10.9744 | 3.003 | 10.9769 | 1.00784 |
| SO2 | 25.9558 | 10.0092 | 65.9652 | 7.018 | 60.9709 | 10.0111 | 35.986 | 5.012 | 29.9753 | 5.03107 |
| CO | 175.746 | 16.039 | 61.9864 | 26.044 | 89.8923 | 18.1206 | 47.9403 | 10.098 | 77.886 | 10.0436 |
| O3 | 153.89 | 17.0524 | 125.89 | 10.011 | 155.541 | 12.0856 | 224.832 | 12.051 | 172.776 | 52.0712 |
| AQI | 341.988 | 41.59 | 324.746 | 42.32 | 331.13 | 42.13 | 302.59 | 39.89 | 317.89 | 41.39 |
| Types of pollutants | After lockdown | Overall variation | ||||||||||||||||||
|---|---|---|---|---|---|---|---|---|---|---|---|---|---|---|---|---|---|---|---|---|
| 24-Mar-2020 | 30-Mar-2020 | 08-Apr-2020 | 14-Apr-2020 | 21-Apr-2020 | 29-Apr-2020 | 06-May-2020 | 13-May-2020 | 20-May-2020 | ||||||||||||
| High | Low | High | Low | High | Low | High | Low | High | Low | High | Low | High | Low | High | Low | High | Low | Net | % | |
| PM2.5 | 92.896 | 10.0494 | 87.927 | 1.0265 | 34.9943 | 21.0177 | 50.9949 | 38.0031 | 49.78 | 1.0072 | 39.59 | 5.01859 | 30.997 | 20.005 | 30.29 | 4.02 | 38.79 | 5.01 | − 135.159 | − 81.2504 |
| PM10 | 97.901 | 50.0352 | 97.977 | 50.0208 | 44.988 | 24.0394 | 72.9821 | 45.0229 | 47.986 | 23.0255 | 43.9583 | 16.0316 | 48.989 | 28.025 | 42.38 | 16.32 | 41.89 | 16.89 | − 113.928 | − 71.7238 |
| NO2 | 62.8981 | 9.038 | 35.9857 | 10.0205 | 153.903 | 5.0199 | 17.9627 | 4.0093 | 22.9611 | 5.01257 | 18.9698 | 4.01197 | 18.969 | 5.009 | 17.23 | 4.05 | 16.89 | 5.01 | − 38.8537 | − 62.6495 |
| NH3 | 9.981 | 2.005 | 7.99074 | 2.00448 | 5.9969 | 1.0036 | 7.98165 | 1.0035 | 6.98506 | 1.00278 | 5.991 | 1.002 | 4.997 | 1.002 | 5.89 | 1.01 | 5.39 | 1.002 | − 3.77795 | − 48.4899 |
| SO2 | 19.9856 | 9.006 | 24.9874 | 9.00669 | 8.9987 | 6.0024 | 13.9823 | 3.00922 | 14.9726 | 2.00961 | 8.999 | 4.0004 | 9.995 | 2.009 | 8.39 | 4.01 | 7.89 | 4.012 | − 16.6342 | − 64.9941 |
| CO | 65.9023 | 13.041 | 51.9112 | 3.147 | 28.959 | 7.064 | 31.9605 | 10.0659 | 21.9756 | 8.04294 | 31.953 | 7.0712 | 29.955 | 6.031 | 28.89 | 6.01 | 27.955 | 6.01 | − 31.9383 | − 59.8323 |
| O3 | 84.8868 | 14.018 | 167.815 | 62.0623 | 154.69 | 20.0084 | 153.48 | 14.033 | 164.89 | 15.0362 | 136.57 | 21.0121 | 123.69 | 13.009 | 123.78 | 13.01 | 122.89 | 14.09 | − 14.7883 | − 15.7961 |
| AQI | 210.69 | 21.57 | 201.69 | 21.47 | 198.89 | 21.59 | 198.79 | 20.89 | 190.29 | 21.79 | 168.98 | 18.9 | 151.39 | 18.69 | 133.59 | 17.89 | 110.39 | 17.89 | − 85.6008 | − 46.8875 |
Table 6.
Pollutant matter and gases before and after lockdown in Chennai, 2020
| Types of pollutants | Before lockdown | |||||||||
|---|---|---|---|---|---|---|---|---|---|---|
| 17-Feb-2020 | 24-Feb-2020 | 02-Mar-2020 | 09-Mar-2020 | 16-Mar-2020 | ||||||
| High | Low | High | Low | High | Low | High | Low | High | Low | |
| PM2.5 | 72.9998 | 40.0023 | 68.9998 | 37.0023 | 110.993 | 18.0015 | 91.997 | 18.015 | 75.9998 | 35.0001 |
| PM10 | 52.9983 | 22.0005 | 58.995 | 21.0007 | 54.321 | 20.993 | 27.9988 | 9.0041 | 50.0001 | 20.6312 |
| NO2 | 22.9995 | 5.0012 | 18.9996 | 5.0005 | 23.01 | 3.01 | 19.9994 | 3.0051 | 21.9901 | 1.0013 |
| NH3 | 11.9999 | 7.002 | 38.996 | 11.0002 | 12.99 | 5.893 | 90.9991 | 9.0031 | 11.9998 | 0.9998 |
| SO2 | 55.9982 | 7.0006 | 47.9985 | 6.0005 | 48.7 | 4.003 | 7.991 | 4.003 | 38.0001 | 5.0124 |
| CO | 68.9991 | 31.0001 | 96.998 | 21.002 | 88.327 | 15.0019 | 69.9983 | 15.0015 | 77.0001 | 16.0001 |
| O3 | 21.9997 | 13.001 | 24.9998 | 19.0001 | 13.63 | 5.983 | 39.321 | 4.002 | 41.0001 | 0.9998 |
| AQI | 198.47 | 40.28 | 187.59 | 41.01 | 195.48 | 39.19 | 189.59 | 38.79 | 187.89 | 40.13 |
| Types of pollutants | After lockdown | Overall variation | |||||||||||||||||||
|---|---|---|---|---|---|---|---|---|---|---|---|---|---|---|---|---|---|---|---|---|---|
| 24-Mar-2020 | 30-Mar-2020 | 08-Apr-2020 | 14-Apr-2020 | 21-Apr-2020 | 29-Apr-2020 | 6-May-2020 | 13-May-2020 | 20-May-2020 | |||||||||||||
| High | Low | High | Low | High | Low | High | Low | High | Low | High | Low | High | Low | High | Low | High | Low | Net | % | ||
| PM2.5 | 58.3249 | 30.0001 | 63.001 | 27.9998 | 42.9998 | 10.0001 | 54.9998 | 0.998 | 35.0001 | 4.0001 | 16.0018 | 7.0001 | 14.9998 | 9.0001 | 13.69 | 7.01 | 13.59 | 8.59 | − 33.723 | − 59.266 | |
| PM10 | 30.9998 | 14.0001 | 38.001 | 11.214 | 31.0001 | 18.0098 | 18.9998 | 11.001 | 20.9998 | 16.0001 | 22.0001 | 11.0019 | 16.9998 | 7.001 | 20.59 | 10.59 | 16.49 | 7.01 | − 15.9105 | − 47.0804 | |
| NO2 | 20.0001 | 1.0001 | 21.001 | 2.998 | 16.0001 | 1.998 | 26.9998 | 1.998 | 8.0001 | 0.998 | 12.9998 | 3.0098 | 9.9998 | 1.0001 | 9.49 | 1.01 | 8.89 | 1.19 | − 4.14708 | − 33.4397 | |
| NH3 | 14.0001 | 7.9998 | 10.001 | 5.0012 | 11.9998 | 5.0019 | 12.001 | 6.001 | 9.0001 | 5.0001 | 10.9998 | 2.0018 | 10.0018 | 1.0009 | 10.01 | 1.01 | 9.89 | 1.0009 | − 12.7593 | − 63.5163 | |
| SO2 | 9.0009 | 5.0001 | 11.0001 | 3.9287 | 8.019 | 3.9998 | 20.0001 | 3.998 | 8.0001 | 3.998 | 8.9998 | 2.00019 | 8.9998 | 2.0001 | 8.49 | 1.59 | 8.01 | 1.01 | − 15.9127 | − 70.8152 | |
| CO | 48.9998 | 1.0001 | 38.9998 | 0.0998 | 37.0001 | 19.0002 | 41.0001 | 17.001 | 37.0019 | 17.0001 | 45.0011 | 19.9998 | 36.0001 | 14.0018 | 32.49 | 14.01 | 31.89 | 14.01 | − 24.1269 | − 48.3188 | |
| O3 | 40.9998 | 5.9998 | 65.889 | 6.0001 | 66.89 | 9.0019 | 78.49 | 11.001 | 120.998 | 10.0098 | 101.998 | 19.9998 | 124.0018 | 13.9909 | 124.01 | 12.59 | 123.01 | 13.01 | 34.2669 | 186.2974 | |
| AQI | 185.79 | 20.57 | 145.79 | 20.49 | 152.69 | 20.59 | 150.589 | 19.89 | 123.69 | 20.78 | 101.29 | 17.89 | 89.789 | 17.79 | 88.79 | 17.01 | 79.89 | 16.89 | − 44.1638 | − 38.1241 | |
Changes in daily temperature
A significant decrease in temperature was noted when the COVID-19 lockdown minimized human activity and the movements of vehicles, thus decreasing concentrations of pollutants in the atmosphere, which eventually led to a considerable decrease in temperature (Figs. 11 and 12). The daily temperature trend during the Covid-19 pandemic lockout for maximum, minimum and average (Table 7) are 0.099 °C, 0.109 °C and 0.102 °C, while in 2019 these daily temperature trends were 0.102 °C, 0.119 °C and 0.111 °C per day. Similarly, in 2018 these daily temperature trends were also found increasing (0.110 °C, 0.124 °C and 0.129 °C). The same rising temperature trend was observed for the rest of the years (1980–2020). The findings of the Mann-Kendal and Sen slope rank tests indicate that the maximum, minimum and average temperatures for May 2020 (lockdown period) decreased by 2 °C, 1 °C and 1.5 °C, respectively, compared to the previous year, i.e., 1980–2019 which eventually had a considerable impact on the regional climate (Table 7). In the case of the metropolitan cities of India, the same findings have been found that temperatures in Delhi are falling close to 3 °C due to a significant reduction in air pollution, while temperatures in Kolkata are falling by 2.5 °C, while temperatures in Mumbai and Chennai are falling by 2 °C.
Fig. 11.
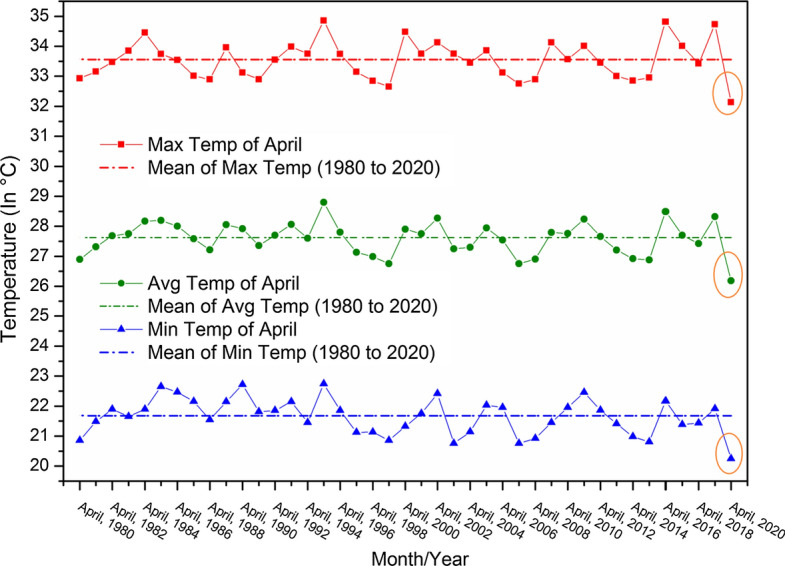
Trend in maximum, minimum and average temperature of April month from 1980 to 2020
Fig. 12.
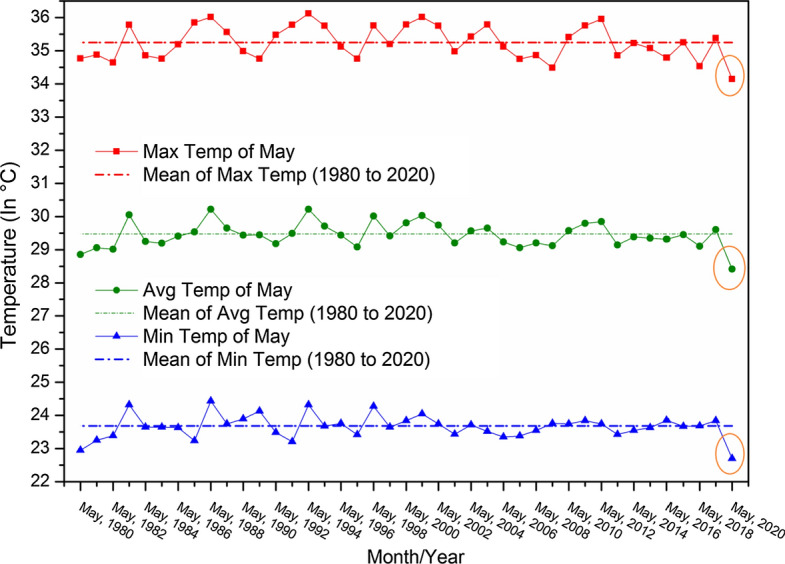
Trend in maximum, minimum and average temperature of May month from 1980 to 2020
Table 7.
Daily trend of temperature (°C) in India and its four megacities for the year of 2018, 2019, 2020
| Mega city and Country | Year | Daily temperature | |||||
|---|---|---|---|---|---|---|---|
| Mann–Kendal Z | Sen's slope | ||||||
| Maximum | Minimum | Average | Maximum | Minimum | Average | ||
| Delhi | 2020 | 8.88*** | 8.76*** | 8.69*** | 0.99 | 0.121 | 0.118 |
| 2019 | 9.21*** | 9.89*** | 9.77*** | 0.102 | 0.133 | 0.129 | |
| 2018 | 9.56*** | 10.09*** | 10.06*** | 0.124 | 0.129 | 0.131 | |
| Mumbai | 2020 | 8.46*** | 8.78*** | 8.66*** | 0.96 | 0.105 | 0.116 |
| 2019 | 8.98*** | 9.06*** | 9.43*** | 0.106 | 0.109 | 0.123 | |
| 2018 | 9.01*** | 9.54*** | 9.72*** | 0.113 | 0.126 | 0.129 | |
| Kolkata | 2020 | 8.01*** | 8.25*** | 8.45*** | 0.092 | 0.119 | 0.106 |
| 2019 | 8.84*** | 9.23*** | 9.48*** | 0.106 | 0.132 | 0.118 | |
| 2018 | 9.43*** | 9.96*** | 10.03*** | 0.121 | 0.126 | 0.128 | |
| Chennai | 2020 | 7.58*** | 7.23*** | 7.55*** | 0.079 | 0.092 | 0.087 |
| 2019 | 7.34*** | 7.49*** | 7.45*** | 0.089 | 0.101 | 0.099 | |
| 2018 | 8.44*** | 8.91*** | 8.36*** | 0.099 | 0.102 | 0.109 | |
| India | 2020 | 8.61*** | 8.23*** | 8.01*** | 0.099 | 0.109 | 0.102 |
| 2019 | 8.31*** | 9.21*** | 9.01*** | 0.102 | 0.119 | 0.111 | |
| 2018 | 9.25*** | 9.89*** | 9.76*** | 0.11 | 0.124 | 0.129 | |
***, **, and * are the significant at the 1%, 5%, and 10% level of significance respectively
Discussion
India ranks fifth among the most polluted nations in the world and is home to the 21 most polluted cities in the world based on PM2.5 and PM10 concentrations. In the last 10 years, a number of suggestive measures across Indian cities have failed to maintain standard air quality. However, the COVID-19 pandemic has changed and significantly improved the quality of the environment and air. As a result of the tight lockdown, emissions of pollutants have been reduced by − 12% (− 8– − 16%) per day across the country by 22 March 2020, compared to the average volume of pollution in 2019, with a substantial and definitely unimaginable height. As a result, the maximum, minimum and average temperatures for May 2020 (lockdown period) decreased by 2 °C, 1 °C and 1.5 °C, respectively, compared to the previous year, i.e., 1980–2019, which therefore had a significant impact on the regional climate. However, plenty of the improvements seen during the lockdown phase in 2020 are likely to be temporary, as they do not suggest any weaknesses in the regional environment and transport policy measures. The social discomfort of restrictions and related adjustments could alter the potential course of action in complex ways, but social reactions alone, as seen here, do not motivate the significant and sustainable reductions needed to achieve an optimum level of emissions. Government initiatives to control the outbreak of COVID-19 pandemic demand for a method such as strict lockdown to manage the regional climate, specifically aimed at balancing air quality with higher well-being, a goal that has not been achieved before but now through compulsory lockdown.
Different micro- and laboratory-based studies from around the world have shown that there are significant effects of air quality on temperature and humidity as well as on micro-climate changes. Fang et al. (Fang et al. 1998) tested in the laboratory for temperature and humidity characteristics in clean air and polluted air and observed a temperature increase of 18–28 °C and a relative humidity of 30–70% in polluted air. Wallace et al. (Wallace et al. 2010) investigated the effect of air quality on the reversal of surface air temperature in the industrial city of Hamilton, Canada, and the most affected air pollutants are NO2 and PM2.5. Strefler et al. (Strefler et al. 2014) investigated the fact that the country that has already implemented air pollution policies has seen a decline in the rate of global temperature changes over the last decade. The study of the pandemic caused by COVID-19 (Le Quéré et al. 2020) showed that the significant global daily greenhouse gas emissions of CO2 decreased by − 11– − 25% in April 2020 compared to April 2019, which could reduce global temperatures.
This study reveals that the study region is well-recognized for its high level of pollution worldwide. As a consequence, the major pollution factors are excessive vehicle numbers, unplanned urbanization and sub-urban regions, and poorly maintained roads. The COVID-19 outbreak effect, strict lockdown, significantly reduces pollutant levels and improves air quality, resulting in a gradual reduction in temperature and impacts on the regional climate. For example, in metropolitan cities such as Delhi, Kolkata, Mumbai and Chennai, temperatures have dropped significantly, ultimately having a significant impact on the regional climate.
Several drivers aim to revive an even higher level of pollution relative to the policy-induced pre-COVID-19 pandemic pathways, including calls by some policy makers and companies to postpone Green New Deal projects and reduce vehicle emissions requirements and to hinder the implementation of renewable energy and supply side work. The degree to which world leaders find the net zero emission reduction targets and the demands of climate change in the preparation of their economic responses to COVID-19 are likely to have an impact on the path of emissions of pollutants in the coming decades.
Conclusion
The COVID-9 pandemic has been restricted and confined human activities to avoid the rapid spread of this deadly virus (COVID-19) in India. The pollution from commercial industries has also been decreased significantly during this time period. The impact of much-needed lockdown was analyzed by concentrating on concentrations of seven air contaminants and environment indicators from 17 February to 20 May 2020 at 223 locations in different stations throughout the nation. Among all pollutants, PM10 and PM2.5 reported the highest reduction followed by NO2, SO2, NH3 and CO. PM10 and PM2.5 concentrations decreased by approximately − 48.56% and − 57.09%, respectively, compared to the previous four years across the country. Among the four megacities, the Kolkata has noticed the record fall of PM2.5 and PM10 (− 81.25 and − 71.72%), Mumbai has witnessed the highest fall of NO2 and NH3 (− 77.56 and − 71.67%), Chennai has the highest descend of SO2 and CO (− 70.81 and − 48.31%), and the highest O3 concentration (− 15.79%) fall down in lockdown period has been observed in Kolkata megacity. The daily increases of the average temperature of March to May 2020 are more than 0.027 °C and 0.009 °C from the same period of 2018 and 2019, respectively, in India. The Sen’s Slope result of the daily temperature of four megacities in India also follows the national trend that is 0.002–0.022 °C lower increases than the period of 2018 and 2019. Daily emissions of pollutants that ultimately reduce the maximum, minimum and average temperatures for April and May 2020 (lockdown period) decreased by 2 °C, 1 °C and 1.5 °C, respectively, compared to the previous year, i.e., 1980–2019, which ultimately had a significant impact on the regional climate. In the case of four megacities in India, the same findings have been found that temperatures dropping in Delhi and Kolkata are close to 3 °C and 2.5 °C, and Mumbai and Chennai are falling by 2 °C in each. It is a clear indicator that a major change in air quality and temperature can be expected if the strict implementation of pollution management measures, such as lockdown, has been implemented in the coming years. Therefore, this type of research work can further help to understand and analyze the impact of micro-region climate in a wider sense. However, the study would also provide policy maker and other management authority to make plan for air pollution- and global warming-related issues. The study has enormous importance considering the relation of particulate matter and associated climatic parameters like temperature in lower atmosphere and its regional impact.
Compliance with ethical standards
Conflict of interest
There is no conflict of interest among the authors in this research article.
Footnotes
Janata Curfew is a curfew by the people and for the people to fight against coronavirus. To control the spread of coronavirus in India, the prime minister of India requested all the citizens make a curfew on March 22 from 7 am till 9 pm. During the Janata Curfew, people are requested to avoid public spaces and stay at home for 14 h in the view of coronavirus outbreak.
Publisher's Note
Springer Nature remains neutral with regard to jurisdictional claims in published maps and institutional affiliations.
Contributor Information
Subodh Chandra Pal, Email: geo.subodh@gmail.com.
Indrajit Chowdhuri, Email: indrajitchowdhuri@gmail.com.
Asish Saha, Email: asishsaha01@gmail.com.
Rabin Chakrabortty, Email: rabingeo8@gmail.com.
Paramita Roy, Email: paramitaroy95@gmail.com.
Manoranjan Ghosh, Email: ghoshmanoranjan.99@gmail.com.
Manisa Shit, Email: manisa.geo@gmail.com.
References
- Akpinar S, Oztop HF, Kavak Akpinar E. Evaluation of relationship between meteorological parameters and air pollutant concentrations during winter season in Elazığ, Turkey. Environmental Monitoring and Assessment. 2008;146:211–224. doi: 10.1007/s10661-007-0073-9. [DOI] [PubMed] [Google Scholar]
- Chowdhuri I, Pal SC, Saha A, Chakrabortty R, Ghosh M, Roy P. Significant decrease of lightning activities during COVID-19 lockdown period over Kolkata megacity in India. Science of the Total Environment. 2020;747:141321. doi: 10.1016/j.scitotenv.2020.141321. [DOI] [PMC free article] [PubMed] [Google Scholar]
- Da Silva RM, Santos CA, Moreira M, Corte-Real J, Silva VC, Medeiros IC. Rainfall and river flow trends using Mann-Kendall and Sen’s slope estimator statistical tests in the Cobres River basin. Natural Hazards. 2015;77:1205–1221. doi: 10.1007/s11069-015-1644-7. [DOI] [Google Scholar]
- Didenko N, Skripnuk D, Mirolyubova O. Modeling the changes in global temperature due to pollution. Int Multidiscip Sci GeoConf SGEM Surv Geol Min Ecol Manag. 2017;17:559–567. [Google Scholar]
- Djalante R. Key assessments from the IPCC special report on global warming of 1.5°C and the implications for the Sendai framework for disaster risk reduction. Prog Disaster Sci. 2019;1:100001. doi: 10.1016/j.pdisas.2019.100001. [DOI] [Google Scholar]
- Fang L, Clausen G, Fanger PO. Impact of temperature and humidity on the perception of indoor air quality. Indoor Air. 1998;8:80–90. doi: 10.1111/j.1600-0668.1998.t01-2-00003.x. [DOI] [Google Scholar]
- Figueres C, Le Quéré C, Mahindra A, Bäte O, Whiteman G, Peters G, Guan D (2018) Emissions are still rising: ramp up the cuts. Nature Publishing Group [DOI] [PubMed]
- Gilbert RO. Statistical methods for environmental pollution monitoring. New Jersy: John Wiley and Sons; 1987. [Google Scholar]
- Gupta A, Dhir A. Air quality assessment of Mandi Gobindgarh city of Punjab, India. Environment, Development and Sustainability. 2019;21:879–893. doi: 10.1007/s10668-017-0065-z. [DOI] [Google Scholar]
- Gurjar BR, Ravindra K, Nagpure AS. Air pollution trends over Indian megacities and their local-to-global implications. Atmospheric Environment. 2016;142:475–495. doi: 10.1016/j.atmosenv.2016.06.030. [DOI] [Google Scholar]
- Hu Z, Tang X, Zheng C, Guan M, Shen J. Spatial and temporal analyses of air pollutants and meteorological driving forces in Beijing–Tianjin–Hebei region, China. Environ Earth Sci. 2018;77:540. doi: 10.1007/s12665-018-7705-y. [DOI] [Google Scholar]
- Kendall M (1975) Rank correlation methods (4th edn.) charles griffin. San Francisco, CA 8
- Kumar A, Goyal P. Forecasting of daily air quality index in Delhi. Science of the Total Environment. 2011;409:5517–5523. doi: 10.1016/j.scitotenv.2011.08.069. [DOI] [PubMed] [Google Scholar]
- Le Quéré C, Jackson RB, Jones MW, Smith AJ, Abernethy S, Andrew RM, De-Gol AJ, Willis DR, Shan Y, Canadell JG (2020) Temporary reduction in daily global CO2 emissions during the COVID-19 forced confinement. Nat Clim Change pp 1–7
- Mahato S, Pal S, Ghosh KG (2020) Effect of lockdown amid COVID-19 pandemic on air quality of the megacity Delhi, India. Sci Total Environ p 139086 [DOI] [PMC free article] [PubMed]
- Mann HB (1945) Nonparametric tests against trend. Econ J Econ Soc pp 245–259
- Muhammad S, Long X, Salman M (2020) COVID-19 pandemic and environmental pollution: A blessing in disguise?. Sci Total Environ p 138820 [DOI] [PMC free article] [PubMed]
- Nussbaumer-Streit B, Mayr V, Dobrescu AI, Chapman A, Persad E, Klerings I, Wagner G, Siebert U, Christof C, Zachariah C, Gartlehner G. Quarantine alone or in combination with other public health measures to control COVID-19: a rapid review. Cochrane Database Systematic Review. 2020 doi: 10.1002/14651858.CD013574. [DOI] [PMC free article] [PubMed] [Google Scholar]
- Sharma S, Zhang M, Gao J, Zhang H, Kota SH. Effect of restricted emissions during COVID-19 on air quality in India. Science of the Total Environment. 2020;728:138878. doi: 10.1016/j.scitotenv.2020.138878. [DOI] [PMC free article] [PubMed] [Google Scholar]
- Sohrabi C, Alsafi Z, O’Neill N, Khan M, Kerwan A, Al-Jabir A, Iosifidis C, Agha R (2020) World Health Organization declares global emergency: A review of the 2019 novel coronavirus (COVID-19). Int J Surg [DOI] [PMC free article] [PubMed]
- Stips A, Macias D, Coughlan C, Garcia-Gorriz E, Liang XS. On the causal structure between CO2 and global temperature. Sci Rep. 2016;6:21691. doi: 10.1038/srep21691. [DOI] [PMC free article] [PubMed] [Google Scholar]
- Strefler J, Luderer G, Kriegler E, Meinshausen M. Can air pollutant controls change global warming? Environmental Science & Policy. 2014;41:33–43. doi: 10.1016/j.envsci.2014.04.009. [DOI] [Google Scholar]
- Summary for Policymakers—Global Warming of 1.5 °C, n.d. URL https://www.ipcc.ch/sr15/chapter/spm/ (accessed 5.31.20)
- Wallace J, Corr D, Kanaroglou P. Topographic and spatial impacts of temperature inversions on air quality using mobile air pollution surveys. Science of the Total Environment. 2010;408:5086–5096. doi: 10.1016/j.scitotenv.2010.06.020. [DOI] [PubMed] [Google Scholar]
- Yunus AP, Masago Y, Hijioka Y (2020) COVID-19 and surface water quality: Improved lake water quality during the lockdown. Sci Total Environ p 139012 [DOI] [PMC free article] [PubMed]
Associated Data
This section collects any data citations, data availability statements, or supplementary materials included in this article.
Data Availability Statement
The major pollutants data such as PM2.5, PM10, NO2, NH3, SO2, CO and O3 are available at https://app.cpcbccr.com/AQI_India/, https://safar.tropmet.res.in/index.php, and https://app.cpcbccr.com/ccr/. The daily maximum, minimum and average temperature data are available at https://www.iari.res.in/. Monthly temperature data for the month of May during the period of 1980–2019 are available at https://www.indiawaterportal.org/.