Abstract
Aortic aneurysms are inherently unpredictable. One can never be sure whether any given aneurysm may rupture or dissect. Clinically, the criteria for surgical intervention are based on size and growth rate, but it remains difficult to identify a high-risk aneurysm, which may require intervention before the cutoff criteria, versus an aneurysm than can be treated safely by more conservative measures. In this work, we created a computational microstructural model of a medial lamellar unit (MLU) incorporating (1) growth and remodeling laws applied directly to discrete, individual fibers, (2) separate but interacting fiber networks for collagen, elastin, and smooth muscle, (3) active and passive smooth-muscle cell mechanics, and (4) failure mechanics for all three fiber types. The MLU model was then used to study different pathologies and microstructural anomalies that may play a role in vascular growth and failure. Our model recapitulated many aspects of arterial remodeling under hypertension with no underlying genetic syndrome including remodeling dynamics, tissue mechanics, and failure. Syndromic effects (smooth muscle cell (SMC) dysfunction or elastin fragmentation) drastically changed the simulated remodeling process, tissue behavior, and tissue strength. Different underlying pathologies were able to produce similarly dilatated vessels with different failure properties, providing a partial explanation for the imperfect nature of aneurysm size as a predictor of outcome.
Introduction
Aortic aneurysm, or dilatation of the aorta, is a clinically significant pathology as the risk of potentially fatal rupture (through-thickness failure) or dissection (delamination of the layers) is high. In fact, aortic aneurysm and dissection is the fifteenth leading cause of death in the U.S. [1], with just under 10,000 deaths occurring in 2017 [2]. The current diagnostic methods for assessing aneurysm risk are based primarily on dilatation size and growth rate [1]. These criteria, while shown to correlate with aneurysm risk, are not always appropriate, especially for rare disorders involving genetic anomalies (i.e., familial thoracic aortic aneurism, Marfan syndrome, Loeys-Dietz syndrome, or vascular Ehlers-Danlos syndrome), where population sizes are small and disease severity can vary widely. Thus, it is critical that we understand the underlying pathology that makes one aneurysm different from another, and what properties might point to these differences.
The aorta is a complex, three-dimensional vessel consisting of many interacting constituents [3] that are arranged in a distinct hierarchical structure of three layers [4]. The largest and most structurally important layer is the middle layer or media. It consists of repeated layers of vascular smooth muscle cells (vSMCs) and extracellular matrix (ECM), primarily type-I collagen and elastin, formed into relatively planar layers radiating outward from the lumen of the vessel (Fig. 1). This repeated structure of vSMCs and ECM is known as the medial lamellar unit (MLU), as shown in Fig. 1. The media consist of ∼5–10 MLU layers in rodents and ∼50–60 in humans [5]. We focus on the MLU because it is biologically active and serves a major role in the remodeling process. The main structural components of the MLU are collagen, elastin, and vSMCs. The roles of these different components in aortic mechanics have been well studied [6–12]. Viewed simply, collagen is primarily responsible for strengthening the aorta, and giving the aorta its nonlinear “lockout” behavior, while elastin is known to give the aorta its elasticity. These two fibrillar ECM proteins are entirely passive, whereas vSMCs are active, dynamically adjusting tensile behavior to maintain basal tone and synthesizing protein precursors and proteases that remodel the ECM.
Fig. 1.
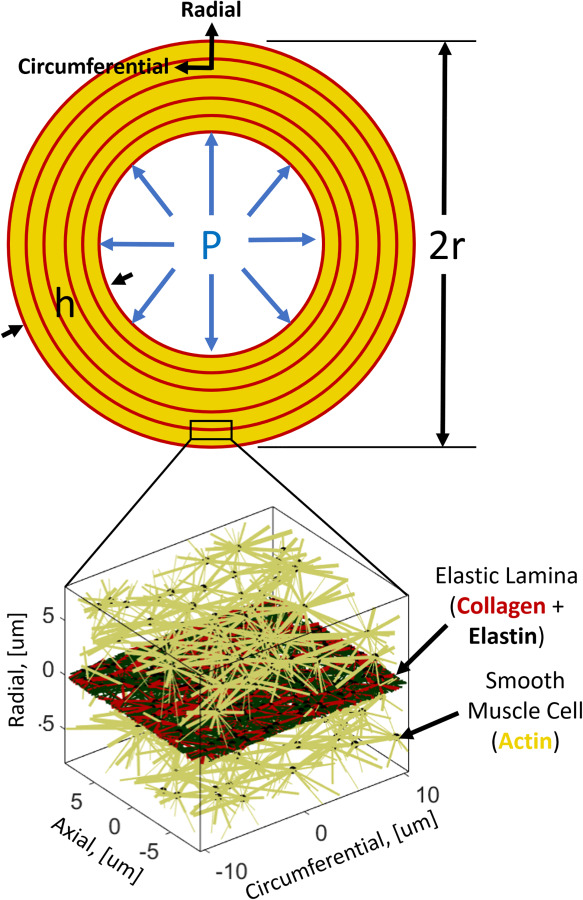
Aortic vessel geometry and repeated medial lamellar unit
The aorta is constantly being remodeled in response to biological, chemical, and mechanical factors. Collagen is regularly turned over in normal tissue maintenance with a half-life of –60 days in the aorta [10]. It has been posited that collagen remodels to maintain a homeostatic stress state [13]. This hypothesis is supported by experiments showing strain-related protection of loaded collagen fibers against breakdown [14]. Elastin, on the other hand, is a biologically stable substance, with a half-life on the order of years [15]. It is generally thought to remain relatively unchanged in terms of overall content, but, over timescales on the order of decades, becomes increasingly disrupted and fragmented [7]. The active adjustment of basal tone by vSMCs in response to vessel loading (based on mean arterial pressure and the dynamics of blood flow) happens on the order of seconds to minutes, while the overall growth patterns of cells tend to be on the order of a few days [16,17]. The aortic vSMCs are able to transition from a contractile to a synthetic phenotype under different conditions, balancing their relative contribution to load bearing with their role in remodeling the ECM.
Two main associations with aortic aneurysm are (1) elastin network disorganization and fragmentation [18] and (2) disruption of vSMCs from normal contractile function (with increases in vSMC apoptosis) [19]. Diseases that coincide with elastin disorganization and fragmentation show increased aortic growth and a propensity toward aneurysm [1,20]. These observations show that the architecture of biological tissues is complex, and the network structures within the MLU are highly plastic [12,13,21–26]. While many computational and theoretical models have explored growth and remodeling in various systems, most have employed a continuum framework [27,28]. Expanded efforts in the field have sought to apply these methods to increasingly complex physics and realistic geometries [29–34], but little has been studied in terms of the discrete nature of fiber remodeling. In other words, it remains unclear what effect the remodeling of individual fibers and interactions between fibrous constituents may play in tissue-scale growth and remodeling.
Methods
We propose a novel model of tissue growth applied to a discrete microstructural representative volume element (RVE) in the form of an aortic MLU. The MLU consists of a cellular stress-fiber (actin) network analog representing SMCs and a planar layer of collagen and elastin representing the elastic lamina as shown in Fig. 1. It is worth noting that what we call actin fibers are representative of the mechanical contributions of intermediate filaments, microtubules, actin filaments, and myosin motors combined. The application of this discrete model of growth, remodeling, and failure unites the disparate models of growth and failure and allows us to look at how different pathologies, regardless of gross dimensions, may be prone to failure. The model is shown schematically in Fig. 2, and each part of the process is described in this section below.
Fig. 2.
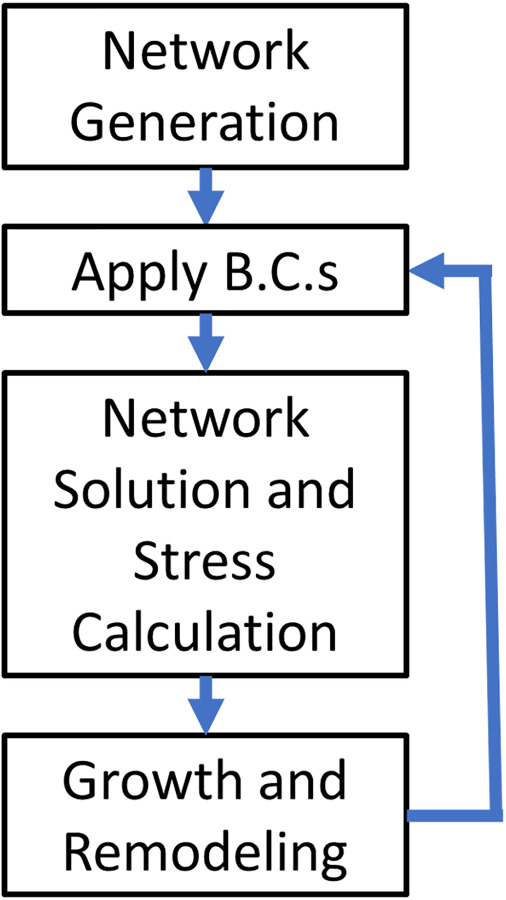
Computational model flowchart
Network Generation.
The selection of an appropriate network type for biological tissues is not a trivial task (as evidenced by Ref. [35]). In this model, we chose to use Delaunay networks because of their high degree of mechanical stability. Briefly, a 3D periodic Delaunay network is generated on 100 random nodes in our RVE to serve as our cellular stress-fiber (actin) network. All actin fiber bundles were prescribed an initial radius of 80 nm. To create our embedded elastin network, we generate a second periodic Delaunay network on 250 random nodes in our RVE and flatten the resulting network into the circumferential-axial plane. Elastin fibrils were all prescribed a radius of 240 nm [36]. To generate a collagen network, we perform a 2D tessellation of the planar elastin network nodes. All collagen fibrils were prescribed an initial radius of 80 nm. After the networks are generated, actin network fibers that cross the collagen/elastin lamina layer are connected to the collagen/elastin network node nearest to the point where they cross. This process approximates an integrin-like connection between the vSMCs and the ECM. An example of a typical network is shown above in Fig. 1.
Boundary Conditions.
The boundary stress values applied to the MLU were chosen using the Law of Laplace for normal (100 mmHg) or hypertensive (150 mmHg) mean aortic blood pressures and are summarized in Eqs. (1.1)–(1.3). Initial, undeformed dimensions for vessel radius and wall thickness were chosen to mimic the rat aortic wall [37]. The three-dimensional stresses are prescribed as
| (1.1) |
| (1.2) |
| (1.3) |
where is the circumferential stress, is the mean arterial pressure, is the deformed centerline (midwall) radius, is the circumferential stretch, and is the initial vessel centerline radius, where is the deformed wall thickness, is the stretch in thickness (radial direction), and is the initial wall thickness, is the axial stress, and is the radial stress.
Wall shear stress at the luminal surface of the vessel was calculated using a nominal flow rate of and a blood viscosity of 3 cP [38]. The Poiseuille formula for steady, Newtonian fluid flow, given in Eq. (2), was used to determine an average wall shear stress
| (2) |
where is the wall shear stress, is the kinematic viscosity, is the flow rate, and is the deformed luminal radius.
Network Solution and Stress Calculation.
The main constituents of mechanical interest in this model are actin-like cellular stress-fibers, collagen, and elastin. Cellular actin fibers were treated as active components with a characteristic time scale much shorter than the timescale of remodeling. We therefore represent the actin as having two behaviors: a passive bilinear elastic response and an instantaneous active contraction the magnitude of which is driven by wall shear stress (WSS) as given in Eqs. (3.1)–(3.3)
| (3.1) |
| (3.2) |
| (3.3) |
where is the active response function based on the stretch, , and and are the stretches of maximum and minimum contraction, respectively, is the magnitude of contraction based on WSS , and are scaling parameters for contraction and WSS, respectively, and is the active contractile stress in the fiber. The upper lines (gold) in Fig. 3 show actin fiber mechanics for both active (dotted line) and passive (dashed line) behaviors.
Fig. 3.
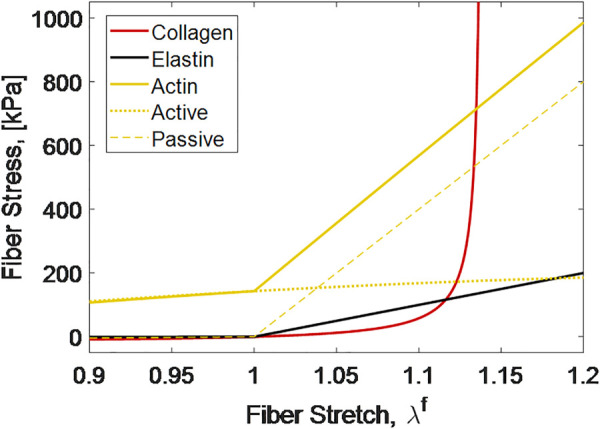
Mechanical behavior of fiber constituents
It is well known that collagen tends to take on a crimped conformation which results in a stress–strain behavior consisting of a large toe region followed by a steep lockout. In our model system, we utilize a helical fiber model [39], with parameters fit to single fiber data from Ref. [12]. The model is shown by the nonlinear line (red) in Fig. 3. Elastin, as the main elastic element, was modeled as a bilinear elastic spring as shown by the lower linear line (black) in Fig. 3. All material parameters used in these models are given in Table 1. Because fibers buckle when compressed, actin and elastin fibers were prescribed a compressive modulus of 1/100 of the tensile modulus in Table 1.
Table 1.
Constituent models and parameters
We model the volumetric mechanics of the cell due to the existence of charged fibrous proteins following Ref. [45], but scaling the fixed charge density with actin fraction. The overall swelling pressure has two important consequences: first, as the network is compressed, the pressure is increased; and second, as the actin network becomes more dense, through the addition of fiber, the swelling pressure increases driving growth of the MLU. The osmotic pressure is given by Eqs. (4.1) and (4.2)
| (4.1) |
| (4.2) |
where is the tissue fixed charge density, is a fixed charge density scaling parameter, is the actin volume fraction, is the extracellular osmolarity, is the swelling pressure, is the universal gas constant, and is the absolute tissue temperature. We note here that the swelling pressure model allows the network to grow over time (i.e., incompressibility is not enforced in the time domain). The swelling pressure does limit compressibility to ( for the strip biaxial extension test and ( for the shear test prior to failure discussed in the “Material Property Calculation and Failure Simulations” section below. The compressibility in the strip biaxial test is within the range experimentally measured in Ref. [46], while, to our knowledge, the compressibility of arterial tissue in shear has not been experimentally measured.
We use volume-averaging theory to convert fiber forces in the equilibrated MLU to tissue stress. The physical dimension of the RVE is calculated via a scaling parameter, , given in Eq. (5) [47,48]
| (5) |
where is the RVE scaling parameter is the length of fiber in computational units, is the cross-sectional area of fiber , is the fiber volume fraction, and is the RVE volume in computational units cubed. In Eq. (5), and are both in computational units, whereas is in physical dimensions. Thus, has units of physical length per computational length. It should also be noted that is considered a constant in our simulations and is simply used to relate computational dimensions of length (for the RVE and fibers) to physical dimensions.
Using the scaling parameter and summing the forces for all fibers, we calculate the volume averaged stress that our RVE experiences as shown in Eq. (6)
| (6) |
where is the tissue stress, is the RVE scaling parameter, is the computational RVE volume, is the fiber stress, is the fiber volume, is the fiber length, is the fiber cross-sectional area, is the fiber force magnitude, and is the fiber unit vector. We note that the value set in parentheses for Eq. (6) has units of force per computational unit squared. Thus, we need to scale the stress to real physical dimensions using the scaling parameter.
The Newton–Raphson algorithm is used to find the principal stretches that give us the correct prescribed boundary loads from Eq. (1). A second Newton–Raphson loop is used inside the first to compute the position of each node in the network at static equilibrium given a deformation.
Implementation and Solution Convergence.
The model was implemented in a custom C++ code using the Eigen library [49]. This code is available from a public Github repository.2 Convergence of the internal force balance is considered achieved when the residual force norm is less than an absolute threshold of or a relative threshold of compared to the affine deformation nodal residual for the current stretch step. Convergence of the stress boundary problem is considered achieved if the absolute magnitude of stress error is less than 100 Pa or the relative stress error is less than 0.1% of the maximum applied boundary stress.
Growth and Remodeling Dynamics.
The dynamics of growth and remodeling (G&R) are handled similarly to Ref. [30], but applied to fibers rather than to the tissue as a whole. Fibrils remodel to reach a predetermined target stress. To reach a specified target stress, fibrils grow radially (effectively adding mass and intermolecular crosslinks). The equation guiding this growth is given in Eq. (7)
| (7) |
where ( is the time rate of change of the fiber radius, is the polymerization time constant, is the fiber radius, is the fiber stress, and is the fiber target stress. The polymerization time constants, , are taken to be 4.5 days for actin [17], and 90 days for collagen. Elastin was not allowed to remodel due to its stability in the aorta. The homeostatic fiber stresses were taken to be 750 kPa for actin and 200 kPa for collagen. More information about how target stresses were selected is provided in the Supplemental Material on the ASME Digital Collection.
The lengthening of fibrils is governed by the assumption that the addition of molecules to the radius of the fibril can be reasonably described as adding a new parallel spring as in Ref. [50]. An overall force balance along with algebraic manipulation gives the following relation for the new rest length of the fiber:
| (8) |
where is the new rest length of the fiber, is the pre-existing fiber radius, is the modulus ratio of the new fiber in compression to the pre-existing fiber in tension, is the deposited fiber radius, is the fiber stretch at the time of deposition, and is the pre-existing fiber length when the new fiber was deposited. The ratio of the pre-existing fiber tensile modulus to the new fiber compressive modulus is taken to be 1.0.
In this simulation framework, we can decouple the RVE loaded state from the zero-stress state as
where is the current deformation gradient for the current loaded network relative to the unloaded network at time t = 0, is the zero-stress network deformation gradient from the unloaded time t = 0 network to the unloaded network at the current time, and is the elastic deformation gradient for the network from the current time unloaded network to the current time loaded network. The decoupling of growth and elastic stretch is accomplished by simply running the network through a prescribed zero-stress boundary condition model at every time-step where we already know the loaded total stretch for the network. We can then calculate the elastic deformation as .
Fiber growth and the time evolution of the tissue are modeled using a forward-Euler scheme with variable step size.
Material Property Calculation and Failure Simulations.
Since tissue failure—either by rupture or dissection—is the major clinical threat associated with pathological vessel growth, we looked at two failure scenarios for the MLUs: a strip biaxial and a shear to failure. Each failure scenario treated the test as a passive failure test (as in experiments [51–57]) so the actin contractility was removed. The strip biaxial test was meant to serve as an analog for the burst failure of the artery. In the biaxial test, the MLU axial stretch was set to 1.4, and the MLU was stretched to failure in the circumferential direction. The thickness direction was prescribed as zero stress. Properties of small-strain modulus, transition strain, and large-strain (lockout) modulus were calculated prior to failure. The small-strain modulus is defined as the slope between zero and 50 kPa circumferential stress, and the large strain modulus defined as the slope between 200 and 400 kPa circumferential stress. The transition strain is defined as the strain where the small-strain line and the lockout modulus line intersect. Rupture failure was defined as the point on the stress–strain curve immediately preceding a drop in stress greater than 50 kPa.
The shear test, in contrast, served as an analog for the dissection failure of the artery. For the shear test, the axial and circumferential stretches were set to 1.4 and 1.6, respectively. The radial direction was prescribed zero stress. The shear was imposed as a circumferential displacement on the radial face. The shear modulus was defined as the slope of the shear stress versus shear strain curve prior to failure. In each failure scenario, the strain step was adjusted dynamically so that failure occurred in fewer than 15 of the over 3000 total fibers on any given stretch step to maximize the accuracy of the measured bulk failure stress and strain. Dissection failure was defined as the point on the shear-stress versus strain curve immediately preceding the first drop in stress.
Experimental Design.
The first set of cases we explore consider a vessel subjected to a 50% increase in mean blood pressure. This case has been described extensively in experiments from a gross morphological standpoint [58], from a histological standpoint [59,60], and from a mechanical standpoint [25,61,62]. Furthermore, this case is often used as a validation test for growth and remodeling simulation [30,38,63].
The second set of cases we explore are the remodeling of vessels in response to pathological conditions under normotensive blood pressure. As discussed above, two especially common associations with aortic aneurysm are elastin fragmentation [18] and smooth muscle cell dysfunction [1,64,65]. In an attempt to understand these two scenarios, we remodeled our generated networks under normotensive conditions then applied one or both of two perturbations: (1) an instantaneous reduction in elastin (by randomly removing fibers) and/or (2) an instantaneous reduction in smooth muscle cell contractility (by decreasing the parameter, in Eq. (3.2)). The cases that were investigated are summarized in Table 2.
Table 2.
Pathological remodeling cases summarized in results
| vSMC contractility | ||||
|---|---|---|---|---|
| 100% of normal | 25% of normal | 0% of normal | ||
| Elastin fiber removal | 0% removal | Baseline | X | – |
| 20% removal | – | X | X | |
| 25% removal | – | X | – | |
| 30% removal | X | X | – | |
Tested cases are denoted with an X.
Statistics.
For each scenario outlined above, we used eight networks generated using the same routine listed in Network Generation. All plots with error bars show mean ± 95% confidence interval on the mean. Comparisons were performed using paired t-tests with significance established at two levels: p < 0.05 and p < 0.005.
Results
Investigation of the Normotensive and Hypertensive Aorta.
The first step in verifying the model was to apply it to a well-studied remodeling case. The standard case is that of a pressure overload where one would expect an initial spike in stress followed by re-equilibration to a new, lower stress state due to growth of the tissue. The expected behavior is seen clearly in the total stress line of Fig. 4(a), which rises sharply with the introduction of the pressure overload, but then decays to a value close to the initial level. Examining the individual component contributions to the total stress in Fig. 4(a), one can see that the load has been shifted from the elastin to the actin during the remodeling process, with the collagen contribution largely returning to its original level. We emphasize that the component's contribution to the overall stress should not be confused with the stress within a component fiber, since the former is a combined effect due to the sum of stresses for each individual component and the volume fraction of that component within the tissue. This effect can be understood by examining the tissue volume fractions in Fig. 4(c), starting with two key observations:
Fig. 4.
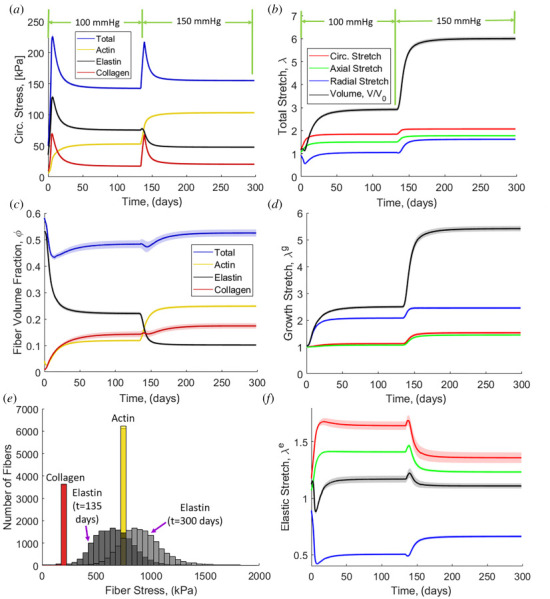
(a) Circumferential stress evolution with normal blood pressure (100 mmHg) and hypertension (150 mmHg). (b) Overall tissue stretch evolution. (c) Fiber volume fraction evolution. (d) Growth contribution of stretch evolution. (e) Histogram of fiber stresses for each fiber type at t = 135 days and t = 300 days. (f) Elastic contribution of stretch evolution. Solid lines are means and the shaded region is 95% confidence interval for N = 8.
The total volume fraction of all protein increases slightly, but the volume fraction of actin increases considerably. Thus, the actin contribution to the total stress increases naturally due to the greater actin volume fraction.
The elastin volume fraction drops considerably. Since elastin does not remodel, this drop is entirely due to an increase in tissue volume (discussed further in Figs. 4(b), 4(d), and 4(f)). Thus, the elastin contribution to the total stress drops even though the stress on any given fiber increases because the fiber forces are distributed over a much larger area. In contrast, the volume fractions of both collagen and actin increase because remodeling outpaces tissue volume growth.
The effect of remodeling can be seen even more clearly in Fig. 4(e), in which the stress for each fiber is shown before and after remodeling. Due to their ability to remodel, the collagen and actin fibers return to the same homeostatic stress levels after remodeling. In contrast, the elastin fibers must stretch more in response to tissue growth and, therefore, go to a higher stress state after remodeling. Thus, based on Figs. 4(a), 4(c), and 4(e) we conclude the mechanism underlying the remodeling involves a greater portion of load being borne by the actin (i.e., by the smooth muscle), but a higher local fiber stress generated in the elastin.
Turning to the kinematics of tissue growth and remodeling in this base case, there is a substantial increase in tissue volume with increased length in all three directions (Fig. 4(b)). The volume change is driven primarily by tissue growth (Fig. 4(d)), as the total volume change due to elastic deformation remains relatively unchanged (Fig. 4(f)), indicating the tissue in nearly incompressible. The tissue grows in all three directions (Fig. 4(d)), with the transverse growth driven by the osmotic effect due to increased actin content described in Eq. (4.2). Importantly, the elastic stretch of the tissue in the directions of loading (i.e., circumferential and axial) decreases over time because fibers grow thicker (Fig. 6(b)) leading to increased force developed for a given strain. The transverse direction of elastic stretch is increased due to the same osmotic effect discussed earlier.
Fig. 6.
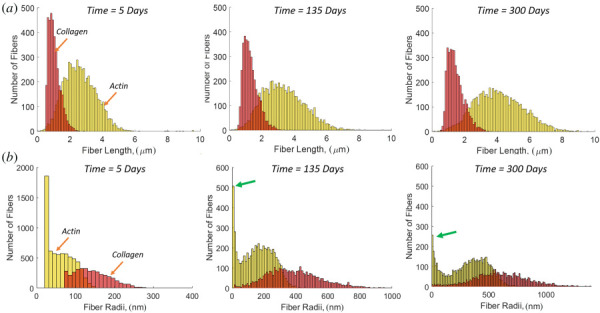
Pooled histograms of all fibers in all networks (N = 8) for (a) fiber length evolution of actin and collagen. (b) Fiber radius evolution of actin and collagen. The arrows (green) show the actin fiber peak at small radii.
The growth and thickening of the simulated vessel wall can be seen in snapshot in Fig. 5, which shows the vessel at three different stages in the growth and remodeling process in both unloaded (0 mmHg luminal pressure) and loaded (100 mmHg or 150 mmHg luminal pressure) states. The vessel growth is evident in the unloaded-state images of the whole vessel and in the networks themselves. The actin density increase is also evident from these network snapshots.
Fig. 5.
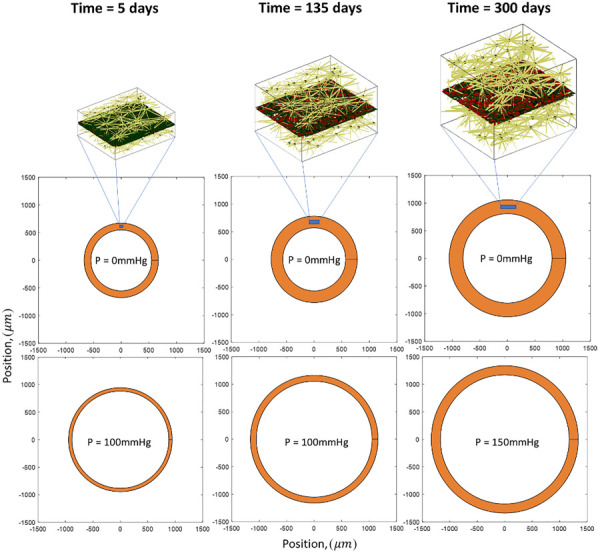
Representative arterial networks and overall size during the remodeling process showing 3D network actin (gold), planar collagen (red), and planar elastin (black)
A distinct feature of this discrete-fiber remodeling framework is that we can monitor individual fiber changes. In Fig. 6, we show fiber length and fiber radius for collagen and actin as these fiber types grow during remodeling. The collagen fibers tend to maintain a shorter length than the actin fibers, and each has a unimodal distribution (Fig. 6(a)). The fiber radii (Fig. 6(b)) shows that the collagen fibers tend to grow much thicker in response to loading with a unimodal distribution. In contrast, the actin fiber radius is bimodal. It is noted that the fibers that go to zero radius have been removed, and the peak on the low end (shown by arrows) represents a stable population of fibers with radii in the range of 2–25 nm. Examining the network itself (Fig. 7), we see that the peak in the distribution at small radius corresponds to interlamellar fibers connecting the cell to the ECM, and connecting the adjacent lamellae to one another. The large radius peak corresponds to fibers falling roughly into the circumferential-axial plane. These two families are interlamellar fibers that resist osmotic pressure and relatively planar fibers that resist the hoop and axial stresses. The alignment of laminar elastin and collagen followed the direction of loading with little discernible change from normotensive to hypertensive cases (see Fig. 1 available in the Supplemental Materials on the ASME Digital Collection).
Fig. 7.
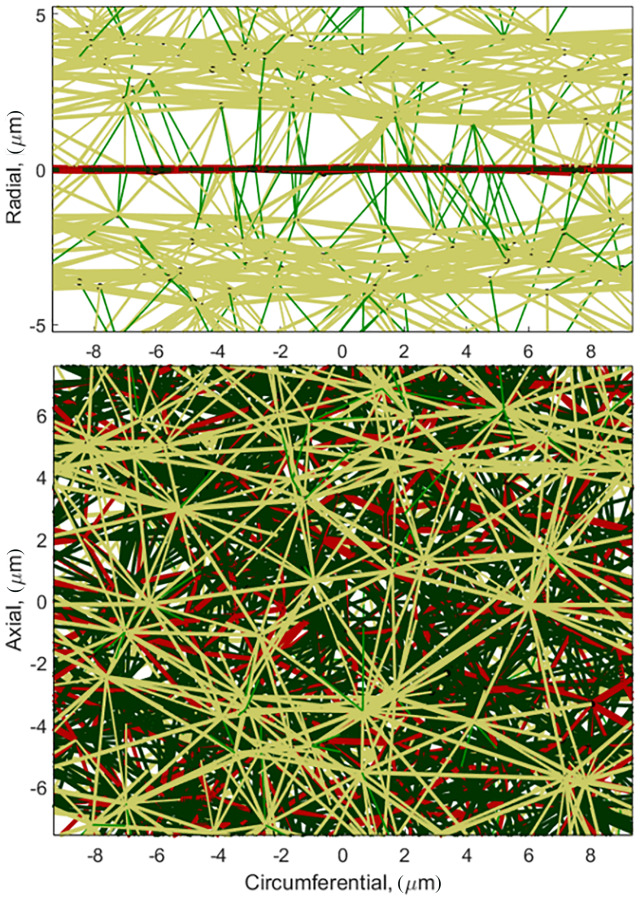
Homeostatic hypertensive MLU showing small diameter(r < 25 μm) radial actin fibers (green), large diameter actinfibers(r > 25 μm) (gold), planar collagen (red), and planar elastin (black)
Another distinct advantage of a model system using discrete fibers is that we can perform failure simulations and track failed fibers (as performed previously for nonremodeled systems by Refs. [51] and [66]). An example of a strip biaxial pull to failure test is shown in Fig. 8(a). The region of failure initiation is highlighted by the dashed oval. In strip biaxial testing, failure initiates in the collagen/elastin lamina layer. In shear to failure (Fig. 8(b)), in contrast, failure initiates as the actin fibers disconnect from the elastic lamina causing delamination of the MLU. Additionally, shear failure occur at a much lower stress, consistent with experimental observations [52]. It should be noted that failures are simplified in that they occur within fibers and not at connections.
Fig. 8.
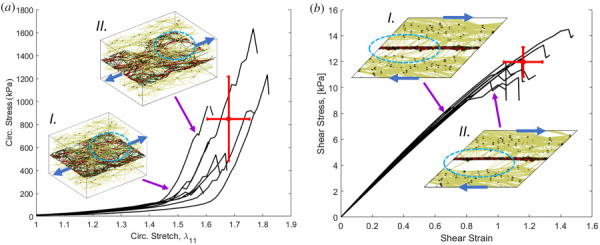
Representative failure curves (black lines) and networks before (I) and after (II) failure for (a). circumferential failureand (b) shear failure. The dot shows the mean failure behavior and the cross shows the 95% confidence interval. The blue arrows on the networks show the direction of loading, and the dashed ovals show tear formation in (a), and delamination in (b).
The failure simulations of Fig. 8 allow us to quantify the material behavior and failure characteristics for both planar and shear deformations as shown in Fig. 9. The 50% blood pressure overload resulted in a significantly higher small-strain modulus and shear modulus. There was also a statistically significant decrease in the transition strain for the pressure overload case. Taken together, these properties indicate that the tissue stiffness increased as a result of increased mean arterial pressure. In addition, we see statistically significant increases in the stress at rupture and the stress at dissection indicating that the material has remodeled to become stronger in both failure modes.
Fig. 9.
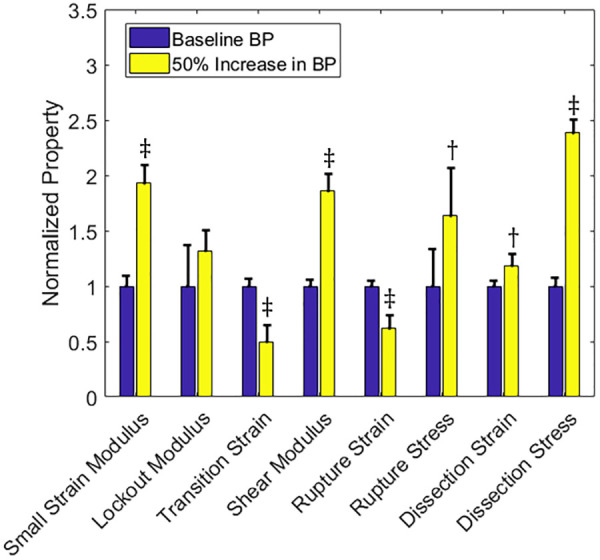
Material and failure properties for baseline normal blood pressure (left-hand bar, blue) and a 50% increase in baseline blood pressure (right-hand bar, yellow). Solid bars are means and the error bars are 95% confidence interval for N = 8. The symbol represents p < 0.05 and the symbol represents p < 0.005 relative to the baseline vessel.
Investigation of Elastin Fragmentation and Smooth Muscle Cell Dysfunction
Growth Dynamics.
Simulations used to investigate the independent and coupled roles of elastin fragmentation and smooth muscle cell dysfunction are outlined in Table 2 above. We summarize the results in Fig. 10 for reduction of smooth muscle contractility alone (first column), removal of elastin alone (second column), and combined reduction of contractility and removal of elastin (third column). We define the healthy state as the state immediately before initiation of the insult (i.e., reduction of contractility and/or removal of elastin) at t = 135 days (shown by the arrows in Fig. 10). The circumferential stress for decreased contractility alone (Fig. 10(a)) shows an instantaneous reduction in actin stress due to the loss of contractility. The resulting reduction in the total circumferential stress in the tissue is gradually regained as collagen and actin remodel. The homeostatic stress state after remodeling is negligibly different than the healthy stress. The circumferential stress for removed elastin fibers (Fig. 10(b)), however, shows an instantaneous drop in elastin stress but a rise in total stress because the instantaneous loss of elastin makes the vessel more distensible increasing the tissue stress based on the Law of Laplace. The resulting load on collagen is then redistributed over time onto actin, resulting in increases in both collagen and actin stress at the new, lower total homeostatic stress level compared to the healthy stress. The circumferential stress response for the combination of reduced contractility and removed elastin (Fig. 10(c)) shows the load from elastin loss redistributes to collagen and actin, with less load borne by the actin compared to the elastin removal alone (Fig. 10(b)). The result is a homeostatic stress after remodeling below the healthy stress. This counterintuitive result is explained by the fact that the load previously held by elastin is redistributed to collagen and actin. The increase in actin load results in more actin creation, which leads to increased osmotic pressure and more transverse growth. This growth makes the thickness of the tissue larger, so the stress decreases per Eq. (1).
Fig. 10.
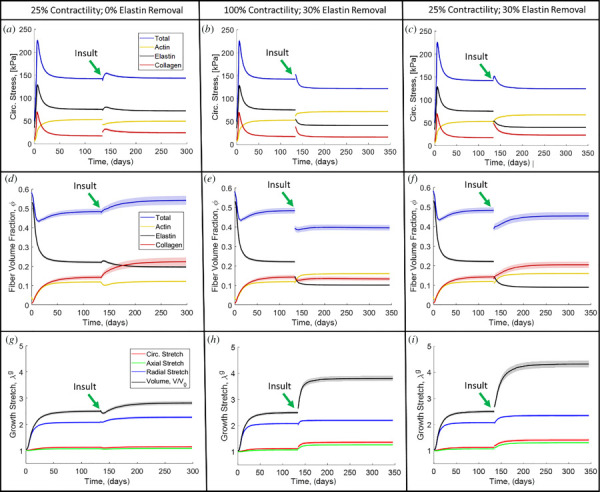
(a) Circumferential stress evolution for contractility reduced to 25% of normal with no elastin removal. (b) Circumferential stress evolution for normal contractility with 30% elastin removal. (c) Circumferential stress evolution for contractility reduced to 25% of normal with 30% elastin removal. (d) Fiber volume fraction evolution for contractility reduced to 25% of normal with no elastin removal. (e) Fiber volume fraction evolution for normal contractility with 30% elastin removal. (f) Fiber volume fraction for contractility reduced to 25% of normal with 30% elastin removal. (g) MLU growth for contractility reduced to 25% of normal with no elastin removal. (h) MLU growth for normal contractility with 30% elastin removal. (i) MLU growth for contractility reduced to 25% of normal with 30% elastin removal. Solid lines are means and the shaded region is 95% confidence interval for N = 8.
The fiber volume fraction evolution shows that for actin contractility disruption (Fig. 10(d)), load is primarily redistributed to collagen, which results in increased collagen content. Overall, the total fiber volume fraction increases in this case relative to the healthy level. When elastin is removed (Fig. 10(e)), the resultant load is redistributed to both collagen and actin resulting in increases in volume fraction of each. The actin and collagen are both stiffer than the elastin, so they add less volume to pick up an equivalent load from the removed elastin; thus, the total fiber volume fraction is decreased relative to the healthy level. In the case of combined actin contractility disruption and elastin fiber removal (Fig. 10(f)), we again see the disruption of actin contractility driving growth of collagen with total fiber volume recovering more than in the case of removed elastin alone (Fig. 10(e)). We see relatively little change in overall fiber orientation over the baseline case with changes in elastin or vSMCs (see Fig. 1 available in the Supplemental Materials on the ASME Digital Collection).
There is lower total growth for actin disruption alone (Fig. 10(g)) compared to elastin removal alone (Fig. 10(h)). However, the combination of reduced contractility and removed elastin (Fig. 10(i)) results in higher volumetric growth than either alone.
Material and Failure Properties.
Figure 11(a) shows the material properties for cases of removed elastin and reduced contractility to the normal baseline networks. Removal of elastin results in a higher small-strain modulus, lower transition strain, and higher shear modulus, but little change to the lockout modulus. In contrast, the reduction of vSMC contractility results in a lower small-strain modulus, higher lockout modulus, higher transition strain, and lower shear modulus. Failure properties were also examined for these cases (Fig. 11(b)). Removal of elastin results in lower rupture strain and stress, a higher dissection stress, but little change in dissection strain. Reduction in contractility of the vSMCs shows increased rupture strain and stress. The reduced contractility cases also show increased dissection strain with little change in dissection stress.
Fig. 11.
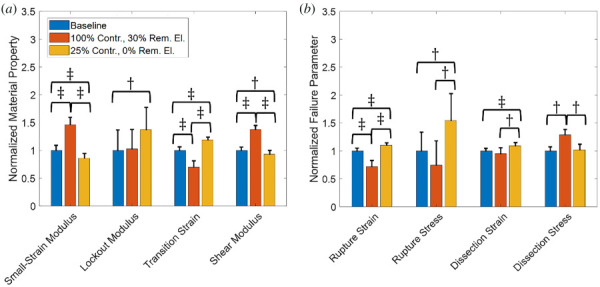
(a) Normalized material properties and (b) Normalized failure properties for baseline (blue), normal (100%) contractility with 30% removed elastin (orange), and 25% of normal contractility with normal elastin (0% removed) (gold). Solid bars are means and the error bars are 95% confidence interval for N = 8. The symbol represents p < 0.05 and the symbol represents p < 0.005.
Comparison of Morphologically Similar Dilated Vessels.
After observing the behavioral differences in Figs. 10 and 11, we generated morphologically similar dilated vessels based on inner luminal dimensions, and a standard clinical metric was measured using computed tomography, magnetic resonance angiography, or ultrasound. It has been shown that interobserver error in measurement and measurements taken between different modalities can have high variability [67,68]. Based on the reported variability in clinical measurement, we set our cutoff for similar pathological vessel sizes at ±4% of the mean of pathological cases (excluding the 30% removed elastin alone case and the 25% contractility alone case). The luminal size for all cases is shown in Fig. 12. The mean is given by the solid line, and the ±4% limit is shown by the shaded box.
Fig. 12.
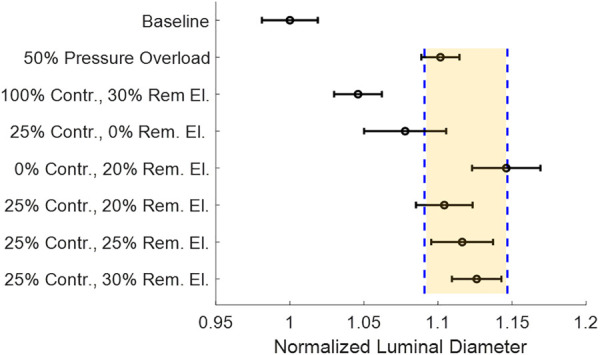
Normalized homeostatic luminal diameter at load for all tested cases. The highlighted cases are within ±2.5% (dashed lines) of the mean for pathological growth cases. Circles are means and the error bars are the 95% confidence interval for N = 8.
Since the standard diagnostic criteria for a risky aneurysm are based on size and a growth rate evaluated in, typically, six month intervals [69], we compared the mechanical behavior and failure properties of vessels of similar lumen diameter and growth rate. The trends in material properties are shown in Fig. 13(a). The combined effect of a reduction of contractility and removal of elastin is an increase in small-strain modulus, increase in lockout modulus, decrease in transition strain, and increase in shear modulus. The effect of changing contractility while keeping the elastin removal the same (bar 3 (gold) versus bar 4 (purple)) shows that decreased contractility decreases small-strain modulus, increases lockout modulus, and increases transition strain with little change in shear modulus. The effect of increased elastin removal while maintaining contractility (bar 4 (purple) versus bar 5 (green) versus bar 6 (light blue)) shows increases in small-strain modulus, lockout modulus, and transition strain with negligible change in shear modulus.
Fig. 13.
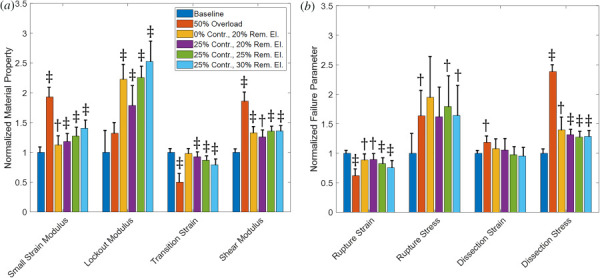
(a) Mechanical properties of baseline and pathological vessels. (b) Failure properties of baseline and pathological vessels. Solid bars are means and the error bars are 95% confidence interval for N = 8. The symbol represents p < 0.05 and the symbol represents p < 0.005 relative to the baseline vessel.
The failure properties for the comparison of pathological cases are shown in Fig. 13(b). The combined effect of reduced contractility and removed elastin decreases rupture strain, but increases rupture stress. There is little change in dissection strain but a significant increase in shear stress at dissection. The role of increased contractility while keeping the elastin removal the same (bar 3 (gold) versus bar 4 (purple)) shows that decreased contractility has little effect on any failure parameters. The effect of increased elastin removal while maintaining contractility (bar 4 (purple) versus bar 5 (green) versus bar 6 (light blue)) shows increases in strain at rupture with little change in any other failure properties.
Overall variability comparing one pathological vessel to another is summarized in Table 3. The data suggest that vessel behavior and strength are highly dependent on underlying pathologies, and that small perturbations or variations in the underlying pathologies can cause significant changes to underlying material and failure properties for similarly dilated vessels.
Table 3.
Comparison of intersample pathological vessel differences showing properties with p < 0.05
| % of normal contractility/% removed elastin | ||||||
|---|---|---|---|---|---|---|
| Overload | 0%/20% | 25%/20% | 25%/25% | 25%/30% | ||
| % of Normal contractility/ % removed elastin | Overload | |||||
| 0%/20% | ||||||
| 25%/20% | – | |||||
| 25%/25% | ||||||
| 25%/30% | ||||||
The upper right of the matrix shows material properties: small-strain modulus (), lockout modulus (), transition strain (), and shear modulus (). The lower left of the matrix shows failure properties: rupture strain (), rupture stress (), dissection strain (), and dissection stress.
Discussion
Normotensive Versus Hypertensive Aorta.
The general trends for our model in response to a 50% overload in mean arterial pressure are as follows:
An initial spike in circumferential stress followed by re-equilibration to a new homeostatic stress state (above the homeostatic stress state at normal blood pressure) (Fig. 4(a)).
Growth of the MLU in all dimensions, with particularly pronounced medial thickening (Figs. 4(b) and 4(f)), and an increase in luminal diameter under load (Fig. 4(b)).
Fiber remodeling resulting in increased collagen and actin content which coincides with longer fibers with larger radii (Fig. 6), along with less elastin content due to an increase in MLU volume (Fig. 4(c)).
Increased tissue stiffness in both planar and shear tests (Fig. 9).
Increased stress at failure for both medial rupture and medial dissection (Fig. 9).
The initial spike in circumferential stress followed by a re-equilibration to a new homeostatic state is consistent with other theoretical models [30,63]. Our model also shows the homeostatic stress after remodeling with hypertension is greater than that for the normotensive case normotensive, hypertensive), which is consistent with data for hypertensive rats normotensive, hypertensive from Ref. [62] and normotensive, hypertensive [70]). The observations of Ref. [71] show medial thickening and decreased luminal diameter for spontaneously hypertensive rats under in vivo load conditions while the data of Ref. [72] show the same medial thickening () with increased luminal diameter () in hypertensive rats. Our morphological data from the 50% pressure overload scenario show similar medial thickening () along with increases in luminal diameter (). Additionally, the data of Ref. [73] show that the hypertensive rat has a marked decrease in elastin fiber content (–27%) and an insignificant increase in collagen content. Additionally, the estimate for total extracellular fiber fraction is 0.55 in normotensive decreasing to 0.45 in hypertension [73]. Our model indicates similar slight collagen content increase and marked elastin content decrease (–54%) (Fig. 4(b)). We also show that the total elastin and collagen content decreases from 0.36 in the normotensive case to 0.28 in the hypertensive case. This decrease is similar to the experimental case, although are tissue ECM is less dense in the simulation. Further, the data of Ref. [73] show increased vSMC density of the aortic media in hypertensive rats versus control rats changing from –0.27 in normotensive rats to –0.31 in hypertensive rats. A significant increase in actomyosin content in the aortic media is also shown by Ref. [74]. Our model shows a marked increase in the actomyosin density (Fig. 4(c)) increasing from 0.12 to 0.25, indicating that our cellular network is, again, less dense than actual aortic tissue.
The data of Refs. [61] and [70] show significant increases in the small-strain modulus (stiffness at 100 mmHg in the experiment, 20–50% increase) and statistically insignificant decreases in the lockout modulus (stiffness at 200 mmHg in the experiment) for hypertensive rats compared to normotensive controls. Our simulation data show a large increase in small-strain modulus (93% increase) and moderate increase in lockout modulus (32% increase) (Fig. 9). In addition, we see lower ultimate strains in hypertension and increases in ultimate rupture failure strength, which is consistent with Ref. [75].
Unique Insights From This Model.
Some unique insights into the remodeling process emerged that cannot be obtained directly from continuum models. Our model demonstrates that the remodeling process in the 3D actin network formed two distinct fiber populations: one whose radius tended to be relatively large and another that tended to be relatively small. Further investigation showed different microstructural roles for these two fiber families. The two populations were shown to reinforce the network in different directions, with the large-diameter actin fibers aligning in the circumferential-axial plane while the small-diameter fibers aligning radially. This observation suggests the formation of actin struts between layers. Similar struts have been observed experimentally in the rat aortic arch [3], but are formed by interlamellar elastin. The role of these struts in the model is to carry the radial load induced form the osmotic pressure, and removal of these struts causes large increases in the radial thickness and destabilizes the network itself.
Our model also allowed us to simulate failure onset and propagation (Fig. 8) and showed behavior consistent with histological findings of failed tissues [76]. Our simulated failure data also show large variability within groups, which indicates that structural alterations, that cannot be quantified in the averaged data (i.e., fiber volume content, overall tissue stress, and tissue size), play a critical role in when and how a tissue fails. These types of structural information and discrete phenomena (perhaps only affecting a few fibers), lost in the homogenization of continuum models, are of critical importance in predicting failure, where a cascade of failure can be triggered by a seemingly insignificant local inhomogeneity.
Extension of Results to Other Arterial Tissues.
While the results here are cast in the context of aortic remodeling, many of the observations are also true of other arterial structures affected by hypertension. Of particular note is the pulmonary artery where, although the pressure levels are much lower than that of the aorta, hypertension still causes significant remodeling. Pulmonary hypertension induces dilatation of the vessel [77]. This growth is marked by thickening of the media with pronounced stiffening, increase in collagen content and decrease in elastin content [78]. All of these observations are qualitatively consistent with our model and could be examined quantitatively by adjusting the model geometry and pressure loads. The same is true of investigating hypertension effects on other vessels such as the carotid or coronary arteries.
Models of Elastin Fragmentation and Smooth Muscle Cell Dysfunction.
The major clinical criteria for assessing aneurysm risk are size and growth rate, which tend to have low temporal resolution and high variability in measurement. We are able to match simulated vessels grown under different pathologic conditions using these criteria for determining similarity. It is clear from previous studies [1,18,65] that aneurysms involve both elastin fragmentation and smooth muscle cell dysfunction or death. These two pathological scenarios are the basis of our comparisons.
Removal of Elastin Fibers.
Tissue stress decreases after equilibration in response to removed elastin (Fig. 10(b)), which aligns with the murine elastase model in Ref. [20]. Remodeling in response to elastin loss shifts the load from elastin to the collagen and actin. The collagen remodels to a lower stress state while the actin adjusts its contraction and remodeling to balance the load shifted from the collagen. This phenomenon results in increases in both actin and collagen fiber content (Fig. 10(e)) and in growth of the MLU network (Fig. 10(h)). The removal of just elastin leads to increases in luminal diameter with medial thickening, which causes dilatation similar to that observed in elastase models of aneurysms [20,79], but contrary to what is observed in elastin knockout mice [7]. In addition, the aortic stiffness increased when elastin was removed (Fig. 12), which is consistent with elastin insufficient mice [80] and the elastase-induced aneurysm model [20]. Particularly in Ref. [20] we note that the elastic fiber contribution to stress reduces to almost zero, indicating large increases in small-strain stiffness. The collagen contributions to the stress also increase indicating increased lockout stiffness. We limit our discussion here to qualitative results because the mutant mice used to recapitulate these hallmarks of aneurysm do not maintain a normotensive blood pressure.
In a majority of the cases studied here, there was increased tissue strength in response to the removal of elastin. The reason for this is that the load previously borne by elastin is transferred to collagen or actin fibers, which thicken in response to overload. Since these constituents are stronger than elastin, the result is a higher failure stress. While this effect is theoretically understandable, it is never observed in aneurysmal tissues. The missing link may be disruption to the collagen or changes in synthesized collagen that arise due to underlying pathologies, or possible failure occurring at fiber connection junctions rather than in a fiber itself (discussed further in Model Limitations).
Reduced Smooth Muscle Cell Contractility.
The murine Myh11 model of reduced contractility shows lower homeostatic stress [20], whereas in our model, contractility reduction alone showed little change in homeostatic stress (Fig. 10(a)). The reduction of actin contractility redistributes load primarily to the collagen, whose remodeling drives subsequent tissue growth. In mouse models of Myh11 mutation, relatively little change in aortic wall diameter or thickness is observed [20], consistent with our model (Fig. 10(g)). Further, the Myh11 mouse shows decreases in elastin contribution to the material behavior (primarily affecting small-strain modulus) along with increased circumferential collagen/SMC contribution to the material behavior (primarily affecting lockout modulus) [20]. Our model is consistent with these experimental findings. It should be noted that the Myh11 mouse does maintain normotensive blood pressure [81].
Dilated Vessel Mechanics.
The dilated vessels in Fig. 12 show significantly different behaviors from one another both in mechanics and in failure (Table 3), even though they all exhibit nearly the same degree of dilatation and growth rate. Our model showed removal of elastin increased stiffness and shear modulus (Fig. 13), while decreased vSMC contractility lowered small-strain modulus and shear modulus, but increased lockout modulus. The transition strain is also increased with decreased contractility. These relatively small perturbations to dilated vessels make a significant difference in material behavior and failure.
We acknowledge that none of these growth scenarios reach the 50% increase in luminal diameter that is typically associated with an aneurysm, despite relatively large changes to the constituents. The modest changes in vessel size are due to the specification of the fiber growth model. The modulus ratio in Eq. (8), for example, could be tuned to bring the magnitudes of these changes closer to experimental findings. Further, this model treats the growth and decay processes as coupled (i.e., there is only one remodeling equation) when, in reality, the processes of fiber decay through protease activity and fiber growth through fiber deposition occur through very different, and still largely unknown, mechanisms.
Model Limitations.
As with all models of complex systems, there are several limitations associated with this model. First, as discussed earlier, we use a Delaunay network, which tends to be more affine than one might observe of biological networks, especially collagen. Additionally, our structure of smooth muscle stress fibers and a coupled elastic lamina is a simplification of what is observed in arterial tissue. The actual arterial structure contains additional collagen surrounding the SMCs and elastin struts that protrude radially [3]. It is likely that altering the collagen-elastin lamella to be a 3D structure would reproduce these structures as we have already seen the same type of structures emerge from our model, albeit made from actin rather than ECM components. Nevertheless, the structural model here is significantly more representative than a purely continuous model.
A second limitation is the use of osmotic pressure to describe bulk intracellular properties. While it is true that cells use osmotic pressure for various processes including movement, it is naïve to think that the osmotic pressure is the only bulk material model needed. One may well expect that the cell volume is controlled through numerous other biological mechanisms in addition to osmolarity differences.
We assumed that fibers remodel toward a target stress. The fibers themselves are passive elements and cannot sense their surroundings. One could hypothesize that if the fibers are at higher stress, then the cell is also at higher stress, and its response is to release more procollagen and enzyme (peptidase), which causes fibers to grow. If we then add the experimental observations of Ref. [12], a mechanism arises whereby loaded fibers grow, but unloaded fibers decay due to innate matrix metalloprotease activity. An approximation of this process is the fiber growth model used in these simulations.
An additional assumption in the fiber remodeling is that the fiber growth and decay processes are coupled (i.e., can be described through a single equation). However, it is clear that the mechanisms for fiber deposition and decay are very different from one another, and are linked in a complex way through cell signaling. The decoupling of these two processes could give us a much improved model allowing for more growth and fundamental changes in fiber properties. Additionally, the use of this single remodeling equation forces the remodeling process in a quasi-static system (like the one we use) to approach a steady-state value. This simplification does not account for the continuous turnover of the ECM and limits the predictive capabilities of this model in long-term growth (e.g., studying aneurysmal growth over the course of many years).
An additional limitation in the model is that it currently does not capture the decreased strength of aneurysmal tissue. We believe this is due to the fact that we are not modulating the decay of collagen as a cell might in response to insult. The model does not account for many structural alterations that arise from SMC apoptosis or glycosaminoglycan pooling. Both of these aspects could result in changes to tissue strength based on composition. Further, we believe that there are significant structural changes to the underlying networks (beyond just changes in constituent content, fiber radii, and fiber lengths), as opposed to our current simplified remodeling of the fibers in the network. Additionally, our current model does not distinguish failure strengths of bonds between constituents (nodes in the model). It is likely that strengths of constituent bonds are important in failure and may be changed in disease states.
Conclusions
The data presented here demonstrate that this model can capture a majority of experimental observations in the simple case of pressure overload (hypertension), and that it can be used to elucidate both bulk material mechanics and failure properties for many pathological scenarios. Further, our data have demonstrated that structural details, such as the interlamellar struts, can be identified and justified from this model. Discrete-fiber structural models, with increased detail, can be used to predict changes or disruptions in tissue architecture such as those coincident with aneurysm. Further, models of this type allow us to investigate the risk associated with certain pathological aneurysms.
This model system allows us to simulate an extremely complex process. We can simulate experiments that are incredibly difficult to perform such as stimulating or inhibiting elastin, collagen, or actin production, altering mechanical loading during development, altering fiber architecture during the growth process, or changing the maturation process of fibers. Each of these aspects could be insightful in understanding disease pathogenesis for aneurysm formation.
Supplementary Material
Supplementary Material PDF
Acknowledgment
This material is based upon work supported by the National Science Foundation Graduate Research Fellowship Program under Grant No. 00039202. Any opinions, findings, and conclusions or recommendations expressed in this material are those of the author(s) and do not necessarily reflect the views of the National Science Foundation.
Footnotes
Funding Data
National Science Foundation Graduate Research Fellowship Program (NSF GRFP) (Grant No. 00039202; Funder ID: 10.13039/100000001).
National Institutes of Health (Grant No. U01-HL139471; Funder ID: 10.13039/100000002).
References
- [1]. Milewicz, D. M. , Guo, D.-C. , Tran-Fadulu, V. , Lafont, A. L. , Papke, C. L. , Inamoto, S. , Kwartler, C. S. , and Pannu, H. , 2008, “ Genetic Basis of Thoracic Aortic Aneurysms and Dissections: Focus on Smooth Muscle Cell Contractile Dysfunction,” Annu. Rev. Genomics Hum. Genet., 9(1), pp. 283–302. 10.1146/annurev.genom.8.080706.092303 [DOI] [PubMed] [Google Scholar]
- [2].National Center for Chronic Disease Prevention and Health Promotion, Division for Heart Disease and Stroke Prevention, 2019, “ Aortic Aneurysm,” CDC, Atlanta, GA, accessed Mar. 9, 2020, https://www.cdc.gov/heartdisease/aortic_aneurysm.htm
- [3]. O'Connell, M. , Murthy, S. , Phan, S. , Xu, C. , Buchanan, J. , Spilker, R. , Dalman, R. , Zarins, C. , Denk, W. , and Taylor, C. , 2008, “ The Three-Dimensional Micro- and Nanostructure of the Aortic Medial Lamellar Unit Measured Using 3D Confocal and Electron Microscopy Imaging,” Matrix Biol., 27(3), pp. 171–181. 10.1016/j.matbio.2007.10.008 [DOI] [PMC free article] [PubMed] [Google Scholar]
- [4]. Humphrey, J. D. , 2002, Cardiovascular Solid Mechanics, Springer, New York. [Google Scholar]
- [5]. Treuting, P. M. , Dintzis, S. M. , and Montine, K. S. , 2012, Comparative Anatomy and Histology, Elsevier, San Diego, CA. [Google Scholar]
- [6]. Wheeler, J. B. , Mukherjee, R. , Stroud, R. E. , Jones, J. A. , and Ikonomidis, J. S. , 2015, “ Relation of Murine Thoracic Aortic Structural and Cellular Changes With Aging to Passive and Active Mechanical Properties,” J. Am. Heart Assoc., 4(3), pp. 1–9. 10.1161/JAHA.114.001744 [DOI] [PMC free article] [PubMed]
- [7]. Wagenseil, J. E. , and Mecham, R. P. , 2012, “ Elastin in Large Artery Stiffness and Hypertension,” J. Cardiovasc. Transl. Res., 5(3), pp. 264–273. 10.1007/s12265-012-9349-8 [DOI] [PMC free article] [PubMed] [Google Scholar]
- [8]. Aaron, B. B. , and Gosline, J. M. , 1981, “ Elastin as a Random-Network Elastomer: A Mechanical and Optical Analysis of Single Elastin Fibers,” Biopolymers, 20(6), pp. 1247–1260. 10.1002/bip.1981.360200611 [DOI] [Google Scholar]
- [9]. Mouw, J. K. , Ou, G. , and Weaver, V. M. , 2014, “ Extracellular Matrix Assembly: A Multiscale Deconstruction,” Nat. Rev. Mol. Cell Biol., 15(12), pp. 771–785. 10.1038/nrm3902 [DOI] [PMC free article] [PubMed] [Google Scholar]
- [10]. Nissen, R. , Cardinale, G. J. , and Udenfriend, S. , 1978, “ Increased Turnover of Arterial Collagen in Hypertensive Rats,” Proc. Natl. Acad. Sci. U. S. A., 75(1), pp. 451–453. 10.1073/pnas.75.1.451 [DOI] [PMC free article] [PubMed] [Google Scholar]
- [11]. Revenko, I. , Sommer, F. , Minh, D. T. , Garrone, R. , and Franc, J.-M. , 1994, “ Atomic Force Microscopy Study of the Collagen Fibre Structure,” Biol. Cell, 80(1), pp. 67–69. 10.1016/0248-4900(94)90019-1 [DOI] [PubMed] [Google Scholar]
- [12]. Flynn, B. P. , Bhole, A. P. , Saeidi, N. , Liles, M. , Dimarzio, C. A. , and Ruberti, J. W. , 2010, “ Mechanical Strain Stabilizes Reconstituted Collagen Fibrils Against Enzymatic Degradation by Mammalian Collagenase Matrix Metalloproteinase 8 (MMP-8),” PLoS One, 5(8), p. e12337. 10.1371/journal.pone.0012337 [DOI] [PMC free article] [PubMed] [Google Scholar]
- [13]. Ruberti, J. W. , and Hallab, N. J. , 2005, “ Strain-Controlled Enzymatic Cleavage of Collagen in Loaded Matrix,” Biochem. Biophys. Res. Commun., 336(2), pp. 483–489. 10.1016/j.bbrc.2005.08.128 [DOI] [PubMed] [Google Scholar]
- [14]. Flynn, B. P. , Tilburey, G. E. , and Ruberti, J. W. , 2013, “ Highly Sensitive Single-Fibril Erosion Assay Demonstrates Mechanochemical Switch in Native Collagen Fibrils,” Biomech. Model. Mechanobiol., 12(2), pp. 291–300. 10.1007/s10237-012-0399-2 [DOI] [PMC free article] [PubMed] [Google Scholar]
- [15]. Martyn, C. , and Greenwald, S. , 1997, “ Impaired Synthesis of Elastin in Walls of Aorta and Large Conduit Arteries During Early Development as an Initiating Event in Pathogenesis of Systemic Hypertension,” Lancet, 350(9082), pp. 953–955. 10.1016/S0140-6736(96)10508-0 [DOI] [PubMed] [Google Scholar]
- [16]. Win, Z. , Buksa, J. M. , Steucke, K. E. , Gant Luxton, G. W. , Barocas, V. H. , and Alford, P. W. , 2017, “ Cellular Microbiaxial Stretching to Measure a Single-Cell Strain Energy Density Function,” J. Biomech. Eng., 139(7), p. 071006. 10.1115/1.4036440 [DOI] [PMC free article] [PubMed] [Google Scholar]
- [17]. Steucke, K. E. , Win, Z. , Stemler, T. R. , Walsh, E. E. , Hall, J. L. , and Alford, P. W. , 2017, “ Empirically Determined Vascular Smooth Muscle Cell Mechano-Adaptation Law,” ASME J. Biomech. Eng., 139(7), p. 071005. 10.1115/1.4036454 [DOI] [PMC free article] [PubMed] [Google Scholar]
- [18]. Vorp, D. A. , Tsamis, A. , and Krawiec, J. T. , 2013, “ Elastin and Collagen Fibre Microstructure of the Human Aorta in Ageing and Disease: A Review,” J. Royal Soc. Interface, 10(83), pp. 1–22. 10.1098/rsif.2012.1004 [DOI] [PMC free article] [PubMed]
- [19]. Collins, M. J. , Dev, V. , Strauss, B. H. , Fedak, P. W. M. , and Butany, J. , 2008, “ Variation in the Histopathological Features of Patients With Ascending Aortic Aneurysms: A Study of 111 Surgically Excised Cases,” J. Clin. Pathol., 61(4), pp. 519–523. 10.1136/jcp.2006.046250 [DOI] [PubMed] [Google Scholar]
- [20]. Bellini, C. , Bersi, M. R. , Caulk, A. W. , Ferruzzi, J. , Milewicz, D. M. , Ramirez, F. , Rifkin, D. B. , Tellides, G. , Yanagisawa, H. , and Humphrey, J. D. , 2017, “ Comparison of 10 Murine Models Reveals a Distinct Biomechanical Phenotype in Thoracic Aortic Aneurysms,” J. R. Soc. Interface, 14(130), p. 20161036. 10.1098/rsif.2016.1036 [DOI] [PMC free article] [PubMed] [Google Scholar]
- [21]. Fung, Y. C. , and Liu, S. Q. , 1995, “ Determination of the Mechanical Properties of the Different Layers of Blood Vessels In Vivo,” Proc. Natl. Acad. Sci. U. S. A., 92(6), pp. 2169–2173. 10.1073/pnas.92.6.2169 [DOI] [PMC free article] [PubMed] [Google Scholar]
- [22]. Fung, Y. C. , and Liu, S. Q. , 1989, “ Change of Residual Strains in Arteries Due to Hypertrophy Caused by Aortic Constriction,” Circ. Res., 65(5), pp. 1340–1349. 10.1161/01.res.65.5.1340 [DOI] [PubMed] [Google Scholar]
- [23]. Liu, S. Q. , and Fung, Y. C. , 1989, “ Relationship Between Hypertension, Hypertrophy, and Opening Angle of Zero-Stress State of Arteries Following Aortic Constriction,” ASME J. Biomech. Eng., 111(4), pp. 325–335. 10.1115/1.3168386 [DOI] [PubMed] [Google Scholar]
- [24]. Jackson, Z. S. , Gotlieb, A. I. , and Langille, B. L. , 2002, “ Wall Tissue Remodeling Regulates Longitudinal Tension in Arteries,” Circ. Res., 90(8), pp. 918–925. 10.1161/01.RES.0000016481.87703.CC [DOI] [PubMed] [Google Scholar]
- [25]. Matsumoto, T. , and Hayashi, K. , 1996, “ Stress and Strain Distribution in Hypertensive and Normotensive Rat Aorta Considering Residual Strain,” ASME J. Biomech. Eng., 118(1), pp. 62–73. 10.1115/1.2795947 [DOI] [PubMed] [Google Scholar]
- [26]. Bendeck, M. P. , and Langille, B. L. , 1991, “ Rapid Accumulation of Elastin and Collagen in the Aortas of Sheep in the Immediate Perinatal Period,” Circ. Res., 69(4), pp. 1165–1169. 10.1161/01.RES.69.4.1165 [DOI] [PubMed] [Google Scholar]
- [27]. Skalak, R. , Dasgupta, G. , Moss, M. , Otten, E. , Dullemeijer, P. , and Vilmann, H. , 1982, “ Analytical Description of Growth,” J. Theor. Biol., 94(3), pp. 555–577. 10.1016/0022-5193(82)90301-0 [DOI] [PubMed] [Google Scholar]
- [28]. Rodriguez, E. K. , Hoger, A. , and McCulloch, A. D. , 1994, “ Stress-Dependent Finite Growth in Soft Elastic Tissues,” J. Biomech., 27(4), pp. 455–467. 10.1016/0021-9290(94)90021-3 [DOI] [PubMed] [Google Scholar]
- [29]. Alford, P. W. , and Taber, L. A. , 2008, “ Computational Study of Growth and Remodelling in the Aortic Arch,” Comput. Methods Biomech. Biomed. Eng., 11(5), pp. 525–538. 10.1080/10255840801930710 [DOI] [PMC free article] [PubMed] [Google Scholar]
- [30]. Taber, L. A. , 1998, “ A Model for Aortic Growth Based on Fluid Shear and Fiber Stresses,”ASME J. Biomech. Eng., 120(3), pp. 348–354. 10.1115/1.2798001 [DOI] [PubMed] [Google Scholar]
- [31]. Humphrey, J. D. , and Rajagopal, K. R. , 2002, “ A Constrained Mixture Model for Growth and Remodelling of Soft Tissues,” Math. Model. Methods Appl. Sci., 12(03), pp. 407–430. 10.1142/S0218202502001714 [DOI] [Google Scholar]
- [32]. Ateshian, G. A. , and Humphrey, J. D. , 2012, “ Continuum Mixture Models of Biological Growth and Remodeling: Past Successes and Future Opportunities,” Annu. Rev. Biomed. Eng., 14(1), pp. 97–111. 10.1146/annurev-bioeng-071910-124726 [DOI] [PubMed] [Google Scholar]
- [33]. Kuhl, E. , and Holzapfel, G. A. , 2007, “ A Continuum Model for Remodeling in Living Structures,” J. Mater. Sci., 42(21), pp. 8811–8823. 10.1007/s10853-007-1917-y [DOI] [Google Scholar]
- [34]. Hariton, I. , deBotton, G. , Gasser, T. C. , and Holzapfel, G. A. , 2007, “ Stress-Driven Collagen Fiber Remodeling in Arterial Walls,” Biomech. Model. Mechanobiol., 6(3), pp. 163–175. 10.1007/s10237-006-0049-7 [DOI] [PubMed] [Google Scholar]
- [35]. Picu, R. C. , 2011, “ Mechanics of Random Fiber Networks—A Review,” Soft Matter, 7(15), pp. 6768–6785. 10.1039/c1sm05022b [DOI] [Google Scholar]
- [36]. Green, E. M. , Mansfield, J. C. , Bell, J. S. , and Winlove, C. P. , 2014, “ The Structure and Micromechanics of Elastic Tissue,” Interface Focus, 4(2), p. 20130058. 10.1098/rsfs.2013.0058 [DOI] [PMC free article] [PubMed] [Google Scholar]
- [37]. Fornieri, C. , Quaglino, D., Jr ,., and Mori, G. , 1992, “ Role of the Exracellular Matrix in Age-Related Modifications of the Rat Aorta,” Art. Thromb., 12(9), pp. 1008–1016. 10.1161/01.ATV.12.9.1008 [DOI] [PubMed] [Google Scholar]
- [38]. Alford, P. W. , Humphrey, J. D. , and Taber, L. A. , 2008, “ Growth and Remodelling in a Thick-Walled Artery Model: Effects of Spatial Variations in Wall Constituents,” Biomech. Model. Mechanobiol., 7(4), pp. 245–262. 10.1007/s10237-007-0101-2 [DOI] [PMC free article] [PubMed] [Google Scholar]
- [39]. Freed, A. D. , and Doehring, T. C. , 2005, “ Elastic Model for Crimped Collagen Fibrils,” ASME J. Biomech. Eng., 127(4), pp. 587–593. 10.1115/1.1934145 [DOI] [PubMed] [Google Scholar]
- [40]. Holmes, K. C. , Popp, D. , Gebhard, W. , and Kabsch, W. , 1990, “ Atomic Model of the Actin Filament,” Nature, 347(6288), pp. 44–49. 10.1038/347044a0 [DOI] [PubMed] [Google Scholar]
- [41]. Rachev, A. , and Hayashi, K. , 1999, “Theoretical Study of the Effects of Vascular Smooth Muscle Contraction on Strain and Stress Distributions in Arteries,” Annals BME., 27, pp. 459–468. 10.1114/1.191 [DOI] [PubMed] [Google Scholar]
- [42]. Shen, Z. L. , Dodge, M. R. , Kahn, H. , Ballarini, R. , and Eppell, S. J. , 2008, “ Stress-Strain Experiments on Individual Collagen Fibrils,” Biophys. J., 95(8), pp. 3956–3963. 10.1529/biophysj.107.124602 [DOI] [PMC free article] [PubMed] [Google Scholar]
- [43]. Buehler, M. J. , 2008, “ Nanomechanics of Collagen Fibrils Under Varying Cross-Link Densities: Atomistic and Continuum Studies,” J. Mech. Behav. Biomed. Mater., 1(1), pp. 59–67. 10.1016/j.jmbbm.2007.04.001 [DOI] [PubMed] [Google Scholar]
- [44]. Gosline, J. , Lillie, M. , Carrington, E. , Guerette, P. , Ortlepp, C. , and Savage, K. , 2002, “ Elastic Proteins: Biological Roles and Mechanical Properties,” Phil. Trans. R. Soc. Lond. B., 3(57). pp. 121–132. 10.1098/rstb.2001.1022 [DOI] [PMC free article] [PubMed]
- [45]. Ateshian, G. A. , Rajan, V. , Chahine, N. O. , Canal, C. E. , and Hung, C. T. , 2009, “ Modeling the Matrix of Articular Cartilage Using a Continuous Fiber Angular Distribution Predicts Many Observed Phenomena,” ASME J. Biomech. Eng., 131(6), p. 061003. 10.1115/1.3118773 [DOI] [PMC free article] [PubMed] [Google Scholar]
- [46]. Nolan, D. R. , and McGarry, J. P. , 2016, “ On the Compressibility of Arterial Tissue,” Ann. Biomed. Eng., 44(4), pp. 993–1007. 10.1007/s10439-015-1417-1 [DOI] [PubMed] [Google Scholar]
- [47]. Chandran, P. L. , and Barocas, V. H. , 2006, “ Affine Versus Non-Affine Fibril Kinematics in Collagen Networks: Theoretical Studies of Network Behavior,” ASME J. Biomech. Eng., 128(2), pp. 259–270. 10.1115/1.2165699 [DOI] [PubMed] [Google Scholar]
- [48]. Stylianopoulos, T. , and Barocas, V. H. , 2007, “ Volume-Averaging Theory for the Study of the Mechanics of Collagen Networks,” Comput. Methods Appl. Mech. Eng., 196(31–32), pp. 2981–2990. 10.1016/j.cma.2006.06.019 [DOI] [Google Scholar]
- [49]. Guennebaud, G. , and Jacob, B. , 2010, “ Eigen V3,” Online, accessed Mar. 9, 2020, http://www.eigen.tuxfamily.org/
- [50]. Jia, Z. , and Nguyen, T. D. , 2019, “ A Micromechanical Model for the Growth of Collagenous Tissues Under Mechanics-Mediated Collagen Deposition and Degradation,” J. Mech. Behav. Biomed. Mater., 98, pp. 96–107. 10.1016/j.jmbbm.2019.06.004 [DOI] [PubMed] [Google Scholar]
- [51]. Witzenburg, C. M. , Dhume, R. Y. , Shah, S. B. , Korenczuk, C. E. , Wagner, H. P. , Alford, P. W. , and Barocas, V. H. , 2017, “ Failure of the Porcine Ascending Aorta: Multidirectional Experiments and a Unifying Microstructural Model,” ASME J. Biomech. Eng., 139(3), p. 031005. 10.1115/1.4035264 [DOI] [PMC free article] [PubMed] [Google Scholar]
- [52]. Korenczuk, C. E. , Votava, L. E. , Dhume, R. Y. , Kizilski, S. B. , Brown, G. E. , Narain, R. , and Barocas, V. H. , 2017, “ Isotropic Failure Criteria Are Not Appropriate for Anisotropic Fibrous Biological Tissues,” ASME J. Biomech. Eng., 139(7), p. 071008. 10.1115/1.4036316 [DOI] [PMC free article] [PubMed]
- [53]. Sherifova, S. , and Holzapfel, G. A. , 2019, “ Biomechanics of Aortic Wall Failure With a Focus on Dissection and Aneurysm: A Review,” Acta Biomater., 99, pp. 1–17. 10.1016/j.actbio.2019.08.017 [DOI] [PMC free article] [PubMed] [Google Scholar]
- [54]. Tong, J. , Cheng, Y. , and Holzapfel, G. A. , 2016, “ Mechanical Assessment of Arterial Dissection in Health and Disease: Advancements and Challenges,” J. Biomech., 49(12), pp. 2366–2373. 10.1016/j.jbiomech.2016.02.009 [DOI] [PubMed] [Google Scholar]
- [55]. Sommer, G. , Sherifova, S. , Oberwalder, P. J. , Dapunt, O. E. , Ursomanno, P. A. , DeAnda, A. , Griffith, B. E. , and Holzapfel, G. A. , 2016, “ Mechanical Strength of Aneurysmatic and Dissected Human Thoracic Aortas at Different Shear Loading Modes,” J. Biomech., 49(12), pp. 2374–2382. 10.1016/j.jbiomech.2016.02.042 [DOI] [PMC free article] [PubMed] [Google Scholar]
- [56]. Kim, J. H. , Avril, S. , Duprey, A. , and Favre, J. P. , 2012, “ Experimental Characterization of Rupture in Human Aortic Aneurysms Using a Full-Field Measurement Technique,” Biomech. Model. Mechanobiol., 11(6), pp. 841–853. 10.1007/s10237-011-0356-5 [DOI] [PubMed] [Google Scholar]
- [57]. Vorp, D. A. , and Vande Geest, J. P. , 2005, “ Biomechanical Determinants of Abdominal Aortic Aneurysm Rupture,” Arterioscler. Thromb. Vasc. Biol., 25(8), pp. 1558–1566. 10.1161/01.ATV.0000174129.77391.55 [DOI] [PubMed] [Google Scholar]
- [58]. Saleh, F. H. , and Jurjus, A. R. , 2001, “ A Comparative Study of Morphological Changes in Spontaneously Hypertensive Rats and Normotensive Wistar Kyoto Rats Treated With an Angiotensin‐Converting Enzyme Inhibitor or a Calcium‐Channel Blocker,” J. Pathol., 193(3), pp. 415–420. 10.1002/1096-9896 [DOI] [PubMed] [Google Scholar]
- [59]. Benetos, A. , Lacolley, P. , and Safar, M. E. , 1997, “ Prevention of Aortic Fibrosis by Spironolactone in Spontaneously Hypertensive Rats,” Arterioscler. Thromb. Vasc. Biol., 17(6), pp. 1152–1156. 10.1161/01.ATV.17.6.1152 [DOI] [PubMed] [Google Scholar]
- [60]. Koffi, I. , Lacolley, P. , Kirchengaast, M. , Pomiès, J. P. , Laurent, S. , and Benetos, A. , 1998, “ Prevention of Arterial Structural Alterations With Verapamil and Trandolapril and Consequences for Mechanical Properties in Spontaneously Hypertensive Rats,” Eur. J. Pharmacol., 361(1), pp. 51–60. 10.1016/S0014-2999(98)00691-8 [DOI] [PubMed] [Google Scholar]
- [61]. Matsumoto, T. , and Hayashi, K. , 1994, “ Mechanical and Dimensional Adaptation of Rat Aorta to Hypertension,” ASME J. Biomech. Eng., 116(3), pp. 278–283. 10.1115/1.2895731 [DOI] [PubMed] [Google Scholar]
- [62]. Bézie, Y. , Lamaziè, J.-M. D. , Laurent, S. , Challande, P. , Cunha, R. S. , Bonnet, J. , and Lacolley, P. , 1998, Fibronectin Expression and Aortic Wall Elastic Modulus in Spontaneously Hypertensive Rats, Arterioscler. Thromb. Vasc. Biol., 18(7), pp. 1027–1034. 10.1161/01.atv.18.7.1027 [DOI] [PubMed]
- [63]. Karsaj, I. , and Humphrey, J. D. , 2012, “ A Multilayered Wall Model of Arterial Growth and Remodeling,” Mech. Mater., 44, pp. 110–119. 10.1016/j.mechmat.2011.05.006 [DOI] [PMC free article] [PubMed] [Google Scholar]
- [64]. Perrucci, G. L. , Rurali, E. , Gowran, A. , Pini, A. , Antona, C. , Chiesa, R. , Pompilio, G. , and Nigro, P. , 2017, “ Vascular Smooth Muscle Cells in Marfan Syndrome Aneurysm: The Broken Bricks in the Aortic Wall,” Cell. Mol. Life Sci., 74(2), pp. 267–277. 10.1007/s00018-016-2324-9 [DOI] [PMC free article] [PubMed] [Google Scholar]
- [65]. Guo, D. C. , Pannu, H. , Tran-Fadulu, V. , Papke, C. L. , Yu, R. K. , Avidan, N. , Bourgeois, S. , Estrera, A. L. , Safi, H. J. , Sparks, E. , Amor, D. , Ades, L. , McConnell, V. , Willoughby, C. E. , Abuelo, D. , Willing, M. , Lewis, R. A. , Kim, D. H. , Scherer, S. , Tung, P. P. , Ahn, C. , Buja, L. M. , Raman, C. S. , Shete, S. S. , and Milewicz, D. M. , 2007, “ Mutations in Smooth Muscle α-Actin (ACTA2) Lead to Thoracic Aortic Aneurysms and Dissections,” Nat. Genet., 39(12), pp. 1488–1493. 10.1038/ng.2007.6 [DOI] [PubMed] [Google Scholar]
- [66]. Deogekar, S. , and Picu, R. C. , 2018, “ On the Strength of Random Fiber Networks,” J. Mech. Phys. Solids, 116, pp. 1–16. 10.1016/j.jmps.2018.03.026 [DOI] [Google Scholar]
- [67]. Lederle, F. A. , Wilson, S. E. , Johnson, G. R. , Reinke, D. B. , Littooy, F. N. , Acher, C. W. , Messina, L. M. , Ballard, D. J. , and Ansel, H. J. , 1995, “ Variability in Measurement of Abdominal Aortic Aneurysms,” J. Vasc. Surg., 21(6), pp. 945–952. 10.1016/s0741-5214(95)70222-9 [DOI] [PubMed] [Google Scholar]
- [68]. Wilmink, A. B. M. , Forshaw, M. , Quick, C. R. G. , Hubbard, C. S. , and Day, N. E. , 2002, “ Accuracy of Serial Screening for Abdominal Aortic Aneurysms by Ultrasound,” J. Med. Screen., 9(3), pp. 125–127. 10.1136/jms.9.3.125 [DOI] [PubMed] [Google Scholar]
- [69]. Nardi, P. , and Ruvolo, G. , 2016, “ Current Indications to Surgical Repair of the Aneurysms of Ascending Aorta,” J. Vasc. Endovasc. Surg., 1(2). 10.21767/2573-4482.100009 [DOI] [Google Scholar]
- [70]. Hayashi, K. , and Sugimoto, T. , 2007, “ Biomechanical Response of Arterial Wall to DOCA-Salt Hypertension in Growing and Middle-Aged Rats,” J. Biomech., 40(7), pp. 1583–1593. 10.1016/j.jbiomech.2006.07.021 [DOI] [PubMed] [Google Scholar]
- [71]. Van Gorp, A. W. , Van Ingen Schenau, D. S. , Hoeks, A. P. G. , Struijker Boudier, H. A. J. , Reneman, R. S. , and De Mey, J. G. R. , 1995, “ Aortic Wall Properties in Normotensive and Hypertensive Rats of Various Ages In Vivo,” Hypertension, 26(2), pp. 363–368. 10.1161/01.HYP.26.2.363 [DOI] [PubMed] [Google Scholar]
- [72]. Marque, V. , Kieffer, P. , Atkinson, J. , and Lartaud-Idjouadiene, I. , 1999, “ Elastic Properties and Composition of the Aortic Wall in Old Spontaneously Hypertensive Rats,” Hypertension, 34(3), pp. 415–422. 10.1161/01.HYP.34.3.415 [DOI] [PubMed] [Google Scholar]
- [73]. Hayashi, K. , and Shimizu, E. , 2016, “ Composition of Connective Tissues and Morphometry of Vascular Smooth Muscle in Arterial Wall of DOCA-Salt Hypertensive Rats—In Relation With Arterial Remodeling,” J. Biomech., 49(7), pp. 1225–1229. 10.1016/j.jbiomech.2016.02.044 [DOI] [PubMed] [Google Scholar]
- [74]. Seidel, C. L. , 1979, “ Aortic Actomyosin Content of Maturing Normal and Spontaneously Hypertensive Rats,” Am. J. Physiol. Hear. Circ. Physiol., 6(1), pp. H34–H39. 10.1152/ajpheart.1979.237.1.H34 [DOI] [PubMed] [Google Scholar]
- [75]. Kochova, P. , Tonar, Z. , Matejka, V. M. , Sviglerova, J. , Stengl, M. , and Kuncova, J. , 2008, “ Morphology and Mechanical Properties of the Subrenal Aorta in Normotensive and Hypertensive Rats,” Biomed. Pap. Med. Fac. Univ. Palacky Olomouc. Czech Repub., 152(2), pp. 239–245. 10.5507/bp.2008.037 [DOI] [PubMed] [Google Scholar]
- [76]. Sommer, G. , Gasser, T. C. , Regitnig, P. , Auer, M. , and Holzapfel, G. A. , 2008, “ Dissection Properties of the Human Aortic Media: An Experimental Study,” ASME J. Biomech. Eng., 130(2), p. 021007. 10.1115/1.2898733 [DOI] [PubMed] [Google Scholar]
- [77]. Kobs, R. W. , Muvarak, N. E. , Eickhoff, J. C. , and Chesler, N. C. , 2005, “ Linked Mechanical and Biological Aspects of Remodeling in Mouse Pulmonary Arteries With Hypoxia-Induced Hypertension,” Am. J. Physiol. Hear. Circ. Physiol., 288, pp. 1209–1217. 10.1152/ajpheart.01129.2003 [DOI] [PubMed] [Google Scholar]
- [78]. Golob, M. J. , Tabima, D. M. , Wolf, G. D. , Johnston, J. L. , Forouzan, O. , Mulchrone, A. M. , Kellihan, H. B. , Bates, M. L. , and Chesler, N. C. , 2017, “ Pulmonary Arterial Strain-and Remodeling-Induced Stiffening Are Differentiated in a Chronic Model of Pulmonary Hypertension,” J. Biomech., 55, pp. 92–98. 10.1016/j.jbiomech.2017.02.003 [DOI] [PMC free article] [PubMed]
- [79]. Thompson, R. W. , Curci, J. A. , Ennis, T. L. , Mao, D. , Pagano, M. B. , and Pham, C. T. , 2006, “ Pathophysiology of Abdominal Aortic Aneurysms: Insights From the Elastase-Induced Model in Mice With Different Genetic Backgrounds,” Ann. N. Y. Acad. Sci., 1085(1), pp. 59–73. 10.1196/annals.1383.029 [DOI] [PubMed] [Google Scholar]
- [80]. Le, V. P. , Knutsen, R. H. , Mecham, R. P. , and Wagenseil, J. E. , 2011, “ Decreased Aortic Diameter and Compliance Precedes Blood Pressure Increases in Postnatal Development of Elastin-Insufficient Mice,” Am. J. Physiol. Hear. Circ. Physiol., 301(1), pp. H221–H229. 10.1152/ajpheart.00119.2011 [DOI] [PMC free article] [PubMed] [Google Scholar]
- [81]. Bellini, C. , Bersi, M. R. , Caulk, A. W. , Ferruzzi, J. , Milewicz, D. M. , Ramirez, F. , Rifkin, D. B. , Tellides, G. , Yanagisawa, H. , and Humphrey, J. D. , 2017, “ Comparison of 10 Murine Models Reveals a Distinct Biomechanical Phenotype in Thoracic Aortic Aneurysms - Supplemental Material,” J. R. Soc. Interface, 14(130), p. 20161036. [DOI] [PMC free article] [PubMed] [Google Scholar]
Associated Data
This section collects any data citations, data availability statements, or supplementary materials included in this article.
Supplementary Materials
Supplementary Material PDF


