

Abstract
Catechol-based bioadhesives generate hydrogen peroxide (H2O2) as a byproduct during the curing process. H2O2 can have both beneficial and deleterious effects on biological systems depending on its concentration. To control the amount of H2O2 released from catechol-containing polyethylene glycol-based adhesive (PEG-DA), adhesive was formulated with silica nanoparticles (SiNP) prepared with increased porosity and acid treatment to increase Si-OH surface content. These SiNP demonstrated increased surface area, which promoted interaction with catechol and resulted in increased cure rate, bulk mechanical properties and adhesive properties of PEG-DA. Most importantly, SiNP demonstrated a 50% reduction in the released H2O2 while improving the cell viability and proliferation of three primary cell types, including rat dermal fibroblasts, human epidermal keratinocytes, and human tenocytes. Additionally, SiNP degraded into soluble Si, which also contributed to increased cell proliferation. Incorporation of porous and acid-treated SiNP can be a useful approach to simultaneously modulate the concentration of H2O2 while increasing the adhesive performance of catechol-based adhesives.
Keywords: catechol, hydrogen peroxide, silica nanoparticle, biocompatibility, bioadhesive
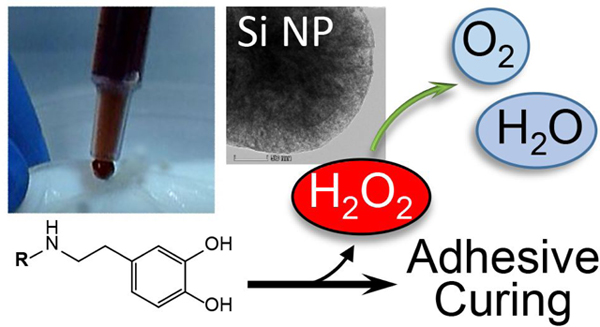
Graphical Abstract
1. Introduction
Mussels adhere strongly to various surfaces under wet conditions through the secretion of adhesive proteins that solidify to form adhesive plaques 1. Catechol moiety found in mussels adhesive proteins (MAPs) is one of the main contributors to the interfacial binding and crosslinking capabilities of these proteins 2. Catechol-modification of natural and synthetic polymers is widely used to create in situ curable bioadhesives with strong, wet adhesive properties 3, 4. To activate catechol for crosslinking, catechol needs to be oxidized into its reactive quinone form by chemical-mediated (i.e., periodate) or enzymatic (i.e., peroxidase) oxidation 5, 6. This is a critical step to initiate cohesive and interfacial crosslinking of catechol-containing adhesive. Specifically, periodate is one of the most commonly utilized oxidant for initiating curing of injectable biomaterials 7–9. Recently, our lab reported that hydrogen peroxide (H2O2) is generated as a byproduct during the oxidative crosslinking and curing of catechol-containing adhesive (Figure S1) 10. The generated reactive oxygen species (ROS) contributed to localized in vitro cytotoxicity, promoted antioxidant enzyme expression in primary dermal and tendon fibroblasts, and promoted M2 macrophage polarization when the adhesive was implanted subcutaneously.
Living organisms naturally generate H2O2 as a part of normal wound healing and inflammatory response 11–13. The effect of H2O2 on biological systems is also highly concentration-dependent. Application of H2O2 at micromolar ranges have been shown to accelerate dermal wound healing 14, 15. Additionally, H2O2 is a natural disinfectant 16. However, high levels of H2O2 can destroy healthy tissues, lead to chronic wounds, retard natural healing cascade, and induce tumor formation 17, 18. Given the varying H2O2-associated biological responses, there is a need to tune the amount of H2O2 released from catechol-containing biomaterials according to the application-specific material design.
H2O2 concentration can be controlled through the use of catalytic metal oxides (Al2O3, TiO2), metal ions (Fe3+, Mn2+, and Cu2+) and enzymes such as catalase 10, 19, 20. However, most catalytic metal oxides and ions are not suitable for biological applications due to their cytotoxicity, and toxic metal accumulation can occur with prolonged exposure 21, 22. Although catalase readily decompose H2O2 and are suitable for biomedical applications, they are limited by elevated costs and issues with stability 23, 24. As an alternative, silica (Si) particles and silicate material are economically viable and can degrade H2O2 25. Si materials are more biocompatible when compared to other metal oxides 22. Additionally, H2O2 forms a multimember ring complex with Si-OH groups on the surface of Si-based material in the presence of water, which helps to further stabilize the complex 26, 27. However, Si material decomposes H2O2 at a significantly slower rate when compared to other metal oxides 25. Since both degradation and complexation of H2O2 on Si material are surface dependent phenomena, a combination of increased surface area and surface modification techniques can potentially improve the efficiency of silica particles for H2O2 degradation.
In this work, we prepared highly porous Si particles and further treated these particles with strong acid to create a Si-OH-rich surface. We hypothesize that the combination of increased surface area and surface chemistry modification can be utilized to modulate the release of H2O2 from the catechol-containing adhesive (Scheme 1). A branched 8-armed PEG with terminal dopamine moieties (PEG-DA) was used as the model adhesive (Figure S2) 28. Dopamine resembles the amino acid, DOPA, found in MAPs and contains the catechol side chain needed for oxidative crosslinking and interfacial binding. PEG-DA was combined with the porous Si particles to form a composite adhesive and the effect of particle incorporation on the release of H2O2, the material property of the composite adhesive, and the cellular response of primary fibroblast, tenocyte, and keratinocyte was investigated.
Scheme 1.

Schematic representation of mixing PEG-DA with porous Si particles to form a composite adhesive (A). Catechol generates H2O2 during oxidative crosslinking (B). Surface Si-OH forms complexation with H2O2 and water, resulting in H2O2 degradation (C).
2. Materials & Methods
2.1. Materials
Phosphate buffer saline (PBS), tetraethyl orthosilicate (TEOS, 99.8%), methanol, ethanol (200 proof), sodium hydroxide, cetrimonium bromide (CTAB, 99.9%), hydrogen peroxide solution (H2O2, 30%), dimethyl sulfoxide (DMSO), and hydrochloric acid (HCl, 37%) were purchased from Fisher Scientific (Pittsburgh, PA). Sodium periodate (NaIO4, >99.8%) was purchased from Acros Organics (Fair Lawn, NJ). Pierce Quantitative Peroxide Assay Kit with sorbitol (ferrous oxidation-xylenol orange (FOX) assay), fetal bovine serum (FBS), and Penicillin–Streptomycin (10 U/ml) were purchased from Thermo Scientific (Rockford, IL). Rat primary dermal fibroblasts (RDF) were purchased from Cells Biologics (Chicago, IL). Dermal Cell Basal Medium, keratinocyte growth kit, primary human tenocytes (HT), and primary human epidermal keratinocytes (HEK) were purchased from ATCC (Manassas, VA). TransWell® Permeable Supports (12 mm insert, 12 well plate, 3.0 μ, polycarbonate membrane) were purchased from Corning Costar (Pittston, PA). Dulbecco’s modified Eagle’s medium (DMEM; with 4.5 g/L glucose and glutamine, without sodium pyruvate), and trypsin–EDTA (0.05% Trypsin/0.53 mM EDTA in Hank’s balanced salt solution) were obtained from Corning Cellgro (Manassas, VA). Tenocyte Growth Medium was purchased from Zenbio (Research Triangle Park, NC). Polyfreeze®, phosphate-buffered saline (PBS, BioPerformance certified, pH 7.4), bovine liver catalase, Trichrome Stain (Masson’s) Kit, Bouin’s solution, and Weigert’s iron hematoxylin solution were purchased from Sigma-Aldrich (St. Louis, MO). 3-(4,5-dimethylthiazol-2-yl)-2,5-diphenyltetrazolium bromide 98% (MTT) was purchased from Alfa Aesar (Ward Hill, MA). Anti-Ki-67 antibody (ab15580), goat anti-rabbit IgG H&L (Alexa Fluor 488) (ab150077), and goat anti-rabbit IgG H&L (Alexa Fluor 647) (ab150079) were purchased from Abcam (Cambridge, MA). 4,6-Diamidino-2-phenylindole (DAPI) was obtained from Invitrogen (Grand Island, NY). PEG-DA was prepared following previously published protocols using an 8-armed PEG (MW=20 kDa, JenKem USA, TX) 28.
2.2. Synthesis of Silica Particles
Nonporous silica nanoparticle (NSi) was prepared using a modified Stöber method without surfactant 28. Mesoporous silica particles with low (LSi) and high (HSi) porosity were prepared using the same Stöber method with CTAB as a surfactant (Figure S3). The silica precursor solution was prepared by mixing 0, 9.4, or 18.8 g of CTAB (for NSi, LSi, and HSi, respectively) into 500 ml of ethanol and water mixed solution (2:1 v/v ratio) and vigorously stirred (15 min at 400 rpm) at 55 °C using a heating manifold and maintained at pH 11 with dropwise addition of 0.1M NaOH. Then, 10 ml of TEOS solution was added dropwise into the reaction mixture at a rate of roughly 300 μl s−1 while stirring at 1000 rpm. The mixture was left stirring for another hour at 55 °C. 0.1 M HCl was added dropwise to the reaction mixture to neutralize its pH, which was further stirred for another 15 minutes at room temperature. The reaction mixture was centrifuged at 10,000 kGs then washed 3 times with methanol, ethanol, and deionized (DI) water. The particles were dried under vacuum for 24 hours and sifted using American Society for Testing and Materials (ASTM) 450 (32 μm) sifters to remove any large contaminants and aggregates. The yield of the NSi, LSi, and HSi particles was 75%, 68%, and 66%, respectively.
2.3. Silica Particle Modification
Acid-treated HSi (AHSi) particles were prepared using a modified version of a previously developed acid activation technique 29. HSi (1 g) was resuspended in 200 ml of ethanol, then 2 ml of 12 M HCl was added into the mixture. The mixture was heated at 90 °C with continued stirring under a N2 environment with a reflux column for 12 hours. NaOH (17.6M) was added dropwise to neutralize the solution pH to 6.5 and then was further stirred for 30 minutes at room temperature. The mixture was centrifuged at 10,000 kGs at 4oC, and the particles were washed 3 times with methanol, ethanol, and then DI water. The particles were dried under vacuum for 24 hours and sifted through ASTM 450 (32 μm) sifters. The yield of these particles was approximately 33%. The particles were dehydrated in a 200°C oven over a bed of potassium carbonate desiccant for 12 hours before backfilling with N2 gas to remove all moisture.
2.4. Silica Particle Surface and Composition Characterization
The total surface area of the particle was calculated using the Brunauer-Emmett-Teller (BET) model. A BET surface area Micromeritics ASAP 2000 sorptometer (Micromeritics) was utilized to measure the surface areas of silica particles by nitrogen adsorption at liquid-nitrogen temperature (−196.15oC). The samples were degassed at 120 °C for 12 hours before the surface measurement. The total surface area was determined by the physical absorption of N2 gas on to the particle surface 30. A FEI 200kV Titan Themis Scanning Transmission Electron Microscope (S-TEM) was used to visualize the morphology of the particle, and Energy-dispersive X-ray spectroscopy (EDS) was used to measure the elemental (Si and O) content of the particle. ImageJ program (NIH) was used to measure the particle size from TEM images.
2.5. Adhesive Formation
The PEG-DA adhesive hydrogels were prepared following a previously published protocol 28. The adhesive was prepared by mixing equal volume of the adhesive precursor solution (300 mg ml−1 of PEG-DA in 2×PBS at pH 7.4) and NaIO4 solution (54.5 mM in DI water). The final concentration of PEG-DA was 150 mg ml−1. The Si particle incorporated composite adhesives were formed in a similar manner with the addition of 20 wt% of the corresponding Si particles into the PEG-DA precursor solution. The final concentration of the particles in the composite adhesive was 10 wt%. The final NaIO4 to dopamine molar ratio was 0.5 for all adhesive formulations. To determine the gelation time of the hydrogels, 200 μl of the mixed solution was introduced into a 1.5 ml scintillated vial. The time it took for the mixture to cease flowing in a tilted vial was determined as the cure time 27. Unless specified otherwise, the adhesive was cured in between two borosilicate glass sheets with a silicon rubber mold (width = 4 cm, height = 4 cm, thickness = 1.5 mm) for 24 hours. The cured adhesive sheet was cut into disk shapes using a tissue punch with a diameter of 10 mm to create hydrogel disks with a diameter of 10 mm and a thickness of 1.5 mm. The hydrogel disks were further equilibrated in PBS (pH = 7.4) before additional characterization. Adhesive formulations containing NSi, HSi, and AHSi are denoted as PEG-NSi PEG-HSi and PEG-AHSi, respectively.
2.6. Physical and Chemical Characterization of the Adhesive
Samples were freeze-dried for at least 48 hours and characterized using Fourier transform infrared (FTIR) spectroscopy (Perkin Elmer Spectrum One with DLATGS detector) with a single bounce attenuated total reflectance (ATR) unit (PIKE Technologies, diamond internal reflection element (IRE) GladiATR). The scan rate was set at 800 scans/minutes with a resolution of 1 cm-1. The FTIR experiments were done at ambient conditions. In vitro degradation behavior of adhesive disks (n = 3) was determined by incubating the samples in 5 ml of PBS (pH = 7.4) at 37 °C and tracking their remaining mass (Mr) over 8 weeks. The hydrogel discs were equilibrated overnight before the degradation experiment started to ensure stable initial weight. The discs were then dried under vacuum for at least 48 hours. Dry weight was used to determine the degradation rate using the following equation:
| (1) |
where M0 and Mt are the initial mass of the adhesive and its mass after incubation for a given amount of time, respectively 6. The PBS solution was replaced every 7 days.
To determine the concentration of soluble silica released from the adhesive, fully cured samples (n = 3 for each group) were incubated in 1 mL of 1×PBS (pH 7.4) in a polystyrene container for 2 weeks. The PBS extracts were diluted by adding deionized water to 10 mL in a polystyrene centrifuge tube prior to testing. The diluted extract was then evaluated for silica content using inductively coupled plasma optical emission spectroscopy (ICP-OES; Perkin Elmer Optima 7000DV) utilizing a cross-flow nebulizer (plasma 15 mL min−1, auxiliary 0.2 mL min−1, nebulizer 0.80 mL min−1, RF power 1,350 W, pump speed 1.5 ml min−1) Instrument Calibration Standard 3 (Perkin Elmer) was used to create the calibration standards. Three samples per formulation were collected and each sample was analyzed three times.
An oscillatory rheometer (Discovery Hybrid Rheometer HR2; TA instruments, Newcastle DE) was used to determine the storage (G′) and loss (G″) moduli of the cured adhesive samples. Strain sweep experiment was performed by subjecting disk-shaped samples (n = 3) to a strain of 0.01–100% at a frequency of 0.1 Hz using a parallel plate setup at ambient temperature. The gap distance was set at 87.5% of the thickness of each individual hydrogel, to ensure sufficient traction during the rheometry experiment. 1 ml of pH 7.4 PBS was introduced around the composite adhesive to prevent dehydration. Lap shear adhesion test was performed using bovine pericardium while following a previously published protocol according to ASTM standard F2255–05 28. Strips of pericardium tissues (2.5 cm × 2.5 cm) were kept moist in PBS. 100 μl of PEG-DA precursor solution and NaIO4 solution with and without Si particles were mixed in a scintillated glass vial before being transferred on to the surface of the tissue. Another piece of pericardium tissue was applied over the adhesive to create an adhesive joint (overlapping area of 2.5 cm2), which was compressed with a 100-g weight for 15 min. The adhesive joint was submerged in PBS (pH = 7.4) at 37 °C for overnight prior to testing. A digital caliper was used to measure the dimensions of the overlapped area of each adhesive joint before testing. The fixation of the tissue pieces on to the test stage was done with serrated metal grips to ensure sufficient traction. An Electroforce® machine (Bose Electroforce Group, MN) was used to pull apart the adhesive joint to failure at a rate of 0.1 mm s−1. The adhesive strength was determined by the maximum load divided by the initial overlapped area of the adhesive joint.
2.7. In vitro Cell Viability
The cell viability experiment was performed following a previously published protocol with modifications 28. A quantitative MTT assay was used to determine the relative viability of cells exposed to the adhesives and their extracts, while following ISO 10993–5 guideline 27. Microfiltration was utilized as a sterilization method. The PEG-DA precursor solution and NaIO4 solution were filtered with a 0.2 μm polyethersulfone syringe filter (VWR International, USA). The particles were sterilized using ethylene oxide in a microcentrifuge tube. Adhesive extracts were prepared by forming hydrogel discs (diameter = 10 mm and thickness = 1.5 mm, n=3) as described above, followed by incubating each disc in 1 ml of cell-specific culture medium for 24 hours at 37°C. RDF, HEK, and HT were suspended in their cell-specific culture medium. Cell suspensions were then added to a 96-well microculture plate at a density of 1,000, 2,000, and 2,000 cells/well, respectively. Varying amount of culture medium was added to each well to maintain the culture medium volume of each well to 100 μl. The cells were incubated in a humidified incubator (37 °C, 5% CO2) for 24 hours to obtain a confluent monolayer of cells. A light microscope (Olympus, PA) was used to observe the monolayer to ensure the confluence level. Then, the medium was replaced with 100 μl of the adhesive extract. After incubation for 24 hours, the medium was removed and replaced with 50 μl of MTT solution (1 mg ml−1 in pH 7.4 PBS) and further incubated for another 2 hours. After the 2-hour incubation, the MTT solution was replaced by 100 μl of DMSO to dissolve formazan crystals. The absorbance of each well was measured at 570 nm (reference 650 nm) using a Synergy HT Multi-Mode Microplate Reader (BioTek, USA). The relative cell viability was calculated by dividing the average absorbance value of the sample from that of cells cultured in the culture medium after subtraction of the absorbance background of untreated culture medium 6.
2.8. In vitro Cell Proliferation
All experiments were performed with a Transwell set up to ensure the continuous exposure of the cells to the composite adhesive. Ki-67 and DAPI fluorescence staining were performed to analyze the proliferation of cells exposed to the adhesive placed in Transwell inserts. NaIO4 (160 μl) and sterile adhesive precursor solution (1:1 v/v) was introduced into a circular silicone mold with a dimension of 10 mm x 1 mm. The mixed solution was left to gel for 5 minutes before being transferred into Transwell inserts. RDF, HEK, and HT were seeded into 12-well Transwell-compatible plates at a density of 5,000, 20,000, and 20,000 cells/well, respectively. The cells were incubated (37 °C, 5% CO2) for 24 hours to obtain a 60–75% confluent monolayer of cells. A light microscope (Olympus, PA) was used to observe the monolayer to ensure the confluence level. The culture medium was removed before the Transwell inserts were introduced. Fresh medium (1ml) was added. Transwell inserts were removed after 24 hours of incubation along with the culture medium. Cells were fixed using a 1% paraformaldehyde solution for 15 minutes and permeabilized using a 1% Tween20 solution. The solution was removed, and the cells were washed with a treatment solution of 0.1% Triton X-100. After the treatment solution was removed, the primary Ki-67 antibody solution (1:1,000) was introduced and incubated at room temperature for 45 minutes before being washed 3 times by the washing medium for 5 minutes each. The washing medium was removed, then Alexa Fluor 488 green fluorescence stain was introduced for 45 minutes before being wash 3 times with the washing medium for 5 minutes each. The washing medium was removed, and the DAPI solution (1:1,000) was introduced for 5 minutes before being washed 3 times using the washing medium for 5 minutes each. The washing medium was removed, and the cells were analyzed via fluorescence microscopy using an automated microscope (EVOS, Fisher). Ki-67 positive cells and cell nuclei fluoresced green and blue, respectively. The total cell counts were averaged from all 27 images of each formulation.
2.9. Statistical analysis
Statistical analysis was performed using SigmaPlot 14 software. One-way analysis of variance (ANOVA) with Tukey’s HSD analysis and Student’s t-test were performed for comparing means of multiple groups and two groups, respectively, using a p-value of 0.05.
3. Results and Discussion
3.1. Characterization of Si Particles
S-TEM was used to determine the particle size and morphology of each type of silica nano particle (SiNP) (Figure 1). NSi appeared dark with solid-like morphology. On the other hand, LSi, HSi, and AHSi were prepared with a quaternary ammonium surfactant, CTAB, and appeared lighter in color with porous structures. The particle size of NSi averaged around 660.6±52.63 nm, which was larger when compared to the porous particles (528.08±34.25 nm and 422.24±23.24 nm for LSi and HSi, respectively) (Figure 2). This result suggests that the incorporation of CTAB reduced the final particle size by reducing the microbubble size in the reaction solution through surface energy reduction 31, 32. In the case of AHSi, acid treatment did not significantly affect its particle size when compared to HSi.
Figure 1.

STEM images of non-porous silica nanoparticle (NSi) (A), porous silica nanoparticle (LSi) (B), highly porous silica nanoparticle (HSi) (C), and acid-heat treated highly porous silica nanoparticle (AHSi) (D). Scale bars are 50 nm.
Figure 2.

Particle size distribution of silica particles. * p<0.05 when compared to each other.
BET N2 sorption measurement demonstrated that the addition of CTAB during synthesis increases the total surface area of the particle (Figure 3). NSi exhibited the smallest surface area (13.72±0.26 m2/g) among all the SiNP, while the porous SiNP exhibited an order magnitude higher surface area (256.58±0.71, 327.45±5.51, and 386.75±5.19 m2/g for LSi, HSi, and AHSi, respectively). CTAB and other surfactants introduce porosity into the silica particle, creating a mesoporous particle as a result 31, 32. With an increasing amount of CTAB, the porosity increased as more porogen were introduced. Acid treatment after particle synthesis also significantly increased the pore volume in AHSi. The effect is directly linked to the removal of silicate groups from the particle surfaces as colloidal silicates during acid treatment 33. Hence, the newly exposed surface formed a multitude of hydroxylated silica groups under acid treatment 33, 34. S-TEM EDS analysis indicated that the composition of silica to oxygen ratio (S:O) decreased when HSi was treated with acid (Figure S4). The higher oxygen (O) content in AHSi indicated an increase in oxygen-silicon groups (i.e., Si=O, Si-OH, Si(OH)2, and Si(OH)3) on the surface of the particle.
Figure 3.

Surface area of Si particles determined using BET N2 sorption. *p<0.05 when compared with each other.
3.2. Effect of Silica Particle on H2O2 Decomposition
100μM of H2O2 was mixed with each type of SiNP, and the change in the concentration of H2O2 was evaluated using FOX assay (Figure 4). The concentration of H2O2 is set to mimic the H2O2 concentration in skin tissue after an injury (50–100 μM) 35. When treated with NSi, the relative concentration of H2O2 decreased slowly and over 80% of the initial amount of H2O2 remained even after 72 hrs of incubation. Increasing particle porosity and acid treatment further decreased H2O2 concentrations (62.26±1.05 and 35.12±4.05 μM at 72 hrs for HSi and AHSi, respectively). The accelerated degradation of H2O2 resulted from a combination of H2O2-Si-OH complexation on the surface and mild catalytic effect of silica on H2O2 degradation 25, 27. As a result, the increase in surface area of the silica particle through increased porosity combined with the change in surface chemistry led to a faster reduction in H2O2 concentration. However, these SiNP were not as effective as that of catalase, which completely decomposed H2O2 within 1 hr.
Figure 4.

Relative H2O2 concentration after incubation with Si particles or 1000 units of catalase at pH 7.4 and 37°C. The starting H2O2 concentration was 100 μM.
3.3. Preparation and Characterization of Composite Adhesives
Catechol moieties were oxidized by NaIO4, resulting in the crosslinking and polymerization of catechol (Figure S1). PEG-DA is end-modified with catechol and oxidative crosslinking of catechol resulted in the curing of PEG-DA. The gelation time for PEG-DA averaged around 36 s (Figure 5), when the precursor solution mixture stopped flowing in a tilted vial. Si particles were incorporated into PEG-DA to form composite adhesives. Incorporating NSi reduced the gelation time slightly (31±0.82 s for PEG-NSi). The PEG network likely formed physical entanglement with SiNP and catechol moiety can form hydrogen bonds with Si-OH 28, 36. These interactions contributed to the reduction in gelation time as a result of forming new crosslinking points within the adhesive network. Incorporating porous Si particles further reduced the gelation time (22±0.82 s and 21±0.82 s for PEG-HSi and PEG-AHSi, respectively). Increased particle surface area likely increased the number of interactions between catechol and the particle surface, effectively increased the rate of gelation.
Figure 5.

Gelation time of PEG-DA and its composite containing different silica particles. *p<0.05 when compared to PEG-DA. **p<0.05 when compared to PEG-DA and PEG-NSi.
ATR-FTIR spectra of the Si particles revealed Si–O-Si peaks at 1065 cm−1 (Si–O stretching) and 800 cm−1 (Si–O bending) as well as Si–OH bending peak at 950 cm−1 (Figure 6). The Si–OH peak intensity was noticeably increased for AHSi, which is in agreement with the EDS result (Figure S4). The spectrum of PEG-DA exhibited characteristic peaks corresponding to PEG (–C–O–C– at 1000–1150 cm−1, –CH2– at 2880 cm−1), carbonyl group in ester bond (1729 cm−1) and aromatic ring in catechol (1400–1500 cm−1) 28. Incorporating the Si particles resulted in shifts over the peaks associated with Si–O–Si (1030 cm−1 and 790 cm−1) and Si–OH (960 cm−1), confirming the presence of Si particles in the composite adhesives. The shifts may be attributed to the overlapped signal from PEG ether peaks (–C–O–C– at 1000–1150 cm−1)37. Additionally, the peaks associated with silica particle demonstrated reductions in intensity which indicated hydrogen bond formed between the Si–OH and catechol or the oxygen atom of –C–O–C– of PEG backbone.
Figure 6.

FTIR spectra of the Si particles (A) and PEG-DA containing the Si particles (B). Dash lines indicate (from left to right for A and B) Si-O-Si (1065 and 1030 cm−1), Si-OH (950 and 960 cm−1), and Si-O-Si (800 and 790 cm−1) peaks.
Oscillatory rheometry was utilized to assess the effect of Si particles on the viscoelastic properties of the adhesives (Figure 7). For all adhesive formulations, the storage modulus (G’) values exceeded those of the loss modulus (G”), indicating that these adhesive were chemically crosslinked 38. G’ values for PEG-DA at the linear viscoelastic range were measured to be approximately 4.9 kPa, and adding 10 wt% NSi particles significantly increased G’ (5.5 kPa for PEG-Si; p < 0.05 when compared PEG-DA). This increase in the stiffness of the adhesive network is potentially due to increased interactions between the Si particles and PEG-DA network 6, 28. Additionally, incorporation porous Si particles further increased G’ values (5.9 and 6.2 kPa for PEG-HSi and PEG-AHSi, respectively; p < 0.05 when compared PEG-DA and PEG-NSi). Additionally, the decrease in the particle size and increase in the effective surface area also contributed to the increased stiffness of PEG-DA composites 39. This suggests that increased particle surface area likely increased the number of interactions between catechol and the particle surface, effectively increased mechanical property of the composite adhesive. G” values for SiNP-containing composite adhesive were significantly higher when compared to that of PEG-DA. This result indicates that incorporating SiNP increased viscous dissipation properties likely through the formation of physical interactions within the adhesive network 6, 28.
Figure 7.

Storage (A) and loss (B) modulus of PEG-DA and its composite containing different silica particles.
Bovine pericardium was used as the test substrate in lap shear adhesion test (Figures 8 and S5). The adhesive strength for PEG-DA was measured to be 3.84±0.60 kPa. While it is difficult to compare reported values from other PEG-catechol adhesives due to differences in the method and substrate use, the values reported here are well within the range of 103-104 Pa which is similar to the storage modulus reported elsewhere for PEG-catechol adhesives 6, 28. This value increased with the addition of 10 wt% SiNP (4.97±1.00, 6.87±1.35, and 7.35±1.01 kPa for NSi, HSi, and AHSi, respectively). The addition of nanoparticles has been previously found to increase the adhesion strength in catechol-based adhesives 6, 28. Measured lap shear adhesion strength for PEG-AHSi was the highest. The increased surface area in these particles likely increased the availability of Si that can interact with catechol found in PEG-DA for forming hydrogen bonding. This resulted in an increased bulk mechanical property and subsequently the adhesive property. Similarly, elevated bulk mechanical property for PEG-HSi and PEG-AHSi (Figure 7) also contributed to enhanced measured lap shear strength.
Figure 8.

Lap shear adhesion strength of PEG-DA and its composite containing different silica particles using bovine pericardium as the test substrate. *p<0.05 when compared to PEG-DA. **p < 0.05 when compared to PEG-DA and PEG-NSi
In vitro degradation of the adhesive was studied by tracking the change in the dry mass of the fully crosslinked samples (Figure 9). PEG-DA degraded completely by week 8, which is in agreement with PEG-catechol adhesive with ester linkages28. Incorporating Si particles delayed the degradation of the composite adhesives. For PEG-AHSi, approximately 40% of its original dry mass remained even after 8 weeks of degradation, and the degradation rate was found to be approximately 8% per week. The delayed degradation is likely a result of an increase in mechanical integrity as well as localized pH reduction surrounding the silica particle 6, 28. As amorphous silica particle degrades, soluble silica species in the form of orthosilicic acid is released 40, which contributed to the delayed degradation of SiNP-containing adhesive. PEG-DA degrades trough the hydrolysis of the ester linkage between the glutaric acid and PEG 41, and the hydrolysis rate of ester bond is reduced in a mildly acidic pH 42.
Figure 9.

Normalized residual weight of PEG-DA and its composite containing different silica particles. The samples were incubated in PBS (pH 7.4) at 37 °C. *p<0.05 when compared to all other groups
ICP-OES was used to analyze the concentration of soluble Si released from Si particles (Figure 10). Soluble Si can be derived from hydroxylated silicon surface in the form of orthosilicic acid. PEG-NSi and PEG-HSi released less than 10 mg/L of Si over 24 hours, whereas PEG-AHSi released nearly 3 folds higher Si over the same period of time. This increased level of soluble Si suggests that acid treatment altered the surface chemistry of Si particle to form the more hydrophilic Si-OH functional group. We speculated that the nature of our particle synthesis resulted in noncrystalline particles which can react promptly to formed surface groups of Si-OH when being exposed to oxidizing species or, in some cases, deionized water 43. Additionally, the degradation rate of the silica particle was reported to be highly dependent on surface functional groups including SiOH, their protonated form (SiOH2+), and their deprotonated form (SiO-) 44. As a result, the increases in degradation products, soluble silica or silicic acid, were expected as the SiOH surface functional groups were increased after the acid treatment as demonstrated by the EDS results.
Figure 10.

Soluble Si content of PEG-DA and its composite containing different Si particles after 24 hour incubation in complete medium at pH 7.4 and 37°C. * p<0.05 when compared to all other groups
PEG-DA continuously generated H2O2 and reaching a maximum concentration of nearly 60 μM 6 hours after mixing the precursor solutions (Figure 11). Although PEG-DA cured around 36 s (Figure 5), catechol can continue to polymerize to form oligomers consisted of 6–7 catechol residues and generate H2O2 during catechol oxidative crosslinking 5, 10. The oxidation of catechol produced superoxide which can participate to further oxidize other catechol groups (Figure S1). The generated superoxide can further oxidize catechol or interact with protons (H+) in the surrounding media to form H2O2. After catechol ceased to undergo oxidative crosslinking, PEG-DA ceased to generate H2O2, and the amount of H2O2 released from the adhesive decreased 10. Adding SiNP had minimal effect on the measured H2O2 concentration. However, adding the porous HSi and acid-treated AHSi drastically reduced the amount of the released H2O2 (44.27±1.50 μM and 34.30±1.83 μM for PEG-HSi and PEG-AHSi, respectively, at 6-hour time point). This result indicated that incorporating Si particles with enhanced surface area and surface modification can effectively reduce the amount of H2O2 generated during catechol crosslinking.
Figure 11.

H2O2 concentration of PEG-DA and its composite containing different Si particles. * p<0.05 when compared to all other groups. ** p<0.05 when compared to PEG-DA and PEG-NSi
3.4. Effect of Incorporating Si Particle in PEG-DA on Cellular Response
The effect of incorporating Si particles into PEG-DA on the cell viability and proliferation of primary fibroblast, keratinocyte, and tenocyte was investigated. For fibroblast and tenocyte, PEG-DA reduced the relative cell viability to around 85% when compared to the media control (Figure 12), and the incorporation of AHSi particle significantly improves cell viability (> 95%). This is presumably due to the reduced concentration of H2O2 released from PEG-AHSi. Interestingly, there was no difference in the cell viability for keratinocyte when exposed to the three different adhesive formulations. Keratinocytes are more resistant to oxidative stress and can actively degrade ROS 45. Keratinocyte viability was high even when it was exposed to PEG-DA, which generated the highest concentration of H2O2 among the adhesive formulation tested. An MTT assay was used to determine cell viability and normalized by cells that were exposed to the cell culture medium. The result demonstrated that keratinocytes, which were exposed to the adhesive extracts, had higher relative MTT signal when compared to control. This increase in relative MTT signal was not observed in RDF and HT. Specifically, keratinocytes exposed to the 3 adhesive formulations exhibited 30% higher MTT absorption than the control cells, indicating that exposure to H2O2 likely increases keratinocyte proliferation 45.
Figure 12.

MTT signal relative to culture medium control for primary rat dermal fibroblast (A), human epidermal keratinocytes (B), and human tenocyte (C) after incubated with PEG-DA and its composite containing different Si particles for 24 hours in complete medium at pH 7.4 and 37°C. *p<0.05 when compared to PEG-DA. ** p<0.05 when compared to all other groups, respectively.
Ki-67 expression was utilized to determine the number of proliferating cells after exposure to the adhesive formulation (Figure 13). For all cell types tested, cells exposed to PEG-DA exhibited the lowest fraction of proliferating cells, which increased with the incorporation of porous Si particles. Cells exposed to PEG-AHSi exhibited the highest level cell proliferation, a 3–4 fold increase when compared to cells exposed to PEG-DA. Among the particles fabricated, AHSi releases the highest amount of soluble Si (Figure 10), which contributed to the observed increase in cell proliferation 46, 47. The cellular proliferation effect was not localized (Figure S6), potentially due to the rapid diffusion of soluble Si in the culture 48. Additionally, AHSi also significantly reduced the concentration of H2O2 generated by catechol, which effectively promoted cell survival.
Figure 13.

Percentage of cells that were Ki-67 positive and the total cell count for primary rat dermal fibroblast (A), human epidermal keratinocyte (B), and human tenocyte (C) exposed to adhesive for 24 hours in complete medium at pH 7.4 and 37°C. * p<0.05 when compared to all other groups
Taken together, SiNP with increased porosity and modified surface chemistry was utilized to control H2O2 generated during the curing process of catechol-based adhesive. SiNP functioned as a filler in the composite adhesive and effectively increased its crosslinking density and materials property. Most interestingly, these particles and their composites were nearly chemically identical. However, the cellular response to these materials was drastically different. Specifically, tenocytes are typically exposed to an environment with low oxidative stress due to ischemic localized tissue compression in tendons as well as the lack of vascularization in the native tissue 49, 50. Exposure to reduced concentrations of H2O2 increased the cell viability and proliferation of tenocyte. On the other hand, keratinocytes can actively degrade ROS, and H2O2 has been previously demonstrated to promote keratinocyte proliferation and migration 45. Keratinocyte demonstrated cell viability that was independent of the concentration of the released H2O2. Our study points to the need to control H2O2 concentration depending on the desired application. Depending on the biological system, the response to the released H2O2 will likely be significantly different.
When compared to catalytic metal oxide and ions, SiNP provides a biocompatible alternative to decompose H2O2. Although SiNP demonstrated reduced capability in degrading H2O2 when compared to catalase, SiNP reported here provided added benefits besides catalyzing the degradation of H2O2. Degradation product of SiNP mainly consists of silicic acid, which are present in various tissues (e.g., bone and tendon) or organs (e.g., liver and kidney) 51, 52. Silicic acid can also promote collagen synthesis and osteoblast differentiation in vitro 53, 54. Soluble Si has also demonstrated the ability to promote cell proliferation and migration, and accelerate dermal wound closure 46, 47. PEG-AHSi released the highest amount of soluble Si, which contributed to the highest Ki-67 expression in all three cell types that we tested. The incorporation of surface-treated SiNP is potentially a facile and economical method to control H2O2 concentration while improving the biocompatibility and adhesive performance of a PEG-based adhesive. Additionally, by better controlling the concentration of H2O2 generated during the crosslinking process of catechol-based adhesive, it can potentially enable these adhesives for cell-engineering or cell delivery applications involving cells that are sensitive to elevated oxidative stress.
4. Conclusion
In conclusion, increased porosity and acid treatment of SiNP greatly enhanced its ability to decompose H2O2. When these SiNP were incorporated into PEG-DA, the amount of released H2O2 was also significantly reduced. Additionally, incorporating these particles increased lap shear adhesion strength, storage modulus, and altered the adhesive degradation behavior. Furthermore, these SiNP increased the cell viability of primary dermal fibroblasts and tenocytes, and the proliferation rate of these cells and keratinocytes. Ultimately, incorporation of porous and acid-treated SiNP can be a useful approach to simultaneously modulate the concentration of H2O2 while increasing the adhesive performance of catechol-based adhesives.
Supplementary Material
5. Acknowledgments
This project was supported by the National Institutes of Health under award numbers R15GM104846 (BPL), R15GM135875 (BPL), R15GM112082 (RMR), and R15GM137298 (RMR), the Office of the Assistant Secretary of Defense for Health Affairs through the Defense Medical Research and Development Program under award number W81XWH181061 (BPL), and Portage Health Foundation Research Seed Grant (BPL). RP was supported in part by the Royal Thai Government Scholarship. PKF and RP were supported in part by the Doctoral Finishing Fellowship provided by the Portage Health Foundation. The ASAP 2000 sorptometer device was supported by the U.S. National Science Foundation under the award number CMMI 1661699 (YHH). The authors acknowledge the Applied Chemical and Morphological Analysis Laboratory at Michigan Tech for the use of the instruments and staff assistance.
Footnotes
Supporting information
Schematic representation of crosslinking and H2O2 mechanism of PEG-DA, NMR spectra of PEG-DA, Schematic representation of step-by-step preparation of the nanoparticles and their modification, S-TEM-EDS elemental analysis on Si particles, Representative load-displacement curves from lap shear experiment for the adhesives, Fluorescence images of cells stained with KI67 and DAPI on RDF, HEK, and HT
Publisher's Disclaimer: “Just Accepted” manuscripts have been peer-reviewed and accepted for publication. They are posted online prior to technical editing, formatting for publication and author proofing. The American Chemical Society provides “Just Accepted” as a service to the research community to expedite the dissemination of scientific material as soon as possible after acceptance. “Just Accepted” manuscripts appear in full in PDF format accompanied by an HTML abstract. “Just Accepted” manuscripts have been fully peer reviewed, but should not be considered the official version of record. They are citable by the Digital Object Identifier (DOI®). “Just Accepted” is an optional service offered to authors. Therefore, the “Just Accepted” Web site may not include all articles that will be published in the journal. After a manuscript is technically edited and formatted, it will be removed from the “Just Accepted” Web site and published as an ASAP article. Note that technical editing may introduce minor changes to the manuscript text and/or graphics which could affect content, and all legal disclaimers and ethical guidelines that apply to the journal pertain. ACS cannot be held responsible for errors or consequences arising from the use of information contained in these “Just Accepted” manuscripts.
Reference
- 1.Lee BP; Messersmith PB; Israelachvili JN; Waite JH, Mussel-Inspired Adhesives and Coatings. Annual Review of Materials Research 2011, 41, 99–132. [DOI] [PMC free article] [PubMed] [Google Scholar]
- 2.Ahn BK, Perspectives on Mussel-Inspired Wet Adhesion. J. Am. Chem. Soc. 2017, 139 (30), 10166–10171. [DOI] [PubMed] [Google Scholar]
- 3.Kord Forooshani P; Lee BP, Recent approaches in designing bioadhesive materials inspired by mussel adhesive protein. Journal of Polymer Science Part A: Polymer Chemistry 2017, 55 (1), 9–33. [DOI] [PMC free article] [PubMed] [Google Scholar]
- 4.Zhang W; Wang R; Sun Z; Zhu X; Zhao Q; Zhang T; Cholewinski A; Yang F; Zhao B; Pinnaratip R; Forooshani PK; Lee BP, Catechol-functionalized hydrogels: biomimetic design, adhesion mechanism, and biomedical applications. Chem Soc Rev 2020, 49 (2), 433–464. [DOI] [PMC free article] [PubMed] [Google Scholar]
- 5.Lee BP; Dalsin JL; Messersmith PB, Synthesis and Gelation of DOPA-Modified Poly(ethylene glycol) Hydrogels. Biomacromolecules 2002, 3 (5), 1038–47. [DOI] [PubMed] [Google Scholar]
- 6.Liu Y; Meng H; Konst S; Sarmiento R; Rajachar R; Lee BP, Injectable Dopamine-Modified Poly(Ethylene Glycol) Nanocomposite Hydrogel with Enhanced Adhesive Property and Bioactivity. ACS Applied Materials & Interfaces 2014, 6 (19), 16982–92. [DOI] [PMC free article] [PubMed] [Google Scholar]
- 7.Mehdizadeh M; Weng H; Gyawali D; Tang L; Yang J, Injectable citrate-based mussel-inspired tissue bioadhesives with high wet strength for sutureless wound closure. Biomaterials 2012, 33 (32), 7972–7983. [DOI] [PMC free article] [PubMed] [Google Scholar]
- 8.Brubaker CE; Kissler H; Wang L.-j.; Kaufman DB; Messersmith PB, Biological performance of mussel-inspired adhesive in extrahepatic islet transplantation. Biomaterials 2010, 31 (3), 420–427. [DOI] [PMC free article] [PubMed] [Google Scholar]
- 9.Brubaker CE; Messersmith PB, Enzymatically Degradable Mussel-Inspired Adhesive Hydrogel. Biomacromolecules 2011, 12 (12), 4326–4334. [DOI] [PMC free article] [PubMed] [Google Scholar]
- 10.Meng H; Liu Y; Lee BP, Model polymer system for investigating the generation of hydrogen peroxide and its biological responses during the crosslinking of mussel adhesive moiety. Acta Biomaterialia 2017, 48, 144–56. [DOI] [PMC free article] [PubMed] [Google Scholar]
- 11.Kim Y-W; Byzova TV, Oxidative stress in angiogenesis and vascular disease. Blood 2014, 123 (5), 625–631. [DOI] [PMC free article] [PubMed] [Google Scholar]
- 12.Stone JR; Yang S, Hydrogen peroxide: a signaling messenger. Antioxidants & redox signaling 2006, 8 (3–4), 243–270. [DOI] [PubMed] [Google Scholar]
- 13.Gough D; Cotter T, Hydrogen peroxide: a Jekyll and Hyde signalling molecule. Cell death & disease 2011, 2 (10), e213. [DOI] [PMC free article] [PubMed] [Google Scholar]
- 14.Roy S; Khanna S; Nallu K; Hunt TK; Sen CK, Dermal Wound Healing Is Subject to Redox Control. Mol Ther 2006, 13 (1), 211–220. [DOI] [PMC free article] [PubMed] [Google Scholar]
- 15.Kessler L; Bilbault P; Ortega F; Grasso C; Passemard R; Stephan D; Pinget M; Schneider F, Hyperbaric oxygenation accelerates the healing rate of nonischemic chronic diabetic foot ulcers: a prospective randomized study. Diabetes care 2003, 26 (8), 2378–82. [DOI] [PubMed] [Google Scholar]
- 16.Baldry MGC, The bactericidal, fungicidal and sporicidal properties of hydrogen peroxide and peracetic acid. Journal of Applied Bacteriology 1983, 54 (3), 417–423. [DOI] [PubMed] [Google Scholar]
- 17.Loo AEK; Wong YT; Ho R; Wasser M; Du T; Ng WT; Halliwell B, Effects of Hydrogen Peroxide on Wound Healing in Mice in Relation to Oxidative Damage. PLoS ONE 2012, 7 (11), e49215. [DOI] [PMC free article] [PubMed] [Google Scholar]
- 18.Brian N; Ahswin H; Smart N; Bayon Y; Wohlert S; Hunt JA, Reactive Oxygen Species (ROS)-A Family of Fate Deciding Molecules Pivotal in Constructive Inflammation and Wound Healing. European Cells and Materials 2012, 24, 249–265. [DOI] [PubMed] [Google Scholar]
- 19.Lin S-S; Gurol MD, Catalytic decomposition of hydrogen peroxide on iron oxide: kinetics, mechanism, and implications. Environmental Science & Technology 1998, 32 (10), 1417–1423. [Google Scholar]
- 20.Lousada CM; Johansson AJ; Brinck T; Jonsson M, Mechanism of H2O2 decomposition on transition metal oxide surfaces. The Journal of Physical Chemistry C 2012, 116 (17), 9533–9543. [Google Scholar]
- 21.Lewinski N; Colvin V; Drezek R, Cytotoxicity of nanoparticles. small 2008, 4 (1), 26–49. [DOI] [PubMed] [Google Scholar]
- 22.Egorova KS; Ananikov VP, Toxicity of metal compounds: knowledge and myths. Organometallics 2017, 36 (21), 4071–4090. [Google Scholar]
- 23.Aebi H, [13] Catalase in vitro. In Methods in enzymology, Elsevier: 1984; Vol. 105, pp 121–126. [DOI] [PubMed] [Google Scholar]
- 24.Betancor L; Hidalgo A; Fernández Lorente G; Mateo C; Fernández Lafuente R; Guisan JM, Preparation of a stable biocatalyst of bovine liver catalase using immobilization and postimmobilization techniques. Biotechnology progress 2003, 19 (3), 763–767. [DOI] [PubMed] [Google Scholar]
- 25.Hiroki A; LaVerne JA, Decomposition of hydrogen peroxide at water− ceramic oxide interfaces. The Journal of Physical Chemistry B 2005, 109 (8), 3364–3370. [DOI] [PubMed] [Google Scholar]
- 26.Żeglin J; Piotrowski GP; Piękos R, A study of interaction between hydrogen peroxide and silica gel by FTIR spectroscopy and quantum chemistry. Journal of molecular structure 2006, 794 (1–3), 83–91. [Google Scholar]
- 27.Żegliński J; Cabaj A; Strankowski M; Czerniak J; Haponiuk JT, Silica xerogel–hydrogen peroxide composites: Their morphology, stability, and antimicrobial activity. Colloids and Surfaces B: Biointerfaces 2007, 54 (2), 165–172. [DOI] [PubMed] [Google Scholar]
- 28.Pinnaratip R; Meng H; Rajachar RM; Lee BP, Effect of incorporating clustered silica nanoparticles on the performance and biocompatibility of catechol-containing PEG-based bioadhesive. Biomedical Materials 2018, 13 (2), 025003. [DOI] [PMC free article] [PubMed] [Google Scholar]
- 29.Yu Q; Wang P; Hu S; Hui J; Zhuang J; Wang X, Hydrothermal synthesis of hollow silica spheres under acidic conditions. Langmuir 2011, 27 (11), 7185–7191. [DOI] [PubMed] [Google Scholar]
- 30.Walton KS; Snurr RQ, Applicability of the BET method for determining surface areas of microporous metal− organic frameworks. Journal of the American Chemical Society 2007, 129 (27), 8552–8556. [DOI] [PubMed] [Google Scholar]
- 31.Wu S-H; Mou C-Y; Lin H-P, Synthesis of mesoporous silica nanoparticles. Chemical Society Reviews 2013, 42 (9), 3862–3875. [DOI] [PubMed] [Google Scholar]
- 32.Qiao Z-A; Zhang L; Guo M; Liu Y; Huo Q, Synthesis of mesoporous silica nanoparticles via controlled hydrolysis and condensation of silicon alkoxide. Chemistry of Materials 2009, 21 (16), 3823–3829. [Google Scholar]
- 33.El Mourabit S; Guillot M; Toquer G; Cambedouzou J; Goettmann F; Grandjean A, Stability of mesoporous silica under acidic conditions. Rsc Advances 2012, 2 (29), 10916–10924. [Google Scholar]
- 34.Han Y; Mayer D; Offenhäusser A; Ingebrandt S, Surface activation of thin silicon oxides by wet cleaning and silanization. Thin Solid Films 2006, 510 (1–2), 175–180. [Google Scholar]
- 35.van der Vliet A; Janssen-Heininger Y. M. J. J. o. c. b., Hydrogen peroxide as a damage signal in tissue injury and inflammation: murderer, mediator, or messenger? 2014, 115 (3), 427–435. [DOI] [PMC free article] [PubMed] [Google Scholar]
- 36.Thostenson ET; Li C; Chou T-W, Nanocomposites in context. Composites science and technology 2005, 65 (3–4), 491–516. [Google Scholar]
- 37.Li J; He L; Liu T; Cao X; Zhu H. J. S. e. m.; cells s., Preparation and characterization of PEG/SiO2 composites as shape-stabilized phase change materials for thermal energy storage. 2013, 118, 48–53. [Google Scholar]
- 38.Liu Y; Meng H; Qian ZC; Fan N; Choi WY; Zhao F; Lee BP, A Moldable Nanocomposite Hydrogel Composed of a Mussel-Inspired Polymer and a Nanosilicate as a Fit-to-Shape Tissue Sealant. Angew Chem Int Edit 2017, 56 (15), 4224–4228. [DOI] [PMC free article] [PubMed] [Google Scholar]
- 39.Fu S-Y; Feng X-Q; Lauke B; Mai Y-W, Effects of particle size, particle/matrix interface adhesion and particle loading on mechanical properties of particulate–polymer composites. Composites Part B: Engineering 2008, 39 (6), 933–961. [Google Scholar]
- 40.Finnie KS; Waller DJ; Perret FL; Krause-Heuer AM; Lin HQ; Hanna JV; Barbé C. J. J. J. o. s.-g. s.; technology, Biodegradability of sol–gel silica microparticles for drug delivery. 2009, 49 (1), 12–18. [Google Scholar]
- 41.Lin M-H; Anderson J; Pinnaratip R; Meng H; Konst S; DeRouin AJ; Rajachar R; Ong KG; Lee BP, Monitoring the Long-Term Degradation Behavior of Biomimetic Bioadhesive using Wireless Magnetoelastic Sensor. Biomedical Engineering, IEEE Transactions on 2015, 62 (7), 1838–1842. [DOI] [PMC free article] [PubMed] [Google Scholar]
- 42.van Dijk-Wolthuis WNE; van Steenbergen MJ; Underberg WJM; Hennink WE, Degradation kinetics of methacrylated dextrans in aqueous solution. J. Pharm. Sci. 1997, 86 (4), 413–417. [DOI] [PubMed] [Google Scholar]
- 43.Kang RH; Lee SH; Kang S; Kang J; Hur JK; Kim DJM, Systematic Degradation Rate Analysis of Surface-Functionalized Porous Silicon Nanoparticles. 2019, 12 (4), 580. [DOI] [PMC free article] [PubMed] [Google Scholar]
- 44.Moghaddam SPH; Mohammadpour R; Ghandehari H. J. J. o. C. R., In vitro and in vivo evaluation of degradation, toxicity, biodistribution, and clearance of silica nanoparticles as a function of size, porosity, density, and composition. 2019, 311, 1–15. [DOI] [PMC free article] [PubMed] [Google Scholar] [Retracted]
- 45.Loo AEK; Halliwell B, Effects of hydrogen peroxide in a keratinocyte-fibroblast co-culture model of wound healing. Biochemical and Biophysical Research Communications 2012, 423 (2), 253–258. [DOI] [PubMed] [Google Scholar]
- 46.Quignard S; Coradin T; Powell JJ; Jugdaohsingh RJC; Biointerfaces SB, Silica nanoparticles as sources of silicic acid favoring wound healing in vitro. 2017, 155, 530–537. [DOI] [PubMed] [Google Scholar]
- 47.Grotheer V; Goergens M; Fuchs PC; Dunda S; Pallua N; Windolf J; Suschek CV, The performance of an orthosilicic acid-releasing silica gel fiber fleece in wound healing. Biomaterials 2013, 34 (30), 7314–7327. [DOI] [PubMed] [Google Scholar]
- 48.Applin KR, The diffusion of dissolved silica in dilute aqueous solution. Geochimica et Cosmochimica Acta 1987, 51 (8), 2147–2151. [Google Scholar]
- 49.Rempel D; Abrahamsson S-O, The effects of reduced oxygen tension on cell proliferation and matrix synthesis in synovium and tendon explants from the rabbit carpal tunnel: an experimental study in vitro. Journal of Orthopaedic Research 2001, 19 (1), 143–148. [DOI] [PubMed] [Google Scholar]
- 50.Chen J-H; Jones RH; Tarry-Adkins J; Smith NH; Ozanne SE, Adverse effects of reduced oxygen tension on the proliferative capacity of rat kidney and insulin-secreting cell lines involve DNA damage and stress responses. Experimental Cell Research 2008, 314 (16), 3075–3080. [DOI] [PMC free article] [PubMed] [Google Scholar]
- 51.Alexander GB; Heston W; Iler RK, The solubility of amorphous silica in water. The Journal of Physical Chemistry 1954, 58 (6), 453–455. [Google Scholar]
- 52.Chen S-L; Dong P; Yang G-H; Yang J-J, Kinetics of formation of monodisperse colloidal silica particles through the hydrolysis and condensation of tetraethylorthosilicate. Industrial & engineering chemistry research 1996, 35 (12), 4487–4493. [Google Scholar]
- 53.Carlisle EM, Silicon: A Possible Factor in Bone Calcification. Science 1970, 167 (3916), 279–280. [DOI] [PubMed] [Google Scholar]
- 54.Reffitt DM; Ogston N; Jugdaohsingh R; Cheung HFJ; Evans BAJ; Thompson RPH; Powell JJ; Hampson GN, Orthosilicic acid stimulates collagen type 1 synthesis and osteoblastic differentiation in human osteoblast-like cells in vitro. Bone 2003, 32 (2), 127–135. [DOI] [PubMed] [Google Scholar]
Associated Data
This section collects any data citations, data availability statements, or supplementary materials included in this article.