

Abstract
Sphingolipids constitute a heterogeneous lipid category that is involved in many key cellular functions. For high-throughput analyses of sphingolipids, tandem mass spectrometry (MS/MS) is the method of choice, offering sufficient sensitivity, structural information, and quantitative precision for detecting hundreds to thousands of species simultaneously. While glycerolipids and phospholipids are predominantly non-hydroxylated, sphingolipids are typically dihydroxylated. However, species containing one or three hydroxylation sites can be detected frequently. This variability in the number of hydroxylation sites on the sphingolipid long-chain base and the fatty acyl moiety produces many more isobaric species and fragments than for other lipid categories. Due to this complexity, the automated annotation of sphingolipid species is challenging, and incorrect annotations are common. In this study, we present an extension of the Lipid Data Analyzer (LDA) “decision rule set” concept that considers the structural characteristics that are specific for this lipid category. To address the challenges inherent to automated annotation of sphingolipid structures from MS/MS data, we first developed decision rule sets using spectra from authentic standards and then tested the applicability on biological samples including murine brain and human plasma. A benchmark test based on the murine brain samples revealed a highly improved annotation quality as measured by sensitivity and reliability. The results of this benchmark test combined with the easy extensibility of the software to other (sphingo)lipid classes and the capability to detect and correctly annotate novel sphingolipid species make LDA broadly applicable to automated sphingolipid analysis, especially in high-throughput settings.
Sphingolipids are commonly found in most eukaryotic cells1 as well as in plants,2 fungi,3,4 and some lower organisms.5 They are abundantly present in eukaryotic cell membranes relative to intracellular organelle membranes.6 Sphingolipids not only have an important function as structural components of cell membranes but are also recognized as essential regulators of cellular processes and functions.7 They are found to be enriched in microdomains of the plasma membrane, generally referred to as lipid rafts that constitute platforms for transmembrane signaling.8 Sphingolipids are also compartmentalized into intracellular organelles and together they exert defined bioactive functions in various aspects of cell biology.9
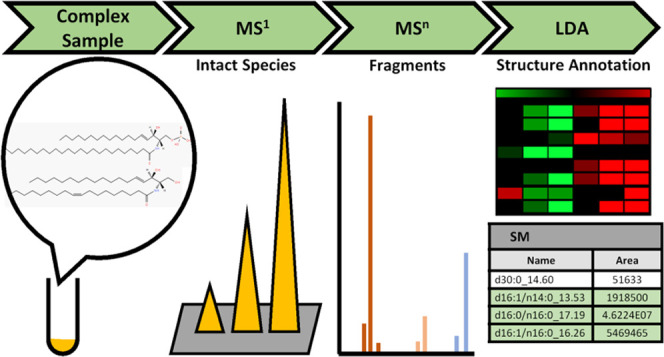
The biosynthesis of sphingolipids is initiated by the condensation of palmitate or a similar fatty acid with serine. The subsequent addition of a second fatty acid via an N-linkage is catalyzed by dihydroceramide synthase and yields dihydroceramide and, ultimately, ceramide in mammalian cells. Ceramide can serve as a precursor for a variety of complex lipids including sphingomyelin, and glycosphingolipids. Due to the structural diversity and high dynamic concentration range, the analysis of sphingolipids requires sensitive instrumentation and is typically performed by liquid chromatography and mass spectrometry (LC-MS). The complexity of the captured MS data from biological material requires computational approaches for the accurate identification and annotation of sphingolipids.
In a previous study, we presented the sensitive and reliable software solution Lipid Data Analyzer (LDA) for glycerolipids and phospholipids that works on platform-independent decision rule sets.10 Glycerolipids and phospholipids contain a backbone derived from glycerol, where one, two, or more fatty acyl and/or alkyl/1-alkenyl chains are attached. In contrast, sphingolipids contain a fatty acyl chain (FA) attached via an amide bond to a long-chain base (LCB). The sphingolipids can be further classified by the absence or presence of head groups, which are linked by an esterified hydroxylation site at the first carbon of the LCB (Figure 1). Throughout this paper, we use the standard lipid shorthand nomenclature,11 which identifies a lipid species (identification at the class level) by the number of hydroxylation sites (OH) and the total number of carbons and double bonds in the LCB and FA together (e.g., Cer d34:1). The term lipid molecular species (identification at the chain level) refers to the known LCB, FA, and number of OH on each, for example, Cer d18:1/n16:0. For the LCB moiety, m, d, t, and q correspond to one, two, three, and four OH groups, respectively, and for the FA moiety, we use an extension that was proposed by Sullards et al.,12 where n and h correspond to no and one OH group, respectively.
Figure 1.

Building blocks of sphingolipids exemplified by glucosylceramide (GlcCer d18:1/n16:0). Sphingolipids consist of a long-chain base (LCB—blue box), which is typically sphingosine (d18:1). For most sphingolipid subclasses, a fatty acyl chain is attached by an amide bond (FA—red box). Both the LCB and FA moieties can be hydroxylated (OH) at various positions. The OH site at position one of the LCB is often esterified to a head group (green box). A variety of chemical compounds might serve as head groups, including hexosyls and similar sugar structures, and give rise to an enormous variety of molecules, that is, glycosphingolipids.
Most sphingolipids found in mammalian cells contain the LCB sphingosine (d18:1).13 However, other LCBs exist in nature, particularly in plants,14 with varying numbers of carbon atoms and double bonds, as well as OH groups, which heavily influences the appearance of the MS/MS spectra (Figure 2). Furthermore, varying numbers of OH groups increase the number of isomeric and isobaric combinations of lipid species as well as the produced fragments. Hence, unambiguous determination of LCB and FA combinations is not possible when the annotation relies on a single characteristic fragment from collision-induced dissociation (CID) spectra. While there are several software packages available for sphingolipids that rely on spectral libraries, such as LipidBlast,15 LIQUID,16 LipiDex,17 LipidAnnotator,18 Lipid Search,19 and MS-DIAL,20 or rule-based approaches for calculating fragment masses, such as LipidMatch21 and LipidHunter,22 none of these solutions address the structural characteristics of sphingolipid subclasses arising from the prevalent variations in the number of OH groups.
Figure 2.

Tandem mass spectra of ceramides show different fragmentation patterns depending on the hydroxylation stage of the long-chain base (LCB). Spectra of protonated authentic ceramide standards that lost one water molecule are shown. The spectra were acquired on an Orbitrap Velos Pro, CID positive mode, 50%. (A) Monohydroxylated LCB (Cer m18:0/n24:1); (B) dihydroxylated LCB (Cer d18:0/n24:1); and (C) trihydroxylated LCB (Cer t18:0/n24:0). Fragments indicative of lipid subclass/adduct and LCB are colored brown and red, respectively. The difference in the observed fragments is a consequence of water losses; a higher hydroxylation of the LCB generates fragments with more water losses.
In this paper, we present an extension of the LDA’s decision rule set approach tailored for lipid subclasses with varying numbers of OH. We included the sphingolipid subclasses ceramides (Cer—an aggregate of the LIPID MAPS subclasses ceramides, dihydroceramides, and phytoceramides), ceramide-1-phosphates (Cer1P), cerebrosides (HexCer), lyso-sphingomyelins (LSM), sphingomyelins (SM), sphingoid bases (SphBase—an aggregate of the LIPID MAPS subclasses sphingosines, sphinganines, phytosphingosines, and sphingoid base homologues and variants, plus a subset of the subclass sphingoid base analogs), and sphingoid-1-phosphates (S1P). We demonstrate the ability to detect novel species by an analysis of murine brain and human plasma. Moreover, we verify our approach in a benchmark versus the software MS-DIAL.20 In summary, our newly developed LDA proved to be more accurate regarding identification and annotation of sphingolipids, and the concept of the rule sets was designed to identify novel species for discovery-driven studies.
Experimental Section
Sample Preparation
Sphingolipid standards were purchased from Avanti Polar Lipids, Inc. (Alabaster, Alabama). The standards were combined into two separate mixtures and diluted in 50/50 dichloromethane/methanol to 10 μM. The brain sample was from C57Bl/6 mice from Taconic Inc. (Hudson, NY). Fifty milligrams of brain tissue was homogenized into 1 mL of 10% methanol in water. Two hundred microliters of sample was used for analysis.
Control Experiments
Prior to LC-MS analysis, the sphingolipid mixtures were evaporated under a gentle stream of nitrogen and reconstituted in the same volume of the injection solvent isopropanol/chloroform/methanol (90:5:5, v/v/v).
Serum and Mouse Brain Samples
Lipid extraction was carried out from 50 μL of serum and 200 μL of homogenized mouse brain according to a modified version of the extraction protocol published by Matyash et al.23 Methanol (1.5 mL) and MTBE (5 mL) were added. After shaking for 10 s, the mixture was incubated in an ice-cooled ultrasound bath for 10 min. An overhead shaker was used for further 10 min. After addition of 1.25 mL of deionized water and 10 min of additional overhead shaking, the mixture was centrifuged for 10 min at 1350g, and the upper phase was transferred to a new glass tube. The lower phase was re-extracted with 2 mL of MTBE/methanol/deionized water (10:3:2.5, v/v/v), and the combined phases were brought to dryness in a vacuum centrifuge (Thermo Fisher Scientific, Waltham, MA). The residual lipids were dissolved in 500 μL of chloroform/methanol (1:1, v/v) for the serum samples and in 1000 μL of chloroform/methanol (1:1, v/v) for murine brain sample and were stored at −80 °C. Prior to analysis, the storage solvent was evaporated under a gentle stream of nitrogen and the samples were reconstituted in the same volume of isopropanol/chloroform/methanol (90:5:5, v/v/v).
LC Method
Chromatographic separation of sphingolipids was performed as previously described by Triebl et al.24 Briefly, a BEH C8 column (100 × 1 mm, 1.7 μm; Waters, Milford, MA) thermostated at 50 °C was used in a Dionex Ultimate 3000 RS UHPLC system. The mobile phase A consisted of deionized water containing 1 vol % of 1 M aqueous ammonium formate (final concentration: 10 mmol/L) and 0.1 vol % of formic acid as additives. The mobile phase B consisted of a mixture of acetonitrile/isopropanol 5:2 (v/v) containing the same additives. The gradient elution started at 50% mobile phase B, rising to 100% B over 15 min, held at 100% B for 10 min, and the column was then re-equilibrated with 50% B for 8 min before the next injection. The flow rate was 150 μL/min. The samples were kept at 8 °C, and the injection volume was 2 μL.
MS Method
An Orbitrap Velos Pro hybrid mass spectrometer (Thermo Fisher Scientific Inc., Waltham, MA) was operated in the data-dependent acquisition (DDA) mode. Five technical replicates of each sample were measured each in the positive and negative ion modes using a HESI II ion source. Ion source parameters for positive polarity were as follows: source voltage: 4.5 kV; source temperature: 275 °C; sheath gas: 25 arbitrary units; aux gas: 9 arbitrary units; sweep gas: 0 arbitrary units; and capillary temperature: 300 °C. Ion source parameters for negative polarity were as follows: source voltage: 3.8 kV; source temperature: 325 °C; sheath gas: 30 arbitrary units; aux gas: 10 arbitrary units; sweep gas: 0 arbitrary units; and capillary temperature: 300 °C. The automatic gain control target value was set to 106 ions to enter the mass analyzer, with a maximum ion accumulation time of 500 ms. Full scan profile spectra from m/z 210 to 1000 in the positive ion mode and from m/z 240 to 1000 in the negative ion mode were acquired in the Orbitrap mass analyzer at a resolution setting of 100 000 at m/z 400. For MS/MS experiments in both the positive and negative ion modes, the six most abundant ions (top 6) of the full scan spectrum were sequentially fragmented in the ion trap using He as collision gas (CID, normalized collision energy: 50; isolation width: 1.5; activation Q: 0.2; and activation time: 10) and centroid product spectra at normal scan rate (33 kDa/s) were collected. The exclusion time was set to 12 s. In the negative ion mode, an additional data-dependent neutral loss MS3 experiment type was used. The MS3 scan event exclusively selects ions from the MS/MS spectra showing the neutral loss fragments of m/z 46 and m/z 60 (neutral loss in top 6) to acquire chain information from formate adducts of the subclasses Cer, HexCer, LSM, and SM (settings for MS3 scans: CID, normalized collision energy: 50; isolation width: 1.5; activation Q: 0.2; and activation time: 10).
Benchmark
For the benchmark study, we compared the performance of the LDA software with that of MS-DIAL version 4.0.0.20 Details about data processing and the MS-DIAL parameters are given in Note S-1. In this benchmark test, we used data from the control experiment and murine brain, both acquired on the Orbitrap Velos Pro in CID in both ion modes at +50% and −50%, respectively. We used only lipid species and adducts that both LDA and MS-DIAL can detect. Correspondingly, only numbers of carbon atoms, double bond ranges, and OH stages were counted that were detectable by both applications, which necessarily limited the comparison to species that MS-DIAL could detect, as LDA could identify many more species accurately. As such, monohydroxylated species were entirely excluded from this test, since they are not present in MS-DIAL. To ensure that all annotations in the biological material were correct, we validated all data by manual inspection of the spectra and aligning them with respective retention time information.25
Code Availability and Technical Details
The presented algorithm is an extension of the LDA software package that performs MS1 peak integration.26 File conversion to mzXML27 was executed by an integrated version of msConvert.28 Calculations were performed by LDA version 2.8.0 on a 64-bit laptop equipped with an Intel Core i7-8550U CPU at 1.8GHz and 12GB RAM under Windows 10. LDA annotations were exported to mzTab-M format29 by the LDA integrated jmzTab-M library version 1.05.30 mzTab-M files are available in the supplement of this paper (Data S-1-S-6). Raw data, LDA chrom files, and annotations in the original LDA format can be downloaded from http://genome.tugraz.at/lda2/lda_data.shtml. Installers for LDA are provided at http://genome.tugraz.at/lda2. The LDA source code including the algorithm of the presented extension is available from https://github.com/ThallingerLab/LDA2/releases/tag/2.8.0.
Results
We present an extension of the LDA software for automated annotation of sphingolipid species. The software is designed to be easily customized to accommodate additional sphingolipid classes. In addition, it is largely MS platform independent and can be readily optimized for individual MS instruments. This flexibility is necessary because the variability in fragmentation poses a major challenge in automated lipid annotation. Parameters influencing the fragmentation patterns of individual lipid subclasses, in addition to the type of mass spectrometer, are the collision energies, adduct ions, and charge states. To overcome these challenges, we provide a user-extensible cross-platform solution. For this purpose, we introduced decision rule sets, where fragmentation patterns are represented by easily comprehensible fragment rules (m/z values of fragments) and intensity rules (intensity relations between fragments). Based on these adaptable rules, the LDA determines the lipid subclass, the constituent chains, and the positions of the chains (for details, please consult the “Online Methods” of the LDA 2 paper10). Furthermore, the application of the rules safeguards against misleading structural overinterpretation. In the following paragraphs, we first provide technical details on the software extension to include sphingolipids and then demonstrate the application to the relevant biological material. We will highlight the advances of our extended LDA that include better lipid coverage, improved specificity, and increased structural information over other existing software packages.
Extensions to Decision Rule Sets
A major challenge in automated annotation of sphingolipids is the inherent complication that the species of the same lipid subclass, for example, Cer, produce different fragmentation patterns that are often difficult to interpret. For example, the number of OH groups on the LCB dictates the fragmentation pattern (Figure 2), since a higher number of OH groups cause fragments with more water losses. In the original LDA application, one decision rule set corresponded to one fragmentation pattern of one lipid subclass/adduct. Consequently, following the old concept would have entailed one decision rule set for each hydroxylation configuration. For example, the phytoceramides contain three OH groups in total; thus, separate rule sets would be required for species containing three OH groups on the LCB moiety with no OH group on the FA moiety, as opposed to two OH groups on the LCB moiety and one OH group on the FA moiety. The same conceptual logic applies to any other Cer species that contain various numbers of OH groups and at various locations on the molecule. Following the concept of one rule set for each configuration would increase the amount of decision rules for each sphingolipid subclass exponentially. Tackling the challenge of annotating the sphingolipids in such a tedious manner contradicts the objective of the LDA software, which is designed in a manner that allows easy extension and adaptation to include all lipid categories under any analytical conditions. Interestingly, species with a dihydroxylated LCB showed spectral similarity, irrespective of the hydroxylation of the FA moiety of Cer (Figure 3). Thus, it is evident that several fragments and intensity relations are similar among certain hydroxylation configurations. To support both the differences caused by varying LCB hydroxylation and the similarities between the hydroxylation configurations, we abandoned the one decision rule set concept for every fragmentation pattern and added the option to specify fragments and intensity relations based on the number of OH groups. This required some changes to the original LDA.
Figure 3.

Tandem mass spectra of ceramides with the same hydroxylation stage of the long-chain base (LCB) produce the same fragments and similar fragmentation patterns, irrespective of the hydroxylation stage of the fatty acyl (FA) moiety. Spectra of protonated authentic ceramide standards that lost one water molecule acquired on an Orbitrap Velos Pro, CID positive mode, 50%. (A) Dihydroxylated ceramide consisting of a dihydroxylated LCB and non-hydroxylated FA (Cer d18:1/n12:0) and (B) trihydroxylated ceramide consisting of dihydroxylated LCB and monohydroxylated FA (Cer d18:1/h12:0). Fragments indicative of lipid subclass/adduct and LCB are colored in brown and red, respectively. The LCB fragments in red show similar intensity relations.
First, we introduced (in addition to the existing placeholders $CHAIN, $ALKYLCHAIN, and $ALKENYLCHAIN) the placeholder $LCB to designate fragments originating from the LCB moiety. Second, and most importantly, we introduced the “oh” parameter in the fragment and intensity rules to determine at which hydroxylation stage the fragment can be observed (Figure 4). A missing oh parameter indicates that a specific fragment may be detectable, irrespective of the number of OH groups. Once the oh parameter is set, the fragment may be observed only for the listed OH stages and is missing for all the others. For example, line 25 in Figure 4 designates that the “NL_2H2O” fragment can be observed for species containing in total three or four hydroxylation sites. Of note, the oh parameter in the [HEAD] section always pertains to the total number of OH groups in the lipid species. In the [CHAINS] section, it refers to the number of OH groups in the corresponding LCB and FA moieties, respectively. As such, line 40 in Figure 4 indicates that the LCB-C1H4O2 fragment can be observed only for dihydroxylated LCB, irrespective of the total number of hydroxylations of the sphingolipid species. This indicates that the formation of an LCB fragment is independent of the hydroxylation stage of the FA moiety. Since some fragments are prominent for certain OH stages but are minor for others, we added the option for the OH-specific overwriting of the default “mandatory” settings within the newly introduced oh parameter. The available values for the mandatory parameter and their meaning are as follows: class—fragment must be present for this lipid subclass (possible in the [CHAINS] section only); true—fragment must be present for this lipid subclass in the [HEAD] section, or for this chain combination in the [CHAINS] section; false—fragment might be observed; and other—fragment originates from another lipid subclass/adduct and may be used to remove false positive hits.
Figure 4.
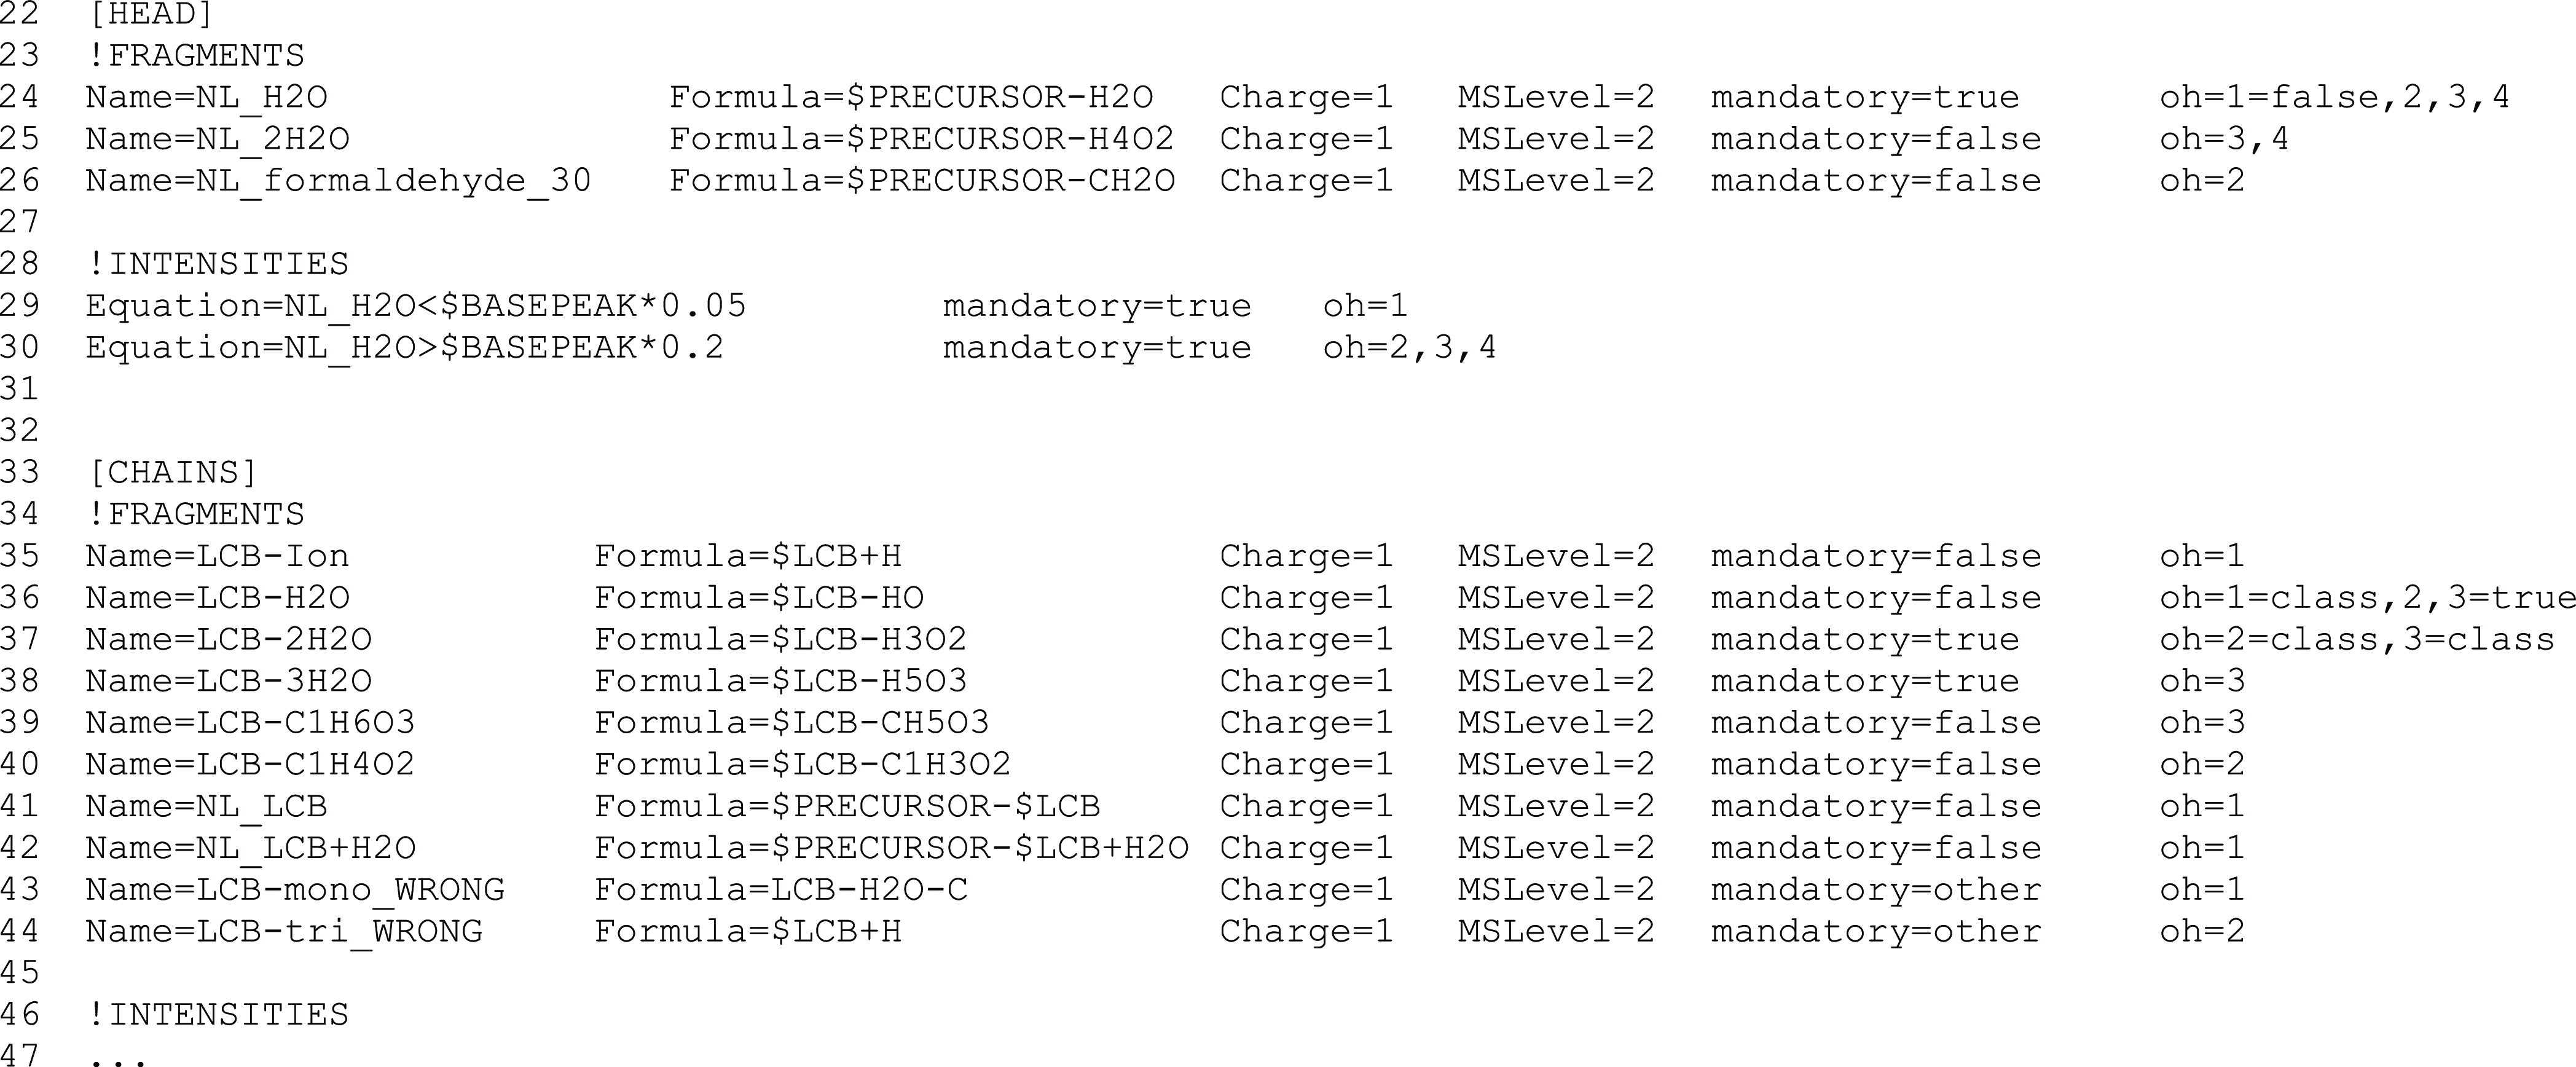
Excerpt from the decision rule set for [M + H–H2O]+ adducts of Cer acquired on an Orbitrap Velos Pro at CID 50%. The line numbers in the original decision rule set are shown at the beginning of each line. The newly introduced oh parameter indicates the OH stages where a fragment may be detected and an intensity relation must be present. In the [HEAD] section, the numbers pertain to the total number of OH in the lipid species, and in the [CHAINS] section, to the number of OH in the corresponding LCB and FA moieties, respectively. Additionally, by the oh parameter, the default mandatory parameter can be overwritten. For example, in line 24, the fragment NL_H2O is mandatory for species containing two, three, or four OH groups but not for monohydroxylated species. The fragment rule in line 36 defines that the LCB-H2O fragment may be observed for LCB containing two OH; however, it is obligatory for LCB containing three OH. Furthermore, the spectrum cannot originate from a monohydroxylated species when this fragment is absent. The available values for the mandatory parameter and their meaning are as follows: class—fragment must be present for this lipid subclass (possible in the [CHAINS] section only); true—fragment must be present for this lipid subclass in the [HEAD] section, and for this chain combination in the [CHAINS] section; false—fragment might be observed; and other—fragment originates from another lipid subclass/adduct and may be used to remove false positive hits.
For extensibility to unconventional sphingolipid species, the described LDA extension has been designed to allow for more than two chains. Commonly, one is defined by the LCB and the other by the FA. Due to the additional degree of freedom introduced by allowing the variation of hydroxylation stages of the chains, as well as the possible presence of isobaric masses of chain fragments, it became increasingly more difficult to assign the correct chain combination. While appropriate use of the mandatory parameter and intensity rules may remove most of the false positives, we decided to introduce three user-customizable ways of reducing the combinatorial complexity.
First, in the [GENERAL] section of the decision rule sets (contains class-specific information, such as the number of chains), the parameters “LcbHydroxylationRange” and “FaHydroxylationRange” were added to define the possible ranges of OH for both the LCB and FA moieties, respectively. As default values for the OH ranges, we routinely use 1–3 for the LCB moiety and 0–1 for the FA moiety. Constraining the FA moiety to one or no OH coincides with the prevalent consensus among the lipid community that, in mammalian biology, more than one hydroxylation site are rarely found on the FA. Nonetheless, these parameters can be changed with little effort to include more exotic sphingolipids isolated from non-mammalian systems.
Second, the possible LCB chains are stored in a separate library that contains smaller ranges in the number of carbon atoms and double bonds than the larger FA library, which contains most species typically found in the mammalian lipidome. Just as the hydroxylation ranges, this library can be easily extended.
Third, the potential hydroxylation range for each individual sphingolipid subclass can be defined in the mass list file (Excel file containing the lipid species in a searchable format) by the parameter “OH-Range,” where the parameter “OH-Number” identifies the hydroxylation stage of the provided mass list. All other OH configurations are calculated automatically.
Decision Rule Set Development
The decision rule sets were developed by visual inspection of fragmentation spectra from authentic standards (control experiment—Table S-1). In this process, we identified observable fragments and their compulsoriness for a subclass/adduct and derived the associated intensity rules. To establish distinctive differences for isobaric or isomeric subclasses/adducts, we first used the purified standards to outline the parameters. These initial settings were then fine-tuned on the more complex data sets from the extracted biological material. We developed decision rule sets for the sphingolipid subclasses Cer, Cer1P, HexCer, LSM, SM, SphBase, and S1P for the Orbitrap Velos Pro in CID mode with collision energy settings of +50% and −50%. An overview of all identifications made by LDA in the control experiment using our extensive mix of 62 standards (Table S-1) is shown in Table S-2. LDA annotation data (including false positive identifications) is provided in mzTab-M format for the positive and negative ion modes in Data S-1 and S-2, respectively. To demonstrate the cross-platform applicability, we further developed rule sets for the Q Exactive (Thermo Fisher Scientific Inc., Waltham, MA). In initial experiments, we focused on the annotation for Cer, Cer1P, and SM with collision energy settings of −30%. All developed decision rule sets are publicly available and are provided along with the software for the algorithm. The examples of the application of the decision rule sets and the interpretation process of MSn spectra are provided in Figure S-1. All software components and other relevant materials are available free of charge at http://genome.tugraz.at/lda2.
Validation on Biological Samples
The newly developed approach for the annotation of sphingolipids including its decision rule sets was validated on biological samples including lipid extracts from murine brain and human plasma. All results were manually validated. In total, 122 and 172 unique sphingolipid species were identified by LDA for murine brain and human plasma, respectively (Table 1). Details on the correct identification of lipid molecular species are given in Table S-3. In this table, we report only species where MSn spectra are present. LDA annotation data (including false positive identifications) in mzTab-M format for the brain can be found in Data S-3 and S-4 for the positive and negative ion modes, respectively, and for plasma in Data S-5 and S-6.
Table 1. Sphingolipid Species Identified by LDA on Data Acquired on the Orbitrap Velos Proa.
| brain |
plasma |
|||
|---|---|---|---|---|
| class | chain | class | chain | |
| Cer | 7 | 48 | 22 | 34 |
| HexCer | 10 | 34 | 6 | 5 |
| SphBase | 1 | NA | 0 | NA |
| SM | 6 | 16 | 11 | 94 |
| total | 24 | 98 | 39 | 133 |
| total ident. | 122 | 172 | ||
Class: lipid species level (no acyl chain information available). Chain: acyl chain information available.
In addition to the known sphingolipid species that were present in the brain and plasma samples, we also identified 10 novel sphingolipid species and 27 novel molecular species (Table S-4 and Figure S-2). We defined a lipid molecular species as “novel” if it is not present in ChEBI,31 Cyberlipid (http://www.cyberlipid.org), HMDB,32 LipidHome,33 LIPID MAPS structure database,34 SwissLipids,35 and YMDB.36 Some new sphingolipid species were also identified by MS-DIAL.20 However, several of these annotations were ambiguous and required extensive interpretation by a panel of MS experts. In contrast, LDA identified these novel lipids unambiguously and in an automated fashion. LDA identified these novel sphingolipids by integrated decision rule sets based on fragmentation patterns, intensity rules, and retention time. As a representative example, we show the spectrum of Cer d19:1/n22:0 in Figure 5.
Figure 5.

MS3 spectrum of the novel sphingolipid molecular species Cer d19:1/n22:0. By further fragmenting the MS2 neutral loss fragment of m/z 46 (NL of formic acid) from a ceramide formate adduct in the negative ion mode, characteristic fragments are produced for the lipid subclass/adduct, the LCB, and the FA moieties, which are shown in brown, red, and blue, respectively.
Benchmark to MS-DIAL
To assess the benefit of our novel approach for sphingolipids, we benchmarked LDA versus MS-DIAL.20 The benchmark on the control experiment consisted of a mixture of purified sphingolipids (Tables S-5 and S-6) and showed that LDA could typically identify 20% more standards than MS-DIAL. The only exception was the lipid species comparison in the negative ion mode, where LDA and MS-DIAL identified 100 and 95%, respectively. The benchmark test based on the lipidome from murine brain revealed that LDA correctly identified considerably more lipid species and lipid molecular species with a remarkably lower number of false positive identifications (Tables 2, 3, S-7, and S-8), for example, for the detectable sphingolipid species in the negative ion mode, LDA identified 96% of the species with a positive predictive value (PPV) of 95%, while the same quality measures for MS-DIAL were 49 and 43%, respectively.
Table 2. Sensitivity and Positive Predictive Value (PPV) of LDA and MS-DIAL in the Positive Ion Mode Based on Data Acquired on the Orbitrap Velos Pro in CID Modea.
| total identifications at the class level: 386 |
total identifications at the chain level: 181 |
|||
|---|---|---|---|---|
| LDA | MS-DIAL | LDA | MS-DIAL | |
| sensit. (%)b | 93 | 67 | 82 | 49 |
| PPV (%)c | 95 | 47 | 79 | 25 |
For “total identifications,” mouse brain extracts were analyzed 5 times by LC-MS and annotated by LDA or MS-DIAL. Each of the identified species was manually validated and the sum total of all five MS runs is shown.
Sensitivity (sensit.): percent of total species identified.
Positive predictive value (PPV): percent of correct identifications.
Table 3. Sensitivity and Positive Predictive Value (PPV) of LDA and MS-DIAL in the Negative Ion Mode Based on Data Acquired on the Orbitrap Velos Pro in CID Modea.
| total identifications at the class level: 406 |
total identifications at the chain level: 42 |
|||
|---|---|---|---|---|
| LDA | MS-DIAL | LDA | MS-DIAL | |
| sensit. (%)b | 96 | 49 | 93 | 83 |
| PPV (%)c | 95 | 43 | 95 | 26 |
For “total identifications,” mouse brain extracts were analyzed 5 times by LC-MS and annotated by LDA or MS-DIAL. Each of the identified species was manually validated and the sum total of all five MS runs is shown.
Sensitivity (sensit.): percent of total species identified.
Positive predictive value (PPV): percent of correct identifications.
Discussion
Sphingolipid LC-MS/MS data annotation is challenging due to the presence of many isomeric/isobaric lipid species and fragments, which frequently produce false positive annotations. In this paper, we present an extension to the flexible cross-platform software LDA that reliably annotates sphingolipid species.10 The present approach is beneficial for the following reasons: (i) Intensity rules can be more easily trimmed to detect subtle differences in isobaric/isomeric lipid species that produce similar fragmentation spectra than general spectral matching algorithms. (ii) The decision rule concept facilitates the extension of the software to additional platforms and lipid classes and permits adaptability to specific needs. As such, it is easy for users to increase the sensitivity for a certain lipid class of interest by loosening the intensity rules. (iii) Information from MS3, MS4, etc., spectra can be easily incorporated. For example, MS3 spectra were used for determining the LCB and FA moieties from the formate adducts of the subclasses Cer, HexCer, and SM. (iv) Typically, LDA does not miss unanticipated chain combinations (LCB and FA) because it searches for all possible permutations. In contrast, library-based approaches require a reference spectrum for each potential chain combination. (v) The range of scanned hydroxylation stages and possible LCB and FA moieties can be easily extended or limited by a set of customizable parameters and modifying an Excel spreadsheet, respectively.
A benchmark test with MS-DIAL clearly indicated the need for an automated solution to reliably detect the wealth of sphingolipid species present in complex biological samples (Tables 2 and 3). We chose MS-DIAL because it outperformed many other lipidomics software, as outlined in their recent benchmark study.20 Furthermore, we wanted to highlight that LDA searches the supported lipid subclasses for all reasonably existing species. The LDA software was specifically designed for untargeted MS analysis. Thus, we want to correct a statement in the recent MS-DIAL paper20 that concluded that LDA is limited to targeted MS data. This conclusion is incorrect. In fact, in contrast to the rigid database format of MS-DIAL, we provide a list of species in the form of an Excel file that can easily be extended to include all theoretically possible structures.
To obtain a meaningful gauge on the performance of each approach, we compared only species that were reportable by both software, that is, they can accommodate the same adducts, carbon atoms, double bonds, and OH groups. Of note, we could only use a small subset of all species identified by LDA because MS-DIAL does not support many structural elements and adducts that are useful for accurate identification and which are incorporated into LDA. For example, MS-DIAL does not support monohydroxylated species, the more informative protonated adducts that lose water, and MS3 spectra of formate adducts. These restrictions limited specifically the accurate identification of species at the chain level (lipid molecular species) in the negative ion mode, where on average only 8 out of 57 LDA-identified species could be used.
We want to emphasize that the MS-DIAL performance using our original data set without these limitations was even less reliable than that shown in Tables 2 and 3. Some possible algorithmic reasons for the observed performance differences are discussed in the Supporting Information (Note S-2). In a preliminary evaluation of deprotonated Cer, the PPV was <30% (data not shown). The false positives were primarily deprotonated phosphatidylethanolamine species (or their isotopes), other phospholipid subclasses, and HexCer species.
The results of this benchmark study clearly indicate that LDA provides better coverage identifying more species with higher reliability. Additionally, LDA uses a decision rule concept that allows for easy adaptability and extensibility to other platforms and sphingolipid subclasses.
Conclusions
We have developed a reliable automated MSn annotation algorithm that takes into account the challenges inherent in sphingolipid data analysis. We demonstrated the high annotation quality and the potential for detecting novel lipid species and molecular species for explorative studies. The algorithm is embedded in the user-friendly cross-platform open-source software LDA, which avoids overannotation by reporting only structural details that are substantiated by spectral evidence. The simplicity of the “decision rule set” concept provides bioinformaticians and mass spectrometrists alike with easy means for extending the software to other (sphingo)lipid classes and MS platforms and adapting it to specific needs. Consequently, the benefits of the new software presented here should extend to the broader lipidomics community.
Acknowledgments
J.H. was funded by a Max Kade fellowship awarded by the Austrian Academy of Sciences and acknowledges financial support by the University of Graz and the Field of Excellence BioHealth, University of Graz. The work was supported by NIH grants R01GM020501 (E.A.D.), R01DK105961 (E.A.D., O.Q.), and P30DK063491 (O.Q., E.A.D.). The authors thank G. G. Thallinger for hosting the LDA project including the extensions described herein.
Supporting Information Available
The Supporting Information is available free of charge at https://pubs.acs.org/doi/10.1021/acs.analchem.0c03016.
MS-DIAL parameters; algorithmic comparison between LDA and MS-DIAL; list of authentic standards; visual examples of decision rule sets; list of novel lipid species; and spectral evidence (PDF)
Sphingolipid annotation details of LDA for authentic standards, murine brain, and human plasma in Excel files and mzTab-M format; and details on benchmark study (ZIP)
Author Contributions
The new software was designed by J.H., and the manuscript was first drafted by J.H. and O.Q. but was finalized with contributions from all other authors. A.M.A., M.T., and H.C.K. performed the mass spectrometric experiments. All authors have given approval to the final version of the manuscript.
The authors declare no competing financial interest.
Supplementary Material
References
- van Meer G.; Holthuis J. C. M. Sphingolipid Transport in Eukaryotic Cells. Biochim. Biophys. Acta 2000, 1486, 145–170. 10.1016/S1388-1981(00)00054-8. [DOI] [PubMed] [Google Scholar]
- Zäuner S.; Ternes P.; Warnecke D. Biosynthesis of Sphingolipids in Plants (and Some of Their Functions). Adv. Exp. Med. Biol. 2010, 688, 249–263. 10.1007/978-1-4419-6741-1_18. [DOI] [PubMed] [Google Scholar]
- Jennemann R.; Geyer R.; Sandhoff R.; Gschwind R. M.; Levery S. B.; Gröne H. J.; Wiegandt H. Glycoinositolphosphosphingolipids (Basidiolipids) of Higher Mushrooms. Eur. J. Biochem. 2001, 268, 1190–1205. 10.1046/j.1432-1327.2001.01963.x. [DOI] [PubMed] [Google Scholar]
- Levery S. B. Glycosphingolipid Structural Analysis and Glycosphingolipidomics. Methods Enzymol. 2005, 405, 300–369. [DOI] [PubMed] [Google Scholar]
- Itonori S.; Sugita M. In Experimental Glycoscience: Glycochemistry, Taniguchi N.; Suzuki A.; Ito Y.; Narimatsu H.; Kawasaki T.; Hase S., Eds.; Springer: Japan: Tokyo, 2008; pp 74–76. [Google Scholar]
- Holthuis J. C. M.; Pomorski T.; Raggers R. J.; Sprong H.; van Meer G. The Organizing Potential of Sphingolipids in Intracellular Membrane Transport. Physiol. Rev. 2001, 81, 1689–1723. 10.1152/physrev.2001.81.4.1689. [DOI] [PubMed] [Google Scholar]
- Hannun Y. A.; Obeid L. M. Principles of Bioactive Lipid Signalling: Lessons from Sphingolipids. Nat. Rev. Mol. Cell Biol. 2008, 9, 139–150. 10.1038/nrm2329. [DOI] [PubMed] [Google Scholar]
- Simons K.; Ikonen E. Functional Rafts in Cell Membranes. Nature 1997, 387, 569–572. 10.1038/42408. [DOI] [PubMed] [Google Scholar]
- Hannun Y. A.; Obeid L. M. Sphingolipids and Their Metabolism in Physiology and Disease. Nat. Rev. Mol. Cell Biol. 2018, 19, 175–191. 10.1038/nrm.2017.107. [DOI] [PMC free article] [PubMed] [Google Scholar]
- Hartler J.; Triebl A.; Ziegl A.; Trötzmüller M.; Rechberger G. N.; Zeleznik O. A.; Zierler K. A.; Torta F.; Cazenave-Gassiot A.; Wenk M. R.; Fauland A.; Wheelock C. E.; Armando A. M.; Quehenberger O.; Zhang Q.; Wakelam M. J. O.; Haemmerle G.; Spener F.; Köfeler H. C.; Thallinger G. G. Deciphering Lipid Structures Based on Platform-Independent Decision Rules. Nat. Methods 2017, 14, 1171–1174. 10.1038/nmeth.4470. [DOI] [PMC free article] [PubMed] [Google Scholar]
- Liebisch G.; Vizcaíno J. A.; Köfeler H.; Trötzmüller M.; Griffiths W. J.; Schmitz G.; Spener F.; Wakelam M. J. O. Shorthand Notation for Lipid Structures Derived from Mass Spectrometry. J. Lipid Res. 2013, 54, 1523–1530. 10.1194/jlr.M033506. [DOI] [PMC free article] [PubMed] [Google Scholar]
- Sullards M. C.; Liu Y.; Chen Y.; Merrill A. H. Jr. Analysis of Mammalian Sphingolipids by Liquid Chromatography Tandem Mass Spectrometry (LC-MS/MS) and Tissue Imaging Mass Spectrometry (TIMS). Biochim. Biophys. Acta, Mol. Cell Biol. Lipids 2011, 1811, 838–853. 10.1016/j.bbalip.2011.06.027. [DOI] [PMC free article] [PubMed] [Google Scholar]
- Merrill A. H. Jr. Sphingolipid and Glycosphingolipid Metabolic Pathways in the Era of Sphingolipidomics. Chem. Rev. 2011, 111, 6387–6422. 10.1021/cr2002917. [DOI] [PMC free article] [PubMed] [Google Scholar]
- Grosjean K.; Mongrand S.; Beney L.; Simon-Plas F.; Gerbeau-Pissot P. Differential Effect of Plant Lipids on Membrane Organization: Specificities of Phytosphingolipids and Phytosterols. J. Biol. Chem. 2015, 290, 5810–5825. 10.1074/jbc.M114.598805. [DOI] [PMC free article] [PubMed] [Google Scholar]
- Kind T.; Liu K. H.; Lee D. Y.; DeFelice B.; Meissen J. K.; Fiehn O. LipidBlast in Silico Tandem Mass Spectrometry Database for Lipid Identification. Nat. Methods 2013, 10, 755–758. 10.1038/nmeth.2551. [DOI] [PMC free article] [PubMed] [Google Scholar]
- Kyle J. E.; Crowell K. L.; Casey C. P.; Fujimoto G. M.; Kim S.; Dautel S. E.; Smith R. D.; Payne S. H.; Metz T. O. LIQUID: An-Open Source Software for Identifying Lipids in LC-MS/MS-Based Lipidomics Data. Bioinformatics 2017, 33, 1744–1746. 10.1093/bioinformatics/btx046. [DOI] [PMC free article] [PubMed] [Google Scholar]
- Hutchins P. D.; Russell J. D.; Coon J. J. LipiDex: An Integrated Software Package for High-Confidence Lipid Identification. Cell Syst. 2018, 6, 621–625.e5. 10.1016/j.cels.2018.03.011. [DOI] [PMC free article] [PubMed] [Google Scholar]
- Koelmel J. P.; Li X.; Stow S. M.; Sartain M. J.; Murali A.; Kemperman R.; Tsugawa H.; Takahashi M.; Vasiliou V.; Bowden J. A.; Yost R. A.; Garrett T. J.; Kitagawa N. Lipid Annotator: Towards Accurate Annotation in Non-Targeted Liquid Chromatography High-Resolution Tandem Mass Spectrometry (LC-HRMS/MS) Lipidomics Using a Rapid and User-Friendly Software. Metabolites 2020, 10, 101. 10.3390/metabo10030101. [DOI] [PMC free article] [PubMed] [Google Scholar]
- Taguchi R.; Ishikawa M. Precise and Global Identification of Phospholipid Molecular Species by an Orbitrap Mass Spectrometer and Automated Search Engine Lipid Search. J. Chromatogr. A 2010, 1217, 4229–4239. 10.1016/j.chroma.2010.04.034. [DOI] [PubMed] [Google Scholar]
- Tsugawa H.; Ikeda K.; Takahashi M.; Satoh A.; Mori Y.; Uchino H.; Okahashi N.; Yamada Y.; Tada I.; Bonini P.; Higashi Y.; Okazaki Y.; Zhou Z.; Zhu Z. J.; Koelmel J.; Cajka T.; Fiehn O.; Saito K.; Arita M.; Arita M.. A Lipidome Atlas in MS-DIAL 4. Nat. Biotechnol. 2020 10.1038/s41587-020-0531-2. [DOI] [PubMed] [Google Scholar]
- Koelmel J. P.; Kroeger N. M.; Ulmer C. Z.; Bowden J. A.; Patterson R. E.; Cochran J. A.; Beecher C. W. W.; Garrett T. J.; Yost R. A. LipidMatch: An Automated Workflow for Rule-Based Lipid Identification Using Untargeted High-Resolution Tandem Mass Spectrometry Data. BMC Bioinf. 2017, 18, 331 10.1186/s12859-017-1744-3. [DOI] [PMC free article] [PubMed] [Google Scholar]
- Ni Z.; Angelidou G.; Lange M.; Hoffmann R.; Fedorova M. LipidHunter Identifies Phospholipids by High-Throughput Processing of LC-MS and Shotgun Lipidomics Datasets. Anal. Chem. 2017, 89, 8800–8807. 10.1021/acs.analchem.7b01126. [DOI] [PubMed] [Google Scholar]
- Matyash V.; Liebisch G.; Kurzchalia T. V.; Shevchenko A.; Schwudke D. Lipid Extraction by Methyl-Tert-Butyl Ether for High-Throughput Lipidomics. J. Lipid Res. 2008, 49, 1137–1146. 10.1194/jlr.D700041-JLR200. [DOI] [PMC free article] [PubMed] [Google Scholar]
- Triebl A.; Trötzmüller M.; Hartler J.; Stojakovic T.; Köfeler H. C. Lipidomics by Ultrahigh Performance Liquid Chromatography-High Resolution Mass Spectrometry and Its Application to Complex Biological Samples. J. Chromatogr. B: Anal. Technol. Biomed. Life Sci. 2017, 1053, 72–80. 10.1016/j.jchromb.2017.03.027. [DOI] [PMC free article] [PubMed] [Google Scholar]
- Fauland A.; Köfeler H.; Trötzmüller M.; Knopf A.; Hartler J.; Eberl A.; Chitraju C.; Lankmayr E.; Spener F. A Comprehensive Method for Lipid Profiling by Liquid Chromatography-Ion Cyclotron Resonance Mass Spectrometry. J. Lipid Res. 2011, 52, 2314–2322. 10.1194/jlr.D016550. [DOI] [PMC free article] [PubMed] [Google Scholar]
- Hartler J.; Trötzmüller M.; Chitraju C.; Spener F.; Köfeler H. C.; Thallinger G. G. Lipid Data Analyzer: Unattended Identification and Quantitation of Lipids in LC-MS Data. Bioinformatics 2011, 27, 572–577. 10.1093/bioinformatics/btq699. [DOI] [PubMed] [Google Scholar]
- Pedrioli P. G. A.; Eng J. K.; Hubley R.; Vogelzang M.; Deutsch E. W.; Raught B.; Pratt B.; Nilsson E.; Angeletti R. H.; Apweiler R.; Cheung K.; Costello C. E.; Hermjakob H.; Huang S.; Julian R. K.; Kapp E.; McComb M. E.; Oliver S. G.; Omenn G.; Paton N. W.; et al. A Common Open Representation of Mass Spectrometry Data and Its Application to Proteomics Research. Nat. Biotechnol. 2004, 22, 1459–1466. 10.1038/nbt1031. [DOI] [PubMed] [Google Scholar]
- Chambers M. C.; MacLean B.; Burke R.; Amodei D.; Ruderman D. L.; Neumann S.; Gatto L.; Fischer B.; Pratt B.; Egertson J.; Hoff K.; Kessner D.; Tasman N.; Shulman N.; Frewen B.; Baker T. A.; Brusniak M. Y.; Paulse C.; Creasy D.; Flashner L.; et al. A Cross-Platform Toolkit for Mass Spectrometry and Proteomics. Nat. Biotechnol. 2012, 30, 918–920. 10.1038/nbt.2377. [DOI] [PMC free article] [PubMed] [Google Scholar]
- Hoffmann N.; Rein J.; Sachsenberg T.; Hartler J.; Haug K.; Mayer G.; Alka O.; Dayalan S.; Pearce J. T. M.; Rocca-Serra P.; Qi D.; Eisenacher M.; Perez-Riverol Y.; Vizcaíno J. A.; Salek R. M.; Neumann S.; Jones A. R. mzTab-M: A Data Standard for Sharing Quantitative Results in Mass Spectrometry Metabolomics. Anal. Chem. 2019, 91, 3302–3310. 10.1021/acs.analchem.8b04310. [DOI] [PMC free article] [PubMed] [Google Scholar]
- Hoffmann N.; Hartler J.; Ahrends R. jmzTab-M: A Reference Parser, Writer, and Validator for the Proteomics Standards Initiative mzTab 2.0 Metabolomics Standard. Anal. Chem. 2019, 91, 12615–12618. 10.1021/acs.analchem.9b01987. [DOI] [PubMed] [Google Scholar]
- Degtyarenko K.; de Matos P.; Ennis M.; Hastings J.; Zbinden M.; McNaught A.; Alcántara R.; Darsow M.; Guedj M.; Ashburner M. ChEBI: A Database and Ontology for Chemical Entities of Biological Interest. Nucleic Acids Res. 2008, 36, D344–D350. 10.1093/nar/gkm791. [DOI] [PMC free article] [PubMed] [Google Scholar]
- Wishart D. S.; Feunang Y. D.; Marcu A.; Guo A. C.; Liang K.; Vázquez-Fresno R.; Sajed T.; Johnson D.; Li C.; Karu N.; Sayeeda Z.; Lo E.; Assempour N.; Berjanskii M.; Singhal S.; Arndt D.; Liang Y.; Badran H.; Grant J.; Serra-Cayuela A.; et al. HMDB 4.0: The Human Metabolome Database for 2018. Nucleic Acids Res. 2018, 46, D608–D617. 10.1093/nar/gkx1089. [DOI] [PMC free article] [PubMed] [Google Scholar]
- Foster J. M.; Moreno P.; Fabregat A.; Hermjakob H.; Steinbeck C.; Apweiler R.; Wakelam M. J. O.; Vizcaíno J. A. LipidHome: A Database of Theoretical Lipids Optimized for High Throughput Mass Spectrometry Lipidomics. PLoS One 2013, 8, e61951 10.1371/journal.pone.0061951. [DOI] [PMC free article] [PubMed] [Google Scholar]
- Sud M.; Fahy E.; Cotter D.; Brown A.; Dennis E. A.; Glass C. K.; Merrill A. H. Jr; Murphy R. C.; Raetz C. R. H.; Russell D. W.; Subramaniam S. LMSD: LIPID MAPS Structure Database. Nucleic Acids Res. 2007, 35, D527–D532. 10.1093/nar/gkl838. [DOI] [PMC free article] [PubMed] [Google Scholar]
- Aimo L.; Liechti R.; Hyka-Nouspikel N.; Niknejad A.; Gleizes A.; Götz L.; Kuznetsov D.; David F. P.; van der Goot F. G.; Riezman H.; Bougueleret L.; Xenarios I.; Bridge A. The SwissLipids Knowledgebase for Lipid Biology. Bioinformatics 2015, 31, 2860–2866. 10.1093/bioinformatics/btv285. [DOI] [PMC free article] [PubMed] [Google Scholar]
- Jewison T.; Knox C.; Neveu V.; Djoumbou Y.; Guo A. C.; Lee J.; Liu P.; Mandal R.; Krishnamurthy R.; Sinelnikov I.; Wilson M.; Wishart D. S. YMDB: The Yeast Metabolome Database. Nucleic Acids Res. 2012, 40, D815–D820. 10.1093/nar/gkr916. [DOI] [PMC free article] [PubMed] [Google Scholar]
Associated Data
This section collects any data citations, data availability statements, or supplementary materials included in this article.