Supplemental Digital Content is available in the text.
Background.
Interstitial fibrosis (IF) is the common pathway of chronic kidney injury in various conditions. Magnetic resonance imaging (MRI) may be a promising tool for the noninvasive assessment of IF in renal allografts.
Methods.
This prospective trial was primarily designed to investigate whether the results of T1-weighted MRI associate with the degree of IF. Thirty-two kidney transplant recipients were subjected to 1.5-Tesla MRI scans shortly before or after routine allograft biopsies. MRI parameters [T1 and T2 relaxation times; apparent diffusion coefficient (ADC)] were assessed for cortical and medullary sections.
Results.
Advanced IF (Banff ci score >1) was associated with higher cortical T1 (but not T2) values [1451 (median; interquartile range: 1331–1506) versus 1306 (1197–1321) ms in subjects with ci scores ≤1; P = 0.011; receiver operating characteristic area under the curve for prediction of ci > 1: 0.76]. In parallel, T1 values were associated with kidney function and proteinuria. There was also a relationship between IF and corticomedullary differences on ADC maps (receiver operating characteristic area under the curve for prediction of ci ≤ 1: 0.79).
Conclusions.
Our results support the use of MRI for noninvasive assessment of allograft scarring. Future studies will have to clarify the role of T1 (and ADC) mapping as a surrogate endpoint reflecting the progression of chronic graft damage.
Interstitial fibrosis (IF), the final common pathway of different immunological and nonimmunological mechanisms of injury, is a key feature of chronic kidney damage.1,2 IF, which is characterized by an excessive deposition of extracellular matrix in the interstitium, is well known to associate with renal prognosis in different kidney diseases.3 In kidney transplantation, IF was shown to be an early predictor of graft dysfunction and loss.4-6 The quantification of IF relies on biopsy as the current “gold standard.” However, biopsies are invasive and carry a significant risk of bleeding complications.7,8 Moreover, a core needle biopsy involves taking only a tiny sample of the kidney, and the often patchy distribution of renal scarring can lead to a profound sampling bias limiting diagnostic precision.9 Another caveat is a considerable interobserver variability, especially with visual assessment.10-13
The establishment of noninvasive tools for IF monitoring may represent a promising strategy to systematically evaluate the progression of renal scarring, thereby potentially reducing the need of serial follow-up biopsies (and associated complications in patients at increased bleeding risk). In this context, the use of noncontrast magnetic resonance imaging (MRI), in particular T1 mapping and diffusion-weighted imaging (DWI) with apparent diffusion coefficient (ADC) assessment, has gained increasing interest, and has entered a clinical routine in different areas of medicine, such as hepatology and cardiology.14,15 One potential advantage of using macroscopic imaging techniques may be the possibility to obtain additional information about the extent of chronic allograft damage, with a presumably minimal degree of sampling bias and interobserver variability, owing to an objective assessment of the whole organ. In T1 mapping sequences, which are included in most imaging protocols, the tissue contrast is determined by longitudinal (T1) relaxation times. However, only a few systematic studies have evaluated the diagnostic value of T1-weighted MRI as a surrogate marker of transplant scarring, and their results showed only moderate correlations with IF.16,17 Interestingly, the accuracy of T1 mapping was outperformed by the corticomedullary difference (but not absolute cortical or medullary values) of ADC (ΔADC), a parameter reflecting changes in the movement of hydrogen molecules based on the Brownian motion.16,17 In recent studies, also alternative imaging techniques were suggested to have a potential diagnostic value for noninvasive quantification of IF, such as the assessment of whole-kidney stiffness on MRI elastography18 or measurement of the fractional anisotropy using MRI-based diffusion tensor imaging.19 Many available studies applied 3-Tesla protocols, mostly including patients with a moderate degree of renal injury or dysfunction, respectively. There may be a need for further studies to: (1) evaluate the diagnostic accuracy of 1.5-Tesla protocols, which may allow for broader application in patients with implantable devices20,21 and (2) to assess the diagnostic value of MRI for a wider range of injury severity.
Our study, which included a representative cohort of 32 subjects, was primarily powered to assess the diagnostic value of cortical T1 relaxation times (1.5-Tesla MRI system) in relation to the results of semiquantitative ci scoring according to the Banff scheme.22 Thorough data analysis also allowed for the evaluation of other MRI parameters, such as DWI and T2 mapping, in relation to IF and a variety of other morphologic features of graft injury.
MATERIALS AND METHODS
Study Objectives and Design
The present study was designed as a prospective single-center trial. Its primary objective was to evaluate whether there is a correlation between the results of 1.5-Tesla MRI T1 mapping and the degree of IF in renal allografts reflected by the Banff ci score. Secondary objectives were to asses associations of T1 relaxation times with other measures of chronic injury, such as the percentage of cortical interstitial fibrosis, interstitial fibrosis and tubular atrophy (IFTA), transplant glomerulopathy (cg), or chronic vasculopathy (cv). In addition, biopsy results were correlated with parameters obtained from DWI and T2 mapping. The study approval was obtained from the institutional ethics committee (approval: October 2017; No. 1893/2017). All trial participants provided written informed consent before enrollment, and all parts of the study were conducted in compliance with the Good Clinical Practice guidelines, the principles of the Declaration of Helsinki 2008 and the Declaration of Istanbul.
Eligibility Criteria and Patients
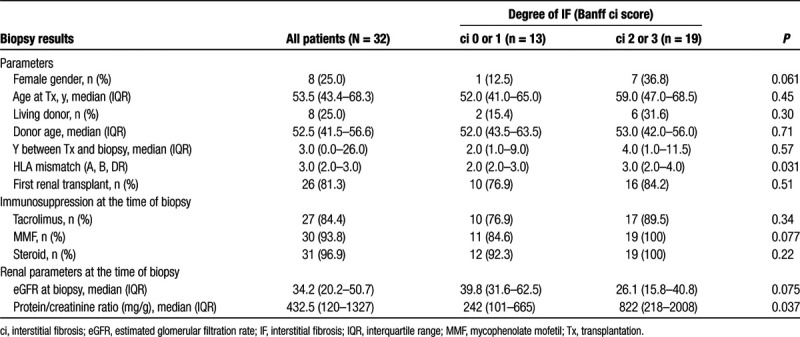
Key inclusion criteria were (1) a planned posttransplant protocol or indication biopsy; (2) an age >18 y; and (3) an estimated glomerular filtration rate (eGFR; Modification of Diet in Real Disease equation) >10 mL/min/1.73 m2. Exclusion criteria were non-MRI-compatible metallic implants or pacemakers, known claustrophobia and pregnancy, respectively. From December 2017 through January 2019, a total of 269 kidney transplant recipients underwent routine allograft biopsies at the day ward of the Vienna nephrology department. Because of organizatory reasons (for the trial, only 1 MRI slot per week was available), only a minor proportion of these patients were considered for study inclusion. Thirty-six patients fulfilled all eligibility criteria. Two of these patients underwent MRI examination, but their scheduled renal biopsies were canceled. In another patient, MRI investigation could not be completed because of claustrophobia, and a fourth patient withdrew consent before imaging. The final study cohort consisted of 32 recipients, who all underwent a complete schedule of MRI analysis, in parallel to routine indication (n = 23) or protocol (n = 9) renal allograft biopsy. Baseline data are provided in Table 1.
TABLE 1.
Patient characteristics in relation to the degree of interstitial fibrosis
Sample Size Calculation
Sample size calculations for addressing the primary objective (relationship between MRI T1 relaxation time and ci categories) were in part based on preliminary results obtained in a retrospective cohort of 10 renal allograft recipients, who were subjected to clinically indicated MRI investigations and at the same time allograft biopsies (between 1 and 374 mo after transplantation). In these patients, cortical T1 relaxation times were 1543 ± 113 ms (mean ± SD). In support of a potential diagnostic value of MRI in detecting renal scarring, there were significant differences in relation to the Banff ci score in concomitant biopsies [ci score of 2 or 3 (6 patients): 1606 ± 83.4; ci score of 0 or 1 (4 patients): 1393 ± 128; P = 0.011]. According to these data, a 10% variance and an expected intergroup difference of ≥200 ms were considered for sample size calculation. Assuming a 1:1 distribution of patient groups, enrollment of 28 patients was considered to yield a statistical power of 90% at a 2-sided significance level of 0.05. Expecting an about 10% drop-out rate, we planned inclusion of 32 patients.
Biopsies
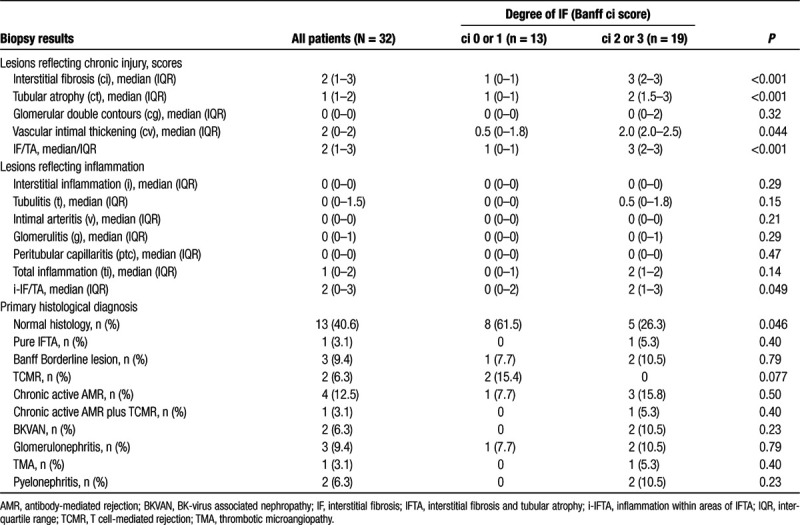
The study included both protocol and indication biopsies, the latter performed for allograft dysfunction and proteinuria. Biopsies were performed under real-time ultrasound guidance using 16-gauge needles (1–2 cores per biopsy). Morphologic lesions were assessed on formalin-fixed paraffin-embedded sections using standard methodology, including staining with aniline blue, acid fuchsin, and orange G for analysis of IF. Banff single lesions and rejection phenotypes were evaluated and scored according to the Banff 2017 scheme.23 The degree of IF was defined according to the percentage of cortical area involved, applying semiquantitative Banff ci lesion scoring [ci0: up to 5%; ci1: 6%–25% (mild); ci2: 26%–50% (moderate); ci3: >50% of cortical area (severe IF)]. For studied biopsies, the median number of glomeruli and arteries per biopsy was 13 [interquartile range (IQR): 9–22] and 2 (1–3), respectively. All biopsies were evaluated by 2 nephropathologists blinded to MRI results (J.K. and H.R.). Biopsy results are detailed in Table 2. To assess the level of interobserver variability, features of chronic allograft injury were also re-evaluated by a third independent pathologist (M.N.). Table S1 (SDC, http://links.lww.com/TXD/A254) provides correlations of chronic lesions with MRI parameters for each of the 2 independent evaluations. Kappa statistics revealed moderate levels of agreement in assigning ci (Fleiss’ kappa: 0.61, P < 0.001) or ct scores (0.50, P < 0.001). Proportions of patients classified ci >1, however, were only slightly different (J.K./H.R.: n = 17; M.N.: n = 19), and, for cortical T1 relaxation times, receiver operating characteristic area under the curve (ROC-AUC) for the prediction of ci >1 was only marginally different [0.76 [95% confidence interval (CI): 0.59-0.94] versus 0.78 (0.61-0.94)].
TABLE 2.
Biopsy findings in relation to the degree of interstitial fibrosis
MRI Protocol and Analysis
In 6 patients, MRI examinations were performed 4.5 (IQR: 1.8–5.8; range: 1–7] d before and in 26 patients 7.5 (3.0–14.8; 2–28) d after allograft biopsy. Based on the results of index biopsies, 4 subjects were subjected to therapeutic interventions before MRI (antibiotic treatment (pyelonephritis): n = 2; high dose steroids and antithymocyte globulin [T cell-mediated rejection (TCMR)]: n = 1; immunoadsorption [antibody-mediated rejection (AMR)]: n = 1). The MRI protocol used for the study included noncontrast-enhanced T1 mapping (MOLLI-modified Look Locker imaging), T2-weighted turbo spin echo (HASTE, BLADE), and gradient-echo (TRUFI) sequences, as well as diffusion-weighted sequences (b = 0, 50, 100, 200, 300, 600, and 1000 s/mm2) with ADC mapping. MRI was performed using a 1.5-Tesla Scanner (Avanto FIT; Siemens Healthineers; Erlangen, Germany) with a standard body coil. Scans were performed by radiographers specially trained to cardiac MRI (including mapping techniques). Mapping Sequences were performed in coronal and axial planes, adjusted to the axis of the renal allograft. Image postprocessing was done using a cardiac T1/T2 postprocessing software (Qmap, Medis; Leiden, The Netherlands). Cortical T1 and T2 relaxation times were measured in 3 axial (cranial, middle, and caudal parts of the kidney) and 3 coronal slices (anterior, middle, and posterior parts of the kidney), with 6 independent regions of interest per slice. Median T1 and T2 relaxation times were assessed for the whole kidney or separately for axial versus coronal slices. A representative example of T1-weighted MRI in a kidney transplant recipient is provided in Figure S1 (SDC, http://links.lww.com/TXD/A254). In a separate analysis, cortical T1 relaxation times were obtained from the cranial pole of the renal allograft (biopsy site in all study subjects). Medullary T1 relaxation time was assessed in a similar way, and, based on cortical and medullary values, the corticomedullary difference (ΔT1) was calculated for the whole organ. Axial DWI was analyzed for the cranial, middle, and caudal parts of the kidney measuring the ADC value for the cortical and, in parallel, medullary areas. In total, 6 ADC measurements per kidney were used to calculate the corticomedullary difference of the ADC values (ΔADC).
Statistical Analysis
Continuous variables were expressed either as mean ± SD or median, IQR and range, as appropriate. The Kolmogorov–Smirnov test was applied to determine whether continuous variables were normally distributed. Categorical variables were given as absolute and relative frequencies. For comparison of continuous data unpaired Student’s t or Mann–Whitney U test, and for correlation analysis, Spearman tests were used. ROC curves and their corresponding AUC values were calculated to assess the sensitivity and specificity of different predictors. Fleiss’ kappa analysis was used for assessment of interobserver agreement. A 2-sided P <0.05 was considered statistically significant. For statistical analysis SPSS 2012 for Mac, Version 20 (SPSS Inc., Chicago, IL) was used.
RESULTS
As shown in Table 1, the majority of subjects were male (75%) and recipients of a first renal transplant (81%). Median recipient and donor age were 53.5 and 52.5 y, respectively. Eight patients (25%) were recipients of a living donor transplant. The median time between transplantation and index biopsy was 3 y. At the time of biopsy, median eGFR and protein/creatinine ratio were 34.2 mL/min/1.73 m2 and 432 mg/g, respectively. Patients with moderate to severe IF (ci > 1; n = 19) had a higher human leukocyte antigen mismatch and higher levels of proteinuria than patients with no or only mild grade IF (ci ≤ 1; n = 13). Differences in eGFR were nonsignificant (Table 1). Morphologic findings, in the overall cohort and in the relation to ci scoring, are provided in Table 2. Major morphologic diagnoses were TCMR or Banff borderline (n = 5), AMR (n = 5), SV40 antigen-positive BK virus nephropathy (n = 2), pyelonephritis (n = 2), and glomerulonephritis (n = 3) (Table 2). There were no differences between indication (n = 23) and protocol biopsies (n = 9) with respect to MRI parameters and histologic features of renal scarring (Table S2, SDC, http://links.lww.com/TXD/A254).
MRI T1 Relaxation Time in Relation to Biopsy Results
Figure 1 illustrates the relationship between the results of MRI T1 mapping and chronic transplant injury for 2 representative study subjects. Transplants scored ci2 or ci3 showed a significantly higher cortical T1 relaxation time than those with lower ci scores [median: 1451 (IQR: 1331–1506) versus 1306 (IQR: 1197–1321) ms; P = 0.011] (Table 3). As shown in Figure 2, the ROC-AUC for prediction of ci >1 was 0.76 (95% CI: 0.59-0.94; P = 0.012). Similar results were obtained in separate analyses of axial or coronal cortical sequences (Table 3; Figure 2). Groups, however, did not differ with respect to medullary T1 values or the corticomedullary difference of T1 relaxation time (ΔT1) (Table 3).
FIGURE 1.
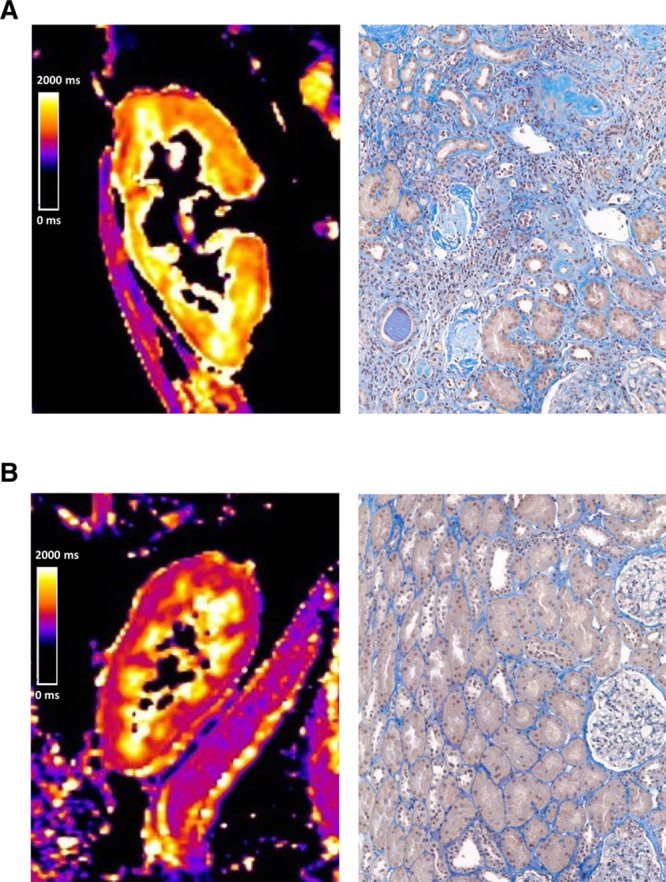
Representative examples of kidney allograft T1 mapping and corresponding biopsy results. Color scales indicate T1 relaxation times (range: 0–2000 ms). Cortical T1 relaxation time in the first case (A) was 1566 ms. For analysis of interstitial fibrosis (IF), acid fuchsin-orange G staining was used. Histologic assessment revealed chronic allograft injury with severe IF (ci3), tubular atrophy (ct3), glomerular capillary double contours (cg3), and vascular fibrous intimal thickening (cv). The second case (B) showed no features of chronic injury (ci0, ct0, cg0, and cv0) and cortical T1 values were by far lower (1191 ms).
TABLE 3.
MRI parameters in relation to the degree of interstitial fibrosis
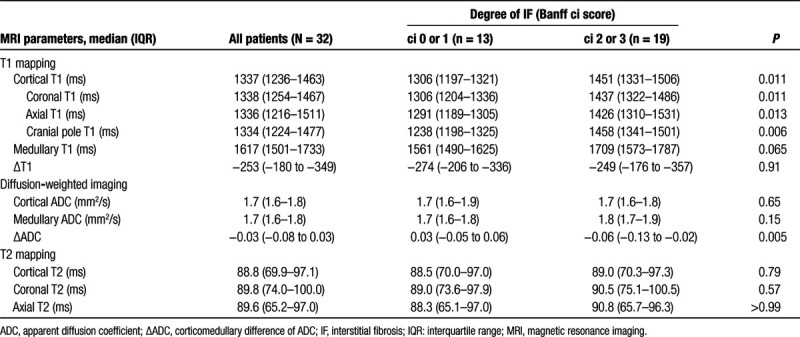
FIGURE 2.
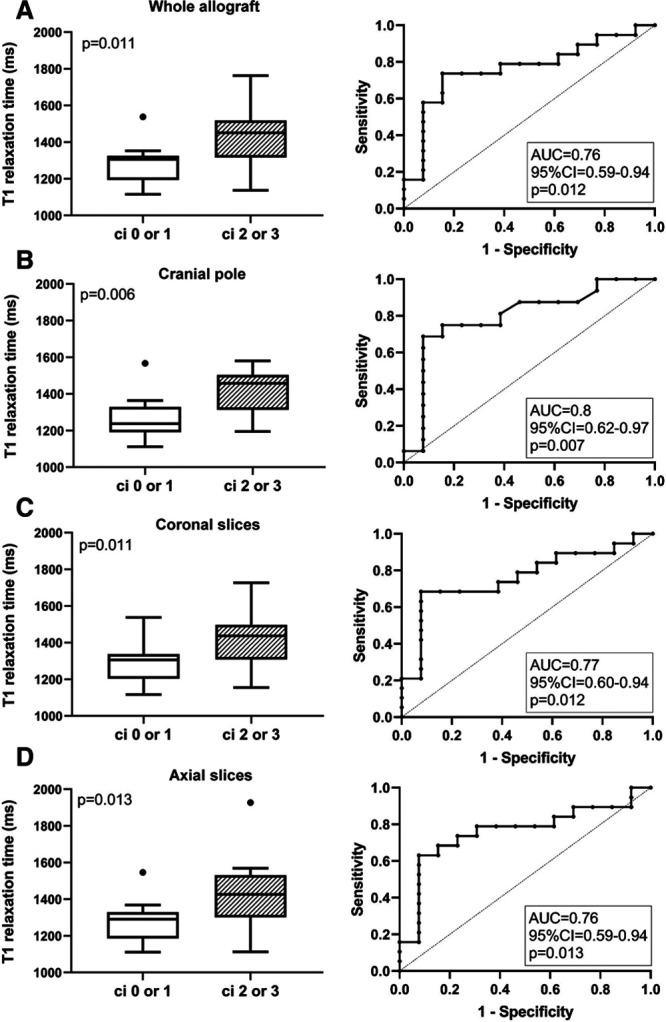
Results of T1 mapping in relation to groups defined according to Banff ci scoring. Cortical T1 relaxation times are shown for the whole transplant (A) and the cranial pole (B), as well as coronal (C) and axial (D) sections of the renal allograft. Box plots indicate the median, interquartile range, and the minimum and maximum of T1 values. Outliers are indicated as circles. The Mann–Whitney U test was used for group comparisons. The prediction of ci scores >1 by T1 mapping results is presented by receiver operating characteristic (ROC) curves and the corresponding area under the curve (AUC) including 95% confidence interval (CI) and P values.
As shown in Table 4, cortical T1 values were found to significantly correlate not only with Banff ci scores (rho = 0.39), IFTA (rho = 0.39), or %IF (rho = 0.45), but also with tubular atrophy (ct; rho = 0.51), glomerular double contours (cg; rho = 0.36), and chronic transplant vasculopathy (cv; rho = 0.44), respectively. Associations between T1 values and Banff ci scores are illustrated in Figure 3. There was no association with AMR [1353 (IQR: 1350–1539) versus 1317 (IQR: 1212–1455) ms in patients without AMR; P = 0.068] and TCMR/borderline [1313 (IQR: 1207–1329) versus 1345 (1251–1470) ms; P = 0.51] (data not shown) or, with the exception of total cortical inflammation (ti), scores of individual Banff single lesions reflecting inflammation (Table 4).
TABLE 4.
Correlation of morphologic lesion scores with MRI parameters
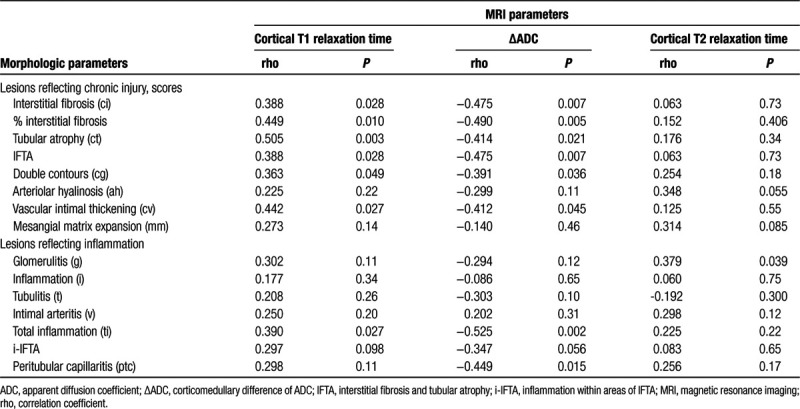
FIGURE 3.

Scatter plots with regression lines illustrating correlations of (A) cortical T1 relaxation time, (B) cortical T2 relaxation time, and (C) ΔADC with semiquantitative Banff ci scores. Spearman tests were used for correlation analysis. ΔADC, corticomedullary difference of apparent diffusion coefficient.
Considering the possibility of a patchy distribution of renal scarring, we then focused on the anatomic site of biopsy—in all individuals the cranial pole of the transplant. Intergroup differences regarding T1 relaxation time were thereby more pronounced than in analyses of the whole organ (Figure 2), yielding an AUC of 0.80 (95% CI: 0.62-0.97, P = 0.007). There were also tighter correlations with ci (rho = 0.42), IFTA (rho = 0.42), or %IF (rho = 0.46).
Finally, to exclude a relevant impact of concomitant rejection on study results, we performed a separate analysis excluding 7 patients diagnosed with AMR or TCMR. As shown in Table S3, SDC, http://links.lww.com/TXD/A254, differences between ci groups regarding cortical T1 values remained significant, with an ROC-AUC for the prediction of advanced interstitial fibrosis (ci > 1) of 0.81 (95% CI: 0.63-0.98; P = 0.011).
DWI in Relation to Biopsy Results
Groups defined according to the degree of IF (ci ≤ 1 versus ci > 1) did not differ with respect to cortical or medullary ADC assessed by DWI. As shown in Figure 4, levels of ΔADC, however, were significantly higher among transplants with c ≤1 as compared to ci >1 [median 0.03 (−0.05 to 0.06) versus −0.06 (−0.13 to −0.02); P = 0.005]. The ROC-AUC for predicting ci ≤1 was 0.79 (95% CI: 0.64-0.95; P = 0.006) (Figure 4). Furthermore, ΔADC showed a significant inverse correlation with ci scores (rho = −0.48), IFTA (rho = −0.48), and %IF (rho = −0.49) as well as ct (rho = −0.41), cg (rho = −0.39), and cv scores (rho = −0.41), respectively. Associations between ΔADC and Banff ci score are illustrated in Figure 3. ΔADC was not related to AMR [−0.06 (IQR: −0.08 to −0.06) versus −0.02 (−0.08 to 0.04) ms in patients without AMR; P = 0.21], TCMR/borderline [−0.01 (IQR: −0.03 to 0.04) versus −0.05 (−0.08 to 0.03) ms; P = 0.41] (data not shown) or Banff single lesions reflecting inflammation (except ti and ptc) (Table 4). As shown in Table S3, SDC, http://links.lww.com/TXD/A254, differences in ΔADC in relation to the degree of fibrosis remained significant after exclusion of rejecting subjects from analysis (ROC-AUC for the prediction of ci ≤ 1: 0.83; 95% CI: 0.66-1.0; P = 0.007).
FIGURE 4.
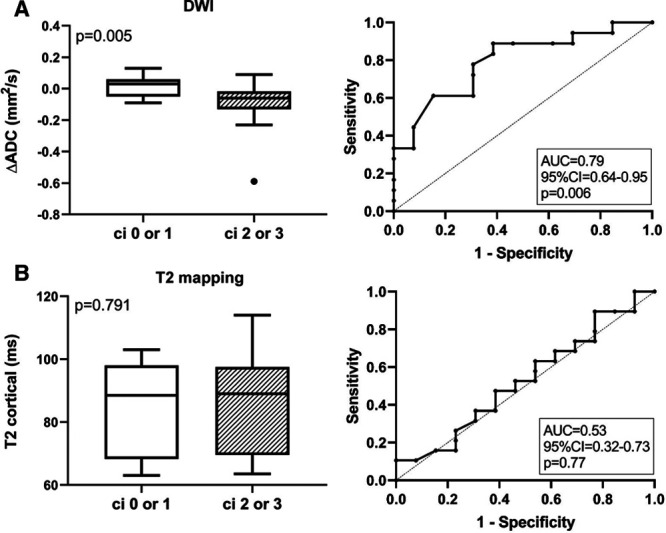
Results of cortical diffusion-weighted imaging (DWI) and T2 mapping in relation to groups defined according to Banff ci scoring. Cortical-medullary differences of the apparent diffusion coefficient (ΔADC) (A) and cortical T2 relaxation times (B) are shown. Box plots indicate the median, interquartile range, and the minimum and maximum of parameters. Outliers are indicated as circles. The Mann–Whitney U test was used for group comparisons. The prediction of ci scores >1 by ΔADC and T2 mapping results is presented by receiver operating characteristic curves and the corresponding area under the curve (AUC) including 95% confidence interval and P values.
T2 Relaxation Times in Relation to Biopsy Results
As shown in Table 3, cortical T2 relaxation time was not different between ci ≤1 and ci >1 groups. ROC-AUC for prediction of ci >1 was 0.53 (0.32-0.74, P = 0.77), respectively (Figure 4). There were also no significant correlations with %IF or single lesions reflecting chronic injury (ci, ct, cg, or cv) (Table 4, Figure 3). Considering a potential of T2 mapping as a measure of tissue inflammation, we then evaluated cortical T2 relaxation time in relation to morphologic lesions reflecting inflammation. Thereby, we found a significant correlation with glomerulitis (g) (rho = 0.38). Evaluating rejection phenotypes, we also found higher T2 values in patients with AMR [97.5 (IQR: 97.0–98.0) versus 76.0 (68.8–95.0) ms in subjects without AMR; P = 0.035]. Differences between patients with and without TCMR or Banff borderline were not significant [71 (IQR: 67–76) versus 92 (71–97) ms in subjects without AMR; P = 0.26] (data not shown).
MRI Results in Relation to Graft Function
To test for associations between radiological findings and parameters of graft function patients were grouped according to the median of computed MRI parameters (T1low versus T1high; ΔADClow versus ΔADChigh; T2low versus T2high). As shown in Figure 5, T1high patients had lower eGFR [20.9 (median; IQR: 13.6–39.8) versus 45.7 (33.1–63.2) ml/min/1.73 m2 in T1low patients; P = 0.004] and higher levels of proteinuria [protein/creatinine ratio: 1457 (389–2273) versus 128 (95–542) mg/g; P = 0.001]. ΔADChigh patients presented with a lower protein/creatinine ratio [193 (median; IQR: 90–567) versus 1019 (352–1925) mg/g in ΔADClow patients; P = 0.015)], but differences in eGFR were not significant [ΔADChigh 34.2 (20.6–59.1) versus 33.6 (19.3–43.4) ml/min/1.73 m2; P = 0.54]. T2high patients showed higher levels of proteinuria [protein/creatinine ratio: 832 (median; IQR: 350−1718) versus 158 (76–542) mg/g in T2low patients; P = 0.021], without significant differences in eGFR [35.4 (IQR: 20.8–42.2) versus 34.2 (14.8–62.4) ml/min/1.73 m2; P = 0.95].
FIGURE 5.
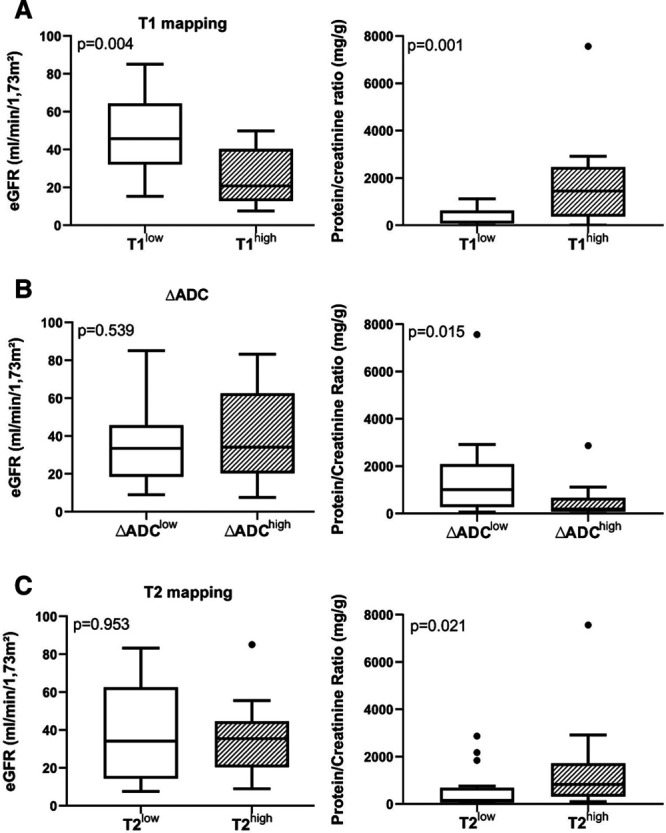
Comparison of graft function and proteinuria between patients with high or low T1 (A), cortical-medullary differences of the apparent diffusion coefficient (ΔADC) (B), and T2 values (C). Patients were grouped according to the median of measured magnetic resonance imaging parameters. Box plots indicate the median, interquartile range, and the minimum and maximum of the measures [estimated glomerular filtration rate (eGFR), protein/creatinine ratio]. Outliers are indicated as circles. The Mann Whitney U test was used for group comparisons.
DISCUSSION
A major result of our present study was a significant association between the degree of IF in allograft biopsies—visually assessed by semiquantitative Banff ci scoring—and MRI results, in particular cortical T1 relaxation time and ΔADC. Pronounced IF in subjects with higher cortical T1 values was also reflected by inferior graft function and higher levels of urinary protein excretion, both surrogate markers for long-term renal allograft survival.24,25 In contrast to previous studies,16,17,26 our results were obtained with 1.5-Tesla MRI, which may allow for broader application in patients with implantable devices.20,21
Our results support the use of MRI as a noninvasive tool for the quantification of IF, a hallmark structural correlate of chronic transplant injury.4-6 A primary finding was a significant association of cortical T1 relaxation time with the degree of IF, yielding an AUC of 0.76 for the prediction of moderate to severe ci. This was in some contrast to the results obtained by a Swiss study group.16,17 Friedli et al16 reported on 33 renal transplant patients who were subjected to biopsy-based visual and automated assessment of IF and a 3-Tesla MRI protocol established in rat models of fibrosis. In this cohort16 and in a subsequent validation study (164 patients), only weak associations were found.17 Moreover, in contrast to our present and earlier studies,27,28 cortical T1 values did not associate with kidney function. Differences to our study, which included a representative spectrum of clinical cases with all degrees of renal scarring, may be at least partly explained by different characteristics of included patient populations, most prominently, inclusion of nontransplant patients or patients with better kidney function and lower grades of IF in the Swiss studies.16,17 Given the variability in applied morphologic staining techniques and the potentially high degree of interobserver variation,10,12,13 differences may also be due to variable interpretation/scoring of renal fibrosis. Discrepant study results reinforce the need of larger trials comparing different protocols to assess the potential of MRI-based allograft imaging as a surrogate parameter reflecting chronic allograft damage and to establish ranges of normal or pathological relaxation times.29
Given the interrelationship between IF and various other features of chronic injury, it was not unexpected that T1 relaxation time correlated with other lesions, including tubular atrophy or chronic vasculopathy. There was also a significant correlation with transplant glomerulopathy, a lesion known to strongly predict allograft loss.30 Although there were no associations with active AMR, i-IFTA, or tubulointerstitial infiltrates classified as TCMR or Banff borderline, analysis of Banff single lesions revealed a marginal correlation between T1 values and ti scores. The finding of an association with tissue inflammation was in line with the results obtained in an earlier published experimental model of renal fibrosis.16
Evaluating ADC, we found no correlation between absolute cortical or medullary values and IF. This was in accordance with earlier studies, showing no or at best weak associations with renal scarring.16,17 A plausible explanation may be the so-called intravoxel incoherent motion—a phenomenon in which the ADC estimation is impaired by other processes (eg, renal perfusion or tubular flow)—resulting in a substantial interindividual variation of absolute values that presumably precludes a reliable definition of pathological ranges.31,32 In contrast, corticomedullary differences (ΔADC) showed a strong inverse association with IF. Indeed, AUC levels were even higher than those computed for T1 mapping. Our observation was in line with 2 recent studies, in which the application of a higher field strength allowed for even higher correlation coefficients, presumably due to improved image resolution.17,26 A disadvantage using higher field strength, however, may be that some patients have to be excluded because of nonconditional implants or electronic cardiac devices, which may be frequent in patients with chronic kidney disease.
In clinical practice, quantification of chronic transplant damage, with IF being the key lesion, relies on the “gold standard” of renal biopsy.9 However, morphologic analysis of transplant scarring has inherent limitations that considerably affect its reproducibility.10,12,13 This may limit the accuracy of biopsy-based analysis of IF, and at least in part explain the moderate concordance between MRI mapping and biopsy results. A major caveat may be the often patchy distribution of IF, which, with the use of core needle biopsies, may lead to a considerable sampling bias.9 A major strength of MRI analysis, including T1 mapping, DWI, diffusion tensor imaging, or elastography, is that it allows for an assessment of the whole organ, so that sampling bias becomes a minor issue. A separate analysis of T1 relaxation times derived from the site of biopsy (cranial transplant pole in all subjects) allowed us to indirectly demonstrate a possible contribution of sample variation. Indeed, a separate analysis of the cranial pole predicted IF with higher accuracy.
Another potential limitation of biopsy-based IF scoring may be a substantial interobserver variability. Earlier studies have shown that the visual assessment of IF may vary strongly between different pathologists.10-13 In a study published by Furness et al,11 pathologists from different countries were asked to assess IF in 55 renal allograft biopsies. After a first assessment, feedback about the deviation of each pathologist’s estimation from the others was given. In both rounds, variation in IF grading was large resulting in kappa values below 0.4.11 Also in our study, the separate analysis of Banff ci and ct scores by an independent pathologist revealed a significant degree of interobserver variability (kappa values of 0.61 and 0.50, respectively), even though ROC-AUC values calculated for T1 mapping (prediction of ci > 1) remained only marginally different. One approach to minimize this type of variability may be the use of computer-based morphometric analysis.12,13,33,34 Future studies will have to clarify whether more objective approaches, such as morphometry, are able to improve associations with the results of noninvasive diagnostic tools, such as MRI.
Similarly, the interpretation of MRI results may have the advantage that it is based on computer-generated objective parameters. Nevertheless, one may argue that a certain IF-independent interindividual variation of such parameters may have limited the diagnostic accuracy of MRI analysis. Our study design did not address the accuracy to detect the dynamics of IF in longitudinal MRI examinations and concomitant biopsies, an issue to be addressed in future studies. However, one may speculate that the longitudinal evolution of MRI parameters to estimate the extent of fibrosis without a need for sequential biopsies may serve as a useful surrogate endpoint for interventional studies investigating innovative therapies to counteract the process of chronic graft damage.
In line with a previous study,17 we did not find any correlation between the results of T2 mapping and renal scarring. Secondary analyses, however, revealed significant associations of cortical T2 relaxation times with glomerulitis and the diagnosis of AMR. Our preliminary results may add to earlier experimental studies suggesting an association of T2 relaxation times with distinct features reflecting inflammation,35 even though we are aware that our study was not powered to detect subtle differences in these parameters. Nevertheless, our results may provide a basis for future in-depth analyses assessing the value of MRI in this specific context.
We are aware that our study has several inherent limitations. Our sample size calculation was based on the assumption of a 1:1 ratio between fibrosis groups (16 patients per group). At the end, however, only 13 of the 32 included subjects had a ci score below 2. Notably, a post hoc sample size calculation assuming a 4:6 ratio revealed that a number of 29 subjects would be needed (12 versus 17), which is still less than the number included in the trial. Another limitation may be the heterogeneity of our study cohort, with a considerable variation in the degree of scarring and a variable pattern of acute and chronic single lesions. Pure phenotypes, such as isolated IFTA, were infrequent, and one may argue that distinct morphologic lesions, such as allograft rejection, may have significantly influenced the diagnostic accuracy of MRI. Notably, after exclusion of AMR and TCMR cases from analysis, differences between ci groups regarding T1 relaxation times or ΔADCs remained significant, with ROC-AUC levels exceeding 0.80. Moreover, 2 patients underwent antirejection treatment before MRI, which may have influenced imaging results, in particular those related to inflammation (T2 mapping).
In conclusion, our data support a value of noninvasive MRI-based evaluation of renal allografts as an additional tool for assessing the degree of scarring. At the same time, our results reinforce that tested MRI parameters cannot replace the broad diagnostic potential of allograft biopsies. However, we believe that our study may provide a valuable basis for future trials designed to clarify whether serial measurements of T1 relaxation time, ΔADC, or other MRI parameters allow for a reliable assessment of the course of chronic allograft damage, thus predicting progressive graft dysfunction and loss.
Supplementary Material
Footnotes
Published online 15 July, 2020
A.B-T. and M.E. contributed equally to this work. A.B-T., M.E., D.B., and G.A.B. participated in the research design, performance of the research, data analysis, interpretation of results, and writing of the manuscript. F.E., A.A., K.L., H.R., and J.K. participated in performance of research, data analysis, and writing of the manuscript.
The authors declare no funding or conflicts of interest.
Supplemental digital content (SDC) is available for this article. Direct URL citations appear in the printed text, and links to the digital files are provided in the HTML text of this article on the journal’s Web site (www.transplantationdirect.com).
REFERENCES
- 1.Duffield JS. Cellular and molecular mechanisms in kidney fibrosis. J Clin Invest. 2014; 124:2299–2306. doi:10.1172/JCI72267 [DOI] [PMC free article] [PubMed] [Google Scholar]
- 2.Vanhove T, Goldschmeding R, Kuypers D. Kidney fibrosis: origins and interventions. Transplantation. 2017; 101:713–726. doi:10.1097/TP.0000000000001608 [DOI] [PMC free article] [PubMed] [Google Scholar]
- 3.Srivastava A, Palsson R, Kaze AD, et al. The prognostic value of histopathologic lesions in native kidney biopsy specimens: results from the Boston Kidney Biopsy Cohort Study. J Am Soc Nephrol. 2018; 29:2213–2224. doi:10.1681/ASN.2017121260 [DOI] [PMC free article] [PubMed] [Google Scholar]
- 4.Nicholson ML, McCulloch TA, Harper SJ, et al. Early measurement of interstitial fibrosis predicts long-term renal function and graft survival in renal transplantation. Br J Surg. 1996; 83:1082–1085. doi:10.1002/bjs.1800830813 [DOI] [PubMed] [Google Scholar]
- 5.Nankivell BJ, Fenton-Lee CA, Kuypers DR, et al. Effect of histological damage on long-term kidney transplant outcome. Transplantation. 2001; 71:515–523. doi:10.1097/00007890-200102270-00006 [DOI] [PubMed] [Google Scholar]
- 6.Cosio FG, Grande JP, Wadei H, et al. Predicting subsequent decline in kidney allograft function from early surveillance biopsies. Am J Transplant. 2005; 5:2464–2472. doi:10.1111/j.1600-6143.2005.01050.x [DOI] [PubMed] [Google Scholar]
- 7.Furness PN, Philpott CM, Chorbadjian MT, et al. Protocol biopsy of the stable renal transplant: a multicenter study of methods and complication rates. Transplantation. 2003; 76:969–973. doi:10.1097/01.TP.0000082542.99416.11 [DOI] [PubMed] [Google Scholar]
- 8.Redfield RR, McCune KR, Rao A, et al. Nature, timing, and severity of complications from ultrasound-guided percutaneous renal transplant biopsy. Transpl Int. 2016; 29:167–172. doi:10.1111/tri.12660 [DOI] [PubMed] [Google Scholar]
- 9.Farris AB, Alpers CE. What is the best way to measure renal fibrosis?: a pathologist’s perspective. Kidney Int Suppl (2011). 2014; 4:9–15. doi:10.1038/kisup.2014.3 [DOI] [PMC free article] [PubMed] [Google Scholar]
- 10.Furness PN, Taub N; Convergence of European Renal Transplant Pathology Assessment Procedures (CERTPAP) Project Convergence of European Renal Transplant Pathology Assessment Procedures (CERTPAP) Project. International variation in the interpretation of renal transplant biopsies: report of the CERTPAP Project. Kidney Int. 2001; 60:1998–2012. doi:10.1046/j.1523-1755.2001.00030.x [DOI] [PubMed] [Google Scholar]
- 11.Furness PN, Taub N, Assmann KJ, et al. International variation in histologic grading is large, and persistent feedback does not improve reproducibility. Am J Surg Pathol. 2003; 27:805–810. doi:10.1097/00000478-200306000-00012 [DOI] [PubMed] [Google Scholar]
- 12.Farris AB, Adams CD, Brousaides N, et al. Morphometric and visual evaluation of fibrosis in renal biopsies. J Am Soc Nephrol. 2011; 22:176–186. doi:10.1681/ASN.2009091005 [DOI] [PMC free article] [PubMed] [Google Scholar]
- 13.Farris AB, Chan S, Climenhaga J, et al. Banff fibrosis study: multicenter visual assessment and computerized analysis of interstitial fibrosis in kidney biopsies. Am J Transplant. 2014; 14:897–907. doi:10.1111/ajt.12641 [DOI] [PubMed] [Google Scholar]
- 14.Dulai PS, Sirlin CB, Loomba R. MRI and MRE for non-invasive quantitative assessment of hepatic steatosis and fibrosis in NAFLD and NASH: clinical trials to clinical practice. J Hepatol. 2016; 6551006–1016. doi:10.1016/j.jhep.2016.06.005 [DOI] [PMC free article] [PubMed] [Google Scholar]
- 15.Karamitsos TD, Arvanitaki A, Karvounis H, et al. Myocardial tissue characterization and fibrosis by imaging. JACC Cardiovasc Imaging. 2020; 1351221–1234. doi:10.1016/j.jcmg.2019.06.030 [DOI] [PubMed] [Google Scholar]
- 16.Friedli I, Crowe LA, Berchtold L, et al. New magnetic resonance imaging index for renal fibrosis assessment: a comparison between diffusion-weighted imaging and t1 mapping with histological validation. Sci Rep. 2016; 6:30088 doi:10.1038/srep30088 [DOI] [PMC free article] [PubMed] [Google Scholar]
- 17.Berchtold L, Friedli I, Crowe LA, et al. Validation of the corticomedullary difference in magnetic resonance imaging-derived apparent diffusion coefficient for kidney fibrosis detection: a cross-sectional study. Nephrol Dial Transplant. doi:10.1093/ndt/gfy389 [DOI] [PubMed] [Google Scholar]
- 18.Kirpalani A, Hashim E, Leung G, et al. Magnetic resonance elastography to assess fibrosis in kidney allografts. Clin J Am Soc Nephrol. 2017; 12:1671–1679. doi:10.2215/CJN.01830217 [DOI] [PMC free article] [PubMed] [Google Scholar]
- 19.Hueper K, Khalifa AA, Bräsen JH, et al. Diffusion-weighted imaging and diffusion tensor imaging detect delayed graft function and correlate with allograft fibrosis in patients early after kidney transplantation. J Magn Reson Imaging. 2016; 44:112–121. doi:10.1002/jmri.25158 [DOI] [PubMed] [Google Scholar]
- 20.Yeung SST, Clark M, Loshak H. Magnetic resonance imaging for patients with implantable cardiac devices: a review of safety and guidelines. CADTH Rapid Response Report: Summary with Critical Appraisal. 2019Ottawa, ON: Canadian Agency for Drugs and Technologies in Health; [PubMed] [Google Scholar]
- 21.Schick F. Whole-body MRI at high field: technical limits and clinical potential. Eur Radiol. 2005; 15:946–959. doi:10.1007/s00330-005-2678-0 [DOI] [PubMed] [Google Scholar]
- 22.Roufosse C, Simmonds N, Clahsen-van Groningen M, et al. A 2018 reference guide to the banff classification of renal allograft pathology. Transplantation. 2018; 102:1795–1814. doi:10.1097/TP.0000000000002366 [DOI] [PMC free article] [PubMed] [Google Scholar]
- 23.Haas M, Loupy A, Lefaucheur C, et al. The Banff 2017 Kidney Meeting Report: Revised diagnostic criteria for chronic active T cell–mediated rejection, antibody-mediated rejection, and prospects for integrative endpoints for next-generation clinical trials. Am J Transplant. 2018; 18:293–307. doi:10.1111/ajt.14625 [DOI] [PMC free article] [PubMed] [Google Scholar]
- 24.Clayton PA, Lim WH, Wong G, et al. Relationship between eGFR decline and hard outcomes after kidney transplants. J Am Soc Nephrol. 2016; 27:3440–3446. doi:10.1681/ASN.2015050524 [DOI] [PMC free article] [PubMed] [Google Scholar]
- 25.Naesens M, Lerut E, Emonds MP, et al. Proteinuria as a noninvasive marker for renal allograft histology and failure: an observational cohort study. J Am Soc Nephrol. 2016; 27:281–292. doi:10.1681/ASN.2015010062 [DOI] [PMC free article] [PubMed] [Google Scholar]
- 26.Wang W, Yu Y, Wen J, et al. Combination of functional magnetic resonance imaging and histopathologic analysis to evaluate interstitial fibrosis in kidney allografts. Clin J Am Soc Nephrol. 2019; 14:1372–1380. doi:10.2215/CJN.00020119 [DOI] [PMC free article] [PubMed] [Google Scholar]
- 27.Huang Y, Sadowski EA, Artz NS, et al. Measurement and comparison of T1 relaxation times in native and transplanted kidney cortex and medulla. J Magn Reson Imaging. 2011; 33:1241–1247. doi:10.1002/jmri.22543 [DOI] [PMC free article] [PubMed] [Google Scholar]
- 28.Peperhove M, Vo Chieu VD, Jang MS, et al. Assessment of acute kidney injury with T1 mapping MRI following solid organ transplantation. Eur Radiol. 2018; 28:44–50. doi:10.1007/s00330-017-4943-4 [DOI] [PubMed] [Google Scholar]
- 29.Wolf M, de Boer A, Sharma K, et al. Magnetic resonance imaging T1- and T2-mapping to assess renal structure and function: a systematic review and statement paper. Nephrol Dial Transplant. 2018; 33suppl_2ii41–ii50. doi:10.1093/ndt/gfy198 [DOI] [PMC free article] [PubMed] [Google Scholar]
- 30.Cosio FG, Gloor JM, Sethi S, et al. Transplant glomerulopathy. Am J Transplant. 2008; 8:492–496. doi:10.1111/j.1600-6143.2007.02104.x [DOI] [PubMed] [Google Scholar]
- 31.Sigmund EE, Vivier PH, Sui D, et al. Intravoxel incoherent motion and diffusion-tensor imaging in renal tissue under hydration and furosemide flow challenges. Radiology. 2012; 263:758–769. doi:10.1148/radiol.12111327 [DOI] [PubMed] [Google Scholar]
- 32.Zhang JL, Sigmund EE, Chandarana H, et al. Variability of renal apparent diffusion coefficients: limitations of the monoexponential model for diffusion quantification. Radiology. 2010; 254:783–792. doi:10.1148/radiol.09090891 [DOI] [PMC free article] [PubMed] [Google Scholar]
- 33.Nicholson ML, Bailey E, Williams S, et al. Computerized histomorphometric assessment of protocol renal transplant biopsy specimens for surrogate markers of chronic rejection. Transplantation. 1999; 68:236–241. doi:10.1097/00007890-199907270-00013 [DOI] [PubMed] [Google Scholar]
- 34.Sund S, Grimm P, Reisaeter AV, et al. Computerized image analysis vs semiquantitative scoring in evaluation of kidney allograft fibrosis and prognosis. Nephrol Dial Transplant. 2004; 19:2838–2845. doi:10.1093/ndt/gfh490 [DOI] [PubMed] [Google Scholar]
- 35.Hueper K, Rong S, Gutberlet M, et al. T2 relaxation time and apparent diffusion coefficient for noninvasive assessment of renal pathology after acute kidney injury in mice: comparison with histopathology. Invest Radiol. 2013; 48:834–842. doi:10.1097/RLI.0b013e31829d0414 [DOI] [PubMed] [Google Scholar]
Associated Data
This section collects any data citations, data availability statements, or supplementary materials included in this article.


