

Abstract
Development of upconverting nanomaterials which are able to emit visible light upon near-infrared excitation opens a wide range of potential applications. Because of their remarkable photostability, they are widely used in bioimaging, optogenetics, and optoelectronics. In this work, we demonstrate the influence of several experimental conditions as well as a dopant concentration on the luminescence properties of upconverting nanocrystals (UPNCs) that need to be taken into account for their efficient use in the practical applications. We found that not only nanoparticle architecture affects the optical properties of UPNCs, but also factors such as sample concentration, excitation light power density, and temperature may influence the green-to-red emission ratio. We performed studies on both the single-nanoparticle and ensemble levels over a broad concentration range and found the heterogeneity in the optical properties of UPNCs with low dopant concentrations.
Introduction
Upconverting nanomaterials have been intensively studied over the past 20 years.1 This effort results in numerous practical concepts from construction of coherent light sources,2 solar cell technology,3,4 and photodynamic therapy5 to display technology.6 Development of upconverting nanocrystals (UPNCs)7 paved a new path to the many new practical implementations. The unique optical properties of UPNCs such as anti-Stokes, multiband emission, long-time luminescence decay, narrow emission bands, and the absence of photobleaching make them attractive materials for bioimaging.8−13 Moreover, the efficiency of the upconversion process in UPNCs is a few orders of magnitude higher compared to that in popular two-photon fluorophores.14,15 Recently, UPNCs were used in optogenetics to locally activate biological photoreactive molecules to control neural activity.16−18 On the contrary to the colloidal semiconducting quantum dots, UPNCs do not exhibit quantum size effect19 and their optical properties only weakly depend on UPNC surface changes.20 Therefore, the nanocrystals of a size ranging from 5 to 200 nm may have the same photoluminescence peak position, with significantly different mobility in liquid media. These properties make the UPNCs very attractive for biological applications,21 for example, in studies of protein–protein interactions22 or DNA release.23 In the abovementioned examples, one of the main expectations from UPNCs is to improve emission quantum yield (EQY) as high as possible. Therefore, one of the main challenges in this research field is emission quantum yield improvement. Recently, a significant progress was achieved: an EQY as high as 10% was reported for the core–shell NaYF4:Yb,Er.24
One of the main reasons for a low EQY is excitation energy loss at the UPNC surface due to the so-called percolation process that we studied in detail recently.25 This process might be restrained with the preparation of UPNCs in the core–shell architecture with a proper relative ion concentration and UPNC core size versus shell thickness ratio.24,26−29 A very promising but challenging frontier in the field of UPNCs is controlling the color output by external parameters such as excitation pulse duration, repetition rate, and intensity. In this approach, the emission can be switched between red and green depending on the variation of these parameters.30 This could find applications in multicolor displays or anticounterfeiting systems.31 Another application where the relative UPNC emission intensities became very important is nanothermometry.32,33 In this case, the intensity ratio of two distinct green emission bands in the Yb3+–Er3+ systems strongly depends on lanthanide energy level population, which is directly related to local ion temperature. As a result, the ratio of green emission bands might be used to probe the temperature of the UPNC environment. Thus, in the abovementioned examples, the value of the ratio between the emission bands of the ion has a practical meaning. On the other hand, because of the complex energy structure of lanthanide ions and the number of possible interactions between the ions (donor–donor, donor–acceptor, acceptor–acceptor, ions–ligands, ions–defects), the resulting value of emission band ratio depends on many internal and external factors. As shown by Liu et al., as well as our group, the optical properties of UPNCs, especially G/R (green-to-red ratio), might be affected by laser power density, laser pulse duration, or laser frequency.30,34,35 The G/R ratio could also be dependent on the type of lanthanide ion (or a combination of ions) and its relative concentration. Moreover, it was shown that the G/R ratio depends on UPNC size because of ion aggregation and core–shell outdiffusion phenomena.36−38 The G/R ratio can also depend on factors such as UPNC colloid clarity (ligand self-absorption), experimental setup configuration, and UPNC phase (powder, colloid in cuvettes, or a thin layer deposited on the solid substrate), or even in some cases, it could also be dependent on integration time or monochromator slit width.39
All foregoing factors need to be considered prior to using UPNCs in practical applications to provide the optimal design or experimental configuration. These effects might substantially affect the results obtained with experimental techniques where high optical power densities are used, such as two-photon excitation microscopy. The effect of ensemble averaging characteristics for the experiments on the bulk material may obscure the true spectral line widths and cover some optical properties of nanoparticles. Therefore, it is important to study the optical properties of UPNCs on the single-nanocrystal level, which could give new insight into the energy migration process within a single nano-object and the local ion environment, that is, the crystal field or ion concentration.
In this work, we study the influence of the colloid concentration and dopant content on the G/R emission ratio of NaYF4:Yb3+,Er3+ UPNCs under various experimental conditions (excitation laser power density and temperature) in both the single-nanocrystal and ensemble regimes. The aim of this work was to investigate the homogeneity of macroscopically manifested processes responsible for changes in G/R ratio, namely, ion–ion and ion–ligand interactions.
Results and Discussion
We perform experiments on the single-UPNC level and for the bulk sample because of the problem of ensemble averaging that might screen the optical properties of individual UPNCs. For the study, the NaYF4:Yb3+,Er3+ nanoparticles with different Yb3+ concentrations (5–30 mol %) were used. The nanoparticles were synthesized by a conventional high-temperature coprecipitation technique, resulting in uniform nanospheres (Figure 1) that do not feature luminescence anisotropy typical for hexagon-shaped UPNCs.40 Size distribution histograms are shown in Figure S1.
Figure 1.

TEM micrographs of NaYF4:Yb3+,Er3+ nanocrystals with different Yb3+ concentrations: (a) 5, (b) 10, (c) 15, (d) 20, and (e) 30 mol % at a constant Er3+ concentration (2 mol %).
For the highly diluted colloids, individual nanocrystals are distinguishable when the separation between neighboring nanocrystals is greater than the diffraction limit, which in our case was ∼250 nm. An example of photoluminescence intensity maps is shown in Figure 2a,b. The photoluminescence intensity image of the bulk sample features a bright inhomogeneous intensity distribution with a distinct random structure. Our custom-built fluorescence microscope allows us to illuminate the full field of view of the object in the so-called widefield mode and also in a small diffraction-limited area when operating in the scanning mode. The first mode enables us to do regular imaging and localize the position of individual emitters and then subsequently excite individual nanocrystals. The corresponding example of normalized photoluminescence spectra coming from individual UPNCs and from the bulk sample with a different Yb3+ content is shown in Figure 2c,d. All photoluminescence spectra were recorded with a microscope operating in the scanning mode. The emission spectra were normalized to the maximum value of the red emission band. In both cases, three peaks corresponding to the transition of the Er3+ ion from 2H11/2, 4S3/2, and 4F9/2 levels to the ground 4I15/2 state are visible. However, the emission bands of single nanocrystals exhibit a fine structure because of the local crystal field that is not visible in the luminescence spectra recorded from the ensemble of UPNCs. This difference is especially evident for UPNCs with a low Yb3+ content (5–15%). It suggests that the local crystal field in the vicinity of Er3+ ions is highly diverse from nanocrystal to nanocrystal in NaYF4:Yb3+,Er3+ with a low Yb3+ content. From Figure 2, it can be seen that for UPNCs with a higher Yb3+ content, the difference in emission shape collected from single UPNCs and from an ensemble of UPNCs is not present. This leads us to the conclusion that for a low Yb3+ content, the variation of the Er3+ local crystal field is more pronounced. In other words, the samples with a higher Yb3+ content are more homogeneous, and thus, the difference between signals from a single UPNC and from an ensemble of UPNCs is not visible. Another conclusion from this experiment is that the emission from UPNCs could be dependent on nanocrystal concentration. It was originally suggested by Sarkar et al.41 and confirmed experimentally by Rodríguez-Sevilla et al.42 that the interparticle interactions could modulate the luminescence of the neighboring nanoparticles, especially in a colloidal suspension where collision-assisted self-absorption induces measureable spectral changes.
Figure 2.

Photoluminescence intensity maps of single UPNCs (a) and ensemble of UPNCs (b). Example of photoluminescence spectra of single UPNCs (c) and highly concentrated colloid (d) for all studied Yb3+ concentrations (scale bars, 10 μm).
We investigated the correlation of the G/R ratio and the total number of UPNCs because of the possible effect of UPNC concentration on the optical properties of the sample. For a constant excitation power density of 1700 W/cm2, with negligible photobleaching, the photoluminescence intensity is proportional to the number of optically active Er3+ ions. Assuming a constant number of Yb3+ ions per UPNC for a given Yb3+ content, the photoluminescence intensity will be proportional to the number of excited UPNCs. Thus, the number of UPNCs is proportional to the number of recorded photons. In our experiment, the number of UPNCs was changed by diluting the UPNC solution. Figure 3 shows the plot of G/R ratio as a function of the photoluminescence intensity, proportional to the number of UPNCs. In Figure 3, two regions can be identified, a single UPNC regime (dashed box), where the UPNCs were separated from each other, and the ensemble regime (outside the box) where they were densely packed. As expected from the literature,37,43,44 the G/R ratio is affected by the Yb3+ concentration and its value is reduced with the increase of Yb3+ content. From Figure 3, we can see that the G/R ratio for bulk samples does not depend on colloid concentration for UPNCs with a high Yb3+ content over the wide range of UPNC concentrations. Moreover, it can be seen that for samples with a high Yb3+ content, the G/R ratio slightly increases when we reach the single-nanocrystal regime. It is also evident that for low concentrations of Yb3+ (5 and 10%), the distributions of G/R ratios are significantly broader than those for higher Yb3+ concentrations. This effect is particularly visible for samples with 5% Yb3+. The difference between nanocrystals with a low and high concentration of Yb3+ ions is difficult to compare because of the overall low performance of UPNCs with a high Yb3+ concentration; however, for UPNCs with a 5% Yb3+ content, the variation of the luminescence spectra is evident (Figure S2).
Figure 3.
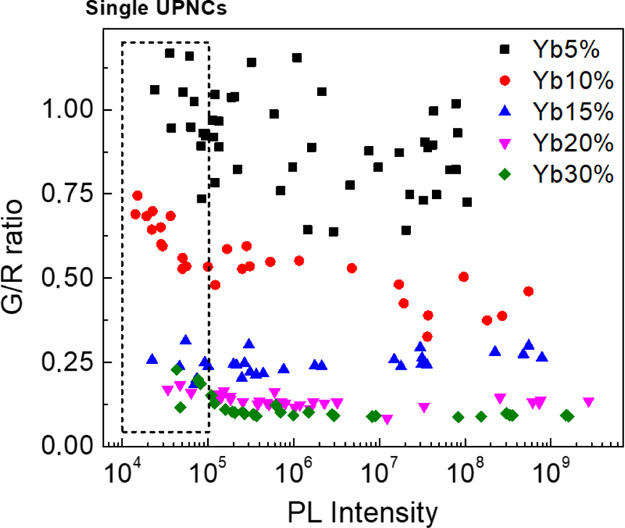
Dependence of G/R ratio as a function of photoluminescence intensity of UPNCs ranging from single nanocrystals to the bulk sample for all studied Yb3+ concentrations.
Generally, we observed a trend where the lower Yb3+ concentration leads to the bigger spread of the obtained results. This can be explained by the fact that synthesis of UPNCs with a low Yb3+ concentration requires a low concentration of the precursor that might lead to unequal distribution of the ions in the reaction mixture and uneven uptake of Yb3+ ions during the formation of new nanocrystals. This result also indicates that synthesis of UPNCs with a low Yb3+ concentration and homogeneous optical properties is challenging. Such heterogeneity explains our previous results, where the optical properties of UPNCs with a Yb3+ concentration <10% often did not follow the general trends with the change of the Yb3+ concentration. This is also in agreement with the results shown in Figure 2, where the UPNCs with a higher Yb3+ content seem to be much more homogeneous from the point of view of their optical properties. However, in this case, the lack of optical homogeneity over UPNCs is not related with variation in the Er3+ local crystal field but must be related to either a different ion–ion configuration or different Er3+ ion coupling to the nanocrystal surface from one nanocrystal to another. Nevertheless, except these mentioned options, variation from nanocrystal to nanocrystal could be responsible for the observed spread in values of G/R ratio, but other external factors might have their contribution. These could be variation of excitation power density and local temperature. In highly dense samples that were not employed in our study, laser-induced heat dissipation could have a noticeable influence. Also, the number of delivered photons per second to the nanocrystal film could vary from sample to sample because of the multilayer geometry of the samples.
Next, we investigated the influence of the excitation power density on the optical properties of UPNCs. As previously mentioned, two experimental regimes were taken into consideration, single UPNCs and an ensemble of UPNCs. In the first case, the colloid was highly diluted, resulting in a nanomolar concentration that allows imaging and identification of individual nanocrystals. The sample at the ensemble level was prepared from the stock solution of a micromolar nanocrystal concentration which led to a continuous distribution of UPNCs over the substrate surface. The results are shown in Figure 4a,b. Every point on the plot is the result of averaging of 10 photoluminescence spectra for a given colloid concentration and the excitation light power density. Thus, the given errors reflect the distribution of results measured from UPNC to UPNC. Each of the luminescence spectra was recorded for different nanocrystals or in the bulk sample, and every spectrum was recorded for different laser spot positions. The excitation light was focused on the diffraction-limited spot positioned at the UPNC of interest. In our experiment, we were able to record the photoluminescence spectra with the excitation light power density from 700 up to 1800 W/cm2. For both the single-UPNC and UPNC ensemble samples, we did not observe any statistically significant difference in G/R ratio in the range of investigated excitation light power densities. Thus, we excluded the impact of variation in excitation power density as the origin of the spread in obtained G/R values shown in Figure 4.
Figure 4.

Influence of excitation light power density on G/R ratio of the UPNC photoluminescence for single UPNCs (a) and ensemble of UPNCs (b).
Two facts are worth to be underlined at this point. First, in microscopic experiments, the excitation power density delivered to UPNCs can be precisely determined, whereas for macroscopic measurements in a cuvette, it is a very difficult task. Second, when performing the microscopic experiments as a function of the excitation power density, the effect of increased local temperature must also be considered. To verify the influence of the temperature on the G/R ratio, the macroscopic sample was deposited on a glass coverslip and heated with a hot air gun (Figure S3). The UPNCs were excited with a 980 nm laser, operating with the lowest possible excitation output power. The sample temperature was monitored with a thermographic camera (Figure S4). The G, G1, G2, and R parameters are the results of the integration of the emission bands as indicated in Figure 5a. The G/R ratio for UPNCs with different Yb3+ concentrations is shown in Figure 5b. For concentrations of 15, 20, and 30%, the G/R ratio does not change with the increase of the temperature. However, for Yb3+ concentrations of 5 and 10% (the black curve and red curve, respectively), the G/R ratio slightly increased with the temperature increase. To check the temperature increase, we plot the dependence of G1/G2 ratio as a function of temperature (Figure 5c). As expected, the ratio increases with the increase of local nanocrystal temperature.33,45,46
Figure 5.

(a) Example of photoluminescence spectra of UPNCs with schematically illustrated G, G1, G2, and R spectral regions. (b) G/R ratio as a function of temperature. (c) Comparison of G1/G2 ratio dependence on the temperature for different Yb3+ concentrations.
The effect of sample heating is a big concern in most of the practical applications. On the other hand, as shown in Figure 5c, the G1/G2 ratio could be a good indicator of temperature increase. Therefore, we investigate whether in our experimental configuration the use of high-power lasers leads to the accumulation of heat and the increase of the local temperature. Figure 6 shows the G1/G2 ratio of single UPNCs with different Yb3+ concentrations as a function of laser power density. The results indicate that with the studied power density range, the sample temperature was constant. However, this might be different for UPNCs embedded in a thick polymer film or biological tissue, where higher scattering and absorption occurs for a 980 nm excitation wavelength. In such a case, optical power might be transformed to heat and increase the sample temperature. In our case, nanocrystals were dispersed in hexane that immediately evaporates, leaving bare nanocrystals on the glass substrate. Nonetheless, based on our experimental results, we can conclude that the influence of local temperature increase produced by laser power on the results shown in Figure 4 is marginal.
Figure 6.

G1/G2 ratio of single UPNCs as a function of the laser power density for different Yb3+ concentrations.
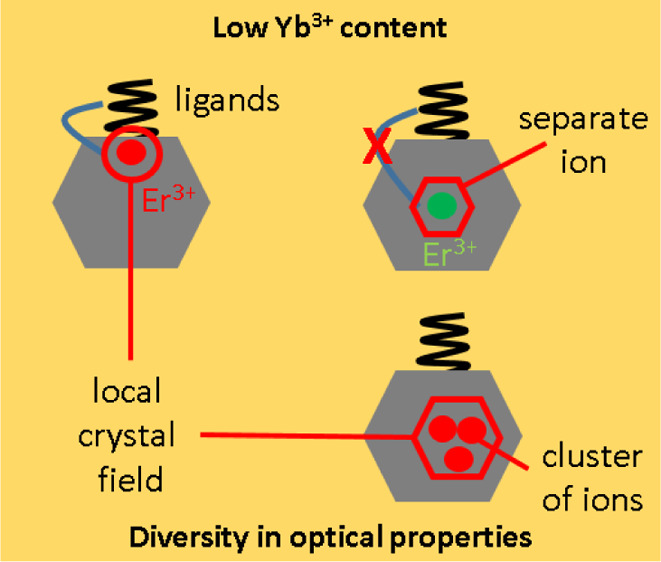
Based on our reported results, we can exclude the impact of uncontrolled experimental conditions on the spread of recorded G/R values shown in Figure 3. We can assume that the observed results are either due to variation of local ion configurations (different clusters) from nanocrystal to nanocrystal or due to different coupling of ions to nanocrystal surface ligands or defects, which is schematically illustrated in Figure 7. In the case of high Yb3+ concentrations, the specificity is removed through the effect of averaging that results in homogeneous properties of individual nanocrystals.
Figure 7.

Low content of Yb3+ ions led to a specific Er3+ composition (vicinity of ligands, various local crystal fields, and the formation of clusters) and diversity in optical properties of single UPNCs (a); with the increase of Yb3+ content, the overall ion distribution in UPNCs becomes uniform (b).
Conclusions
We systematically studied the influence of experimental factors such as excitation light power density, UPNC concentration, temperature, and nanoparticle composition (different Yb3+ concentrations) on the photoluminescence spectra of the NaYF4:Yb3+,Er3+ nanoparticles. Because of the possible effect of ensemble averaging, we performed experiments on both the single and ensemble levels. We have observed a big spread in the local crystal field for particles with a low Yb3+ concentration. Additionally, we found that the G/R ratio of these samples increases as a result of heterogeneity of Yb3+ content as well as unequal ion distribution within a single nanoparticle. Although a low Yb3+ content resulted in the highest G/R ratio of NaYF4:Yb3+,Er3+, UPNCs with a low Yb3+ concentration are not recommended for practical applications because of nonuniform distribution of Yb3+ ions and thus low reproducibility of the synthesized nanocrystals. For both the single-nanoparticle and nanoparticle ensemble samples, we did not observe any measurable effect on G/R ratio for the investigated range of excitation power densities. Also, we did not find any significant change of G/R ratio for the temperatures changing from 25 to 100 °C. This finding could be important in biological systems where the absorption of near-infrared light leads to heat accumulation and a local increase of temperature.
Materials and Methods
Synthesis of Core NaYF4:Yb3+,Er3+ Nanocrystals
NaYF4:Yb3+,Er3+ nanoparticles with different Yb3+ concentrations were prepared according to previously published reports.3,18,37 To obtain NaY(78%)F4:Yb3+(20%),Er3+(2%) nanoparticles, 1 mmol of lanthanide chlorides, that is, YCl3 (0.78 mmol), YbCl3 (0.2 mmol), and ErCl3 (0.02 mmol), was mixed with oleic acid (6 mL) and octadec-1-ene (15 mL) in a 100 mL three-neck round-bottom flask. The mixture was slowly heated to 160 °C, where it was kept for 30 min with stirring under an argon atmosphere to form a homogeneous solution. The mixture was cooled down to room temperature; a methanolic solution of NaOH (4 mmol) and NH4F·HF (2.5 mmol) was added dropwise, and the mixture was slowly heated to 120 °C under an argon atmosphere until methanol evaporation. Finally, the mixture was heated to 300 °C and kept at this temperature for 1.5 h. After cooling down to room temperature, the NaYF4:Yb3+,Er3+ nanoparticles were precipitated by acetone (10 mL), washed with ethanol three times, and redispersed in hexane.
Optical Imaging and Spectroscopy Measurement
Fluorescence microscopy measurements were performed on a custom-built optical setup. It is a conventional widefield fluorescence microscope equipped with a pigtailed 980 nm CW laser with a nominal output power of 500 nm. Excitation light was directed toward the sample with an oil immersion objective (Olympus, NA 1.3, 100×). Luminescence was collected in the back reflection mode with the same objective. The excitation light and photoluminescence of the sample were separated with a dichroic mirror (Chroma, ET750sp). Depending on the measurement mode, the emitted light was reflected toward the monochromator (Horiba, iHR550) equipped with a CCD camera (Horiba, Symphony SII) or focused on an imaging detector (EMCCD, Photometrics Cascade 512B). Photoluminescence spectra as a function of the sample temperature were recorded on a custom-built photoluminescence setup equipped with a fiber-coupled spectrometer (Ocean Optics, USB4000). The temperature was monitored using a photothermal camera (CompactPRO, Seek Thermal).
Acknowledgments
This study was supported by a grant from the Polish National Science Center (FUGA5 Project no. UMO-2016/20/S/ST3/00277 and Sonata Bis 3 Project no. UMO-2013/10/E/ST5/00651). Synthesis of the nanoparticles was supported by the Czech Science Foundation (no. 19-00676S). The authors would like to thank the RECOOP HST Association and the Cedars-Sinai Medical Center for their support and collaboration during this project. Czech-Polish exchange visits were supported by the Ministry of Education, Youth and Sports (8JPL19006) and Polish National Agency for Academic Exchange.
Supporting Information Available
The Supporting Information is available free of charge at https://pubs.acs.org/doi/10.1021/acsomega.0c03252.
Size distribution histograms of NaYF4:Yb3+,Er3+ (2 mol %) nanocrystals with different Yb3+ concentrations; single UPNC photoluminescence spectra for Yb3+ concentrations of 5 and 30%; glass coverslip with UPNCs heated with a hot air gun, with the temperature of the substrate continuously monitored with a thermographic camera; and thermographic image of the glass coverslip (red/white rectangle) covered with UPNCs (PDF)
Author Contributions
B.K., Ł.G., and A.P. designed the experiments; B.K. and Ł.G. performed research; B.K. and Ł.G. processed data; U.K. and D.H. synthesized and characterized the UPNCs; B.K. and A.P. wrote the manuscript; A.P. and D.H. supervised the project. All authors read and approved the final version of the manuscript.
The authors declare no competing financial interest.
Supplementary Material
References
- Chen B.; Wang F.. Emerging Frontiers of Upconversion Nanoparticles. Trends in Chemistry; Cell Press, May 1, 2020; pp 427–439. [Google Scholar]
- Scheps R. Upconversion Laser Processes. Prog. Quantum Electron. 1996, 20, 271–358. 10.1016/0079-6727(95)00007-0. [DOI] [Google Scholar]
- Shalav A.; Richards B. S.; Trupke T.; Krämer K. W.; Güdel H. U. Application of NaYF4:Er3+ up-Converting Phosphors for Enhanced near-Infrared Silicon Solar Cell Response. Appl. Phys. Lett. 2005, 86, 013505. 10.1063/1.1844592. [DOI] [Google Scholar]
- Liu Q.; Liu H.; Li D.; Qiao W.; Chen G.; Ågren H. Microlens Array Enhanced Upconversion Luminescence at Low Excitation Irradiance. Nanoscale 2019, 11, 14070–14078. 10.1039/c9nr03105g. [DOI] [PubMed] [Google Scholar]
- Kostiv U.; Patsula V.; Noculak A.; Podhorodecki A.; Větvička D.; Poučková P.; Sedláková Z.; Horák D. Phthalocyanine-Conjugated Upconversion NaYF4:Yb3+ /Er3+@SiO2 Nanospheres for NIR-Triggered Photodynamic Therapy in a Tumor Mouse Model. ChemMedChem 2017, 12, 2066–2073. 10.1002/cmdc.201700508. [DOI] [PubMed] [Google Scholar]
- Downing E.; Hesselink L.; Ralston J.; Macfarlane R. A Three-Color, Solid-State, Three-Dimensional Display. Science 1996, 273, 1185–1189. 10.1126/science.273.5279.1185. [DOI] [Google Scholar]
- Haase M.; Schäfer H. Upconverting Nanoparticles. Angew. Chem., Int. Ed. 2011, 50, 5808–5829. 10.1002/anie.201005159. [DOI] [PubMed] [Google Scholar]
- Lim S. F.; Riehn R.; Ryu W. S.; Khanarian N.; Tung C.-k.; Tank D.; Austin R. H. In Vivo and Scanning Electron Microscopy Imaging of Upconverting Nanophosphors in Caenorhabditis Elegans. Nano Lett. 2006, 6, 169–174. 10.1021/nl0519175. [DOI] [PubMed] [Google Scholar]
- Yi G.; Lu H.; Zhao S.; Ge Y.; Yang W.; Chen D.; Guo L.-H. Synthesis, Characterization, and Biological Application of Size-Controlled Nanocrystalline NaYF4 :Yb,Er Infrared-to-Visible Up-Conversion Phosphors. Nano Lett. 2004, 4, 2191–2196. 10.1021/nl048680h. [DOI] [Google Scholar]
- Chatterjee D. K.; Gnanasammandhan M. K.; Zhang Y. Small Upconverting Fluorescent Nanoparticles for Biomedical Applications. Small 2010, 6, 2781–2795. 10.1002/smll.201000418. [DOI] [PubMed] [Google Scholar]
- Sojka B.; Podhorodecki A.; Banski M.; Misiewicz J.; Drobczynski S.; Dumych T.; Lutsyk M. M.; Lutsyk A.; Bilyy R. β-NaGdF4 :Eu3+ Nanocrystal Markers for Melanoma Tumor Imaging. RSC Adv. 2016, 6, 57854–57862. 10.1039/C6RA10351K. [DOI] [Google Scholar]
- Kostiv U.; Lobaz V.; Kučka J.; Švec P.; Sedláček O.; Hrubý M.; Janoušková O.; Francová P.; Kolářová V.; Šefc L.; Horák D. A Simple Neridronate-Based Surface Coating Strategy for Upconversion Nanoparticles: Highly Colloidally Stable 125I-Radiolabeled NaYF4:Yb3+/Er3+@PEG Nanoparticles for Multimodal in Vivo Tissue Imaging. Nanoscale 2017, 9, 16680–16688. 10.1039/c7nr05456d. [DOI] [PubMed] [Google Scholar]
- Tessitore G.; Mandl G. A.; Brik M. G.; Park W.; Capobianco J. A. Recent Insights into Upconverting Nanoparticles: Spectroscopy, Modeling, and Routes to Improved Luminescence. Nanoscale 2019, 11, 12015–12029. 10.1039/c9nr02291k. [DOI] [PubMed] [Google Scholar]
- Wu S.; Han G.; Milliron D. J.; Aloni S.; Altoe V.; Talapin D. V.; Cohen B. E.; Schuck P. J. Non-Blinking and Photostable Upconverted Luminescence from Single Lanthanide-Doped Nanocrystals. Proc. Natl. Acad. Sci. U.S.A. 2009, 106, 10917–10921. 10.1073/pnas.0904792106. [DOI] [PMC free article] [PubMed] [Google Scholar]
- Schuck P. J.; Willets K. A.; Fromm D. P.; Twieg R. J.; Moerner W. E. A Novel Fluorophore for Two-Photon-Excited Single-Molecule Fluorescence. Chem. Phys. 2005, 318, 7–11. 10.1016/J.CHEMPHYS.2005.03.010. [DOI] [Google Scholar]
- Chen S.; Weitemier A. Z.; Zeng X.; He L.; Wang X.; Tao Y.; Huang A. J. Y.; Hashimotodani Y.; Kano M.; Iwasaki H.; Parajuli L. K.; Okabe S.; Teh D. B. L.; All A. H.; Tsutsui-Kimura I.; Tanaka K. F.; Liu X.; McHugh T. J. Near-Infrared Deep Brain Stimulation via Upconversion Nanoparticle-Mediated Optogenetics. Science 2018, 359, 679–684. 10.1126/science.aaq1144. [DOI] [PubMed] [Google Scholar]
- Hososhima S.; Yuasa H.; Ishizuka T.; Hoque M. R.; Yamashita T.; Yamanaka A.; Sugano E.; Tomita H.; Yawo H. Near-Infrared (NIR) up-Conversion Optogenetics. Sci. Rep. 2015, 5, 16533. 10.1038/srep16533. [DOI] [PMC free article] [PubMed] [Google Scholar]
- Zheng B.; Wang H.; Pan H.; Liang C.; Ji W.; Zhao L.; Chen H.; Gong X.; Wu X.; Chang J. Near-Infrared Light Triggered Upconversion Optogenetic Nanosystem for Cancer Therapy. ACS Nano 2017, 11, 11898–11907. 10.1021/acsnano.7b06395. [DOI] [PubMed] [Google Scholar]
- Ekimov A. I.; Efros A. L.; Onushchenko A. A. Quantum Size Effect in Semiconductor Microcrystals. Solid State Commun. 1985, 56, 921–924. 10.1016/S0038-1098(85)80025-9. [DOI] [Google Scholar]
- Noculak A.; Podhorodecki A.; Pawlik G.; Banski M.; Misiewicz J. Ion-Ion Interactions in β-NaGdF4:Yb3+,Er3+ Nanocrystals - the Effect of Ion Concentration and Their Clustering. Nanoscale 2015, 7, 13784–13792. 10.1039/c5nr03385c. [DOI] [PubMed] [Google Scholar]
- Bouzigues C.; Gacoin T.; Alexandrou A. Biological Applications of Rare-Earth Based Nanoparticles. ACS Nano 2011, 5, 8488–8505. 10.1021/nn202378b. [DOI] [PubMed] [Google Scholar]
- Drees C.; Raj A. N.; Kurre R.; Busch K. B.; Haase M.; Piehler J. Engineered Upconversion Nanoparticles for Resolving Protein Interactions inside Living Cells. Angew. Chem., Int. Ed. 2016, 55, 11668–11672. 10.1002/anie.201603028. [DOI] [PubMed] [Google Scholar]
- Guo H.; Idris N. M.; Zhang Y. LRET-Based Biodetection of DNA Release in Live Cells Using Surface-Modified Upconverting Fluorescent Nanoparticles. Langmuir 2011, 27, 2854–2860. 10.1021/la102872v. [DOI] [PubMed] [Google Scholar]
- Homann C.; Krukewitt L.; Frenzel F.; Grauel B.; Würth C.; Resch-Genger U.; Haase M. NaYF4 :Yb,Er/NaYF4 Core/Shell Nanocrystals with High Upconversion Luminescence Quantum Yield. Angew. Chem., Int. Ed. 2018, 57, 8765–8769. 10.1002/anie.201803083. [DOI] [PubMed] [Google Scholar]
- Podhorodecki A.; Krajnik B.; Golacki L. W.; Kostiv U.; Pawlik G.; Kaczmarek M.; Horák D. Percolation Limited Emission Intensity from Upconverting NaYF4:Yb3+,Er3+ Nanocrystals – a Single Nanocrystal Optical Study. Nanoscale 2018, 10, 21186–21196. 10.1039/C8NR05961F. [DOI] [PubMed] [Google Scholar]
- Lin X.; Chen X.; Zhang W.; Sun T.; Fang P.; Liao Q.; Chen X.; He J.; Liu M.; Wang F.; Shi P. Core-Shell-Shell Upconversion Nanoparticles with Enhanced Emission for Wireless Optogenetic Inhibition. Nano Lett. 2018, 18, 948–956. 10.1021/acs.nanolett.7b04339. [DOI] [PubMed] [Google Scholar]
- Rinkel T.; Raj A. N.; Dühnen S.; Haase M. Synthesis of 10 nm β-NaYF4:Yb,Er/NaYF4 Core/Shell Upconversion Nanocrystals with 5 nm Particle Cores. Angew. Chem., Int. Ed. 2015, 55, 1164–1167. 10.1002/anie.201508838. [DOI] [PubMed] [Google Scholar]
- Wang F.; Deng R.; Liu X. Preparation of Core-Shell NaGdF4 Nanoparticles Doped with Luminescent Lanthanide Ions to Be Used as Upconversion-Based Probes. Nat. Protoc. 2014, 9, 1634–1644. 10.1038/nprot.2014.111. [DOI] [PubMed] [Google Scholar]
- Abel K. A.; Boyer J.-C.; Andrei C. M.; van Veggel F. C. J. M. Analysis of the Shell Thickness Distribution on NaYF4/NaGdF4 Core/Shell Nanocrystals by EELS and EDS. J. Phys. Chem. Lett. 2011, 2, 185–189. 10.1021/jz101593g. [DOI] [Google Scholar]
- Gainer C. F.; Joshua G. S.; De Silva C. R.; Romanowski M. Control of Green and Red Upconversion in NaYF4:Yb3+,Er3+ Nanoparticles by Excitation Modulation. J. Mater. Chem. 2011, 21, 18530. 10.1039/c1jm13684d. [DOI] [PMC free article] [PubMed] [Google Scholar]
- Han Y.; Li H.; Wang Y.; Pan Y.; Huang L.; Song F.; Huang W. Upconversion Modulation through Pulsed Laser Excitation for Anti-Counterfeiting. Sci. Rep. 2017, 7, 1320. 10.1038/s41598-017-01611-9. [DOI] [PMC free article] [PubMed] [Google Scholar]
- Vetrone F.; Naccache R.; Zamarrón A.; Juarranz de la Fuente A.; Sanz-Rodríguez F.; Martinez Maestro L.; Martín Rodriguez E.; Jaque D.; García Solé J.; Capobianco J. A. Temperature Sensing Using Fluorescent Nanothermometers. ACS Nano 2010, 4, 3254–3258. 10.1021/nn100244a. [DOI] [PubMed] [Google Scholar]
- Jaque D.; Vetrone F. Luminescence Nanothermometry. Nanoscale 2012, 4, 4301. 10.1039/c2nr30764b. [DOI] [PubMed] [Google Scholar]
- Zhou B.; Shi B.; Jin D.; Liu X. Controlling Upconversion Nanocrystals for Emerging Applications. Nat. Nanotechnol. 2015, 10, 924–936. 10.1038/nnano.2015.251. [DOI] [PubMed] [Google Scholar]
- Pawlik G.; Niczyj J.; Noculak A.; Radosz W.; Podhorodecki A. Multiband Monte Carlo Modeling of Upconversion Emission in Sub 10 nm β-NaGdF4:Yb3+,Er3+ Nanocrystals-Effect of Yb3+ Content. J. Chem. Phys. 2017, 146, 244111. 10.1063/1.4989473. [DOI] [PubMed] [Google Scholar]
- Yuan D.; Tan M. C.; Riman R. E.; Chow G. M. Comprehensive Study on the Size Effects of the Optical Properties of NaYF4 :Yb,Er Nanocrystals. J. Phys. Chem. C 2013, 117, 13297–13304. 10.1021/jp403061h. [DOI] [Google Scholar]
- Noculak A.; Podhorodecki A. Size and Shape Effects in β-NaGdF4: Yb3+, Er3+ Nanocrystals. Nanotechnology 2017, 28, 175706. 10.1088/1361-6528/aa6522. [DOI] [PubMed] [Google Scholar]
- Schietinger S.; Menezes L. d. S.; Lauritzen B.; Benson O. Observation of Size Dependence in Multicolor Upconversion in Single Yb3+, Er3+ Codoped NaYF4 Nanocrystals. Nano Lett. 2009, 9, 2477–2481. 10.1021/nl901253t. [DOI] [PubMed] [Google Scholar]
- Noculak A.The Synthesis and Optical Investigations of Upconverting NaGdF4:Yb3+, Er3+ (Tm3+) Nanocrystals, Wroclaw University of Science and Technology, 2017. [Google Scholar]
- Rodríguez-Sevilla P.; Labrador-Páez L.; Wawrzyńczyk D.; Nyk M.; Samoć M.; Kar A. K.; Mackenzie M. D.; Paterson L.; Jaque D.; Haro-González P. Determining the 3D Orientation of Optically Trapped Upconverting Nanorods by in Situ Single-Particle Polarized Spectroscopy. Nanoscale 2016, 8, 300–308. 10.1039/C5NR06419H. [DOI] [PubMed] [Google Scholar]
- Sarkar S.; Meesaragandla B.; Hazra C.; Mahalingam V. Sub-5 nm Ln3+ -Doped BaLuF5 Nanocrystals: A Platform to Realize Upconversion via Interparticle Energy Transfer (IPET). Adv. Mater. 2013, 25, 856–860. 10.1002/adma.201203641. [DOI] [PubMed] [Google Scholar]
- Rodríguez-Sevilla P.; Rodríguez-Rodríguez H.; Pedroni M.; Speghini A.; Bettinelli M.; Solé J. G.; Jaque D.; Haro-González P. Assessing Single Upconverting Nanoparticle Luminescence by Optical Tweezers. Nano Lett. 2015, 15, 5068–5074. 10.1021/acs.nanolett.5b01184. [DOI] [PubMed] [Google Scholar]
- Wang F.; Liu X. Upconversion Multicolor Fine-Tuning: Visible to Near-Infrared Emission from Lanthanide-Doped NaYF 4 Nanoparticles. J. Am. Chem. Soc. 2008, 130, 5642–5643. 10.1021/ja800868a. [DOI] [PubMed] [Google Scholar]
- Liu F.; Ma E.; Chen D.; Yu Y.; Wang Y. Tunable Red-Green Upconversion Luminescence in Novel Transparent Glass Ceramics Containing Er: NaYF4 Nanocrystals. J. Phys. Chem. B 2006, 110, 20843. 10.1021/jp063145m. [DOI] [PubMed] [Google Scholar]
- Wawrzynczyk D.; Bednarkiewicz A.; Nyk M.; Strek W.; Samoc M. Neodymium(Iii) Doped Fluoride Nanoparticles as Non-Contact Optical Temperature Sensors. Nanoscale 2012, 4, 6959. 10.1039/c2nr32203j. [DOI] [PubMed] [Google Scholar]
- Marciniak L.; Prorok K.; Francés-Soriano L.; Pérez-Prieto J.; Bednarkiewicz A. A Broadening Temperature Sensitivity Range with a Core–Shell YbEr@YbNd Double Ratiometric Optical Nanothermometer. Nanoscale 2016, 8, 5037–5042. 10.1039/C5NR08223D. [DOI] [PubMed] [Google Scholar]
Associated Data
This section collects any data citations, data availability statements, or supplementary materials included in this article.