

Abstract

In this paper, the influence of Stefan flow on different reactivity coke solution loss reaction (Ccoke + CO2 = 2CO) at different temperatures were analyzed and compared to deeply understand the mechanism of the coke solution loss reaction. Isothermal experiments of carbon dioxide gasification with Coke A (low reactivity), Coke B (medium reactivity), and Coke C (high reactivity), respectively, were carried out at 1100–1300 °C. After calculation, it is concluded that the external diffusion coefficients and the mass transfer coefficients with Stefan flow of three kinds of coke were decreased, and their minimum average deviations with and without Stefan flow were 44.57/43.27/43.23 and 42.57/39.47/39.15%, respectively. As the coke reactivity increased, the diffusion and mass transfer capacity of carbon dioxide with Stefan flow in the boundary layer decreased. The carbon dioxide concentration on the outer surface of three kinds of coke with Stefan flow was less than that without Stefan flow. The influence of Stefan flow on carbon dioxide concentration on the outer surface of coke was increased with the increase of coke reactivity. The area of carbon dioxide concentration region in the three kinds of coke declined after modification, and the deviations of the carbon dioxide concentration region area before and after modification of three kinds of coke ranged from 6.62 to 22.85%, 7.74 to 25.17%, and 8.62 to 26.74%. The influence of Stefan flow on the carbon dioxide concentration region increased as coke reactivity increased.
1. Introduction
Metallurgical coke is a kind of porous carbon material used in the ironmaking blast furnace. It holds the key as a stock column skeleton, and as heating, carburizing, and reducing agent.1−6 The functions of heating, carburizing, and carbon reduction of other fuels such as coal and biochar can be partly replaced.7 However, as the skeleton of the blast furnace charging column, coke plays an increasingly prominent role, which is the key to the efficiency and service life of a blast furnace.8
The degradation of coke strongly dominates the gas permeability of the upper part of the blast furnace and impacts liquid permeability of the lower part of the blast furnace.9 The main reason for coke degradation is the solution loss reaction of coke, which is the gasification reaction with carbon dioxide (Ccoke + CO2 = 2CO).10,11 Furthermore, the degradation of coke results from the increase of the gasification rate, the expansion of pores, and the thinning of pore walls.12 Therefore, it is of great significance to deeply study the coke gasification mechanism for understanding and controlling the reaction process.
At present, the coke quality evaluation method developed by Nippon Steel Corporation in the early 1970s, coke reacts with carbon dioxide at 1100 °C for 2 h, is the most widely used method around the world.10,13 It is generally accepted that the coke with a low coke reactivity index% (CRI) and high coke strength after reaction% (CSR) is of high quality.14−17 However, the difference in CRI and CSR of coke used by ironmaking enterprises is very significant in different countries.18 Even in China, the difference in CRI and CSR of coke used by ironmaking plants in different regions is quite distinct.19 This leads some scholars to question the validity of CRI and CSR experimental conditions. In the blast furnace, the coke solution loss reaction occurs under the conditions of temperature and gas composition change, accompanied by iron ore reduction and other chemical reactions. Cheng20 and Negro21 believed that the coke solution loss reaction in a blast furnace is mainly determined by the concentration of carbon dioxide. Goleczka22 and Barnaba23 considered that the amount of coke solution loss in the blast furnace should be approximately 20–30 and 25%, respectively. Nomura et al.24 suggested that CSR was not suitable for evaluating the post-reaction strength of highly reactive coke. The solution loss reaction should stop when the mass loss of coke was 20%, and the reaction temperature should be adjusted accordingly. For solving the confusion of CRI and CSR, Wang et al.25 proposed a new testing method for coke quality evolution, namely, coke gasifies with carbon dioxide at 1100, 1150, 1200, 1250, and 1300 °C, respectively, until the mass loss of coke reaches 25%. Although the new evaluation method solves the problem of coke quality evaluation, it is necessary to investigate the mechanism of the coke solution loss reaction at different temperatures for solving the problem fundamentally.
In the process of solid or liquid combustion, there is a phase interface between the external gas flow and the fuel. Due to the concentration gradient of the external multicomponent gas at the phase interface, the external gas generates normal diffusion flow at the phase interface. This phenomenon of normal diffusion flow along with the physical or chemical process at the interface of two phases can be called Stefan flow. It was proposed by Stefan in 1871 while investigating water evaporation.26
Since then, the notion of Stefan flow has been broadly used in multicomponent mass transfer, particularly in combustion. The calculation results of Caram et al.27 showed that for air combustion, whether or not to consider Stefan flow at low oxygen concentrations had a slight influence on the results. Baum et al.28 studied the combustion of pulverized coal under the mixed control of diffusion and the reaction under the air conditions. It was considered that the existence of Stefan flow contributed to making the combustion of carbon particles controlled by the mass transfer process, and its effect on mass and heat transfer was related to the size of the carbon particle. Kalinchak et al.29 also proved that the effect of Stefan flow was mainly related to the decrease in the size of the carbon particle during the combustion process, but had little dependence on the temperature. Paterson et al.30 concluded that Stefan flow had a great influence on the prediction of the reaction rate, and ignoring Stefan flow would lead to 85% error. Förtsch et al.31 found that the mass transfer coefficient error was up to 17% depending on whether the Stefan flow was considered or not when the oxidation reaction of carbon particles was considered under the air combustion conditions. Edge et al.32 pointed out that the Stefan flow was helpful in controlling the combustion process by the mass transfer process when carbon was consumed. Yu et al.33 studied the mass transfer coefficient of CO2 and O2 under the oxygen-enriched combustion conditions. The results showed that the mass transfer coefficient of CO2 was more sensitive to the surface reaction rate and reaction products of carbon particles when considering Stefan flow. Whether to consider Stefan flow or not could cause 74% mass transfer coefficient error.
Besides, Stefan flow is well-studied not only in the field of combustion but is also being studied in other fields. Wang et al.34 introduced Stefan flow theory into the oxidation–reduction reaction of carbon-bearing pellets, defined the concept of a bidirectional gas–solid reaction, and established the kinetic model with Stefan flow. During the coke solution loss reaction, the outer surface of coke is the phase interface of the gas–solid phase, and there is a concentration gradient of carbon dioxide and carbon monoxide in the gas boundary layer. When coke reacts with carbon dioxide, the normal diffusion flow of carbon dioxide and carbon monoxide is generated on the outer surface of coke. This mass transfer phenomenon during the coke solution loss reaction is similar to solid fuel combustion. Therefore, in the external diffusion course of the coke solution loss reaction, the diffusion of carbon dioxide and carbon monoxide in the boundary layer will facilitate the Stefan flow phenomenon. However, this has not been reported in many previous studies on coke gasification.35−39 This results in an inaccurate and incomplete understanding of the mass transfer mechanism of the coke solution loss reaction. Huang et al.40 successfully applied the Stefan flow theory into the coke solution loss reaction process and established a kinetic model to discuss the influence of Stefan flow on the coke solution loss reaction. However, the focus of his work was to establish a kinetic model for only one kind of coke, but the application of other kinds of coke is not mentioned. In other words, the effect of Stefan flow on different reactivity coke and its severity need to be further elucidated.
Hence, this paper aims to study how Stefan flow affects the solution loss reaction of coke with different reactivities at different temperatures. The external diffusion coefficient, the mass transfer coefficient, the carbon dioxide concentration on the outer surface of coke, and the carbon dioxide concentration in coke with and without Stefan flow of three kinds of coke with different reactivities are analyzed and compared for illustrating the severity of the Stefan flow effect. It is hoped that this work can expand as well as deepen the understanding of the mechanism of the solution loss reaction of coke with different reactivities, and provide certain theoretical reference for coke quality evaluation.
2. Experimental Section
2.1. Samples
Three kinds of metallurgical coke with various CRI and CSR were selected to perform the gasification experiments. Their proximate analyses according to Chinese standards GB/T 2001–2013 and ash composition analyses according to Chinese standards GB/T 1574-2007 are shown in Tables 1 and 2, respectively. Their CRI and CSR, according to Chinese standards GB/T4000-2008 are shown in Table 3. Some other physical properties, such as original apparent density, original surface area, original porosity, and original mean pore radius were measured by mercury intrusion based on the national standard GB/T 21651.1-2008, and the results are exhibited in Table 4. Only one coke sample (diameter: 26–28 mm) was used in each gasification experiment.
Table 1. Proximate Analyses of Coke Samples (on Air Dry Basis wt %).
| coke samples | moisture | ash content | volatile matter | fixed carbon |
|---|---|---|---|---|
| coke A | 0.10 | 12.6 | 1.22 | 86.08 |
| coke B | 0.20 | 12.75 | 1.13 | 85.92 |
| coke C | 0.30 | 12.57 | 1.14 | 85.99 |
Table 2. Ash Analyses of Coke Samples (wt %).
| coke samples | SiO2 | Al2O3 | Fe2O3 | CaO | MgO | SO3 | TiO2 | K2O | Na2O | P2O5 | MnO2 |
|---|---|---|---|---|---|---|---|---|---|---|---|
| coke A | 47.15 | 35.42 | 6.25 | 2.77 | 0.33 | 1.74 | 1.62 | 0.51 | 0.47 | 0.51 | 0.05 |
| coke B | 47.21 | 35.62 | 6.48 | 3.25 | 0.53 | 1.13 | 1.41 | 0.57 | 0.61 | 0.54 | 0.07 |
| coke C | 46.72 | 35.35 | 7.12 | 3.39 | 0.58 | 1.42 | 1.55 | 0.65 | 0.86 | 0.34 | 0.08 |
Table 3. CRI and CSR of Coke Samples.
| coke samples | CRI(%) | CSR(%) |
|---|---|---|
| coke A | 23.04 | 68.12 |
| coke B | 28.02 | 56.45 |
| coke C | 33.27 | 49.47 |
Table 4. Physical Properties of Coke Samples.
| coke samples | coke original apparent density ρb (g/cm3) | original surface area Sg0 (m2/g) | original porosity ε0 (%) | original mean pore radius Ra (nm) |
|---|---|---|---|---|
| coke A | 1.07 | 10.29 | 44.89 | 81.1 |
| coke B | 1.13 | 15.38 | 48.66 | 55.9 |
| coke C | 1.064 | 10.26 | 47.63 | 70.8 |
2.2. Experimental Device
The experimental equipment is independently designed, which is mainly composed of a tubular heating furnace, electronic balance, and an integrated control cabinet. The diameter of the corundum tube in the furnace is 100 mm, and the heating temperature range is up to 1600 °C. The measurement range of the electronic balance is 0–100 g, and the accuracy is 0.001 g. The scale range is small, and the accuracy is high because there is only one coke sample for each experiment, and the mass loss of the coke sample can be recorded accurately and in real-time during gasification. The sample basket and wire can withstand a temperature of 1400 °C. The integrated control cabinet controls the temperature in the furnace and controls the flow of gas. Its specific composition is shown in Figure 1.
Figure 1.

Experimental devices. (1) integrated control cabinet, (2) electronic balance, (3) suspension wire, (4) heater, (5) reaction tube, (6) furnace, (7) basket, (8) coke, (9) gas inlet, and (10) thermocouple.
2.3. Experimental Procedure
First, the coke sample was heated to the target temperatures of 1100, 1150, 1200, 1250, and 1300 °C separately with nitrogen (99.99%, 5.0 L/min) at a heating rate of 10 °C/min. During the heating process, the moisture was completely removed. When the target temperature was stable and the electronic balance was unchanged, the value on the electronic balance was denoted as the mass of the coke sample before the gasification reaction. The gas was then switched from nitrogen to carbon dioxide (99.99%, 5.0 L/min). In previous studies,25,41 the gasification of coke in the blast furnace resulting from solution loss was approximately 20–30%; therefore, the gasification experiment was stopped before the mass loss of the coke sample reached 25%. Finally, the gas was rapidly switched from carbon dioxide to nitrogen, and the furnace was cooled to room temperature.
3. Results and Discussion
3.1. Experimental Results
Weight loss (%) x can be calculated using the following equation
| 1 |
where m0 represents the coke weight (g) before the gasification reaction and mt represents the coke weight (g) in real-time.
The average values of the experimental results exhibited in Figure 2 are obtained through three experiments. The repeatability of coke gasification experiments is acceptable. It can be seen from Figure 2 that under any temperature, the reaction time of Coke A is the longest, followed by Coke B, and that of Coke C is the shortest. This indicates that the reactivity of Coke A is less than that of Coke B, which is less reactive than Coke C at each temperature.
Figure 2.

Experimental results. (a) the weight loss (%) of Coke A, (b) the weight loss (%) of Coke B, and (c) the weight loss (%) of Coke C.
The kinetic model of the coke solution loss reaction with the effect of Stefan flow has been established in the previous study.40 For the external and internal diffusion processes of the coke solution loss reaction, the original calculation method was presented, and the corresponding modified calculation method with the effect of Stefan flow was established. By comparing and analyzing the external diffusion coefficient, mass transfer coefficient, carbon dioxide concentration on the outer surface of coke, and the concentration distribution of carbon dioxide inside coke with and without Stefan flow, the influence of Stefan flow on coke solution loss reaction was illustrated.
Therefore, the above experimental results are used to construct the mathematical model. Through the analysis and comparison of the calculation results, how Stefan flow affects different reactive coke can also be explained.
3.2. External Diffusion Coefficient and Mass Transfer Coefficient
Figures 3 and 4 are the comparisons of the original and modified external diffusion coefficient and mass transfer coefficient of Coke A, B, and C at different temperatures separately. To make figures comparable, the data range of the ordinate values in Figures 3 and 4 is unified severally.
Figure 3.

Comparison of the external diffusion coefficients of Coke A, Coke B, and Coke C, with and without Stefan flow at different temperatures. (DCO2,CO: original external diffusion coefficient, DCO2,CO,SF: external diffusion coefficient with Stefan flow) (a) DCO2,CO of Coke A; (b) DCO2,CO,SF of Coke A; (c) DCO2,CO of Coke B; (d) DCO2,CO,SF of Coke B; (e) DCO2,CO of Coke C; and (f) DCO2,CO,SF of Coke C.
Figure 4.

Comparison of the mass transfer coefficients of Coke A, Coke B, and Coke C with and without Stefan flow at different temperatures. (hD: original mass transfer coefficient and hD,SF: mass transfer coefficient with Stefan flow) (a) hD of Coke A; (b) hD,SF of Coke A; (c) hD of Coke B; (d) hD,SF of Coke B; and (e) hD of Coke C; (f) hD,SF of Coke C.
From the figures, it can be seen that DCO2,CO, DCO2,CO,SF, hD, and hD,SF of Coke A, B, and C increased as the temperature rises. This overall trend is changeless regardless of the type of coke and whether Stefan flow is considered. In Figure 3, the original external diffusion coefficient DCO2,CO is only a function of temperature, so its value is constant at the same temperature. Therefore, the value of DCO2,CO of Coke A, B, and C is equal at each temperature, which is completely independent of the type of coke. The original mass transfer coefficient hD is a function of DCO2,CO, so hD is also a function of temperature. At the same temperature, the values of hD of Coke A, B, and C are also constant in Figure 4. In summary, both the original external diffusion coefficient and the original mass transfer coefficient are functions of temperature. These indicate that the diffusion and mass transfer capacity of the gas in the boundary layer of the outer surface of coke alters only when the temperature changes, and are independent of the type of coke and the gasification reaction process. In other words, at any temperature, the diffusion and mass transfer capacity of the gas in the boundary layer of the outer surface of coke is equal and constant during coke gasification. However, the above results are not consistent with the actual situation. In the process of diverse types of coke solution loss reactions, the diffusion and mass transfer capacity of the gas in the boundary layer cannot be the same.
Considering Stefan flow, the modified external diffusion coefficient DCO2,CO,SF, and the modified mass transfer coefficient hD,SF of Coke A, B, and C are lower than DCO2,CO, and hD at corresponding temperatures, and the degree of decrease is very obvious. This indicates that regardless of the kinds of coke, the influence of Stefan flow on gas diffusion and mass transfer capacity in the boundary layer is very serious and cannot be ignored. Furthermore, at each temperature, DCO2,CO,SF and hD,SF are changing and fluctuating during the reaction process. The values of DCO2,CO,SF and hD,SF are not equal for the different kinds of coke. This indicates that the diffusion and mass transfer capacity of the gas in the boundary layer of different kinds of coke are distinct, which illustrates the difference in coke types when considering Stefan flow.
To more intuitively display how Stefan flow affects the diffusion coefficient and mass transfer coefficient of different kinds of coke, the average deviation of DCO2,CO and DCO2,CO,SF and hD and hD,SF needs to be calculated, and the equation is shown below
| 2 |
where ADEV is the average deviation (%), Xorg is the original parameter, and Xmod is the modified parameter. The average deviations of ADEV(D) and ADEV(h) of Coke A, B, and C at different temperatures are shown in the following figure.
For the convenience of comparison, the ordinate of Figure 5a,b is unified. It can be observed that ADEV(D) and ADEV(h) of Coke A, B, and C are decreased with the increase of temperature. It indicates that the influence of Stefan flow on the external diffusion coefficient and mass transfer coefficient is weakened as the temperature is increased. At the same temperature, the ADEV(D) of the three kinds of coke is higher than that of ADEV(h), indicating that the difference of the external diffusion coefficient is larger than that of the mass transfer coefficient. This is because the external diffusion coefficient and mass transfer coefficient are correlated by the Sherwood number, and there is a relationship between the Sherwood number, Reynolds number, and Schmidt number, which is similar to the Ranz–Marshall equation. This leads to different reductions of the external diffusion coefficient and mass transfer coefficient under the influence of Stefan flow. The final result is that ADEV(D) and ADEV(h) are not equal at the same temperature. The values of ADEV(D) and ADEV(h) show that Stefan flow has a significant influence on the external diffusion coefficient and mass transfer coefficient.
Figure 5.

Comparison of average deviations ADEV(D) and ADEV(h) of three kinds of coke at different temperatures. (ADEV(D): average deviation of DCO2,CO and DCO2,CO,SF; ADEV(h): average deviation of hD and hD,SF) (a) ADEV(D) of three kinds of coke and (b) ADEV(h) of three kinds of coke.
The results of ADEV(D) of Coke A, B, and C ranged from 48.71 to 44.57%, 47.61 to 43.27%, and 47.56 to 43.03%, respectively, from 1100 to 1300 °C. The values of ADEV(h) of Coke A, B, and C change in the range of 46.04–42.57, 43.17–39.47, and 43.15–39.15% in the same temperature range. Based on the above results, the average deviations of ADEV(D) and ADEV(h) are very significant and not negligible. Furthermore, if Stefan flow is ignored in the external diffusion process, the external diffusion coefficient and mass transfer coefficient of gas will be evidently different. This will lead to a marked difference in the understanding of the diffusion and mass transfer ability of gas in the boundary layer. The reality is that the diffusion and mass transfer capacity of gas in the boundary layer is not as strong as previously thought when considering Stefan flow.
The order of ADEV(D) and ADEV(h) of three kinds of coke at each temperature is as follows: ADEV(D) and ADEV(h) of Coke A (low reactivity) are greater than those of Coke B (medium reactivity), and ADEV(D) and ADEV(h) Coke B are greater than those of Coke C (high reactivity). This shows that the influence of Stefan flow on gas diffusion and mass transfer capacity in the boundary layer decreases as coke reactivity increases, that is, as the coke reactivity decreases, the Stefan flow influence becomes greater. The difference in ADEV(D) of three kinds of coke is not very obvious at the same temperature. However, the difference of ADEV(h) of three kinds of coke is somewhat significant at each temperature, that is, the ADEV(h) of Coke A with low reactivity is significantly higher than that of the other two kinds of coke. This indicates that the gas mass transfer capacity of low reactivity coke decreases more apparently, and the influence of Stefan flow on low reactivity coke is greater than that of medium and high reactivity coke. The lower the reactivity of coke, the stronger the Stefan flow effect will be.
To compare the values of DCO2,CO,SF and hD,SF of three kinds of coke more intuitively, the average value of DCO2,CO,SF and hD,SF at different temperatures is calculated to compare the difference in the external diffusion coefficient and mass transfer coefficient of coke with different reactivities after modification.
Figure 6 is the comparison of the average values of the modified external diffusion coefficient AVE(DCO2,CO,SF) and modified mass transfer coefficient AVE(hD,SF) of three kinds of coke at various temperatures. Figure 6a,b exhibits that AVE(DCO2,CO,SF) and AVE(hD,SF) of three kinds of coke are different at different temperatures. Although the difference of AVE(DCO2,CO,SF) of three kinds of coke at each temperature is not much greater than that of AVE(hD,SF), the existence of the difference in AVE(DCO2,CO,SF) reflects the differences among coke types when Stefan flow is taken into account. Additionally, the numerical order of AVE(DCO2,CO,SF) and AVE(hD,SF) has a positive correlation with the order of coke reactivity. AVE(DCO2,CO,SF) and AVE(hD,SF) are increased with coke reactivity at each temperature. According to the previous study,40 considering Stefan flow, the calculation of DCO2,CO,SF involves the molar fraction of carbon dioxide on the outer surface of coke. The lower the reactivity of coke is, the higher the molar fraction of carbon dioxide on the outer surface of coke is, which leads to the smaller values of DCO2,CO,SF. Moreover, hD,SF is calculated from DCO2,CO,SF, and thus the case of hD,SF is the same as that of DCO2,CO,SF. The higher the reactivity of coke, DCO2,CO,SF and hD,SF will appear. Therefore, this indicates that when Stefan flow is considered, the higher the coke reactivity is, the stronger the gas diffusion and mass transfer capacity will be in the boundary layer at the same temperature.
Figure 6.

Comparison of the average values of DCO2,CO,SF and hD,SF of three kinds of coke at different temperatures. (AVE(DCO2,CO,SF): average value of DCO2,CO,SF; AVE(hD,SF): average value of hD,SF) (a) AVE(DCO2,CO,SF) of three kinds of coke and (b) AVE(hD,SF) of three kinds of coke.
3.3. Carbon Dioxide Concentration on the Outer Surface of Coke
Figure 7 gives the information about the concentration of carbon dioxide on the outer surface of three kinds of coke with and without Stefan flow at different temperatures. All ordinates in Figure 7 are in the same data range. On the left side, Figure 7a,c,e shows the original carbon dioxide concentration on the outer surface of coke CCO2,S of Coke A, B, and C. On the other side, it shows the carbon dioxide concentration on the outer surface of coke with Stefan flow CCO2,S,SF of three kinds of coke. The figure shows that the carbon dioxide concentration on the outer surface of the three kinds of coke, whether original or modified, decreases as the temperature increases, and this general rule is unchanged. At each temperature, the CCO2,S,SF of three kinds of coke is always less than that of CCO2,S, which indicates that the influence of Stefan flow on the carbon dioxide concentration on the outer surface of coke is very significant, and Stefan flow leads to the decrease of carbon dioxide amount on the outer surface of coke. For comparing how Stefan flow affects CCO2,S and CCO2,S,SF of three kinds of coke more intuitively, the average deviation of CCO2,S and CCO2,S,SF in the above figure is calculated.
Figure 7.

Comparison of the concentration of CO2 on the outer surface of coke with and without Stefan flow at various temperatures. (CCO2,S: original concentration of CO2 on the outer surface of coke; CCO2,S,SF: concentration of CO2 on the outer surface of coke with Stefan flow) (a) CCO2,S of Coke A; (b) CCO2,S,SF of Coke A; (c) CCO2,S of Coke B; (d) CCO2,S,SF of Coke B; (e) CCO2,S of Coke C; and (f) CCO2,S,SF of Coke C.
Figure 8 shows the average deviations of carbon dioxide concentration on the outer surface of three kinds of coke with and without Stefan flow at different temperatures. In the figure, the ADEV(CCO2,S) of the three kinds of coke increases as temperature increases, which indicates that the impact of Stefan flow on the carbon dioxide concentration on the outer surface of coke increases as the temperature increases. This is because, as the temperature increases, the reaction rate becomes faster, and the chemical reaction on the outer surface should be more intense, and thus, the influence of Stefan flow will be more serious. Therefore, the carbon dioxide concentration on the outer surface of coke is increasingly affected. Besides, for Coke A, B, and C individually, the values of ADEV(CCO2,S) of Coke A is less than that of Coke B, which is less than that of Coke C at each temperature. This shows that the lower the coke reactivity, the smaller the influence of Stefan flow on the carbon dioxide concentration on the outer surface of coke will be, and this impact is increased as the coke reactivity increases, and the gradient law is relatively obvious at each temperature. This is also because of the higher reactivity of coke, whether at low or high temperature, the chemical reaction intensity on the outer surface of coke will be higher than that of coke with lower reactivity. Therefore, the effect of Stefan flow on high reactivity coke is greater than that of coke with low reactivity. The intensity gradient of such influence is clear at each temperature.
Figure 8.

Comparison of average deviations of ADEV(CCO2,S) of three kinds of coke at different temperatures. (ADEV(CCO2,S): average deviation of CCO2,S and CCO2,S,SF).
To illustrate the relationship between the coke reactivity and the modified carbon dioxide concentration on the outer surface of coke, Figure 9 exhibits the average values of carbon dioxide concentration on the outer surface of three kinds of coke under the effect of Stefan flow AVE(CCO2,S,SF) at various temperatures. The figure exhibits that the order of AVE(CCO2,S,SF) is always Coke A > Coke B > Coke C at each temperature. This indicates that the lower the reactivity of coke, the higher the carbon dioxide concentration on its outer surface. As the chemical reaction on the outer surface of the low reactivity coke is not violent, the amount of carbon dioxide on the outer surface of coke is relatively large. Furthermore, due to the relatively intense chemical reaction on the outer surface of highly reactive coke, the existence of carbon dioxide on its outer surface should be relatively less. However, there is a difference between the concentration of carbon dioxide in the main gas flow and that on the outer surface of coke. The carbon dioxide concentration difference of high reactivity coke is larger than that of low reactivity coke, which is consistent with the results in Figure 6, that is, the diffusion and mass transfer capacity of carbon dioxide in the boundary layer increases as the coke reactivity increases when Stefan flow is considered. The carbon dioxide concentration difference in the boundary layer determines carbon dioxide diffusion and mass transfer capacity, which also affects the amount of carbon dioxide reaching the outer surface of coke, and therefore, they interact with each other.
Figure 9.

Comparison of average values of AVE(CCO2,S,SF) of three kinds of coke at different temperatures. (AVE(CCO2,S,SF): average values of CCO2,S,SF).
3.4. Distribution of Carbon Dioxide Concentration in Coke
The influence of Stefan flow on the external diffusion process of the coke gasification reaction has an indirect impact on the internal diffusion-chemical reaction process. This effect is embodied in the concentration distribution of carbon dioxide in coke. Therefore, according to the previous work,40 the concentration distribution of carbon dioxide inside the three kinds of coke is calculated, and the original and modified carbon dioxide concentration distribution in the coke is shown in Figure 10.
Figure 10.


Comparison of the concentration of CO2 inside three kinds of coke with and without Stefan flow at various temperatures. (CCO2: original concentration of CO2 and CCO2,SF: concentration of CO2 with Stefan flow). (a1–e1) CCO2 and CCO2,SF of Coke A at different temperatures; (a2–e2) CCO2 and CCO2,SF of Coke B at different temperatures; and (a3–e3) CCO2 and CCO2,SF of Coke C at different temperatures.
Figure 10 shows the distribution of carbon dioxide concentration on the three kinds of coke with and without Stefan flow at various temperatures. All of the ordinates are unified for comparison. The distribution of carbon dioxide concentration in coke in Figure 10 is different from conventional ones. A new concept is introduced, namely, the carbon dioxide concentration region in coke. The upper limit of each carbon dioxide concentration region is the carbon dioxide concentration curve at a weight loss of 25%, which means that all of the other carbon dioxide concentration curves at weight loss of less than 25% are in the region. Therefore, the effect of Stefan flow on the distribution of carbon dioxide concentration in coke can be more directly reflected by the size of the carbon dioxide concentration region.
As seen in Figure 10, both the CCO2 region and CCO2,SF region decrease as the temperature increases. This rule is always unchanged irrespective of Stefan flow considerations. Besides, all of the CCO2 regions of three kinds of coke under each temperature are larger than that of the CCO2,SF region. However, the difference between the CCO2 region and CCO2,SF region is not so large. This indicates that Stefan flow has a certain influence on the distribution of carbon dioxide concentration of inner coke, but this effect does not seem very significant. The area of the CCO2 region and CCO2,SF region of three kinds of coke at each temperature, has no relationship with coke reactivity because the distribution of carbon dioxide concentration in coke is determined by the effective internal diffusion coefficient of carbon dioxide and the reaction rate constant.
To present more clearly the influence of Stefan flow on the distribution of carbon dioxide concentration in three kinds of coke, the CCO2 region area and CCO2,SF region area in Figure 10 are integrated, and their deviation is calculated as follow
| 3 |
In the equation, DEVS(CCO2) is the deviation of the integral area of the CCO2 region and CCO2,SF region (%), S(CCO2) is the integral area of the CCO2 region, S(CCO2,SF) is the integral area of the CCO2,SF region. And the calculated results are plotted as follows.
The deviations of the integral area of the CCO2 region and CCO2,SF region of three kinds of coke under various temperatures, are shown in Figure 11. This shows that regardless of the type of coke, DEVS(CCO2) increases linearly with the increase of temperature, and this trend remains unchanged. The DEVS(CCO2) values of Coke A, B, and C vary from 6.62 to 22.85%, 7.74 to 25.17%, and 8.62 to 26.74% at 1100–1300 °C, respectively. This suggests that the effect of Stefan flow on carbon dioxide concentration distribution in coke increases as the temperature increases. At 1150 °C, the DEVS(CCO2) is higher than 10%, indicating that the effect of Stefan flow is significant and not negligible. From the location of the fitting lines in Figure 11, the effect of Stefan flow on the carbon dioxide concentration distribution in coke increases with increasing coke reactivity at any temperature, which cannot be obtained from Figure 10. Thus, it can be concluded that the higher the coke reactivity is, the more significant the influence will be.
Figure 11.
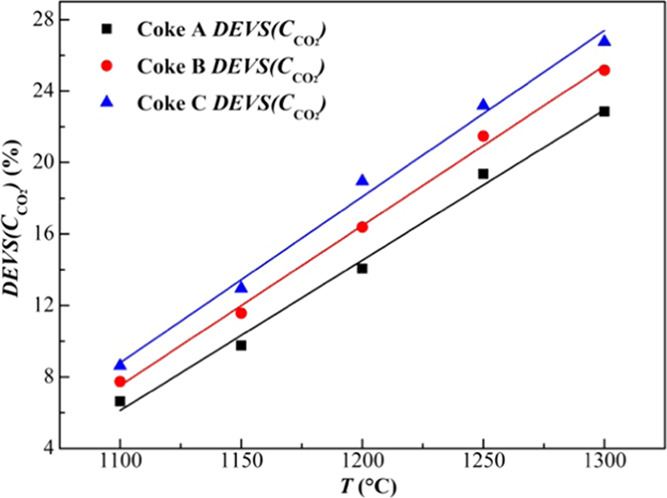
Deviations of DEVS(CCO2) of three kinds of coke at different temperatures. (DEVS(CCO2): deviations of the integral area of CCO2 region and CCO2,S,SF region).
4. Conclusions
How Stefan flow affected carbon dioxide and coke gasification with different reactivities was discussed, analyzed, and compared in the temperature range of 1100–1300 °C. Regardless of coke types, the external diffusion coefficient and mass transfer coefficient with Stefan flow were smaller than those without Stefan flow. Especially the modified external diffusion coefficients of the three kinds of coke were different at any temperature, which aligned more with the actual situation and reflected the individuality of the gasification process of coke with different reactivities. The minimum average deviations of the external diffusion coefficient and mass transfer coefficient with and without Stefan flow of Coke A, B, and C were 44.57/43.27/43.23 and 42.57/39.47/39.15%, respectively. This indicates the influence of Stefan flow on gas diffusion and mass transfer capacity in the boundary layer decreases as the coke reactivity increases. The average values of the modified external diffusion coefficient and the modified mass transfer coefficient had a positive correlation with the reactivity order of coke at any temperature. The carbon dioxide concentration on the outer surface of three kinds of coke was decreased with Stefan flow at any temperature. The average deviations of the carbon dioxide content on the outer surface of Coke A, B, and C before and after modification ranged from 2.87 to 10.91%, 4.81 to 12.49%, and 5.18 to 12.67%, respectively. These were increased with coke reactivity, which means, the effect of Stefan flow on the carbon dioxide concentration on the outer surface of coke is increased as the coke reactivity increases. The average values of carbon dioxide concentration on the outer surface of three kinds of coke with Stefan flow decreased as coke reactivity increased. The area of the carbon dioxide concentration region of three kinds of coke at any temperature with Stefan flow was less than that without Stefan flow. The deviations of the integral area of carbon dioxide concentration region with and without Stefan flow of Coke A, B, and C varied from 6.62 to 22.85%, 7.74 to 25.17%, and 8.62 to 26.74% at a temperature range of 1100–1300 °C, respectively. This indicates that the effect of Stefan flow on carbon dioxide concentration distribution in coke increases as coke reactivity increases.
Acknowledgments
The authors thank the National Natural Science Foundation of China(NSFC) (projects U1361212, 51704149, and 51634004) for the support.
The authors declare no competing financial interest.
References
- Lomas H.; Roest R.; Thorley T.; Wells A.; Wu H.; Jiang Z. Y.; Sakurovs R.; Wotherspoon S.; Pearson R. A.; Mahoney M. R. Tribological testing of metallurgical coke: coefficient of friction and relation to coal properties. Energy Fuels 2018, 32, 12021–12029. 10.1021/acs.energyfuels.8b01339. [DOI] [Google Scholar]
- Li K.; Khanna R.; Zhang J.; Liu Z.; Sahajwalla V.; Yang T.; Kong D. The evolution of structural order, microstructure and mineral matter of metallurgical coke in a blast furnace: A review. Fuel 2014, 133, 194–215. 10.1016/j.fuel.2014.05.014. [DOI] [Google Scholar]
- Xing X.; Rogers H.; Zhang G. Q.; Hockings K.; Zulli P.; Ostrovski O. Changes in pore structure of metallurgical cokes under blast furnace conditions. Energy Fuels 2016, 30, 161–170. 10.1021/acs.energyfuels.5b02152. [DOI] [Google Scholar]
- Xing X. Petrographic analysis of cokes reacted under simulated blast furnace conditions. Energy Fuels 2019, 33, 4146–4157. 10.1021/acs.energyfuels.9b00417. [DOI] [Google Scholar]
- Xing X. Pore Structure and integrity of a bio-coke under simulated blast furnace conditions. Energy Fuels 2019, 33, 2133–2141. 10.1021/acs.energyfuels.9b00008. [DOI] [Google Scholar]
- Chang Z. Y.; Jiao K. X.; Ning X. J.; Zhang J. L. Behavior of alkali accumulation of coke in the cohesive zone. Energy Fuels 2018, 32, 8383–8391. 10.1021/acs.energyfuels.8b02214. [DOI] [Google Scholar]
- Xu R. S.; Dai B.; Wang W.; Schenk J.; Bhattacharyya A.; Xue Z. Gasification reactivity and structure evolution of metallurgical coke under H2O/CO2 atmosphere. Energy Fuels 2018, 32, 1188–1195. 10.1021/acs.energyfuels.7b03023. [DOI] [Google Scholar]
- Wang W.; Wang J.; Xu R. S.; Yu Y.; Jin Y.; Xue Z. L. Influence mechanism of zinc on the solution loss reaction of coke used in blast furnace. Fuel Process. Technol. 2017, 159, 118–127. 10.1016/j.fuproc.2017.01.039. [DOI] [Google Scholar]
- Chang Z. Y.; Jiao K. X.; Ning X. J.; Zhang J. L. Behavior of alkali accumulation of coke in the cohesive zone. Energy Fuels 2018, 32, 8383–8391. 10.1021/acs.energyfuels.8b02214. [DOI] [Google Scholar]
- Guo R.; Sun L.; Wang Q. Post-reaction strength of coke under various conditions. Coke Chem. 2012, 55, 300–303. 10.3103/S1068364X12080030. [DOI] [Google Scholar]
- Guo R.; Sun Z.; Liang Y. H.; Wang Q. Multi-factors affecting coke solution loss reaction. Coke Chem. 2014, 57, 233–237. 10.3103/S1068364X1406009X. [DOI] [Google Scholar]
- Ishikawa Y.; Kase M.; Abe Y.; Ono K.; Sugata M.; Nishi T. Influence of post reaction strength of coke on blast furnace operation. Ironmaking Proc. Metall. Soc. AIME 1983, 43, 357–386. [Google Scholar]
- Menéndez J. A.; Alvarez R.; Pis J. J. Determination of metallurgical coke reactivity at INCAR: NSC and ECE-INCAR reactivity tests. Ironmaking Steelmaking 1999, 26, 117–121. 10.1179/030192399676997. [DOI] [Google Scholar]
- Grosspietsch K. H.; Lungen N. V.; Danwels G.; Ferstl A.; Karjalahiti T.; Negro P.; Willimers R. In Coke Quality Requirements by European Blast Furnace Operators in the Turn of Millenium, Proceedings of the 4th European Coke and Ironmaking Conference, ParisLa Défense, France, 2000; pp 184–191.
- Vander T. In Coke Quality Improvement. Possibilities and Limitations, Proceedings of the 3th European Coke and Ironmaking Conference, Gent, Belgium, 1996; pp 28–37.
- Lindert M.; Timmer R. M. C. An analysis of the Japanese reactivity and CSR of plant coke and the corresponding pilot oven coke. Proc. Ironmaking Conf. 1991, 50, 233–237. [Google Scholar]
- Fellows P. M.; Willmers R. R. High temperature testing of coke and its relevance to the blast furnace. Proc. Ironmaking Conf. 1985, 44, 239–251. [Google Scholar]
- Díez M. A.; Alvarez R.; Barriocanal C. Coal for metallurgical coke production: predicitions of coke quality and future requirements for coke making. Int. J. Coal Geol. 2002, 50, 389–412. 10.1016/S0166-5162(02)00123-4. [DOI] [Google Scholar]
- Meng Q. In Achievements of Cokemaking Industry and Their Supports to Iron and Steel Industry in China, 6th International Congress on the Science and Technology of Ironmaking-ICSTI, Riode Janeiro, Brazil, 2012; pp 520–531.
- Cheng A. Coke quality requirements for blast furnaces. Iron Steelmaker 2001, 28, 78–81. [Google Scholar]
- Negro P.; Steiler J. M.; Beppler E. In Assessment of Coke Degradation in the Blast Furnace from Tuyere Probing Investigations, 3rd European Ironmaking Congress Proceedings, 1996; pp 20–27.
- Goleczka J.; Tucker J. Coke quality and its assessment in the CRE laboratory. Ironmaking Conf. Proc. 1985, 44, 217–232. [Google Scholar]
- Barnaba P. A new way for evaluating the high temperature properties of coke. Coke Making Int. 1993, 5, 47–54. [Google Scholar]
- Nomura S.; Naito M.; Yamaguchi K. Post-reaction strength of catalyst-added highly reactive coke. ISIJ Int. 2007, 47, 831–839. 10.2355/isijinternational.47.831. [DOI] [Google Scholar]
- Wang Q.; Guo R.; Zhao X. F.; Sun J. F.; Zhang S.; Liu W. Z. A new testing and evaluation method of cokes with greatly varied CRI and CSR. Fuel 2016, 182, 879–885. 10.1016/j.fuel.2016.05.101. [DOI] [Google Scholar]
- Stefan V. J. Über das Gleichgewicht und die Bewegung, insbesondere die Diffusion von Gasgemengen. Sitzber. Akad. Wiss. Wien 1871, 63, 63–124. [Google Scholar]
- Caram H. S.; Amundson N. R. Diffusion and reaction in a stagnant boundary layer about a carbon particle. Ind. Eng. Chem. Fundam. 1977, 16, 171–181. 10.1021/i160062a001. [DOI] [Google Scholar]
- Baum M. M.; Street P. J. Predicting the combustion behavior of coal particles. Combust. Sci. Technol. 1971, 3, 231–243. 10.1080/00102207108952290. [DOI] [Google Scholar]
- Kalinchak V. V. Influence of Stefan flow and convection on the kinetics of chemical reactions and heat and mass exchange of carbon particles with gases. J. Eng. Phys. Thermophys. 2001, 74, 323–330. 10.1023/A:1016696203987. [DOI] [Google Scholar]
- Paterson W. R. Mass transfer to, and reaction on, a sphere immersed in a stationary or flowing gas. Chem. Eng. Sci. 2000, 55, 3567–3570. 10.1016/S0009-2509(99)00599-0. [DOI] [Google Scholar]
- Förtsch D.; Schnell U.; Hein K. R. G.; Essenhigh R. H. The mass transfer coefficient for the combustion of pulverized carbon particles. Combust. Flame 2001, 126, 1662–1668. 10.1016/S0010-2180(01)00275-9. [DOI] [Google Scholar]
- Edge P.; Gharebaghi M.; Irons R.; Porter R. T. J.; Pourkashanian M.; Smith D.; et al. Combustion modelling opportunities and challenges for oxy-coal carbon capture technology. Chem. Eng. Res. Des. 2011, 89, 1470–1493. 10.1016/j.cherd.2010.11.010. [DOI] [Google Scholar]
- Yu J.; Zhang M. C. Mass transfer coefficients for the combustion of a char particle in O2/CO2. Energy Fuels 2009, 23, 5717–5724. 10.1021/ef900481c. [DOI] [Google Scholar]
- Wang Q.; Li W. Z.; Jiang M. F.; Ma X. Y.; Zheng H. X. Bidirectional gas-solid reaction and its characteristics in metallurgy. Prog. Nat. Sci. 2003, 13, 1112–1115. [Google Scholar]; (in Chinese)
- Kawakami M.; Mizutani Y.; Ohyabu T.; Murayama K.; Takenaka T.; Yokoyama S. Reaction kinetics of coke and some carbonaceous materials with CO2 and coke strength after reaction. Steel Res. Int. 2004, 75, 93–98. 10.1002/srin.200405933. [DOI] [Google Scholar]
- Grigore M.; Sakurovs R.; French D.; Sahajwalla V. Influence of mineral matter on coke reactivity with carbon dioxide. ISIJ Int. 2006, 46, 503–512. 10.2355/isijinternational.46.503. [DOI] [Google Scholar]
- Yamazaki Y.; Hiraki K.; Kanai T.; Zhang X. Q.; Matsushita Y.; Shoji M.; Aoki H.; Miura T. The effect of metallic iron particle on coke-matrix after coke CO2 gasification reaction. J. Therm. Sci. Technol. 2011, 6, 278–288. 10.1299/jtst.6.278. [DOI] [Google Scholar]
- Shin S. M.; Jung S. M. Gasification Effect of Metallurgical Coke with CO2 and H2O on the Porosity and Macrostrength in the Temperature Range of 1100 to 1500°C. Energy Fuels 2015, 29, 6849–6857. 10.1021/acs.energyfuels.5b01235. [DOI] [Google Scholar]
- Jayasekara A. S.; Monaghan B. J.; Longbottom R. J. The kinetics of reaction of a coke analogue in CO2 gas. Fuel 2015, 154, 45–51. 10.1016/j.fuel.2015.03.053. [DOI] [Google Scholar]
- Huang J. C.; Guo R.; Tao L.; Wang Q.; Liu Z. S. Effects of Stefan flow on metallurgical coke gasification with CO2. Energy Fuels 2020, 34, 2936–2944. 10.1021/acs.energyfuels.9b04134. [DOI] [Google Scholar]
- Guo R.; Wang Q. Relationship between coke properties and solution loss behavior and its influence on post-reaction strength of coke. Rev. Metall. 2012, 109, 443–452. 10.1051/metal/2012039. [DOI] [Google Scholar]