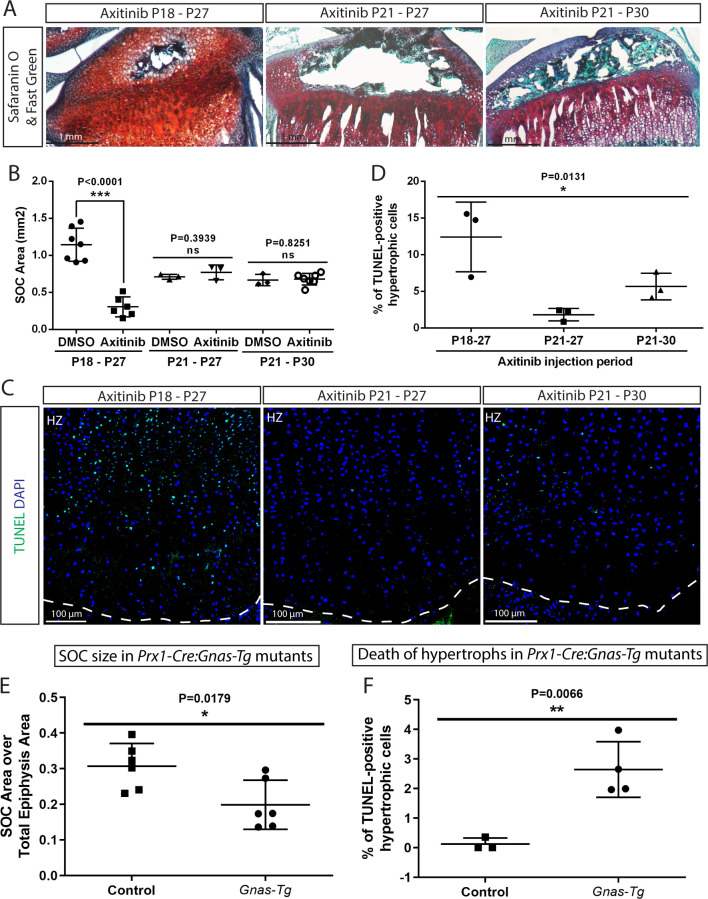
Figure 8. Inhibition of the SOC size in vivo is associated with increased epiphyseal chondrocyte apoptosis.
Size of the SOC was inhibited either pharmacologically employing axitinib (A–D) or genetically employing activation of Gnas (E, F). (A–B) Representative histology images of the tibia epiphysis (A) and quantification of the SOC size (B) of wild type mice injected with axitinib at various time periods. P refers to postnatal day. (C–D) Representative images (C) and quantification of TUNEL staining (green) (D) in the hypertrophic cells of the tibia growth plate of the axitinib injected mice. (E–F) Quantification of SOC size (E) and TUNEL staining (F) of the hypertrophic cells in the growth plates of stopGnasR201H (Control) and Prx-Cre:GnasR201H (Gnas-Tg) mice. DAPI was used for counterstaining (blue) in (C). Data are means ± SD, two-tailed Student’s t-test. In (A–F), n = 3. ns, not significant.

