

Abstract
Escherichia coli is an important model organism in microbiology and a prominent member of the human microbiota1. Environmental isolates readily colonize the gastrointestinal tracts of humans and other animals, and they can serve diverse probiotic, commensal, and pathogenic roles in the host2–4. Certain strains have been associated with the severity of inflammatory bowel disease (IBD)2,5; however, the diverse immunomodulatory phenotypes remain largely unknown at the molecular level. Here, we decode a previously unknown E. coli metabolic pathway that produces a family of hybrid pterin-phenylpyruvate conjugates, which we named the colipterins. The metabolites are upregulated by sub-inhibitory levels of the antifolate sulfamethoxazole (SMX), which is used to treat infections, including in IBD patients6,7. The genes folX/M and aspC/tyrB involved in monapterin biosynthesis8–10 and aromatic amino acid transamination,11 respectively, were required to initiate the colipterin pathway. We show that the colipterins are antioxidants, harbor diverse immunological activities in primary human tissues, activate anti-inflammatory interleukin-10 (IL-10), and improve colitis symptoms in a colitis mouse model. Our study defines an antifolate stress response in E. coli and links its associated metabolites to a major immunological marker of IBD.
Keywords: Human Microbiota, Colitis, Antibiotic, Metabolism, Folate, Redox, Inflammation
Antibiotics are widely utilized to treat infectious diseases, leading to dynamic alterations of bacterial metabolic responses involved in growth and survival12–18. However, some of these drugs also lead to immunological activities in the host itself19,20. While well-known at the phenotypic level19,20, the diverse mechanisms of antibiotic-mediated immune regulation at the molecular level remain largely unexplored. Three major models have been proposed to account for the phenotypic and clinical observations: 1) Antibiotics can alter the microbiome community structure, leading to dysbiosis and inflammatory responses21–26; 2) Antibiotics can bind to host targets and directly modulate host immune responses, as supported in germ-free mouse model studies27,28; and/or 3) antimicrobial molecules can be biotransformed by microbes or the host into other antibiotic-derived immunomodulatory metabolites29,30. In the current study, we propose a fourth model and show that sub-growth-inhibitory levels of the antibiotic SMX activate a cellular stress response in the common gut bacterium E. coli, leading to the identification of previously unknown immunomodulatory metabolites.
E. coli infections are commonly treated with SMX in combination with trimethoprim (TMP) due to their synergistic activities31. These drugs inhibit folate metabolism (Fig. 1a,b), an essential pathway supporting single carbon metabolism, including key steps in DNA synthesis31. While TMP inhibits dihydrofolate reductase (DHFR) responsible for tetrahydrofolate (THF) production and recycling from dihydrofolate (DHF)32, SMX inhibits the upstream folate biosynthetic enzyme dihydropteroate synthase (DHPS) as a competitive inhibitor of its native substrate, para-aminobenzoate (PABA)33. Because folate is of the pteridine class of metabolites, we assessed potential pteridine metabolic rerouting when the early steps of folate biosynthesis were suppressed (i.e., sub-inhibitory levels of SMX). Sub-inhibitory levels of antibiotics have been used to upregulate ‘cryptic’ bacterial metabolic pathways34, including in E. coli35.
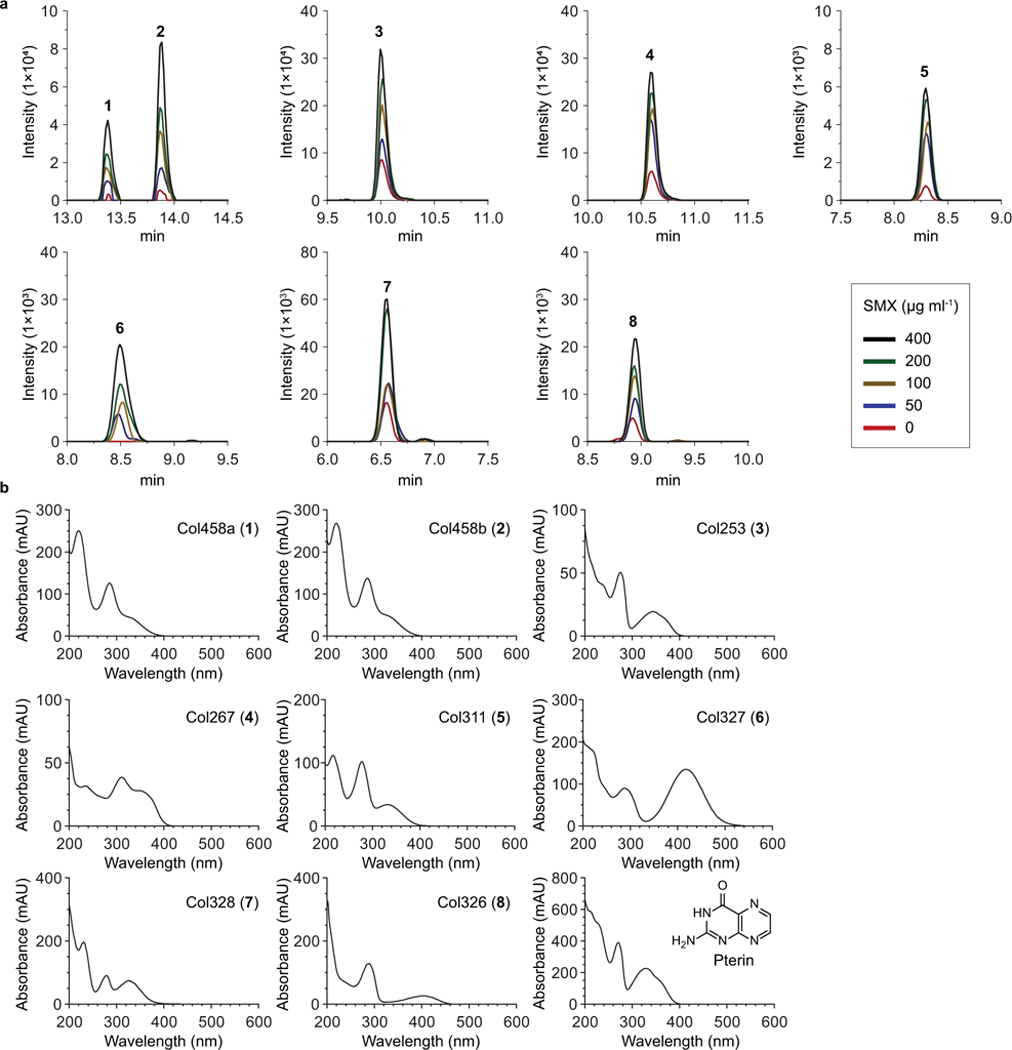
Fig. 1. Colipterins upregulated by SMX antifolate drug stress in E. coli Nissle1917.

a, Mechanism of action of SMX/TMP antibiotics. b, Chemical structure of SMX. c, Determination of sub-inhibitory growth ranges of SMX against E. coli Nissle1917 (yellow area). d, Optical density (OD600) of E. coli Nissle1917 in the presence of four sub-inhibitory concentrations of SMX used for metabolite analysis. e, Dose-dependent upregulation of colipterins 1-8 in supernatants in response to SMX stress. Ctrl (control) indicates no SMX treatment. The mean and s.d. (error bars) are derived from three biological replicates (n = 3). A two-tailed unpaired t-test was used to calculate P values; ns, not significant. Corresponding extracted ion counts (EIC) chromatograms are shown in Extended Data Fig. 1a. f, Chemical structure of colipterins 1-8. Detailed NMR-based structure elucidation of the colipterins is described in the Supplementary Discussion.
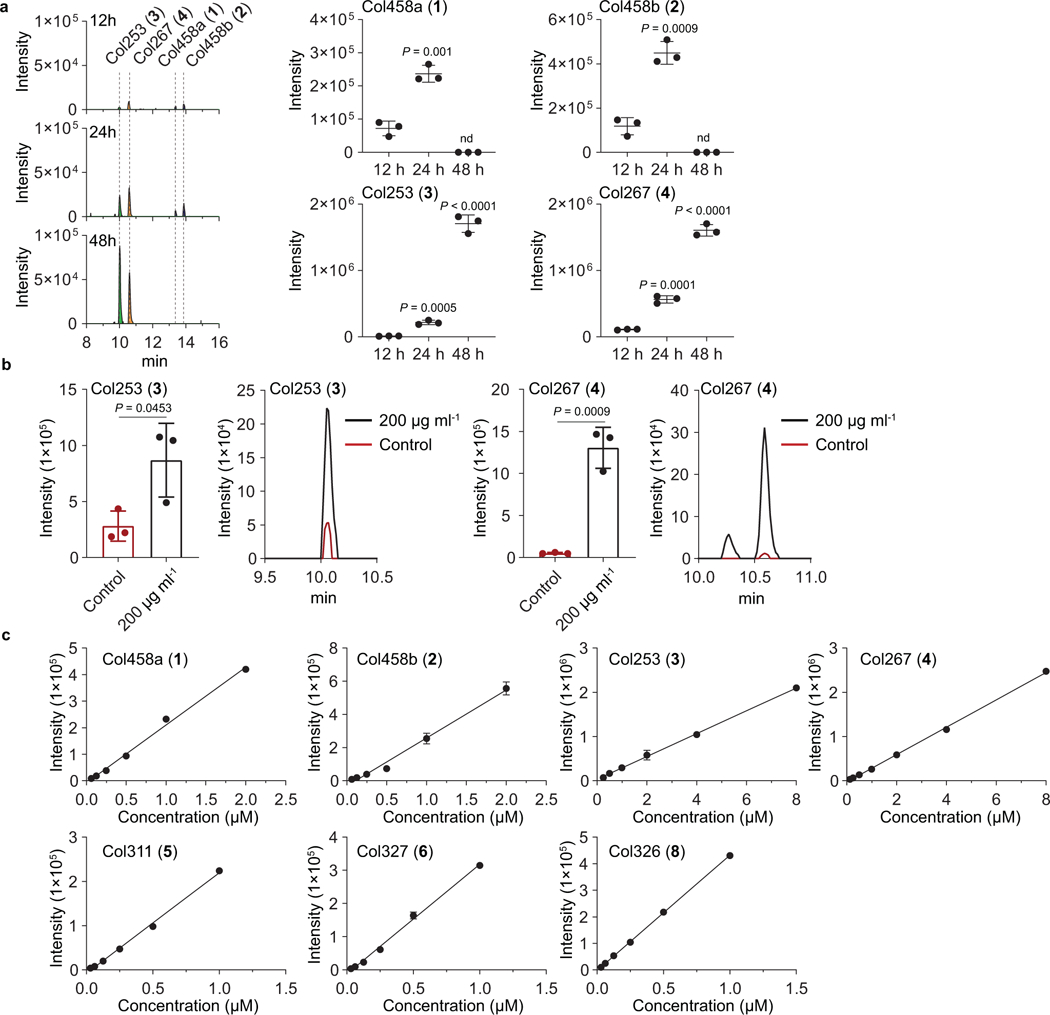
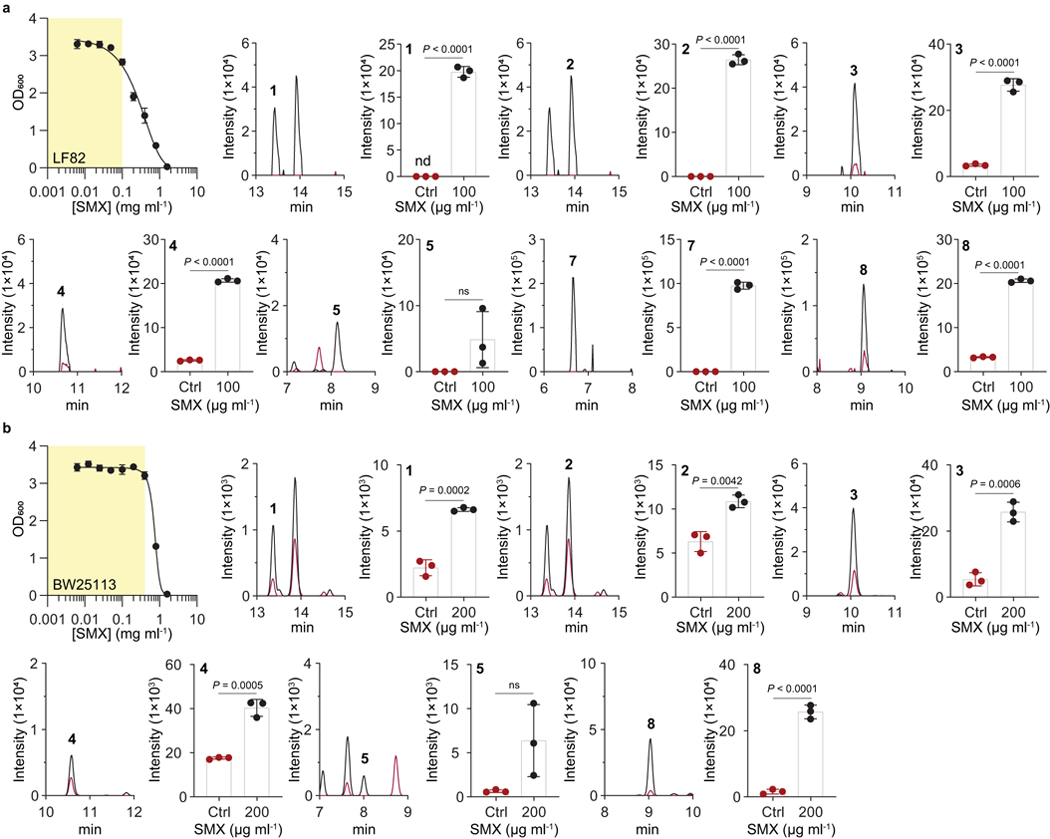
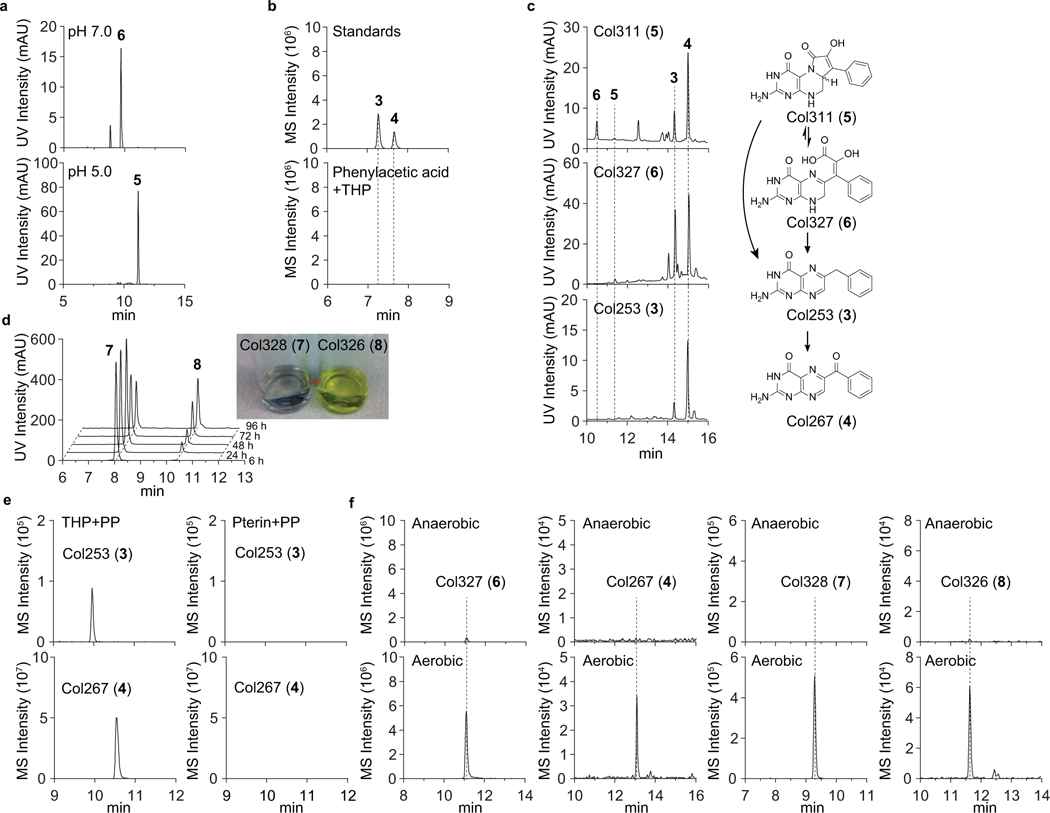
We selected the human probiotic E. coli Nissle1917 as a representative E. coli strain for our antifolate metabolism studies. Nissle1917 is clinically prescribed in Europe to treat IBDs4; however, it is also a producer of the genotoxin colibactin36,37, which has been implicated in colitis-associated colorectal cancer in adherent invasive E. coli (AIEC) pathotypes38–42. Using the broth dilution method,43 we first established the sub-inhibitory concentration range of SMX for Nissle1917 in LB medium (Fig. 1c). We selected four of the sub-inhibitory conditions for further metabolite analysis compared to controls lacking SMX. While we saw no significant difference in growth over a 24 h cultivation period (Fig. 1d), using high-resolution electrospray ionization-quadrupole-time-of-flight-mass spectrometry (ESI-Q-TOF-MS) and photodiode array spectroscopy, we observed the SMX-mediated upregulation of a family of eight metabolites in supernatants (Fig. 1e and Extended Data Fig. 1a). These metabolites, which we named colipterins 1-8, shared pteridine-like ultraviolet-visible spectra44 (Extended Data Fig. 1b). The ESI-QTOF-MS data allowed us to propose their molecular compositions (Supplementary Figs. 1 and 2). To establish the temporal dynamics of the major 1-4, we measured their production at 12 h, 24 h, and 48 h from culture supernatants. Colipterins 1 and 2 were detected at 12 h and 24 h before being depleted at 48 h, while the levels of 3 and 4 increased over time (Extended Data Fig. 2a). In cell pellets, 3 and 4 were only detected at both 24 h and 48 h (Extended Data Fig. 2b). Quantification results of all compounds are given in Extended Data Fig. 2c. Finally, to address whether these metabolites were more broadly detected across E. coli strains, we also analyzed production of 1-8 in a representative pathogen, AIEC LF82, and a representative commensal, E. coli BW25113. While the sub-inhibitory antibiotic concentration range of SMX varied among the isolates, SMX supplementation enhanced the production of 1-5 and 8 (Extended Data Fig. 3). However, 6 and 7 were below the detection limits under these in vitro conditions. Collectively, our data suggest that select colipterins are upregulated in response to antifolate cell stress and are conserved among these probiotic, pathogenic, and commensal E. coli.
To identify the structures of colipterins 1-8, we isolated and characterized them by NMR, tandem MS, biomimetic chemical synthesis, Marfey’s configurational analysis, and CP-3 computational analysis (Fig. 1f and Supplementary Figs. 3–64 and Tables 1–5). Details are provided in the Supplementary Information. All of the compounds represent previously unknown metabolites; however, 3 and 4 have been described as synthetic products with no reported activities45.
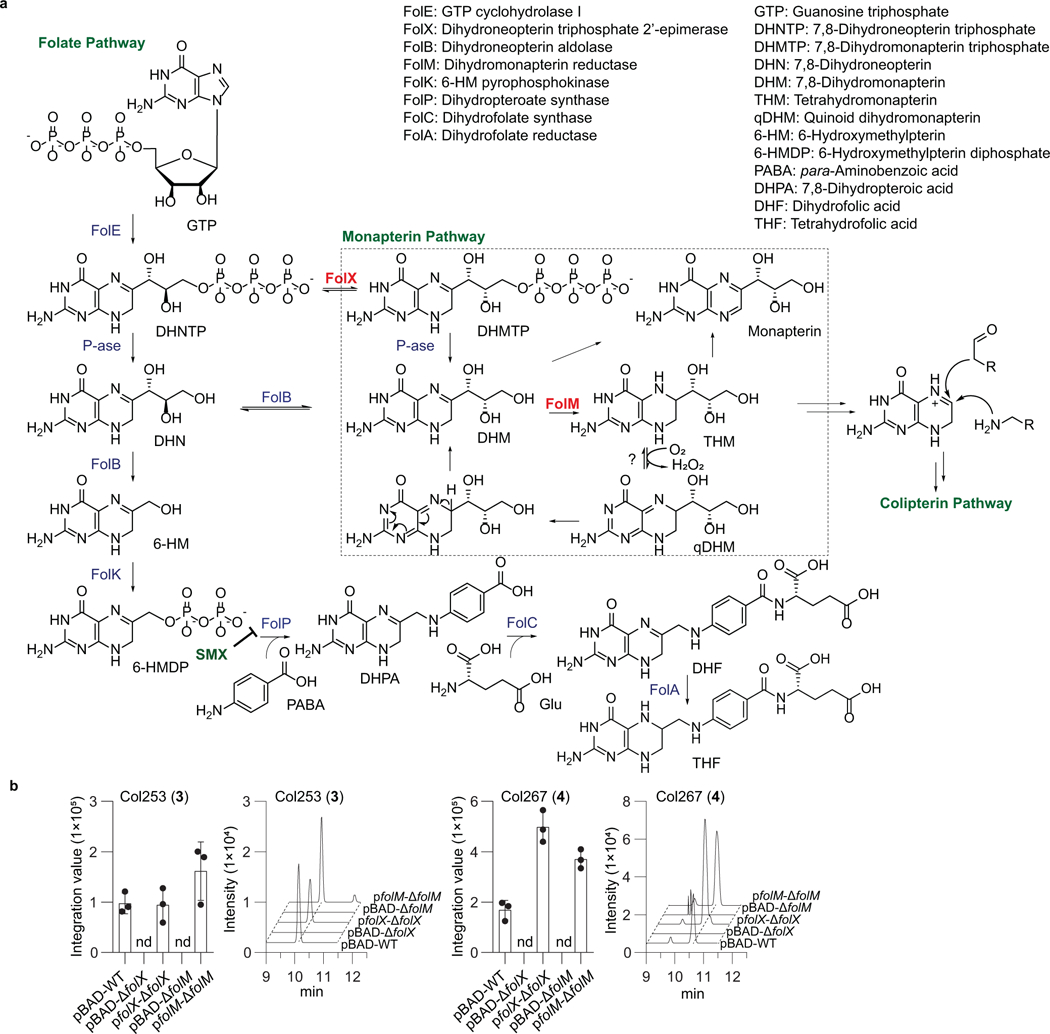
To provide genetic support of colipterin biosynthesis, we first evaluated non-essential fol genes involved in folate and monapterin metabolism46,47. While folate itself is required for bacterial growth, monapterin’s role in E. coli remains obscure10,48. Since colipterins are upregulated in antifolate SMX stress, we hypothesized that inhibition of folate metabolism in E. coli could inversely lead to the elevation of monapterin-derived products (Fig. 2a). Of the Fol enzymes, FolX catalyzes conversion of 2,3-dihydroneopterin triphosphate (DHNTP) into 2,3-dihydromonapterin triphosphate (DHMTP), which is followed by dephosphorylation to yield 2,3-dihydromonapterin (DHM) and reduction to tetrahydromonapterin (THM) by FolM (Extended Data Fig. 4a)9,10,49. We thus grew E. coli mutants of folX and folM for 24 h and analyzed production of 1-4, the dominant products at this time point. Relative to the parent E. coli BW25113, the ΔfolX and ΔfolM strains led to complete abolishment of 1-4 (Fig. 2b). These metabolic phenotypes could be complemented in trans with the expression of folX and folM, respectively (Extended Data Fig. 4b), further supporting that the colipterins derive from the monapterin pathway. We next focused on the aromatic amino acid transaminases AspC and TryB and their potential role in colipterin biosynthesis. Notably, it has been documented that aspC, which is responsible for the conversion of aromatic amino acids to their α-keto acid forms, is required for drug stress responses in E. coli50–52. In our analysis of single mutants, ΔaspC and ΔtyrB, we observed no significant differences in colipterin production compared to wild-type. However, we constructed two double mutants ΔaspC-tyrB in both the ΔaspC and ΔtyrB backgrounds, and the colipterins were completely abrogated (Fig. 2c). These data indicate that aromatic amino acid transamination is required for colipterin biosynthesis and that AspC and TyrB are functionally redundant in this regard. Collectively, these studies demonstrate that monapterin biosynthesis and aromatic amino acid transamination converge in colipterin production. However, potential catalysts or cellular conditions that facilitate coupling of dihydropterin (DHP) and phenylpyruvate, and to a lesser extent phenylalanine (Phe), remain undefined.
Fig. 2. Genetic and biomimetic synthesis support of the colipterin pathway.

a, Schematic representation of the folate and monapterin pathway. Chemical structures and enzyme annotations of these pathway are given in Extended Data Fig. 4a. b, Abolishment of major colipterins 1-4 in monapterin biosynthetic mutants, ΔfolX and ΔfolM. c, Abolishment of 1-4 in two distinct double-mutants of aspC and tyrB in E. coli BW25113. d, Production of colipterins 3-8 via in vitro biomimetic synthesis. Tetrahydropterin (THP) was used as a dihydropterin (DHP) substrate, which reacts with phenylpyruvate (PP) to yield 3-6 (middle) and L-phenylalanine (L-Phe) to yield 7 and 8 (bottom), respectively. e, Pre-incubated phenylpyruvate (PP) and L-phenylalanine (L-Phe) reactions with THP yielded 1 and 2. f, Proposed colipterin pathway in E. coli. Proposed monapterin recycling is boxed. Enzyme annotations (blue colored) are as follows: FolE, GTP cyclohydrolase I; FolX, 7,8-dihydroneopterin triphosphate 2ʹ-epimerase; and FolM, 7,8-dihydromonapterin reductase. Abbreviations are as follows: GTP, guanosine triphosphate; DHNTP, 7,8-dihydroneopterin triphosphate; DHMTP, 7,8-dihydromonapterin triphosphate; DHM, 7,8-dihydromonapterin; THM, Tetrahydromonapterin; and qDHM, quinoid dihydromonapterin. Solid blue and red arrows indicate coupling of PP and L-Phe to DHP, respectively. Dashed arrows represent the formation of PP-Phe conjugate (purple) and coupling of this conjugate to DHP (green), respectively.
With the necessary colipterin substrate pathways defined, we turned to biomimetic synthesis studies to explain colipterin family production. We proposed that nucleophilic substitution reactions at the electrophilic C6-position of DHP could account for 1-8. To test this proposal, we prepared tetrahydropterin (THP) as previously described.53 Individual reactions (2 h anaerobic, 2 h aerobic) with THP and phenylpyruvate or Phe yielded two groups (3-6) and (7-8), respectively (Fig. 2d). 3 and 4 were established as degradation products of 5 and 6, and auto-oxidation of 3 to 4, and of 7 to 8, was detected (Extended Data Fig. 5a-d). To facilitate the production of 1 and 2, we reacted Phe and phenylpyruvate (1:1 ratio) in dimethylformamide (DMF) before supplementation of THP. Only these sequential conditions led to the production of 1 and 2 (Fig. 2e), supporting the order of reactivity. Lastly, the oxidation state of the pterin reactant in these studies appeared to be free DHP, as pterin and THP (anaerobic) were not competent substrates (Extended Data Fig. 5e,f). Importantly, these studies support a mechanistic model in which DHP could undergo “nucleophilic reduction” to generate C6-functionalized THP-conjugates in the absence of a biological reductant (e.g., NADH, NADPH) (Fig. 2f).
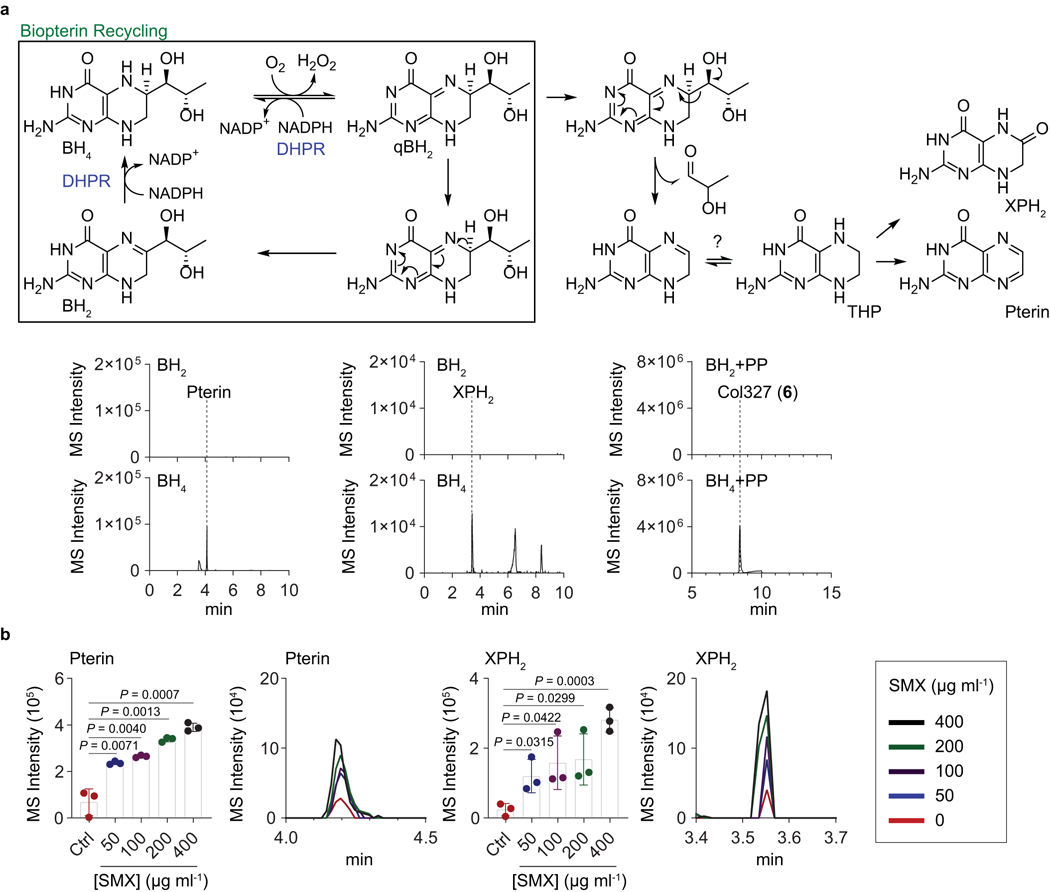
With our understanding of colipterin origins from monapterin genetic studies and biomimetic synthesis efforts, we turned to establish dominant DHP substrate origins in E. coli. Monapterin (and folate) is derived from guanosine triphosphate (GTP) through the key intermediate 2,3-dihydroneopterin triphosphate (DHNTP) by GTP cyclohydrolase I (GTPCH, folE) in E. coli54. Prior studies have proposed a recycling pathway in mammalian cells for the hydroxyl analog of monapterin, tetrahydrobiopterin (BH4)55, that serves as an antioxidant and essential redox co-factor for aromatic amino acid hydroxylases and nitric oxide synthase (NOS)56,57. BH4 is oxidized to the unstable quinoid dihydrobiopterin (qBH2) which isomerizes to dihydrobiopterin (BH2), and dihydropterin reductase (DHPR) recycles qBH2 and BH2 back to BH457 (Extended Data Fig. 6a). Additionally, it has been shown that the C6-functionalized side-chain of unstable qBH2 is irreversibly cleaved, which ultimately results in the break-down products, pterin and dihydroxanthopterin (XPH2)58. We confirmed the oxidative side-chain cleavage events of BH4 in vitro (Extended Data Fig. 6a). Additionally, we observed an analogous folM-dependent accumulation of pterin and XPH2 in E. coli cultures, and the metabolites were similarly upregulated in response to SMX stress as expected from our studies above (Extended Data Fig. 6b). Thus, based on our chemical, genetic, and metabolomic studies, we propose analogous tetrahydromonapterin (THM) recycling and degradation pathways in E. coli, in which NADPH-dependent and FolM-mediated THM recycling competes with C6-side chain cleavage. However, cleaved DHP could undergo further nucleophilic pterin-core reductions to explain the colipterins (Fig. 2f).
To establish biological activities for the colipterins, we first considered the activities of other pterins. Members of the pterin family serve as xanthine oxidase inhibitors59, redox cofactors,60 and as antioxidants via their radical scavenging activities61. Given the redox activity of pterins, we examined 1-6 (7-8 were substrate limited) for radical scavenging activity against the stable radical 1,1-diphenyl-2-picrylhydrazyl (Fig. 3d). L-Ascorbic acid and THP were used as positive controls (EC50 values, 3.8 and 4.1 μg ml−1, respectively, Fig. 3d). Colipterin 6 was the most active radical scavenger (EC50, 12.8 μg ml−1) with comparable activity to positive controls, whereas 1 and 2 were less active (EC50 >70 μg ml−1). While 3 and 4 were inactive, chemical reduction to their THP-conjugate forms, 3a and 4a, showed good activity (13.1 μg ml−1 and 27.9 μg ml−1, respectively). This chemical reduction is directly analogous to our nucleophilic reduction model for DHP, indicating that nucleophilic reductions could provide the organism an advantage to redox stress. Moreover, supplementation of 4, the most advanced metabolite in the colipterin pathway, to E. coli cultures using the disk diffusion method significantly reduced the zones of inhibition against hydrogen peroxide stress compared to 3, 6, pterin, THP, and solvent vehicle controls, suggesting that 4 (or reduced 4a in cells) have a cellular protective role (Fig. 3e and Supplementary Fig. 65).
Fig. 3. Immunomodulatory activities of the colipterins.

a, BioMap® phenotypic profiling assays of colipterins (single dose) against human primary cells. Cell types and stimuli used in each system are as follows: 3C system [HUVEC +(IL-1β, TNF-α and IFN-γ)], 4H system [HUVEC +(IL-4 and histamine)], LPS system [PBMC and HUVEC + LPS (TLR4 ligand)], SAg system [PBMC and HUVEC + TCR ligands (1×)], BT system [CD19+ B cells and PBMC + (α-IgM and TCR ligands (0.001×))], BF4T system [bronchial epithelial cells and HDFn + (TNF-α and IL-4)], BE3C system [bronchial epithelial cells + (IL-1β, TNF-α and IFN-γ)], CASM3C system [coronary artery smooth muscle cells + (IL-1β, TNF-α and IFN-γ)], HDF3CGF system [HDFn + (IL-1β, TNF-α, IFN-γ, EGF, bFGF and PDGF-BB)], KF3CT system [keratinocytes and HDFn + (IL-1β, TNF-α and IFN-γ)], MyoF system [differentiated lung myofibroblasts + (TNF-α and TGF-β)] and /Mphg system [HUVEC and M1 macrophages + Zymosan (TLR2 ligand)]. b, Dose response (17, 1, 0.1, 0.01, and 0.001 μM) analysis of IL-8 levels (pg ml−1) in macrophage-like cells differentiated from human THP-1 cells in the presence of 1–6. c, Dose response (17, 1, 0.1, 0.01, and 0.001 μM) analysis of IL-10 levels (pg ml−1) in mouse BMDM cells by 1-6. L-Ascorbic acid was used as a positive control. Error bars for b and c are represented as the mean ± s.e.m., n = 3. P values between DMSO and other treatments were determined by unpaired, one-way ANOVA with Dunnett’s test. d, Stable DPPH radical scavenging activities of 1-6. 3a and 4a are chemically reduced tetrahydropterin-variants of 3 and 4, respectively. Tetrahydropteron (THP) and L-ascorbic acid were used as positive controls. Data are presented by mean ± s.d. (n = 3). e, Disk diffusion test of 3, 4, 6, pterin, and THP against E. coli Nissle1917 in the presence of hydrogen peroxide. 100 μg/disk of compound was treated, incubated for 3 h at 37 °C, and 1 μl of 30% H2O2 was subsequently added on the disk. P value was determined by a two-tailed unpaired t-test. The mean and s.d. are presented from three biological replicates (n = 3).
Next, we screened 1-6 against a panel of 12 human primary cell-based co-culture systems that model multiple tissues and disease states (BioMAP® Phenotypic Profiling Assay). Details are described in the methods. Briefly, 1–6 had similar effects on most of the protein biomarkers measured in these cell systems, and we observed that several of the colipterins affected IL-8 and IL-10 levels in venular endothelial and macrophage cell systems (/Mphg) (Fig. 3a). To validate selected immunomodulatory properties of the colipterins, we measured IL-8 and IL-10 (for 1-6) expression levels in human THP-1 macrophage-like cells and mouse bone marrow-derived macrophages (BMDMs), respectively, using ELISA assays. At the same BioMap® testing dose of 17 μM, 2, 3, 4, and 6 significantly stimulated IL-8 levels compared to DMSO vehicle control (Fig. 3b) in differentiated THP-1 cells. Similarly, 1-4 and 6 upregulated IL-10 levels in BMDMs (Fig. 3c). Dose response analysis with L-ascorbic acid as an antioxidant control was comparable to most of the colipterins, suggesting that their antioxidant activities upregulate IL-10 levels. However, we observed significant IL-8 and IL-10 responses of colipterin 6 at concentrations of 1 μM or higher, whereas L-ascorbic only showed responses at an order of magnitude higher concentration (17 μM).
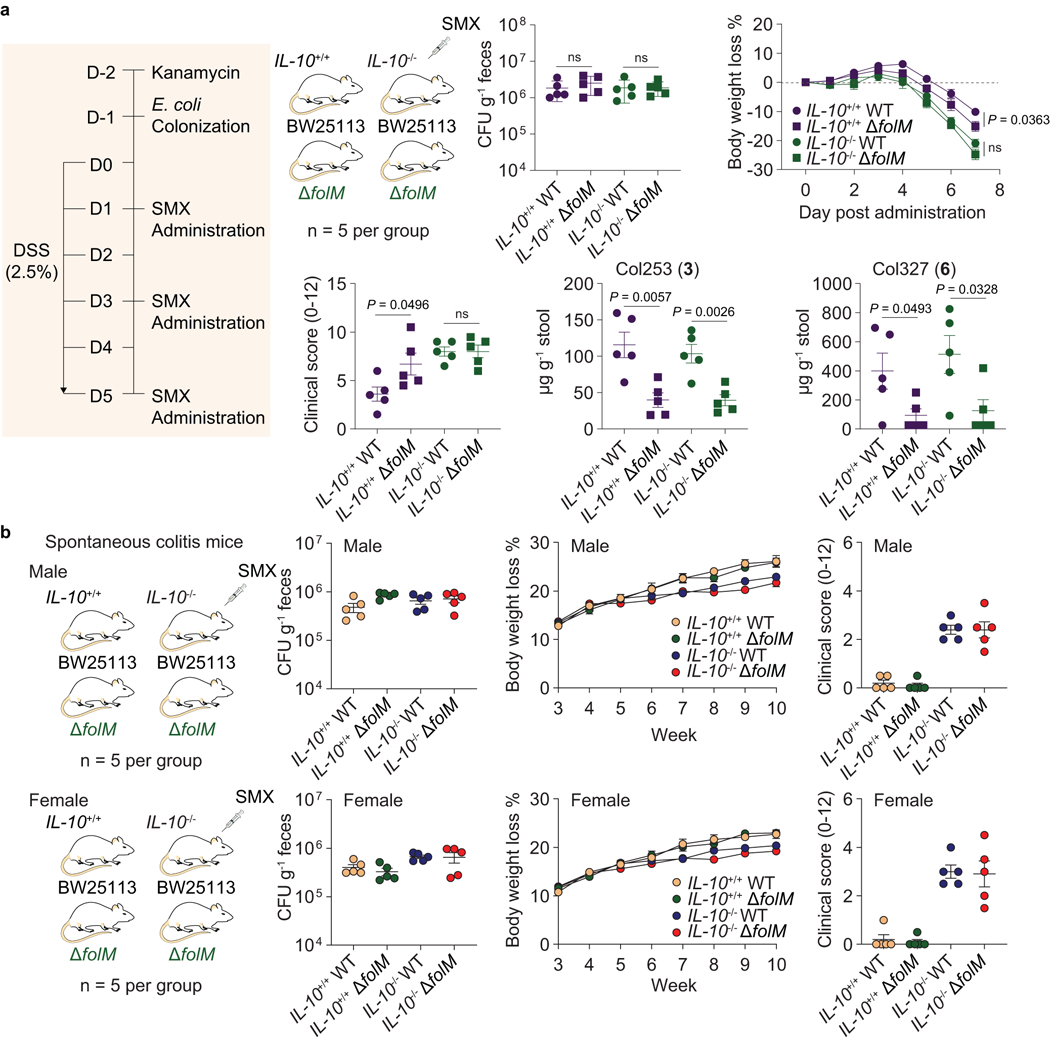
Because we observed both in vitro radical scavenging activities and upregulation of anti-inflammatory cytokine IL-10 in human and mouse tissue culture systems, we next investigated whether the colipterins could ameliorate severe colitis symptoms in vivo in a colitis mouse model (Fig. 4 and Extended Data Fig. 7). We individually colonized microbiome-reduced IL-10+/+ and IL-10−/− mice with wild-type E. coli BW25113 and its folM mutant strain, and dextran sulfate sodium (DSS, 2.5%) was administered. We then fed SMX to the mice compared to no SMX controls (Fig. 4a). While there was no difference in E. coli colonization among the groups as expected, slight body weight loss in mice with ΔfolM was observed upon SMX administration (Fig. 4b,c). The DSS scores62 in IL-10-deficient mice were similar between wild-type and ΔfolM colonized groups; however, IL-10+/+ mice colonized by ΔfolM exhibited significantly higher DSS scores compared to that of mice colonized with wild-type E. coli, suggesting that folM-derived metabolites, such as the colipterins, protect mice from DSS-induced colitis in an IL-10-dependent manner (Fig. 4b,c). We also observed significantly higher in vivo levels of major colipterins 3 and 6 in the stool samples of both IL-10+/+ and IL-10−/− mice colonized with wild-type E. coli compared to the ΔfolM-colonized groups (Extended Data Fig. 7a). Importantly, we can also detect basal levels of 3 and 6 in the ΔfolM E. coli systems, suggesting that other members of the microbiome also produce the colipterins.
Fig. 4. Colipterins reduce colitis severity in an IL-10-dependent manner.

a, Experimental workflow for the intestinal colonization of E. coli (wild-type E. coli BW25113 and its folM mutant strain) followed by 2.5% DSS and SMX (100 mg kg−1 of body weight) administrations to mice (IL-10+/+ and IL-10−/−). b and c, Ameliorative effect of the severe colitis symptom in the DSS-induced IL-10+/+ (b) and IL-10−/− (c) colitis mice that were colonized with BW25113 or with a folM mutant, and these groups were treated with or without SMX. Colony-Forming Units (CFUs) in fecal pellets were measured at day 7 after DSS-administration. Body weight of each mouse was determined daily after DSS-administration, and the body weight loss was depicted as the percentage (%) compared to the initial body weight. Endoscopy clinical scores of each experimental group at day 6 after DSS administration. P value between WT (red) and WT+SMX (purple) is presented for body weight loss % in panel b. d, Reduction of severe colitis symptom by the administration of colipterins 3, 4, and 6. Folic acid was used as a control. Colipterins 3, 4, 6 and folic acid (each 10 mg kg−1) every other day to WT mice in DSS models. P values of DMSO versus treated compounds are presented. e, Representative and statistical percentage of IL-10eGFP positive cells among colon intestinal macrophages after administration of 4 and 6. Three biologically independent mice were used (n = 3). FACS sequential gating strategy is shown in Supplementary Figure 66. f and g, Evaluation of colipterins in the IL-10−/− male (f) and female (g) mice that spontaneously develop colitis. IL-10+/+ mice administered with DMSO were used as control. Body weight was monitored weekly. Compounds were mixed in the drinking water at 0.03 mg ml−1 individually after the mice were 6 weeks old. At week-10, endoscopy was performed and clinical scores were used as a metric of colitis severity. All P values were calculated by a two-tailed unpaired t-test. All error bars are represented as mean values ± s.e.m.; ns, not significant.
To further support colipterin-mediated upregulation of IL-10 in vivo, we individually fed 3, 4, 6, and folic acid (each 10 mg kg−1) every other day to wild-type mice (IL-10+/+) using the DSS inflammation model (Fig. 4d). 4 and 6 significantly reduced colitis severity, whereas folic acid showed no effect in our experiment. Further, we individually fed 4 and 6 (10 mg kg−1 each) to IL-10eGFP mice, isolated immune cells from the colon, and quantified eGFP signals in CD45+CD3-CD11b+F4/80+ macrophages using fluorescence activated cell sorting (FACS). Relative to DMSO control, 4 and 6 significantly upregulated IL-10 production in macrophages (Fig. 4e). Finally, we examined the effects of 3, 4, 6, and folic acid on colitis severity in IL-10−/− mice that spontaneously develop colitis after 10-weeks of age. None of compounds were protective in IL-10−/− mice (Fig. 4f,g), further suggesting that the colipterins ameliorate colitis in an IL-10-dependent manner. Consistent with these findings, IL-10−/− spontaneous colitis mice colonized with E. coli (wild-type BW25113 versus ΔfolM) in the presence of SMX and absence of DSS similarly showed no protective effects (Extended Data Fig. 7b). Collectively, these data link folM-derived colipterins to anti-inflammatory IL-10 responses in vivo, leading to the improvement of colitis symptoms in an IL-10-dependent manner.
Modern analytical technologies have led to the realization that the vast majority of metabolites found in any microbe or animal including humans remain unknown63. Some of the metabolites in this so called “dark matter” of the metabolome will undoubtedly have profound functional consequences. Not only will they affect microbial compositions and activities, but they will also regulate host phenotypes, such as immunomodulatory responses. Further complicating the observed chemical smorgasbord of metabolites in the intestinal tract, antibiotics dramatically impact microbial metabolism15–18,51 and host immune responses27,28 through a variety of mechanisms. However, we are only beginning to understand how the microbiome regulates the immune system at the detailed molecular level and how antibiotics participate directly or indirectly in these molecular responses. Sub-inhibitory levels of antibiotics provide a means to study the stress responses of select microbiome members such as E. coli without significantly impacting their cell growth in vitro or intestinal colonization in vivo. In our study, application of the antifolate antibiotic SMX to intestinal E. coli strains leads to the upregulation of a previously undescribed family of pteridines termed the colipterins. In addition to harboring antioxidant roles for the E. coli, these metabolites exhibit anti-inflammatory activities in primary human tissues, in laboratory tissue cultures, and in mouse models of intestinal inflammation. Thus, these chemical biological studies provide an example that could support a broader model in which antibiotics indirectly regulate immune responses through the activation of bacterial stress responses.
E. coli strains have been linked to the severity of IBDs, including Crohn’s disease and ulcerative colitis, but the mechanisms similarly remain largely undefined at the molecular level5,64,65. For example, AIEC LF82 has been implicated in the pathogenesis of Crohn’s disease65, whereas human probiotic E. coli 1917 supports the remission of ulcerative colitis in clinical trials64,66. SMX is used to treat E. coli infections, including those in IBD patients6,31. Strikingly, we show that SMX antifolate stress upregulates colipterin production in E. coli and hypothesize that our nucleophilic DHP-reduction model, which accounts for colipterin production, would provide E. coli an advantage to redox stress. In principle, a reduction in NADPH levels could shift the balance from monapterin recycling to irreversible C6-fragmentation, leading to DHP. Tetrahydropterins like THP have potent antioxidant activities on par with ascorbic acid (vitamin C), and “nucleophilic reduction” of DHP to its THP-conjugates, the colipterins, in the absence of a hydride source provide a chemical strategy to enhance antioxidant activity. We support this model with radical scavenging and E. coli cell culture studies. In turn, this bacterial stress response mechanism enhances the production of anti-inflammatory IL-10 and reduces the severity of colitis in mouse models in an IL-10-dependent manner. As the human microbiome field transitions from correlation to causation63, the “dark matter” of the metabolome will begin to be illuminated. Illumination of the colipterins here exemplify some of the hidden functional chemical diversity of a major microbial player at the host-microbe interface.
Methods
General Chemistry Analysis.
Analytical HPLC-MS spectra of metabolites were collected using an Agilent 1260 Infinity HPLC with an Agilent 6120 Quadrupole low-resolution (LR) electrospray ionization (ESI) mass spectrometer (Agilent, Santa Clara, CA, USA). Liquid column chromatography was carried out using either LiChroprep® RP-18 (40–63 μm) (Merck Millipore, Billerica, MA, USA) or Sep-Pak® Vac 35cc (10g) C18 cartridge (Waters, Milford, MA, USA). Preparative HPLC for the isolation of metabolites was achieved on an Agilent Prepstar HPLC system with Agilent Polaris C18-A 5 μm (21.2 × 250 mm), Phenomenex Luna C18(2) or C8(2) (100Å) 10 μm (10.0 × 250 mm) (Phenomenex, Torrance, CA, USA), and Agilent Phenyl-Hexyl 5 μm (9.4 × 250 mm) columns. High-resolution mass spectra were obtained from an Agilent iFunnel 6550 QTOF (quadrupole time-of flight) MS instrument fitted with an electrospray ionization (ESI) source coupled to an Agilent 1290 Infinity HPLC system.
Determination of Sub-Inhibitory Levels of SMX Against E. coli.
E. coli strains (probiotic Nissle1917, pathogenic LF82, and commensal BW25113) were grown on LB agar plates [1% tryptone (w/v), 0.5% yeast extract (w/v), 1% sodium chloride (w/v), and 1.5% agar (w/v)] at 37 °C for 18 h. Three well-defined colonies from each of the strains were inoculated into 3 × 5 ml of LB broth and incubated at 37 °C with agitation (250 r.p.m). Overnight E. coli cultures (5 μl) were seeded into 5 ml LB broth and were further grown for 18 h. Sulfamethoxazole (SMX, TCI, USA), when needed, was prepared in fresh LB medium with a highest concentration of 1.6 mg ml−1, which was then serially diluted. The 5 ml of SMX-containing medium was dispensed into 14 ml sterile culture tubes, and 5 μl of E. coli culture was inoculated and grown at 37 °C for 24 h at 250 r.p.m. The optical density (OD600) of cultures was measured, and growth curves were generated to determine sub-inhibitory levels of SMX against E. coli.
Metabolome Analysis of E. coli in Response to SMX Stress.
5 μl of E. coli cultures (3 × 5 ml in LB medium) were inoculated into 5 ml LB broth in the presence of a sub-inhibitory range of SMX and incubated at 37 °C and 250 r.p.m for time-course analysis. Untreated E. coli cultures were used as controls (no drug). At three time-points (12 h, 24 h, and 48 h), metabolites from E. coli cultures were extracted as follows: whole cultures were centrifuged (2,000 × g, 20 min, 4 °C) and the supernatants were extracted with n-butanol (1 × 6 ml). The n-butanol-soluble layer was dried by a Genevac HT-4X system for 6 h. The dried samples were re-suspended in 100 μl of methanol and the insoluble materials were removed centrifugation for 5 min at 21,000 × g at 4 °C. The clarified samples were analyzed by high-resolution ESI-Q-TOF-MS (Injection volume: 2 μl; Column: Phenomenex Kinetex C18 (100Å) 5 μm (250 × 4.6 mm) column; Flow rate: 0.7 ml min−1; Mobile phase composition: 10 to 100% acetonitrile in water containing 0.1% formic acid for 30 min). Relative metabolite production was achieved by comparing extracted ion count (EIC) chromatograms with an error window of 10 ppm. The time-course experiment was performed in three biological replicates.
Colipterin Detection from Cell Pellets of E. coli Nissle1917.
Three colonies of E. coli Nissle1917 were individually inoculated into 5 ml LB cultures and were incubated at 37 °C with agitation (250 r.p.m). Overnight cultures were sub-cultured (5 μl) into fresh 5 ml LB aliquots with or without SMX (200 μg ml−1) and further incubated at 37 °C overnight. Cell pellets were harvested at three different time points (12h, 24h, and 48h) and washed in sterile 2 ml PBS (×3 times). Next, the cell pellets were extracted with 2 ml of an organic solvent mixture containing methanol/acetonitrile/water (1/1/0.5, v/v/v) and sonicated for 10 min. The extracts were dried under reduced pressure on a Genevac HT-4X system for 3h. The samples were re-dissolved in 100 μl methanol and 2 μl sample was injected for HR-ESI-Q-TOF-MS analysis. The samples were analyzed as described in “Metabolome Analysis of E. coli in Response to SMX Stress.”
Quantification of Colipterins from E. coli Nissle1917 Culture.
Three colonies of E. coli Nissle1917 were individually inoculated into 5 ml LB cultures and were incubated overnight at 37 °C with agitation (250 r.p.m). Overnight cultures (5 μl) were dispensed into 5 ml fresh LB cultures and were further cultivated for 24 h, the cells were centrifuged, and the supernatants were extracted with n-butanol (6 ml). Organic extracts were dried under reduced pressure on a Genevac HT-4X system for 3h. Whole extracts were dissolved in 200 μl methanol. Stock solutions of individual colipterin standards were prepared at a concentration of 10 mM in methanol. Six different working solutions of all colipterin standards were individually prepared in 200 μl methanol to establish a calibration curve. 2 μl of each sample was analyzed by HR-ESI-Q-TOF-MS with a reversed phase HPLC column [Phenomenex Kinetex C18 (100 Å) 5 μm (4.6 × 250 mm), flow rate; 0.7 ml min−1, mobile phase; a H2O/ACN gradient containing 0.1% formic acid (v/v): 0–30 min, 10–100% ACN].
Isolation of Metabolites.
Liquid chromatography for 1-4: n-Butanol extracts (3.2 g) were subjected to medium pressure liquid chromatography (MPLC) (Biotage, SNAP cartridge KP-C18-HS, 120 g) and fractionated with a linear gradient elution of methanol/water (Flow rate: 35 ml min−1; 0–20 min, 10/90%; 20–60 min, 10/90% → 100/0%) to give 15 fractions (1 – 15). Fraction 10 was found to contain two mass peaks of interest (i.e., [M+H]+ at m/z 459) upon LC-MS analysis. Thus, fraction 10 (~ 400 mg) was further separated into 60 HPLC fractions using an Agilent Polaris C18 column (21.2 × 250 mm) with a gradient of 0.01% TFA in methanol/water (Flow rate: 10 ml min−1; 0–60 min, 10/90→100/0%, 1 min fraction collection). HPLC fraction 23 (12 mg) was subjected to two subsequent reversed-phase HPLC [Column: Phenomenex Luna C18 (100Å) 10 μm (10.0 × 250 mm) and Agilent Phenyl-Hexyl 5 μm (9.4 × 250 mm)] with a linear gradient 0.01% TFA in acetonitrile/water elution (Flow rate: 4 ml min−1; 0–60 min, 10/90→100/0%) to yield 1 (tR = 17.7 min, 1.2 mg) and 2 (tR = 19.0 min, 1.5 mg). Isolation of 3 and 4 was initiated from the n-butanol-soluble fraction (2.5 g), which was re-suspended in 50% aqueous methanol and dried by rotary evaporation in the presence of Celite® adsorbent material. The powdery mixture was then loaded onto pre-packed reversed-phase C18 resins (300 g), and the molecules were eluted with a stepwise gradient (0, 10, 20, 40, 60, and 100% methanol in water). The 40% methanol fraction (~ 600 mg) was subjected to reversed-phase C18 HPLC column separation [Agilent Polaris C18-A 5 μm (21.2 × 250 mm)] with a mobile phase acetonitrile/water gradient system (Flow rate: 8 ml min−1; 0–20 min, 5/95%; 20–80 min, 5/95% → 60/40%; 1 min fraction collection). The pooled fractions 38–40 (8 mg) were further separated with a Phenomenex Luna C18 (100Å) 10 μm (10.0 × 250 mm) column using a gradient of 10–100% acetonitrile in water over 60 min at a flow rate of 4 ml min−1 to afford partially pure 3 and 4. These metabolites were purified by Phenomenex Luna C18 (100Å) 10 μm (10.0 × 250 mm) with a shorter gradient elution of 5–60% acetonitrile in water for 30 min, eluting 3 (0.8 mg) and 4 (1.0 mg) at tR = 17.3 and 18.2, respectively.
Liquid chromatography for 5-8: The 20% methanol fraction (900 mg) from the Sep-Pak® Vac 35cc (10 g) C18 step was further separated by reversed-phase HPLC using Agilent Polaris C18-A 5 μm (21.2 × 250 mm) column (Flow rate: 8 ml min−1, eluting with a linear gradient of 5–50% with methanol in water over 60 min, 1 min fraction collection). HPLC fractions 28 (4 mg) and 30 (6 mg) were further purified using a Phenomenex Luna C18 (100Å) 10 μm (10.0 × 250 mm) column with a gradient of 10–100% acetonitrile in water over 60 min with a flow rate of 4 ml min−1, yielding 5 (tR = 11.5 min, 1.5 mg) and 6 (tR = 13.7 min, 2.4 mg), respectively. The 40% methanol fraction (~ 800 mg) from the Sep-Pak® step contained 7 and 8, which were purified using reversed-phase HPLC, over an Agilent Polaris C18-A 5 μm (21.2 × 250 mm) column (Flow rate: 10 ml min−1; 0–20 min, 5% acetonitrile in water; 20–80 min, 5–60% acetonitrile in water). 7 and 8 eluted in fractions 47 and 56, respectively. Fractions 47 (9 mg) and 56 (7 mg) were further individually fractionated using a Phenomenex Luna C18 (100Å) 10 μm (10.0 × 250 mm) column with a gradient of 5–100% acetonitrile in water over 60 min with a flow rate of 4 ml min-1. Finally, purification of 7 (tR = 11.8 min, 4 mg) and 8 (tR = 16.6 min, 2.5 mg) was achieved using a Phenomenex Luna C8 (100Å) 10 μm (10.0 × 250 mm) column, eluting with a 5–100% acetonitrile gradient in water for 60 min at a flow rate of 4 ml min-1.
NMR-Based Structure Elucidation of Metabolites.
NMR spectra were recorded on Agilent 600, 500, and 400 MHz NMR spectrometers. 1H and 13C chemical shifts given in ppm (δ) and coupling constants (J) in Hz were referenced to the solvent residual peaks of DMSO-d6 (δH 2.49 and δC 39.6). Detailed structural elucidation efforts are described in Supplementary Discussions.
Identification of Phenylalanine Motif Stereochemistry.
Standard D-/L-phenylalanine and Nα-(2,4-dinitro-5-fluorophenyl)-L-alaninamide (FDAA) were purchased from Millipore Sigma (St. Louis, MO, USA). To liberate free phenylalanine, metabolites 1, 2, 7, and 8 (~0.5 mg) were hydrolyzed in 6N hydrochloric acid (500 μl) at 110 °C for 1 h, and the resultant hydrolysates were dried utilizing a nitrogen stream. The residues were dissolved in water and completely dried for 24 h in a Genevac HT-4X system to remove residual acid. Identification of phenylalanine was performed via standard Marfey’s derivatization. The hydrolyzed materials and standard amino acids were derivatized upon the addition of 50 μl of a solution of FDAA (10 mg ml−1 in acetone) followed by the addition of 100 μl of 1N sodium bicarbonate. The reactions were incubated for 3 min at 80 °C and quenched via the addition of 50 μl of 2N hydrochloric acid. The derivatives were diluted in 300 μl of 50% aqueous acetonitrile and 10 μl of the samples were analyzed by LC-MS.
Computational Analysis for Absolute Structure Elucidation of 1 and 2.
Conformational searches were conducted using the Macromodel (version 2015–2, Schrödinger LLC) program with “mixed torsional/low mode sampling” in the MMFF94 force field. The searches were implemented in the gas phase with a 50 kJ mol−1 energy window limit and 10,000 maximum number of steps to completely explore low-energy conformers. The Polak−Ribiere conjugate gradient method was used for minimization processes with 10,000 maximum iterations and a 0.001 kJ (mol Å)−1 convergence threshold on the rms gradient. Conformers within 10 kJ mol−1 of each global minimum of plausible epimers addressed in this study were provided for the GIAO shielding constant calculations without geometry optimization using the Gaussian 09 package (Gaussian Inc) at the B3LYP/6–31G(d,p) level in the gas phase. These calculated chemical shift values were averaged based on their Boltzmann populations (Supplementary Table 2) and utilized for CP3 analysis facilitated by the applets available at http://www-jmg.ch.cam.ac.uk/tools/nmr/CP3.html. In particular, calculated and experimental chemical shift values of diastereotopic protons were compared with their closest matches based on the original author’s recommendation67.
Chemical Synthesis of 3 and 4.
Cinnamaldehyde and 2,4,5-tri-amino-6-oxo-dihydropyrimidine dihydrochloride were purchased from Millipore Sigma and Santa Cruz Biotechnology (Dallas, TX, USA), respectively. The 2-bromo-3-phenyl-propionaldehyde (3 g, 14 mmol) was re-dissolved in ethanol (50 ml) followed by the addition of 2,4,5-tri-amino-6-oxo-dihydropyrimidine dihydrochloride (3 g, 15 mmol) and sodium bicarbonate (4 g, 47 mmol) in water (30 ml). The mixture was refluxed for 1 h and cooled down to room temperature. Hydrogen peroxide solution (30%, 12 ml) was added to the mixture and stirred overnight. The precipitate was filtered and washed with water and acetone to yield colipterin 3 (1.2 g, 38%). For colipterin 4, colipterin 3 (1 g, 4 mmol) was re-suspended in water (100 ml) and refluxed with potassium permanganate (1.5 g, 9.6 mmol) for 1 h. After cooling down, the precipitate was filtered with Celite and the filtrate was acidified with 50% acetic acid. The precipitate was then collected using a glass filter. Synthetic colipterins 3 and 4 were purified as described in “Isolation of Metabolites.” 810 mg (78%) of synthetic 4 was obtained from this synthesis.
Metabolite Analysis in ΔfolX and ΔfolM.
E. coli Keio collection mutants ΔfolX and ΔfolM, and their parent strain BW25113 were obtained from Coli Genetic Stock Center (CGSC) at Yale University. Mutant strains and BW25113 were plated on LB agar supplemented with kanamycin (30 μg ml−1) and LB agar, respectively, and incubated at 37 °C overnight. Single colonies were used to inoculate 5 ml seed cultures in LB liquid medium, and the cultures were incubated at 37 °C with shaking (250 r.p.m). The 5 μl overnight cultures were seeded into 5 ml fresh LB liquid medium, and the cultures were analyzed at three time points, 12, 24, and 48 h after inoculation, in biological triplicates. Sample extraction, preparation, and HR-ESI-Q-TOF-MS analysis were performed as described in “Metabolome Analysis of E. coli in Response to SMX Stress.”
Genetic Complementation of folX and folM mutants.
The genes, folX and folM, were PCR amplified from E. coli BW25113. Primers used for the amplification are shown in Supplementary Table 6. The purified PCR products and the pBAD18 vector were independently digested using SacI and KpnI and were ligated using T4 DNA ligase (NEB) according to the manufacturer’s protocol. These products, pBAD-empty vector, pBAD-folX, and pBAD-folM, were then transformed by heat-shock into chemically competent E. coli DH5α followed by sequence validation. Electrocompetent E. coli BW25113, ΔfolX, and ΔfolM strains were generated, and the empty vector, pBAD-folX, or pBAD-folM were electroporated into the corresponding electrocompetent strains. Cells were grown on LB agar plates supplemented with ampicillin at 100 μg ml-1. 5 ml overnight cultures in biological triplicates were sub-cultured (1:1000) into 5 ml aliquots of LB supplemented with 100 μg ml−1 ampicillin and grown at 37 °C until the OD600 = 0.4–0.5. The cultures were induced with 0.1% L-arabinose and further incubated at 37 °C with agitation (250 r.p.m) for 48 h. After centrifugation, the supernatants were extracted with 6 ml n-butanol and the extracts were dried under reduced pressure on a HT-4X evaporation system. The samples were analyzed as described in “Metabolome Analysis of E. coli in Response to SMX stress.”
Construction of aspC and tyrB Double Mutants.
E. coli BW25113 ΔtyrB/ΔaspC double mutant strains were constructed using the Red recombinase system of bacteriophage lambda. The FTR-flanked spectinomycin resistance cassette of pIJ778 was amplified (primers, Supplementary Table 6) with short sequence extensions homologous to the flanking regions of aspC or tyrB. Purified PCR products were desalted and respectively transformed into E. coli JW4014–2 (ΔtyrB747::kan) or JW0911–1 (ΔaspC745::kan) carrying plasmid pKD46. Transformants were selected by plating on LB agar supplemented with spectinomycin (50 μg ml−1). Colonies were analyzed with overspanning PCR and the resulting products were sequence validated and cured of pKD46.
Biomimetic Synthesis.
Pterin, L-phenylalanine (L-Phe), phenylpyruvic acid sodium salt (PP), and phenylacetic acid (PAA) were purchased from Millipore Sigma. To prepare tetrahydropterin (THP), pterin (500 mg, 3.0 mmol) was suspended in anhydrous methanol (200 ml) following addition of the platinum oxide (50 mg, 0.22 mmol) as a catalyst. Hydrogenation of pterin was initiated in the presence of hydrogen gas. After overnight reaction at room temperature, the resulting materials were filtered through Celite®545, and the filtrates were dried under nitrogen gas purge in a glove bag to yield THP (200 mg, 38%). The three substrates (PP for 5 and 6, L-Phe for 7 and 8, and PAA for 3 and 4) were individually prepared, dissolved in water with a concentration of 1 mg ml−1, and stirred at room temperature for 10 min. For 1 and 2, L-Phe (1 mg) and PP (1 mg) were mixed in the dimethylformamide (DMF, 2 ml) and incubated at room temperature for 5 h. The dried THP was re-suspended in water (~1 mg ml−1), and 50 μl of THP solution was dispensed into 96 well-plate, which was followed by the supplementation of 50 μl of pre-mixed L-Phe+PP for 1 and 2, PAA for 3 and 4, PP for 5 and 6, and L-Phe for 7 and 8. The reaction materials were anaerobically incubated for 2 h in the glove bag with nitrogen purge and were exposed to air for additional 2 h. The 10 μl of reaction samples were monitored by HPLC system with low-resolution ESI-MS spectrometer.
DPPH Radical Scavenging Assay.
Radical scavenging assays were performed as previously described in triplicate experiments53.
Cellular Protection Assay.
E. coli Nissle1917 was streaked onto an LB agar plate. Single colonies were selected and inoculated into 5 ml LB broth and incubated at 37 °C with agitation (250 r.p.m.) overnight. Cell densities were adjusted to OD600 = 0.05, and 100 μl of diluted cells were spread onto fresh LB agar plates. Compounds were prepared in DMSO (10 mg ml−1) and 10 μl of solution was soaked onto paper disk. DMSO was used for control. The disk was placed on the agar plate containing E. coli and incubated at 37 °C for 3 h. 1 μl of 30% hydrogen peroxide was then added to the disks and the cultures were further incubated overnight. Zones of inhibition were measured after overnight incubation. This assay was performed in biological triplicates.
BioMAP® Phenotypic Profiling Assay.
BioMAP Diversity PLUS assays were performed by Eurofins DiscoverX. Human primary cells in BioMAP systems were used at early passage (passage 4 or earlier) to minimize adaptation to cell culture conditions and preserve physiological signaling responses. All cells were from a pool of multiple donors (n = 2 – 6), commercially purchased and handled according to the recommendations of the manufacturers. The following vendors supply Eurofins DiscoverX with primary human cells: Cell Applications, Inc., CellzDirect, Celsis-IVT, Leukolab, Life Technologies, Lonza, ScienCell, Hemacare Corporation, Stemcell Technologies, AllCells, Physician’s Plasma Alliance, Lifeline Cell Technologies, Zen-Bio, Inc. Human blood derived CD14+ monocytes are differentiated into macrophages in vitro before being added to the lMphg system. Abbreviations are used as follows: Human umbilical vein endothelial cells (HUVEC), Peripheral blood mononuclear cells (PBMC), Human neonatal dermal fibroblasts (HDFn), B cell receptor (BCR), T cell receptor (TCR) and Toll-like receptor (TLR). Cell types and stimuli used in each system are as follows: 3C system [HUVEC +(IL-1β, TNFα and IFNγ)], 4H system [HUVEC +(IL-4 and histamine)], LPS system [PBMC and HUVEC + LPS (TLR4 ligand)], SAg system [PBMC and HUVEC + TCR ligands (1x)], BT system [CD19+ B cells and PBMC + (α-IgM and TCR ligands (0.001x))], BF4T system [bronchial epithelial cells and HDFn + (TNFα and IL-4)], BE3C system [bronchial epithelial cells + (IL-1β, TNFα and IFNγ)], CASM3C system [coronary artery smooth muscle cells + (IL-1β, TNFα and IFNγ)], HDF3CGF system [HDFn + (IL-1β, TNFα, IFNγ, EGF, bFGF and PDGF-BB)], KF3CT system [keratinocytes and HDFn + (IL-1β, TNFα and IFNγ)], MyoF system [differentiated lung myofibroblasts + (TNFα and TGFβ)] and lMphg system [HUVEC and M1 macrophages + Zymosan (TLR2 ligand)]. Systems are derived from either single cell types or co-culture systems. Adherent cell types were cultured in 96 or 384-well plates until confluence, followed by the addition of PBMC (SAg and LPS systems). The BT system consists of CD19+ B cells co-cultured with PBMC and stimulated with a BCR activator and low levels of TCR stimulation. Compounds 1- 6 were prepared in DMSO (final concentration ≤ 0.1%) and added at a final concentration of 17 μM, 1 h before stimulation and remained in culture for 24 h or as otherwise indicated (48-hrs: MyoF system; 72-hrs: BT system (soluble readouts); 168 h: BT system (secreted IgG)). Each plate contained drug controls, negative controls (e.g., non-stimulated conditions) and vehicle controls (e.g., 0.1% DMSO) appropriate for each system. Direct ELISA was used to measure biomarker levels of cell-associated and cell membrane targets. Soluble factors from supernatants were quantified using either HTRF® detection, bead-based multiplex immunoassay or capture ELISA. Overt adverse effects of test agents on cell proliferation and viability (cytotoxicity) were detected by sulforhodamine B (SRB) staining, for adherent cells, and alamarBlue® reduction for cells in suspension. For proliferation assays, individual cell types were cultured at subconfluence and measured at time points optimized for each system (48-hrs: 3C and CASM3C systems; 72-hrs: BT and HDF3CGF systems; 96-hrs: SAg system). Cytotoxicity for adherent cells was measured by SRB (24-hrs: 3C, 4H, LPS, SAg, BF4T, BE3C, CASM3C, HDF3CGF, KF3CT, lMphg systems; 48-hrs: MyoF system), and by alamarBlue staining for cells in suspension (24-hrs: SAg system; 42-hrs: BT system) at the time points indicated.
Mouse Studies.
C57BL/6 and IL-10eGFP mice were used in this study68. IL-10−/− mice were a gift from Sandy Morse (002251-B6.129P2-Il10tm1Cgn/J, Jackson Laboratory, Bar Harbor, ME). Experimental groups of wild-type and IL-10−/− mice were generated by heterozygote-by-heterozygote breeding. Sample sizes were chosen in line with pervious experimental experience and consistent with the broader literature. 8–10-week-old equal male and female mice were used if not otherwise specified. All experiments were performed using cohoused mice littermate controls. Iso-sexual male or female littermates were cohoused at 21–24°C with 40–60% humidity. A 12 light/12 dark cycle was used. All mouse studies were performed in compliance with Yale Institutional Animal Care and Use Committee protocols. No formal blinding or randomization was conducted; however, control and treated groups were chosen arbitrarily for each experiment. Mice weights and CFUs were measured in a blinded manner.
In Vitro IL-8 ELISA Assay.
Human THP-1 (ATCC TIB-202) cells were authenticated and purchased from ATCC, and no mycoplasma contamination was detected according to the manufacturer. The cells were cultured in RPMI medium (Gibco 11875093) with 10% FBS (Sigma F8192–500Ml) and 1% penicillin-streptomycin (Gibco 15070063) and were differentiated into macrophage-like cells by incubation in the presence of 50 nM PMA (Sigma P1585–1MG). Colipterins (17 μM, 1 μM, 0.1 μM, 0.01 μM in DMSO) or DMSO vehicle control (Santa Cruz 202581) were added 1 h prior to differentiation. 100 ng ml−1 LPS (Invivogen tlrl-peklps) were added after 16 h PMA incubation. After 24 h LPS treatment, culture supernatants were collected for IL-8 ELISA assays (R&D DY208–05) according to the manufacturer’s protocol. This assay was performed in triplicates.
In Vitro IL-10 ELISA Assay.
BMDMs were generated from progenitor cells isolated from the femurs and tibias of C57BL/6 mice and maintained in DMEM medium (Gibco 11965118) with 10% FBS (Sigma F8192–500Ml), 1% penicillin-streptomycin (Gibco 15070063), and macrophage-colony stimulating factor (50 ng ml−1) (R&D\416-ML-010) for 7 days. Cells were pretreated with the colipterins and a positive control, L-ascorbic acid, (17 μM, 1 μM, 0.1 μM, 0.01 μM in DMSO) or DMSO vehicle control (Santa Cruz 202581) for 1 h and co-cultured with IL-4 (20 ng ml−1) (R&D\404-Ml-010) for 16 h. Culture supernatants were collected for IL-10 ELISA assays (R&D\DY417–05) according to the manufacturer’s protocol. This assay was performed in triplicates.
E. coli Mouse Colonization.
Before colonization, 8–10-week-old mice were fasted for 4 h followed by gavage of kanamycin (20 mg). After 20 h, mice were fasted again for 4 h and administrated with 1×10⁴ kanamycin-resistant E. coli (BW25113 wild-type, ΔfolM). To calculate fecal CFUs, fecal pellets were resuspended in PBS. Serial dilutions were conducted, and bacteria were plated in triplicate on LB+kanamycin (50 μg ml−1) plates.
DSS-Induced Colitis Model.
After E. coli colonization, 8–10-week-old mice were administered 2.5% DSS (MP Bio) for 5 days and returned to regular drinking water and monitored daily. Sulfamethoxazole (SMX) was orally administrated by 100 mg per kilogram body weight at day-1, day-3 and day-5. Weight loss was measured daily. On day-6, endoscopy was performed and clinical scores were used as a metric of colitis severity. On day-7, fecal pellets were collected for the quantification of colipterins.
Fecal Colipterin Quantification.
Fecal pellets were collected and resuspended in methanol (HPLC grade) followed by centrifugation. Supernatants were dried in vacuo and resuspended in 100 μl methanol and analyzed by high-resolution ESI-Q-TOF-MS.
Colipterin Administration.
Colipterins were orally gavaged by 10 mg per kilogram body weight every other day for two weeks. Mice were euthanized 2 days after the last colipterin administration for intestinal immune cell analysis.
Immune Cell Isolation from the Small Intestine.
Intestinal tissues were first incubated with 1 mM DTE at 37 °C for 30 min and then further digested with collagenase from Clostridium histolyticum (Sigma, #2139) and DNase I at 37 °C for another 1 h. Cells from both fractions were pooled and further separated with Percoll gradient.
Flow Cytometry and Staining Antibodies.
We stained mouse intestinal macrophages with monoclonal antibodies to CD45 (Clone# 30-F11, Cat#: 103128), CD3 (Clone# 145–2C11, Cat#: 100308), CD11b (Clone# M1/70, Cat#: 101224), and F4/80 (Clone# BM8, Cat#: 123114). All antibodies mentioned above were purchased from Biolegend and were used with 1:200 dilution. Cells were stained in PBS containing 1% FBS and 0.5 mM EDTA in 4 °C and then analyzed with an LSRII cytometer (BD Bioscience). Macrophages were gated on CD45pos, CD3neg, CD11bpos and F4/80pos.
IL-10−/− Spontaneous Colitis Model.
After weaning, body weight of mice was monitored weekly. For compound administration, 3, 4, 6, folic acid, and an equivalent amount of DMSO as a solvent vehicle control were individually mixed in the drinking water at 0.03 mg ml−1 after 6 weeks of age. This concentration was equivalent to 5 mg kg−1 body weight oral dose per day based on the assumption that the average daily consumption of water for an adult 25 g mouse was around 4 ml. For E. coli colonization experiments, the colonization was performed directly after weaning using the protocol described above, then SMX was mixed in the drinking water at 0.3 mg ml−1 after the colonization. This concentration was equivalent to 5 mg kg−1 body weight oral dose per day based on the assumption that the average daily consumption of water for an adult 25 g mouse was around 4 ml. At week-10, endoscopy was performed and clinical scores were used as a metric of colitis severity.
Data and Statistical analysis.
All graphical and statistical analysis were performed using GraphPad Prism 8. Statistical significance was calculated using a two-tailed unpaired t-test or a one-way ANOVA with Dunnett’s test. P values and the statistical parameters are indicated in the figure and figure legends, respectively. Agilent OpenLAB CDS ChemStation (Version C.01.04) and MassHunter Workstation Data Acquisition (Version B.05.01) were used for low-resolution UV/ESI-MS and high-resolution ESI-QTOF-MS data collection, respectively. The high-resolution mass spectrometry datasets were analyzed by MassHunter Qualitative Analysis (Version B.06.00). Conformational analyses of compounds were conducted using the Macromodel (version 2015–2, Schrödinger LLC), and Gaussian 09 package (Gaussian Inc) was used for Geometry optimization analysis of compounds. BD FACSDiva Software (V8.0.1) was used to collect raw data files from all flow cytometry experiments. All resultant data files were analyzed using FlowJo version 10 or newer. All experiments were conducted at least two times with reproducibility, and colipterin compounds were qualitatively screened via singleton BioMAP® phenotypic profiling.
Reporting Summary.
Further information on research design is available in the Nature Research Reporting Summary linked to this article.
Data availability
High-resolution ESI-QTOF-MS/MS data sets for colipterins are available from GNPS public MassIVE under accession number MSV000085621. CP3 analysis was facilitated by the applets provided by the Goodman Group (http://www-jmg.ch.cam.ac.uk/tools/nmr/CP3.html). Supplementary information and source data are provided with this letter. Additional data that support the findings of this study are available from the corresponding author upon reasonable request.
Code availability
No custom code was used.
Extended Data
Extended Data Fig. 1. UV-LC-MS detection of colipterins 1–8 produced by the probiotic E. coli Nissle1917.
a, Dose-responses of 1-8 from the probiotic E. coli Nissle1917 exposed to the sub-lethal levels of sulfamethoxazole (SMX). Intensity was determined by extracted ion counts (EICs) with m/z corresponding to each colipterins within a 10 ppm error window. High-resolution ESI-QTOF-LC-MS spectra of samples were analyzed using Phenomenex Kinetex C18 (100Å) 5 μm (250 × 4.6 mm) column with a gradient from 10%−100% aqueous acetonitrile in 0.1% formic acid over 30 min and with a 0.7 ml min−1 flow rate. Data were collected in biological triplicate, and representative EIC chromatograms are shown. b, UV-Vis spectra of colipterins 1-8 and pterin.
Extended Data Fig. 2. Production profiles of colipterins from the E. coli Nissle1917 culture.
a, Time-course analyses of major colipterins 1-4 from the E. coli Nissle1917 culture. Peaks were extracted using the EIC method corresponding to the m/z of 1-4 within a 10 ppm window The mean and s.d. (error bars) from three biological experiments (n = 3) are shown. Statistical significance (two-tailed unpaired t-test) is compared to 12 h; nd, not detected. b, Detection of col253 (3) and col267 (4) from the cell pellet extracts. SMX was supplemented into E. coli cultures with a sub-lethal concentration of 200 μg ml−1. Representative data from 24 h cultures are given from three biological replicates (n = 3). The mean and s.d. (error bars) are presented. A two-tailed unpaired t-test was used to calculate P values. Concentrations of 3 and 4 in cell pellet extracts without (and with SMX 200 μg ml−1) drug stress are as follows: 3, ~ 0.7 (~ 4.0) μM; 4, ~ 0.3 (~ 4.8) μM. c, Calibration curves for the colipterin quantification. Concentrations of 1-8 in culture without (and with SMX 400 μg ml−1) drug stress are as follows: 1, ~ 0.2 (~ 1.0) μM; 2, ~ 0.3 (~ 1.5) μM; 3, ~ 2.0 (~ 7.1) μM; 4, ~ 1.3 (~ 5.3) μM; 5, ~ 0.06 (~ 0.2) μM; 6, nd (~ 0.6) μM; 8, ~ 0.07 (~ 0.2) μM. 7 oxidized to 8 in the methanol solution during the acquisition of Q-TOF-MS experiments. Data are shown as the mean ± s.d., n=3 from 3 technical triplicates
Extended Data Fig. 3. Sulfamethoxazole (SMX) drug stress responses of colipterins 1–8 in the pathogenic E. coli LF82 and commensalistic E. coli BW25113.
Yellow area for optical density (OD600) measurement represents a range of sub-lethal concentrations of SMX against both E. coli LF82 (a) and BW25113 (b) strains. Peaks were extracted using EIC method corresponding to the m/z of colipterins 1-8 within a 10 ppm window. Red and black lines indicate Ctrl (Control, no SMX treatment) and SMX, respectively, in the MS chromatogram. Intensities in the bar graphs indicate integration value of EIC peak area. The mean and s.d. (error bars) from three biological experiments (n = 3) are shown. P values were analyzed by a two-tailed unpaired t-test; ns, not significant.
Extended Data Fig. 4. Functional characterization of FolX and FolM involved in colipterin production.
a, Folate and monapterin pathway are shown. b, Genetic complementation of folX and folM. Note that the production of colipterins is abolished in ΔfolX and ΔfolM strains. While the colipterins were not detected in both ΔfolX and ΔfolM carrying pBAD empty vector, complementation of folX and folM in pBAD into ΔfolX and ΔfolM strains, respectively, resulted in the recovery of major colipterins 3 and 4 production. 24 h E. coli cultures were analyzed by high-resolution ESI-QTOF-LC-MS using Phenomenex Kinetex C18 (100Å) 5 μm (250 × 4.6 mm) column with a gradient from 10%−100% aqueous acetonitrile in 0.1% formic acid over 30 min and with a 0.7 ml min−1 flow rate. Data are mean ± s.d. from three biological replicates (n = 3); nd, not detected.
Extended Data Fig. 5. UV-LC-MS profiles of biomimetic synthesis of colipterins in various conditions.
a, Differential production of 5 and 6 from the tetrahydropterin (THP)-phenylpyruvate (PP) coupling reaction. 5 and 6 were observed to be major products from the reaction in pH 5.0 and pH 6.0 in water, respectively. b, 3 (m/z 254.1042) and 4 (m/z 268.0834) from the reaction with THP in the presence of initially expected substrate, phenylacetic acid (PA), were not observed. c, Individual incubation of 3, 4, 5, and 6 in methanol at room temperature for 12 h was monitored by HPLC. While 4 was most stable, 5 and 6 were interconvertible and irreversibly degraded to 3 and 4 as anticipated. Image for 4 is not shown. d, 7 (~0.5 mg) in 2ml methanol was incubated at room temperature for 96 h and analyzed at five different time-points (6, 24, 48, 72, and 96 h). Auto-oxidation of 7 to 8 was observed over time. Image for the color change of 7 (colorless) to 8 (yellow) is shown in inset. e, Demonstration of the oxidation state of the pterin reactant. Independent reactions with pterin-PP and THP-PP were performed. While colipterins were not detected in reactions with pterin as expected, a reaction with THP in the presence of oxygen led to the colipterins. Representatively, 3 and 4 are shown. f, Reaction with THP under anaerobic conditions in vitro yielded either no detectable levels or basal levels of production. The reaction materials were analyzed by LC-MS with Phenomenex Kinetex C18 (100Å) 5 μm (250 × 4.6 mm) column with a gradient from 10%−100% acetonitrile in water containing 0.1% formic acid for 30 min and with a 0.7 ml min−1 flow rate. All reaction was analyzed by UV (254 and 310 nm) and MS using EIC method.
Extended Data Fig. 6. Pterin profile for the demonstration of DHP substrate origins.
a, Previously described recycling and side-chain cleavage mechanism of biopterin in mammalian cells. Pterin and 7,8-dihydroxanthopterin (XPH2) are known as break-down products of biopterin. Similarly, we observed pterin (m/z 164.0572) and XPH2 (m/z 182.0678) in the BH4 in vitro chemical reaction via hydrogenation of commercial BH2 followed by aerobic incubation in water, not in the BH2 solution. Besides, colipterins were detected in BH4 solution supplemented with PP. Representatively, col327 (6) (m/z 328.1046) is shown. b, Upregulation of pterin and XPH2 in E. coli Nissle1917 in response to the sub-lethal levels of SMX. Dose-responses of pterin and XPH2 in antifolate SMX stress. The mean and s.d. (error bars) from three biological experiments (n = 3) are shown. Statistical significance was accessed using a two-tailed unpaired t-test. MS intensity of EIC chromatogram was determined by ion counts corresponding to pterin ([M+H]+ m/z 164.0572) and XPH2 ([M+H]+ m/z 182.0678) within a 10 ppm error window. High-resolution ESI-QTOF-LC-MS spectra of samples were analyzed using Phenomenex Kinetex C18 (100Å) 5 μm (250 × 4.6 mm) column with a gradient from 10%−100% aqueous acetonitrile in 0.1% formic acid over 30 min and with a 0.7 ml min−1 flow rate.
Extended Data Fig. 7. E. coli BW25113 exposed to SMX drug stress reduce colitis severity in an IL-10-dependent manner.
a, Primary evaluation on the reduction of colitis severity in SMX-treated colitis mice (IL-10+/+ and IL-10−/−) that were colonized with E. coli (wild-type E. coli BW25113. and its folM mutant strain). CFUs, body weight, and clinical scores were obtained as the same procedure that we described in Fig 4. HR-ESI-QTOF-MS quantification of colipterins 3 and 6 in stool samples. P values were determined by a two-tailed unpaired t-test. Error bars represent mean ± s.e.m.; ns, not significant. b, Effects of SMX-treated E. coli (wild-type E. coli BW25113 and its folM mutant strain) in the IL-10−/− male and female mice that spontaneously develop colitis. IL-10+/+ male and female mice that no spontaneous colitis develop were used as control groups. E. coli was colonized at week-3. CFUs were measured at 3 weeks after colonization. Body weight was monitored weekly. SMX was mixed in the drinking water at 0.3 mg ml−1 after the E. coli colonization. At week-10, endoscopy was performed and clinical scores were used as a metric of colitis severity. Data are presented by mean ± s.e.m. (error bars)
Supplementary Material
Acknowledgements
This work was supported by the National Institutes of Health (1DP2-CA186575 and R00-GM097096 to J.M.C.), the Burroughs Wellcome Fund (1016720 to J.M.C.), the Camille & Henry Dreyfus Foundation (TC-17–011 to J.M.C.), the Howard Hughes Medical Institute (to R.A.F.), and the Basic Science Research Program through the National Research Foundation of Korea (NRF) funded by the Ministry of Education (2019R1A6A3A12033304 to C.S.K.). Z.W. was supported by the China Scholarship Council.
Footnotes
Competing interests
R.A.F. is a recipient of a grant from AbbVie Inc. R.W., T.P.W., and G.P. are employees of Merck Exploratory Science Center, Merck & Co., Inc., Kenilworth, NJ, USA. Employees may hold stocks and/or stock options in Merck & Co., Inc., Kenilworth, NJ, USA.
Additional information
Extended data is available for this study at http://doi.org/
Supplementary information is available for this study at http://doi.org/
Publisher’s note: Springer Nature remains neutral with regard to jurisdictional claims in published maps and institutional affiliations.
References
- 1.Blount ZD The unexhausted potential of E. coli. eLife 4, e05826 (2015). [DOI] [PMC free article] [PubMed] [Google Scholar]
- 2.Kaper JB, Nataro JP & Mobley HL Pathogenic Escherichia coli. Nat. Rev. Microbiol. 2, 123–140 (2004). [DOI] [PubMed] [Google Scholar]
- 3.Tenaillon O, Skurnik D, Picard B & Denamur E. The population genetics of commensal Escherichia coli. Nat. Rev. Microbiol. 8, 207–217 (2010). [DOI] [PubMed] [Google Scholar]
- 4.Wassenaar TM Insights from 100 years of research with probiotic E. coli. Eur. J. Microbiol. Immunol. 6, 147–161 (2016). [DOI] [PMC free article] [PubMed] [Google Scholar]
- 5.Mirsepasi-Lauridsen HC, Vallance BA, Krogfelt KA & Petersen AM Escherichia coli pathobionts associated with inflammatory bowel disease. Clin. Microbiol. Rev. 32, e00060–00018 (2019). [DOI] [PMC free article] [PubMed] [Google Scholar]
- 6.Smilack JD Trimethoprim-sulfamethoxazole. Mayo Clin. Proc. 74, 730–734 (1999). [DOI] [PubMed] [Google Scholar]
- 7.Stallmach A et al. Medical and surgical therapy of inflammatory bowel disease in the elderly - prospects and complications. J. Crohns. Colitis 5, 177–188 (2011). [DOI] [PubMed] [Google Scholar]
- 8.Haußmann C et al. Biosynthesis of pteridines in Escherichia coli. Structural and mechanistic similarity of dihydroneopterin-triphosphate epimerase and dihydroneopterin aldolase. J. Biol. Chem. 273, 17418–17424 (1998). [DOI] [PubMed] [Google Scholar]
- 9.Giladi M et al. FolM, a new chromosomally encoded dihydrofolate reductase in Escherichia coli. J. Bacteriol. 185, 7015–7018 (2003). [DOI] [PMC free article] [PubMed] [Google Scholar]
- 10.Pribat A et al. FolX and FolM are essential for tetrahydromonapterin synthesis in Escherichia coli and Pseudomonas aeruginosa. J. Bacteriol. 192, 475–482 (2010). [DOI] [PMC free article] [PubMed] [Google Scholar]
- 11.Gelfand DH & Steinberg RA Escherichia coli mutants deficient in the aspartate and aromatic amino acid aminotransferases. J. Bacteriol. 130, 429–440 (1977). [DOI] [PMC free article] [PubMed] [Google Scholar]
- 12.Lobritz MA et al. Antibiotic efficacy is linked to bacterial cellular respiration. Proc. Natl. Acad. Sci. U. S. A. 112, 8173–8180 (2015). [DOI] [PMC free article] [PubMed] [Google Scholar]
- 13.Belenky P et al. Bactericidal antibiotics induce toxic metabolic perturbations that lead to cellular damage. Cell. Rep. 13, 968–980 (2015). [DOI] [PMC free article] [PubMed] [Google Scholar]
- 14.Mitosch K, Rieckh G & Bollenbach T. Noisy response to antibiotic stress predicts subsequent single-cell survival in an acidic environment. Cell. Syst. 4, 393–403 (2017). [DOI] [PubMed] [Google Scholar]
- 15.Zampieri M, Zimmermann M, Claassen M & Sauer U. Nontargeted metabolomics reveals the multilevel response to antibiotic perturbations. Cell. Rep. 19, 1214–1228 (2017). [DOI] [PubMed] [Google Scholar]
- 16.Zampieri M et al. Metabolic constraints on the evolution of antibiotic resistance. Mol. Syst. Biol. 13, 917 (2017). [DOI] [PMC free article] [PubMed] [Google Scholar]
- 17.Zampieri M et al. High-throughput metabolomic analysis predicts mode of action of uncharacterized antimicrobial compounds. Sci. Transl. Med. 10, eaal3973 (2018). [DOI] [PMC free article] [PubMed] [Google Scholar]
- 18.Zampieri M et al. Regulatory mechanisms underlying coordination of amino acid and glucose catabolism in Escherichia coli. Nat. Commun. 10, 3354 (2019). [DOI] [PMC free article] [PubMed] [Google Scholar]
- 19.Anuforom O, Wallace GR & Piddock LV The immune response and antibacterial therapy. Med. Microbiol. Immunol. 204, 151–159 (2015). [DOI] [PubMed] [Google Scholar]
- 20.Rubin BK & Tamaoki J Antibiotics as anti-inflammatory and immunomodulatory agents. Springer Science & Business Media: New York, 2005. [Google Scholar]
- 21.Cho I et al. Antibiotics in early life alter the murine colonic microbiome and adiposity. Nature 488, 621–626 (2012). [DOI] [PMC free article] [PubMed] [Google Scholar]
- 22.Schneditz G et al. Enterotoxicity of a nonribosomal peptide causes antibiotic-associated colitis. Proc. Natl. Acad. Sci. U. S. A. 111, 13181–13186 (2014). [DOI] [PMC free article] [PubMed] [Google Scholar]
- 23.Lopez CA, Kingsbury DD, Velazquez EM & Bäumler AJ Collateral damage: microbiota-derived metabolites and immune function in the antibiotic era. Cell Host Microbe 16, 156–163 (2014). [DOI] [PMC free article] [PubMed] [Google Scholar]
- 24.Becattini S, Taur Y & Pamer EG Antibiotic-induced changes in the intestinal microbiota and disease. Trends Mol. Med. 22, 458–478 (2016). [DOI] [PMC free article] [PubMed] [Google Scholar]
- 25.Dornisch E et al. Biosynthesis of the enterotoxic pyrrolobenzodiazepine natural product tilivalline. Angew. Chem. Int. Ed. 56, 14753–14757 (2017). [DOI] [PMC free article] [PubMed] [Google Scholar]
- 26.Routy B et al. Gut microbiome influences efficacy of PD-1-based immunotherapy against epithelial tumors. Science 359, 91–97 (2018). [DOI] [PubMed] [Google Scholar]
- 27.Yang JH et al. Antibiotic-induced changes to the host metabolic environment inhibit drug efficacy and alter immune function. Cell Host Microbe 22, 757–765 e753 (2017). [DOI] [PMC free article] [PubMed] [Google Scholar]
- 28.Gopinath S et al. Topical application of aminoglycoside antibiotics enhances host resistance to viral infections in a microbiota-independent manner. Nat. Microbiol. 3, 611–621 (2018). [DOI] [PMC free article] [PubMed] [Google Scholar]
- 29.Park HB et al. Bacterial autoimmune drug metabolism transforms an immunomodulator into structurally and functionally divergent antibiotics. Angew. Chem. Int. Ed. 59, 2–12 (2020). [DOI] [PMC free article] [PubMed] [Google Scholar]
- 30.Oh J, Patel J, Park HB & Crawford JM β-Lactam biotransformations activate innate immunity. J. Org. Chem. 83, 7173–7179 (2018). [DOI] [PubMed] [Google Scholar]
- 31.Wormser GP, Keusch GT & Heel RC Co-trimoxazole (trimethoprim-sulfamethoxazole): an updated review of its antibacterial activity and clinical efficacy. Drugs 24, 459–518 (1982). [DOI] [PubMed] [Google Scholar]
- 32.Baker DJ et al. The binding of trimethoprim to bacterial dihydrofolate reductase. FEBS Lett. 126, 49–52 (1981). [DOI] [PubMed] [Google Scholar]
- 33.Achari A et al. Crystal structure of the anti-bacterial sulfonamide drug target dihydropteroate synthase. Nat. Struct. Biol. 4, 490–497 (1997). [DOI] [PubMed] [Google Scholar]
- 34.Okada BK & Seyedsayamdost MR Antibiotic dialogues: induction of silent biosynthetic gene clusters by exogenous small molecules. FEMS Microbiol. Rev. 41, 19–33 (2017). [DOI] [PMC free article] [PubMed] [Google Scholar]
- 35.Kim CS et al. Characterization of autoinducer-3 atructure and biosynthesis in E. coli. ACS Cent. Sci. 6, 197–206 (2020). [DOI] [PMC free article] [PubMed] [Google Scholar]
- 36.Nougayrède JP et al. Escherichia coli induces DNA double-strand breaks in eukaryotic cells. Science 313, 848–851 (2006). [DOI] [PubMed] [Google Scholar]
- 37.Xue M et al. Structure elucidation of colibactin and its DNA cross-links. Science eaax2685 (2019). [DOI] [PMC free article] [PubMed] [Google Scholar]
- 38.Arthur JC et al. Intestinal inflammation targets cancer-inducing activity of the microbiota. Science 338, 120–123 (2012). [DOI] [PMC free article] [PubMed] [Google Scholar]
- 39.Arthur JC et al. Microbial genomic analysis reveals the essential role of inflammation in bacteria-induced colorectal cancer. Nat. Commun. 5, 4724 (2014). [DOI] [PMC free article] [PubMed] [Google Scholar]
- 40.Cougnoux A et al. Small-molecule inhibitors prevent the genotoxic and protumoural effects induced by colibactin-producing bacteria. Gut 65, 278–285 (2016). [DOI] [PubMed] [Google Scholar]
- 41.Tomkovich S et al. Locoregional effects of microbiota in a preclinical model of colon carcinogenesis. Cancer Res. 77, 2620–2632 (2017). [DOI] [PMC free article] [PubMed] [Google Scholar]
- 42.Dejea CM et al. Patients with familial adenomatous polyposis harbor colonic biofilms containing tumorigenic bacteria. Science 359, 592–597 (2018). [DOI] [PMC free article] [PubMed] [Google Scholar]
- 43.Wiegand I, Hilpert K & Hancock RE Agar and broth dilution methods to determine the minimal inhibitory concentration (MIC) of antimicrobial substances. Nat. Protoc. 3, 163–175 (2008). [DOI] [PubMed] [Google Scholar]
- 44.Thomas AH et al. Fluorescence of pterin, 6-formylpterin, 6-carboxypterin and folic acid in aqueous solution: pH effects. Photochem. Photobiol. Sci. 1, 421–426 (2002). [DOI] [PubMed] [Google Scholar]
- 45.Kim Y, Kang Y & Baek D. Oxidative synthesis of benzoylpteridines from benzylpteridines by potassium penmanganate. Bull. Korean Chem. Soc. 22, 141–144 (2001). [Google Scholar]
- 46.Bermingham A & Derrick JP The folic acid biosynthesis pathway in bacteria: evaluation of potential for antibacterial drug discovery. Bioessays 24, 637–648 (2002). [DOI] [PubMed] [Google Scholar]
- 47.de Crécy-Lagard V et al. Comparative genomics of bacterial and plant folate synthesis and salvage: predictions and validations. BMC Genomics 8, 245 (2007). [DOI] [PMC free article] [PubMed] [Google Scholar]
- 48.Feirer N et al. A pterin-dependent signaling pathway regulates a dual-function diguanylate cyclase-phosphodiesterase controlling surface attachment in Agrobacterium tumefaciens. mBio 6, e00156 (2015). [DOI] [PMC free article] [PubMed] [Google Scholar]
- 49.Ahn C, Byun J & Yim J. Purification, cloning, and functional expression of dihydroneopterin triphosphate 2’-epimerase from Escherichia coli. J. Biol. Chem. 272, 15323–15328 (1997). [DOI] [PubMed] [Google Scholar]
- 50.Shan Y et al. Genetic basis of persister tolerance to aminoglycosides in Escherichia coli. mBio 6, e00078–00015 (2015). [DOI] [PMC free article] [PubMed] [Google Scholar]
- 51.Mathieu A et al. Discovery and function of a general core hormetic stress response in E. coli induced by sublethal concentrations of antibiotics. Cell. Rep. 17, 46–57 (2016). [DOI] [PubMed] [Google Scholar]
- 52.Kim CS et al. Cellular stress upregulates indole signaling metabolites in Escherichia coli. Cell Chem. Biol. 27, 1–10 (2020). [DOI] [PMC free article] [PubMed] [Google Scholar]
- 53.Perez CE, Park HB & Crawford JM Functional characterization of a condensation domain that links nonribosomal peptide and pteridine biosynthetic machineries in Photorhabdus luminescens. Biochemistry 57, 354–361 (2018). [DOI] [PubMed] [Google Scholar]
- 54.Brown GM The biosynthesis of pteridines Advances in Enzymology and Related Areas of Molecular Biology. John Wiley & Sons, 1971, pp 35–77. [DOI] [PubMed] [Google Scholar]
- 55.Nichol CA et al. Biosynthesis of tetrahydrobiopterin by de novo and salvage pathways in adrenal medulla extracts, mammalian cell cultures, and rat brain in vivo. Proc. Natl. Acad. Sci. U. S. A. 80, 1546–1550 (1983). [DOI] [PMC free article] [PubMed] [Google Scholar]
- 56.Groehn V, Fröhlich L, Schmidt HHHW & Pfleiderer W. Pteridines, Part CXI, Pteridine-based photoaffinity probes for nitric oxide synthase and aromatic amino acid hydroxylases. Helv. Chim. Acta 83, 2738–2750 (2000). [Google Scholar]
- 57.Crabtree MJ et al. Critical role for tetrahydrobiopterin recycling by dihydrofolate reductase in regulation of endothelial nitric-oxide synthase coupling: relative importance of the de novo biopterin synthesis versus salvage pathways. J. Biol. Chem. 284, 28128–28136 (2009). [DOI] [PMC free article] [PubMed] [Google Scholar]
- 58.Kirsch M et al. The autoxidation of tetrahydrobiopterin revisited. Proof of superoxide formation from reaction of tetrahydrobiopterin with molecular oxygen. J. Biol. Chem. 278, 24481–24490 (2003). [DOI] [PubMed] [Google Scholar]
- 59.Oettl K & Reibnegger G. Pteridines as inhibitors of xanthine oxidase: structural requirements. Biochim. Biophys. Acta 1430, 387–395 (1999). [DOI] [PubMed] [Google Scholar]
- 60.Vásquez-Vivar J. Tetrahydrobiopterin, superoxide, and vascular dysfunction. Free. Radic. Biol. Med. 47, 1108–1119 (2009). [DOI] [PMC free article] [PubMed] [Google Scholar]
- 61.Kojima S, Icho T, Mori H & Arai T. Enhancing potency of neopterin toward B-16 melanoma cell damage induced by UV-A irradiation and its possible application for skin tumor treatment. Anticancer. Res. 15, 1975–1980 (1995). [PubMed] [Google Scholar]
- 62.Becker C, Fantini MC & Neurath MF High resolution colonoscopy in live mice. Nat. Protoc. 1, 2900–2904 (2006). [DOI] [PubMed] [Google Scholar]
- 63.Dorrestein PC, Mazmanian SK & Knight R. Finding the missing links among metabolites, microbes, and the host. Immunity 40, 824–832 (2014). [DOI] [PMC free article] [PubMed] [Google Scholar]
- 64.Kruis W et al. Maintaining remission of ulcerative colitis with the probiotic Escherichia coli Nissle 1917 is as effective as with standard mesalazine. Gut 53, 1617–1623 (2004). [DOI] [PMC free article] [PubMed] [Google Scholar]
- 65.Palmela C et al. Adherent-invasive Escherichia coli in inflammatory bowel disease. Gut 67, 574–587 (2018). [DOI] [PubMed] [Google Scholar]
- 66.Rembacken BJ et al. Non-pathogenic Escherichia coli versus mesalazine for the treatment of ulcerative colitis: a randomised trial. Lancet 354, 635–639 (1999). [DOI] [PubMed] [Google Scholar]
- 67.Smith SG & Goodman JM Assigning the stereochemistry of pairs of diastereoisomers using GIAO NMR shift calculation. J. Org. Chem. 74, 4597–4607 (2009). [DOI] [PubMed] [Google Scholar]
- 68.Kamanaka M et al. Expression of interleukin-10 in intestinal lymphocytes detected by an interleukin-10 reporter knockin tiger mouse. Immunity 25, 941–952 (2006). [DOI] [PubMed] [Google Scholar]
Associated Data
This section collects any data citations, data availability statements, or supplementary materials included in this article.
Supplementary Materials
Data Availability Statement
High-resolution ESI-QTOF-MS/MS data sets for colipterins are available from GNPS public MassIVE under accession number MSV000085621. CP3 analysis was facilitated by the applets provided by the Goodman Group (http://www-jmg.ch.cam.ac.uk/tools/nmr/CP3.html). Supplementary information and source data are provided with this letter. Additional data that support the findings of this study are available from the corresponding author upon reasonable request.