

Abstract
Ventromedial hypothalamic nucleus (VMN) control of glucostasis is estradiol-dependent. Estradiol (E-2) regulation of VMN reactivity to hypoglycemia may involve amplified signal volume due to altered aromatase expression. Here, high-resolution micropunch dissection tools for isolation of segmental VMN tissue were used alongside Design of Experiments-refined uHPLC-electrospray ionization-mass spectrometry (LC-ESI-MS) methodology to investigate the premise that effects of acute and/or recurring hypoglycemia on VMN E-2 content are sex-dimorphic. Relationships among multiple independent mass spectrometric operational variables were assessed by Central Composite Design (CCD) to amplify E-2 chromatogram area. Combinations of spectrometric temperature and gas pressure variable combinations were screened by Akaike Information Criterion correction modeling. A Fibonacci Sequence design using CCD minimum and maximal variable limits produced a small-run model that replicated maximal response from CCD. E-2 chromatographic response was further enhanced by optimization of solid phase extraction and instrument source and collision-induced dissociation voltages. In male rats, acute and chronic hypoglycemia respectively elevated or diminished E-2 concentrations relative to baseline in both rostral and caudal VMN. However, females exhibited regional variability in tissue E-2 profiles during acute (increased, rostral VMN; no change, caudal VMN) and recurring (no change, rostral VMN; increased, caudal VMN) hypoglycemia. Outcomes demonstrate requisite LC-ESI-MS sensitivity for E-2 quantification in small-volume brain tissue samples acquired with high-neuroanatomical specificity. Current methodology will facilitate efforts to investigate physiological consequences of VMN rostro-caudal segment-specific acclimation of E-2 profiles to recurring hypoglycemia, including effects on gluco-regulatory function, in each sex.
Keywords: 2-Fluoro-1-methylpyridinium p-toluenesulfonate, solid phase extraction, central composite design, Akaike information criterion correction, ventromedial hypothalamic nucleus, insulin-induced hypoglycemia
1. Introduction:
Glucose is the primary metabolic substrate for energy production in the brain, where it is utilized at a rate that is vastly disproportionate to organ weight. Insulin-induced hypoglycemia (IIH) is an unalleviated complication of obligatory strict glycemic control in type I diabetes mellitus [1]. Neuroglucopenia poses a threat of neural dysfunction and injury as diminished energy yield impairs vital nerve cell functions. Diabetes patients typically experience repetitive iatrogenic IIH (RIIH), which is a precipitating factor in mal-adaptive neural desensitization to hypoglycemia that manifests as hypoglycemia unawareness and glucose counter-regulatory collapse [2]. Clinical and experimental studies document attenuated counter-regulation in RIIH-exposed males, but not females [3]. The molecular and cellular mechanisms that underlie sex-contingent counter-regulatory acclimation to RIIH remain unclear.
The ventromedial hypothalamic nucleus (VMN) is a key component of the dedicated neural gluco-regulatory circuitry [4,5]. Estradiol (E-2) acts on the VMN to control glucostasis as intra-VMN delivery of this hormone alters glycemic profiles in insulin-injected ovariectomized (OVX) female rats [6]. VMN metabolic transmitter [gluco-stimulatory nitric oxide (NO), gluco-inhibitory γ-aminobutyric acid (GABA)] marker protein responses to IIH are altered by intracerebroventricular estrogen receptor-alpha 1,3-Bis(4-hydroxyphenyl)-4-methyl-5-[4-(2-piperidinylethoxy)phenol]-1H-pyrazole dihydrochloride or estrogen receptor-beta 4-[2-phenyl-5,7-bis(trifluoromethyl)py-razolo[1,5-a]pyrimidin-3-yl]phenol antagonist administration [7]. E-2 controls NO and GABA neuron receptivity to the neurochemical norepinephrine, which conveys information from hindbrain metabolic sensors to the VMN [8]. E-2 likely directly regulates VMN nitrergic and GABAergic neurons as these cells express ERα, ERβ, and the transmembrane G protein-coupled estrogen receptor GPER/GPR30 [8]. The enzyme aromatase converts the androgenic hormone testosterone to E-2, and is highly expressed in the VMN [9–11]. Evidence from our laboratory that VMN aromatase protein expression acclimates to RIIH differently in each sex [Briski, personal communication] supports the possibility that sex-specific VMN gluco-regulatory habituation to RIIH may involve, in part, adaptive changes in local E-2 signal volume that are unique to each sex.
Mass spectrometry enables selective measurement of steroid analytes of closely related structure [12], but analytical sensitivity may proscribe quantification of E-2 in small-volume tissue samples [13]. The present project utilized high-resolution brain tissue dissection tools and uHPLC-electrospray ionization-mass spectrometric (LC-ESI-MS) methodology in conjunction with a characterized experimental RIIH model that reproduces insulin delivery route, frequency of administration, and duration of action in the clinical setting [14] to evaluate RIIH effects on VMN tissue E-2 concentrations in each sex. After single or serial insulin dosing of male and female rats, VMN tissue was obtained by micropunch dissection over specific rostro-caudal levels characterized by sex-dimorphic aromatase expression acclimation to RIIH. A critical project goal was to achieve requisite analytical sensitivity for measurement of E-2 in VMN substructure tissue samples. An experimental design strategy [15] was used here to optimize critical E-2 derivatization and mass spectrometric gas pressure and temperature parameters that impact E-2 chromatogram area. Response surface methodology (RSM) statistical techniques are useful for assessment of relationships between multiple input variables and a dependent response (output) variable [16,17]. Central composite design (CCD) is an effective tool for construction of a second-order polynomial for the response variable in RSM [18]. CCD has documented efficacy to augment LC-MS sensitivity and detection [19–21]. Here, CCD involving performance of DOE-recommended experiments and validation of predicted responses by Design of Experiments (DOE)-generated quadratic equation was used, as described [22] to characterize critical mass spectrometric operational variable levels that maximize analytical sensitivity to E-2. In light of new evidence that CCD can enhance chemical synthesis schemes [23], current research sought to apply CCD to optimize 2-fluoro-1-methylpyridinium-p-toluenesulfonate (FMP-TS) - E-2 derivative signal intensity.
2. Materials and Methods:
2.1. Development and characterization of CCD-enhanced LS-ESI-MS estradiol analysis methodology:
2.1.1. Reagents and supplies:
LC-MS grade-acetonitrile (ACN), methanol (MeOH), triethylamine (TEA), and high-purity formic acid (FA) were obtained from VWR Intl. (Radnor, PA, US). 17β-estradiol (E-2) was purchased from MP Biomedicals, LLC (Irvine, CA, US). Estrone (99+%) (E-1), Ethinylestradiol (98%) (EE), and Estriol (97%) (E-3) were acquired from Acros Organics/Fisher Scientific USA (Pittsburgh, PA, US). 2-Fluoro-1-methylpyridinium-p-toluenesulfonate (>98.0%) (FMP-TS) was purchased from TCI (Portland, OR, US). Small volume (350μL) flat bottom borosilicate glass inserts (6 × 31 mm; AQ Brand) were obtained from Microsolv Technology Corporation (Leland, NC, US). Oasis MCX 3cc/60mg was acquired from Waters Corporation (Milford, MA, US). Design Expert Version 12.0.6.0, 64-bit, S/No. 5606-0315-4331-1011 was purchased from Stat-Ease (Minneapolis, MN, US).
2.1.2. Pre-column FMP-TS derivatization of estrogens:
Derivatization procedures were adapted with modification from Faqehi et al. [24]. Briefly, separate stock solutions of E-1, E-2, E-3, and EE (1 mg/mL) in ACN were prepared in 1.5 mL plastic microcentrifuge tubes; working solutions of each estrogen were freshly prepared before use. After addition of 100 μL of a fresh stock solution of 50 μL FMP-TS (5 mg/mL) in 1.0% TEA to standards or tissue extract, mixtures were vortexed, heated at 40°C for 15 min, then treated with 50 μL FA (0.1%, v/v) in Water: MeOH, (65:35, v/v) to quench derivatization reactions. Clear supernatants containing estrogen derivatives FMP-E-1, FMP-E-2, or FMPE-3 (Figure 1, Supplementary Figure 1) were transferred to 350 μL inserts in 2 mL Surestop vials positioned in an auto-sampler tray.
Figure 1.
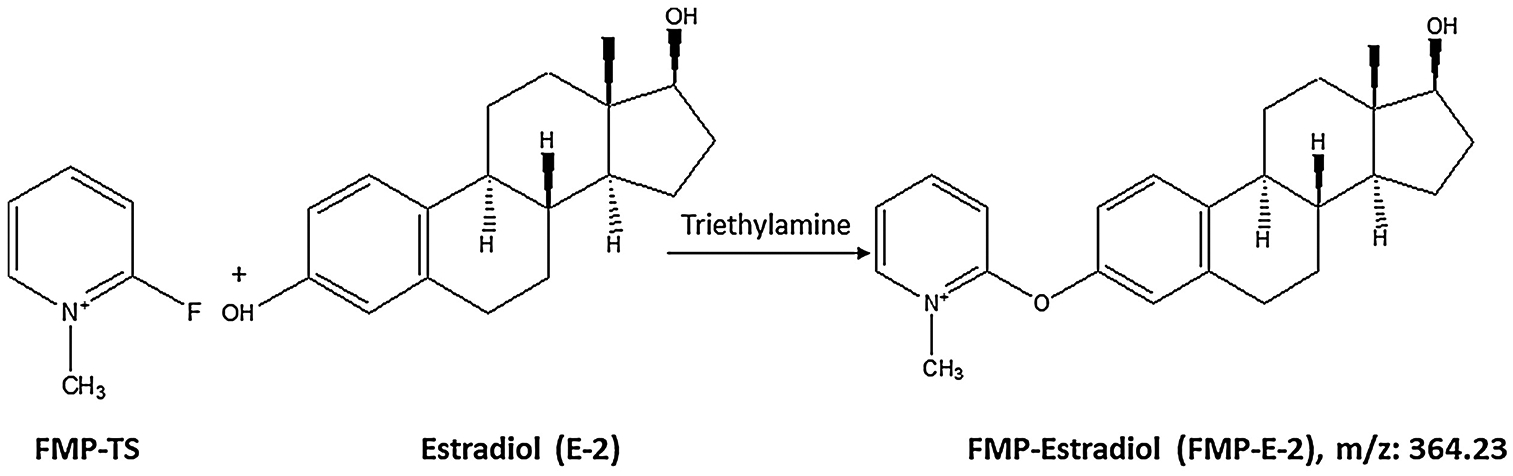
Estradiol (E-2) reacts with 2-fluoro-1-methylpyridinium-p-toluenesulfonate (FMP-TS) in the presence triethylamine (TEA) to form FMP-E-2 derivative measured at m/z 364.2.
2.1.3. LC-ESI-MS Instrumentation:
An assembled chromatography system [UHPLC Vanquish binary pump (prod. no. VFP10A01/121345; ThermoFisherScientific, Waltham, MA), Vanquish auto-sampler (VFA10A02/121345; ThermoFisherSci.) 10 °C, and temperature-controlled Vanquish UHPLC+ column compartment (/121345; ThermoFisherSci.)] 30 °C was coupled to a single quad ISQ EC mass spectrometer (ISQECLC/121345; ThermoFisherSci.) ThermoScientific™ Dionex™ Chromeleon™ 7 Chromatography Data System software (7200.0300/121345; ThermoFisherSci.) was used for mass spectrometric analysis. A Kinetex 2.6 μm PS C18 100Å (100 mm L × 2.1 mm ID) P/No. 00D-4780-AN column (Phenomenex, Torrance, CA) was used with a 0.2 mL/min flow rate and 0.04–1 μL injection volume. Comparison of column lengths of 10 versus 5 cm revealed significant improvement in FMP-E-2 chromatographic response (Figure 2A). The auto-sampler needle was washed (10 sec) with 10% (v/v) methanol. Mobile phases A and B consisted of 1.77 mM FA and ACN, respectively; isocratic phase flow of ACN (75%), and FA (25%) was maintained for 4 min. Optimum settings for source voltage at constant collision induced dissociation (CID) 27V and for CID at constant ionization voltage (5000V) were verified.
Figure 2.
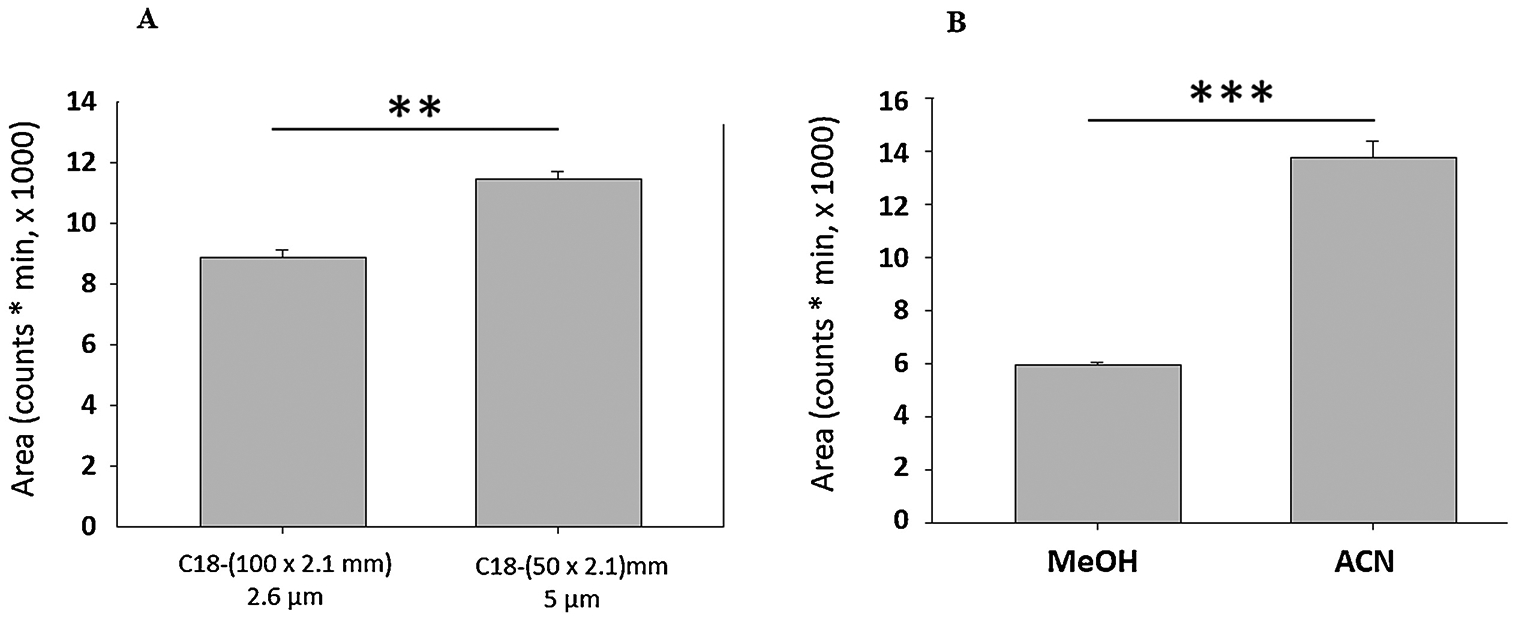
A) Comparison of a Kinetex® 2.6 μm PS C18 (100 × 2.1 mm) 00D-4780-AN column with particle diameter 2.6 μm with a similar C18 column Thermo Fisher Scientific 25005–052130 dimensions (50 × 2.1 mm) with particle diameter 5 μm showed that the latter significantly improved FMP-E-2 response (Two-tailed unpaired t-test, p=0.0018, n=3), indicating that the smaller length column coupled with doubled particle diameter enhances FMP-E-2 signal. B) Comparison of solid phase extraction of FMP-E-2 with terminal extraction solvent MeOH vs ACN showed that ACN significantly improved yield (p=0.0001, one tailed t-test, n=3).
2.1.4. CCD optimization of FMP-E-2 mass spectrometric chromatographic area:
Minimum and maximum limits of critical mass spectrometric parameters, e.g. sheath gas pressure (SGP, low =22 psig and high = 50 psig), auxiliary gas pressure (AGP, low = 5 psig and high = 10 psig), sweep gas pressure (SWGP, low = 0.7 psig and high = 1.3 psig), ion transfer tube temperature (ITT, low = 215 ° C and high = 266 ° C), and vaporizer temperature (VT, low = 220 ° C and high = 320 ° C) were evaluated by CCD using Design Expert 12.0 software to generate random experiments for LC-ESI-MS analysis of FMP-E-1, FMP-E-2, FMP-E-3, and FMP-EE. The required number of experiments to be run was determined as a function of variable number as follows: N=2v + 2v + N0, where v and N0 indicate number of variables (v = 5) and center points (N0 = 8), respectively. The 50 required experiments were run in a random manner to minimize the effect of uncontrolled variables (Table 1). CCD is referenced here as an out-of-the box design, as this was used to assess each variable at multiple levels, including experimental runs above or below stated minimum and maximum values [SGP: minimum = 2.7022/maximum = 69.2978; AGP: minimum = 2/maximum = 13.446; SWGP: minimum = 0.28648/maximum = 1.71352; ITT: minimum = 179.85/maximum = 301.15; VT: minimum = 151.079/maximum = 388.921] to identify spectrometric area responses at individual variable extremes. Derivative standard sample responses were measured at m/z 362.2 (FMP-E-1), 364.2 (FMP-E-2), 380.2 (FMP-E-3), and 388.2 (FMP-EE) in selected ion monitoring (SIM) mode. Mean replicate responses for all FMP-E-1, FMP-E-2, FMP-E-3, and FMP-EE runs (Supplementary Table 1) were transformed to plot percent relative area for each derivative in individual experimental runs (Supplementary Figure 2) and mean percent relative combined area of all derivatives per run (Supplementary Figure 3). The normal percent probability plot of actual residuals showed few outliers (Figure 4A). Transformation of residuals to square root and natural logarithms (Figure 4B and 4C) resulted in alignment with the plot line; the one extreme outlier exception in the natural log normal plot (Figure 4C) was discarded (Figure 4D–F). The natural log of normal probability plots showed that residuals were closest to the diagonal line (Figure 4F) when compared to non-transformed and square root plots (Figure 4D–E).
Table 1.
Minimum and maximum limits of critical mass spectrometry operational variables were used by Design Expert to generate CCD runs for LC-ESI-MS analysis of estrogen derivatives, for the purpose of determining FMP-E-2 chromatogram response.
| #Run | SGP | AGP | SWGP1 | VT | ITT2 | #Run | SGP | AGP | SWGP1 | VT | ITT2 |
|---|---|---|---|---|---|---|---|---|---|---|---|
| 1 | 50 | 10 | 1.3 | 320 | 215 | 26 | 50 | 5 | 0.7 | 320 | 266 |
| 2 | 22 | 10 | 0.7 | 320 | 215 | 27 | 22 | 10 | 0.7 | 220 | 266 |
| 3 | 50 | 10 | 0.7 | 220 | 266 | 28 | 50 | 10 | 0.7 | 320 | 215 |
| 4 | 36 | 7.5 | 1 | 270 | 240.5 | 29 | 50 | 5 | 1.3 | 320 | 266 |
| 5 | 36 | 7.5 | 1 | 270 | 240.5 | 30 | 50 | 10 | 1.3 | 320 | 266 |
| 6 | 50 | 10 | 0.7 | 220 | 215 | 31 | 22 | 5 | 0.7 | 220 | 215 |
| 7 | 22 | 5 | 0.7 | 220 | 266 | 32 | 22 | 10 | 0.7 | 320 | 266 |
| 8 | 50 | 5 | 0.7 | 220 | 266 | 33 | 22 | 5 | 1.3 | 220 | 266 |
| 9 | 22 | 5 | 1.3 | 320 | 215 | 34 | 50 | 10 | 0.7 | 320 | 266 |
| 10 | 22 | 5 | 0.7 | 320 | 266 | 35 | 50 | 5 | 1.3 | 220 | 215 |
| 11 | 22 | 10 | 1.3 | 320 | 215 | 36 | 50 | 10 | 1.3 | 220 | 266 |
| 12 | 36 | 7.5 | 1 | 270 | 240.5 | 37 | 36 | 7.5 | 1 | 388.92 | 240.5 |
| 13 | 36 | 7.5 | 1 | 270 | 301.15 | 38 | 36 | 7.5 | 1 | 270 | 240.5 |
| 14 | 36 | 7.5 | 1 | 270 | 240.5 | 39 | 36 | 1.553961 | 1 | 270 | 240.5 |
| 15 | 50 | 5 | 0.7 | 320 | 215 | 40 | 22 | 10 | 0.7 | 220 | 215 |
| 16 | 36 | 7.5 | 1 | 270 | 240.5 | 41 | 50 | 5 | 0.7 | 220 | 215 |
| 17 | 36 | 7.5 | 1.71 | 270 | 240.5 | 42 | 36 | 7.5 | 1 | 270 | 240.5 |
| 18 | 36 | 7.5 | 1 | 270 | 179.85 | 43 | 36 | 7.5 | 0.28 | 270 | 240.5 |
| 19 | 22 | 5 | 1.3 | 320 | 266 | 44 | 36 | 7.5 | 1 | 151.07 | 240.5 |
| 20 | 50 | 10 | 1.3 | 220 | 215 | 45 | 22 | 5 | 0.7 | 320 | 215 |
| 21 | 22 | 5 | 1.3 | 220 | 215 | 46 | 69.29 | 7.5 | 1 | 270 | 240.5 |
| 22 | 22 | 10 | 1.3 | 320 | 266 | 47 | 50 | 5 | 1.3 | 320 | 215 |
| 23 | 50 | 5 | 1.3 | 220 | 266 | 48 | 22 | 10 | 1.3 | 220 | 215 |
| 24 | 2.7 | 7.5 | 1 | 270 | 240.5 | 49 | 36 | 7.5 | 1 | 270 | 240.5 |
| 25 | 36 | 13.46 | 1 | 270 | 240.5 | 50 | 22 | 10 | 1.3 | 220 | 266 |
input value 2 instead 1.55396 was recommended by Chromeleon Console.
integer values considered for the analyses.
Figure 4.
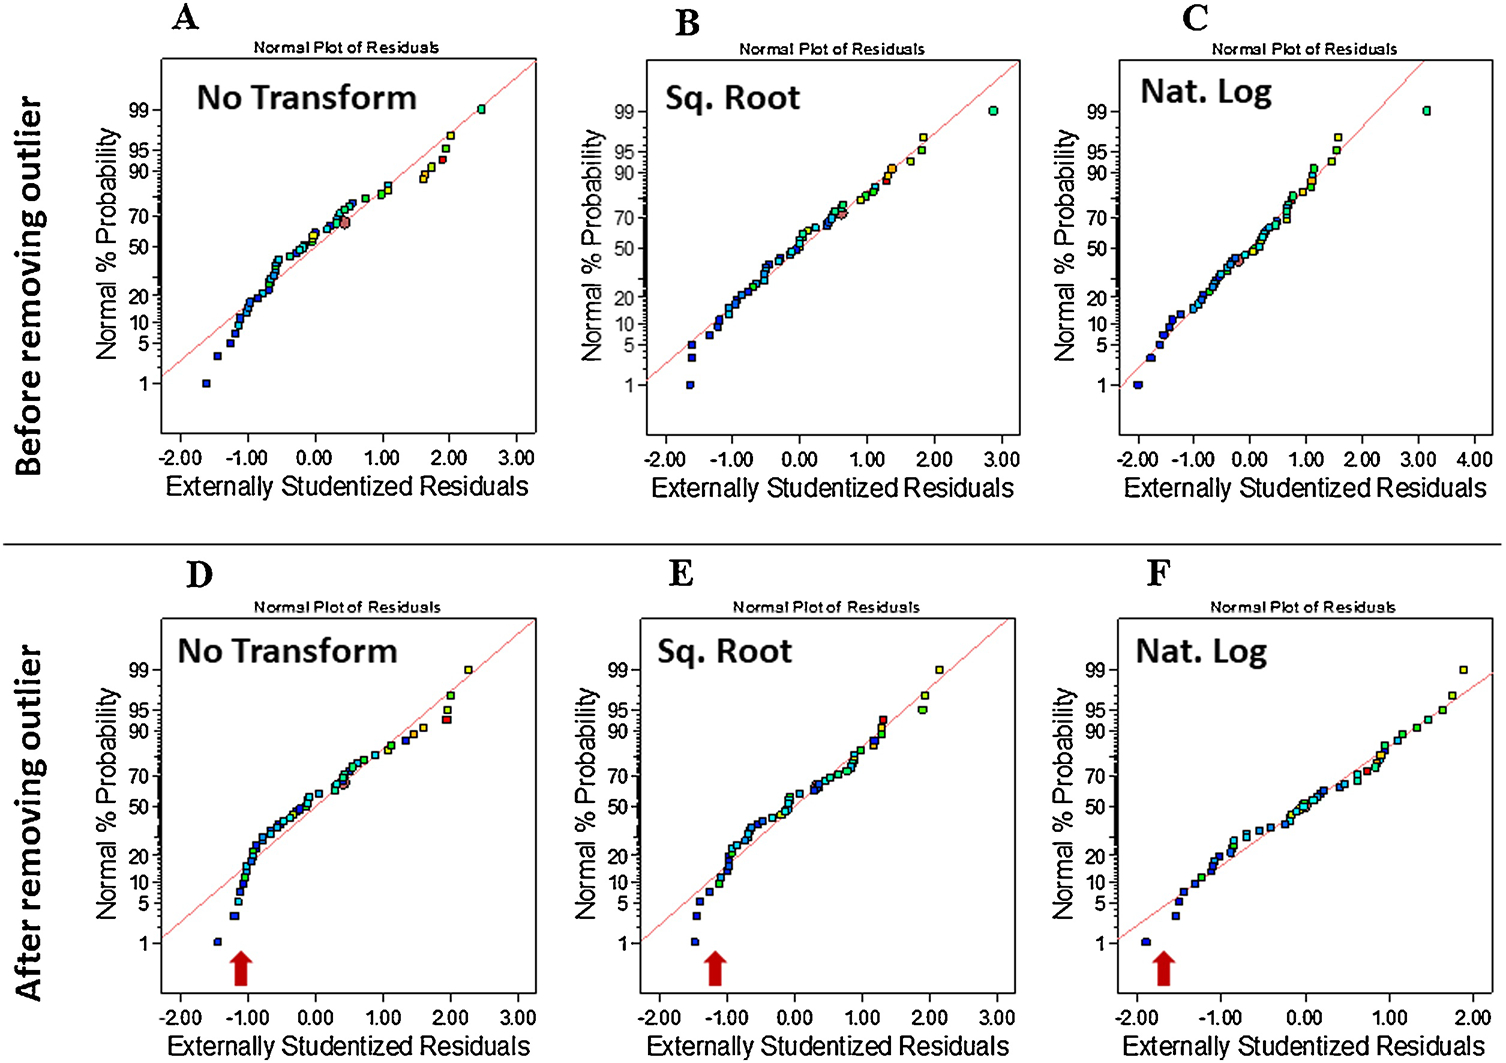
A) Normal percent probability plotting of actual residuals revealed few outliers; B) Square root transformation aligned most residuals, leaving most close to the line; C) Natural log transform aligned most residuals, leaving a single outlier; D) After deletion of the aforementioned outlier and re-plotting of residuals, nonaligned residuals remained; E-F) Natural log, but not square root transformation elicited the alignment by normal distribution.
Fit Summary and Statistics analyses (Table 3) provide guiding information for selection of a correct starting point for the final model. The model(s) exhibiting highest Predicted R-squared (R2) and Adjusted R2 values are derived from the Fit Summary table; typically, a single model will exhibit both values. Here, the program-selected higher-order model (2FI) showed a Predicted R2 value (0.1959) that is in reasonable agreement with Adjusted R2 value (0.3930), with a difference of less than 0.2. Adeq Precision provides a measure of signal-to-noise ratio. As a ratio exceeding 4 is desirable, the ratio here of 8.015 indicates an adequate model signal. Sequential Model Sum of Squares [Type I] showed the highest order polynomial where the 2FI vs Linear was significant and the model is not aliased (Table 4). Main effects, interaction effects, and quadratic effects were optimized and evaluated in the current design. Analysis of variance (ANOVA) yielded a model F-value of 3.07, indicating significance at a 95% confidence level. As shown in Table 5, significant model terms are identified as follows: E, AB, AD, BE, CD, and CE. A Lack of Fit F-value of 0.4213 and associated p value of 0.9488 imply that Lack of Fit is not significant relative to the pure error. Plots of residual distributions against predicted or experimental runs showed that no observations exceeded maximum limits (Figure 5A–B). Cook’s distance is useful to identify residual outliers; as shown in Figure 5C, no observations exceeded the maximum limit of 0.97, indicating no impactful observation in the design. Natural log transformation of residuals produced a vertical line that lies within confidence limits (λ = near zero) of a Box-Cox plot (Figure 5D). Depiction of actual responses versus predicted response values showed that data points were split by the 45-degree line and that all responses were scattered in two regions (Figure 5E). Leverage is a numerical value between 0 and 1 that identifies potential for a design point to influence model fit. Here, analysis of leverage vs runs revealed that residuals did not exceed a value of 0.6 and present in two unique lanes (Figure 5F). As shown in Figure 5G, no responses exhibited a Difference in Fits (DFFITS) value that fell outside limits.
Table 3.
Fit Summary and Statistics: 2FI model was suggested for the optimization of experiments. The Predicted R2 of 0.1959 is in reasonable agreement with the Adjusted R2 of 0.3930; Adeq Precision of signal to noise ratio equals 8.015 (>=4 is recommended).
| Source | Sequential p-value | Lack of Fit p-value | Adjusted R2 | Predicted R2 | R2 | PRESS | Recommendation |
|---|---|---|---|---|---|---|---|
| Linear | 0.1881 | 0.6856 | 0.0563 | −0.095 | 0.1546 | 33.73 | |
| 2FI | 0.0039 | 0.9488 | 0.393 | 0.1959 | 0.5827 | 24.77 | Suggested |
| Quadratic | 0.3693 | 0.9601 | 0.4044 | 0.0528 | 0.6526 | 29.18 | |
| Cubic | 0.7058 | 0.9773 | 0.3123 | −0.3563 | 0.8138 | 41.78 | Aliased |
| Mean ± Std. Dev. = 3.23 ± 0.6242; C.V. % = 19.34; R2 = 0.5827, Adeq Precision = 8.0154 | |||||||
Mean ± Std. Dev. = 3.23 ± 0.6242; C.V. % = 19.34; R2 = 0.5827, Adeq Precision = 8.0154
Table 4.
Sequential Model Sum of Squares [Type I] indicated that the highest order polynomial where the 2FI vs Linear was significant and the model is not aliased.
| Source | Sum of Squares | df | Mean Square | F-value | p-value | Recommendation |
|---|---|---|---|---|---|---|
| Mean vs Total | 510.18 | 1 | 510.18 | |||
| Linear vs Mean | 4.76 | 5 | 0.9527 | 1.57 | 0.1881 | |
| 2FI vs Linear | 13.19 | 10 | 1.32 | 3.38 | 0.0039 | Suggested |
| Quadratic vs 2FI | 2.15 | 5 | 0.4306 | 1.13 | 0.3693 | |
| Cubic vs Quadratic | 4.97 | 15 | 0.331 | 0.75 | 0.7058 | Aliased |
| Residual | 5.74 | 13 | 0.4414 | |||
| Total | 540.99 | 49 | 11.04 |
Table 5.
ANOVA for 2FI model data indicated that the model is significant, lack of fit is not-significant as recommended by the software. Furthermore, E, AB, AD, BE, CD, CE are significant model terms.
| Source | Sum of Squares | df | Mean Square | F-value | p-value | |
|---|---|---|---|---|---|---|
| Model | 17.95 | 15 | 1.2 | 3.07 | 0.0035 | significant |
| A-SGP | 0.4211 | 1 | 0.4211 | 1.08 | 0.306 | |
| B-AGP | 0.0307 | 1 | 0.0307 | 0.0789 | 0.7805 | |
| C-SWGP | 0.0487 | 1 | 0.0487 | 0.125 | 0.726 | |
| D-VT | 1.13 | 1 | 1.13 | 2.89 | 0.0983 | |
| E-ITT | 3.64 | 1 | 3.64 | 9.35 | 0.0044 | |
| AB | 2.59 | 1 | 2.59 | 6.65 | 0.0146 | |
| AC | 0.004 | 1 | 0.004 | 0.0102 | 0.9202 | |
| AD | 3 | 1 | 3 | 7.71 | 0.009 | |
| AE | 0.1537 | 1 | 0.1537 | 0.3945 | 0.5343 | |
| BC | 0.2613 | 1 | 0.2613 | 0.6706 | 0.4187 | |
| BD | 1.12 | 1 | 1.12 | 2.88 | 0.0991 | |
| BE | 4.12 | 1 | 4.12 | 10.58 | 0.0026 | |
| CD | 2.23 | 1 | 2.23 | 5.73 | 0.0225 | |
| CE | 2.61 | 1 | 2.61 | 6.71 | 0.0142 | |
| DE | 0.0724 | 1 | 0.0724 | 0.1859 | 0.6692 | |
| Residual | 12.86 | 33 | 0.3896 | |||
| Lack of Fit | 7.84 | 26 | 0.3017 | 0.4213 | 0.9488 | not significant |
| Pure Error | 5.01 | 7 | 0.7161 | |||
| Cor Total | 30.81 | 48 |
Figure 5.
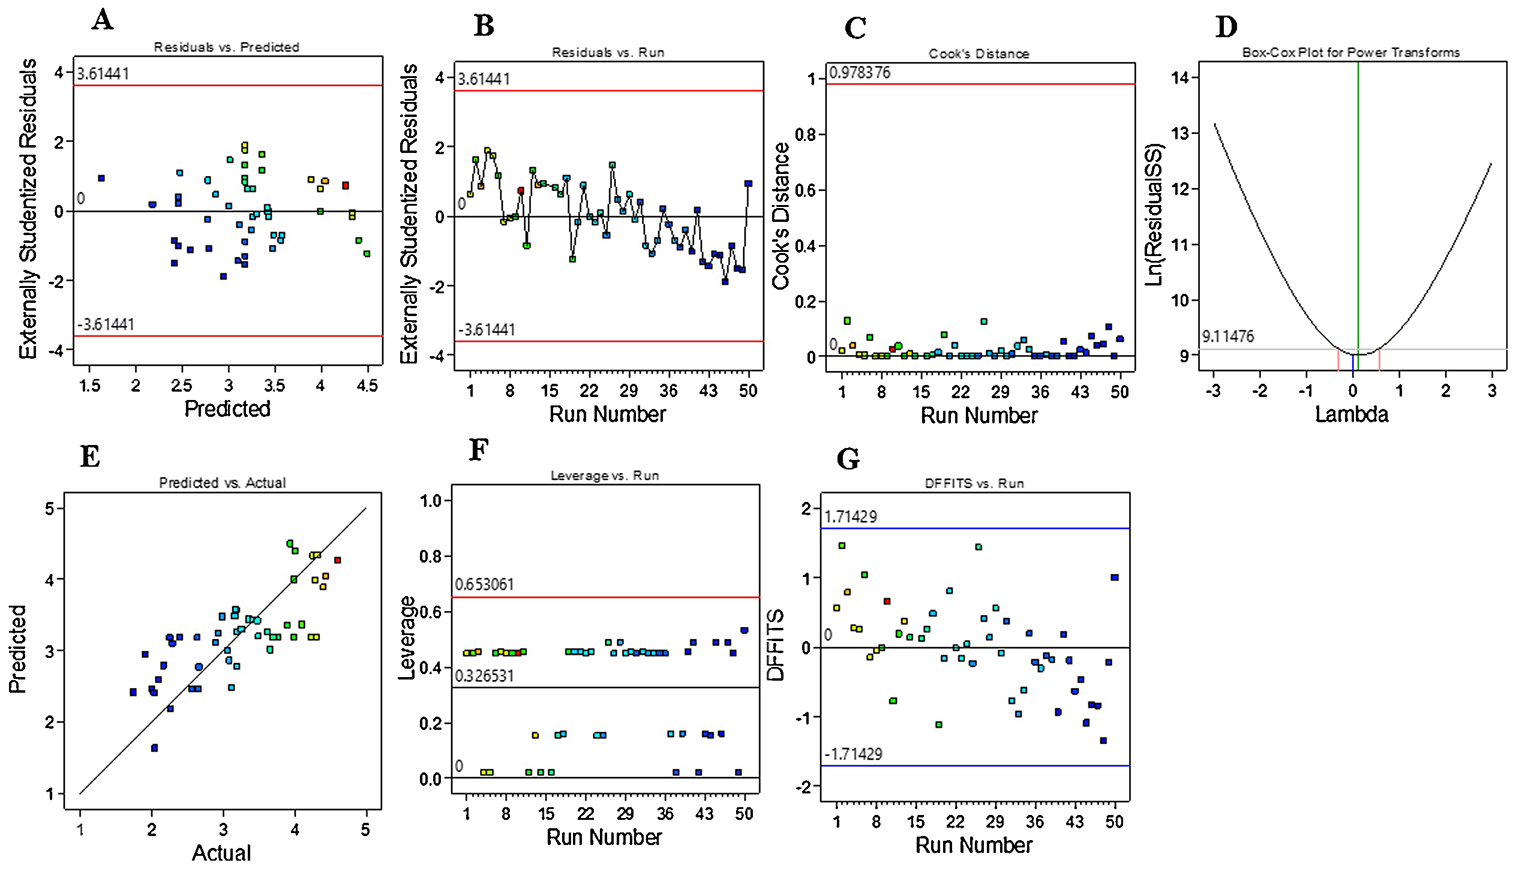
A-B) Plotting of externally studentized residuals vs predicted or run values showed that most the responses were confined within limits; C) Cook’s distance did not reveal any influential observations; D) Natural log of residual sums of squares versus power transformation yielded a vertical line (λ at near zero) within the limits; E) Plot of predicted versus actual values indicated that residuals were scattered along the slanted line; F) There were no observations that have high leverage to influence the model; G) The plot of DFFITS versus Run showed that observations were within limits.
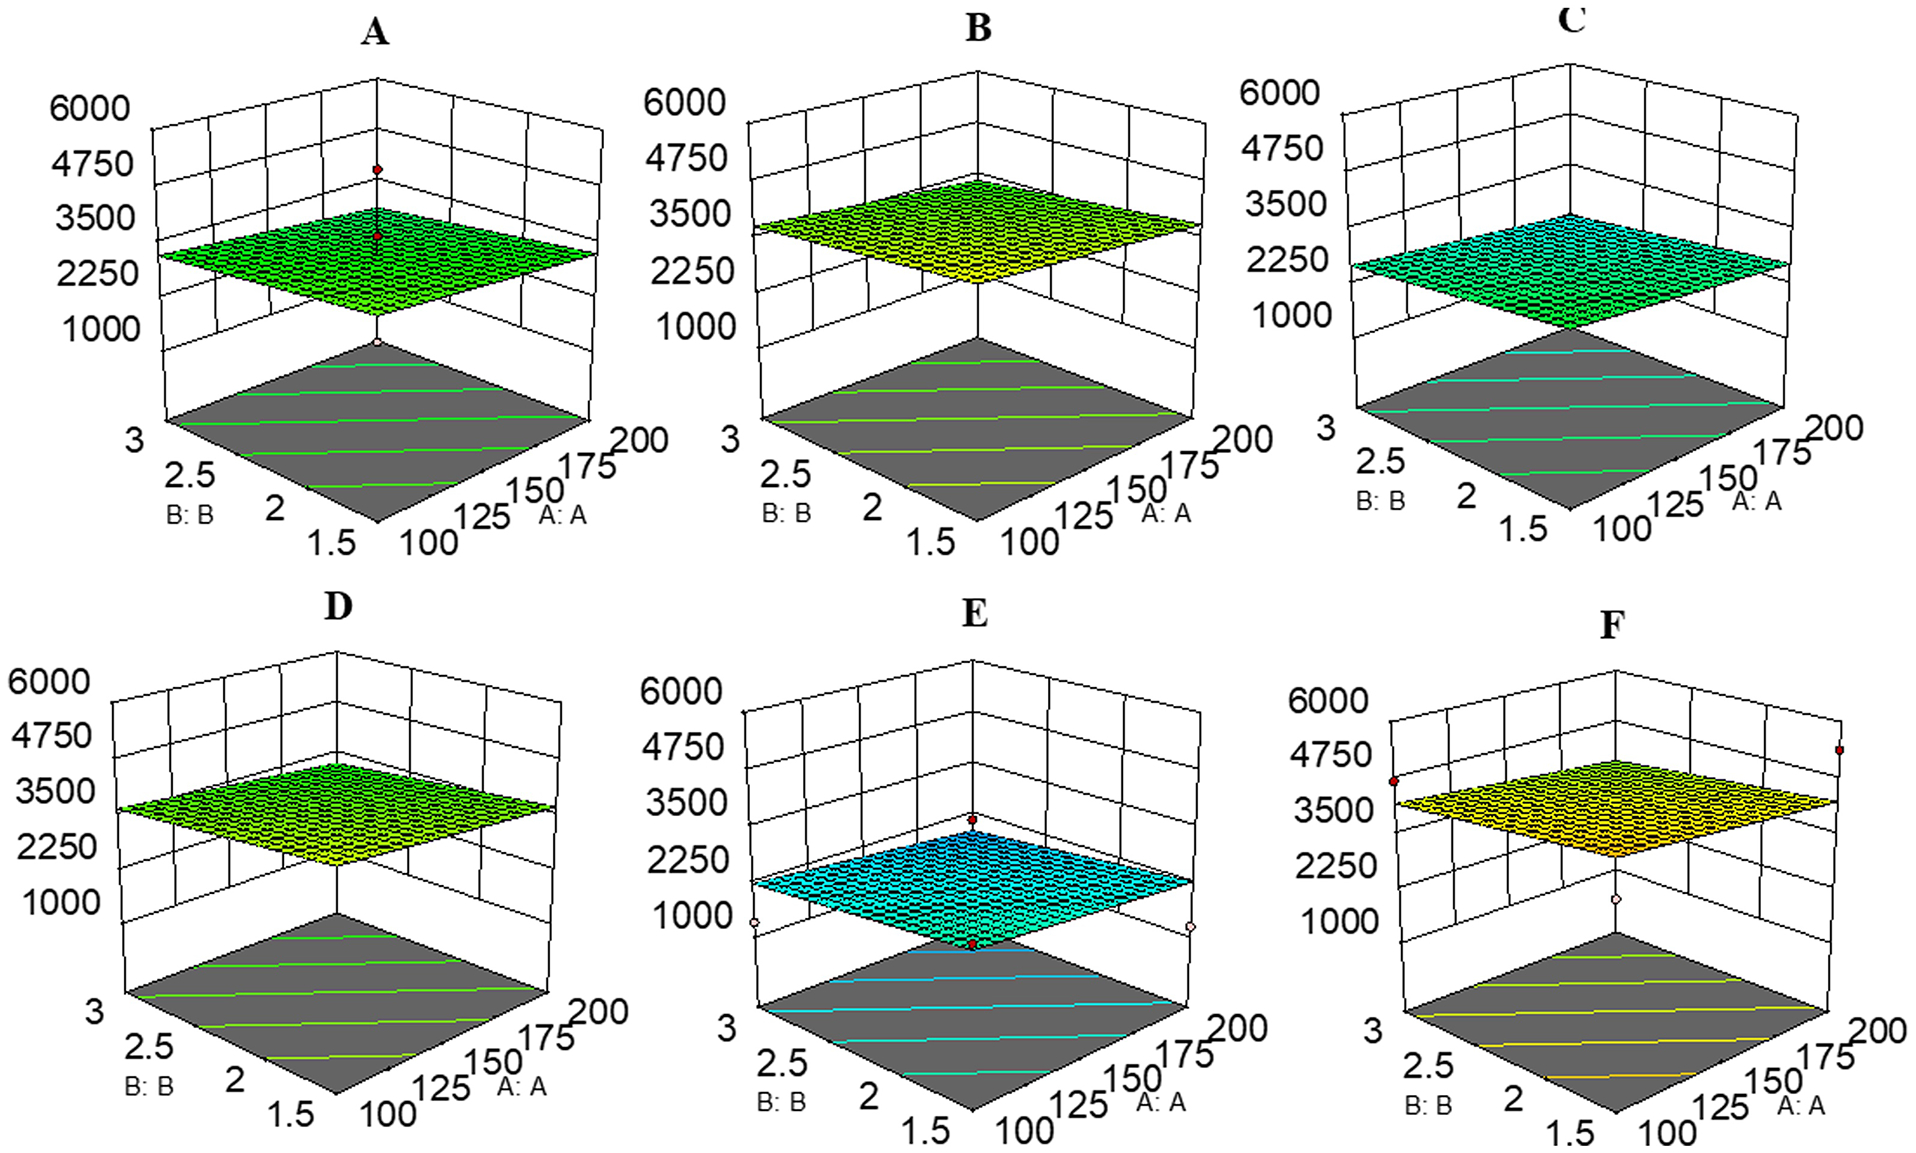
Figure 6 illustrates most relevant fitted response surfaces for the design, illustrating response (%RR) versus SGP, AGP, SWGP, VT, and ITT. Plot curvatures depict variable interactions. Low and high SGP (low = 22 psig; high = 50 psig) and AGP (low = 5 psig; high = 10 psig) levels were selected with various levels of SWGP, VT, and ITT to generate surface plots. Plots revealed that SGP (low) and AGP (high) yielded %RR ≈25%, ≈13%, ≈50%, ≈29%, ≈22%, and ≈100% in the surface plot Figure 6A–6F, respectively; SGP (low) and AGP (low) yielded %RR ≈37%, ≈26%, ≈54%, ≈24%, ≈58%, and ≈72% in the in the surface plot Figure 6A–6F, respectively; SGP (high) and AGP (low) yielded %RR ≈22%, ≈29%, ≈17%, ≈13%, ≈39%, ≈19% in the in the surface plot Figure 6A–6F, respectively; SGP (high) and AGP (high) yielded %RR ≈36%, ≈35%, ≈38%, ≈36%, ≈36%, ≈66% in the in the surface plot Figure 6A–6F, respectively; Surface plot Figure 6A–E utilizes medium level of SWGP=1, and 6F has high level SWGP=1.3; Surface plot Figure 6A–C utilizes medium level of ITT=246; 6D and 6F has low ITT=215; 6E has high ITT=266; Surface plot Figure 6A, 6D, 6E utilizes medium levels of VT=270; 6B has low VT=220; 6C and 6F has high VT=320.
Figure 6.
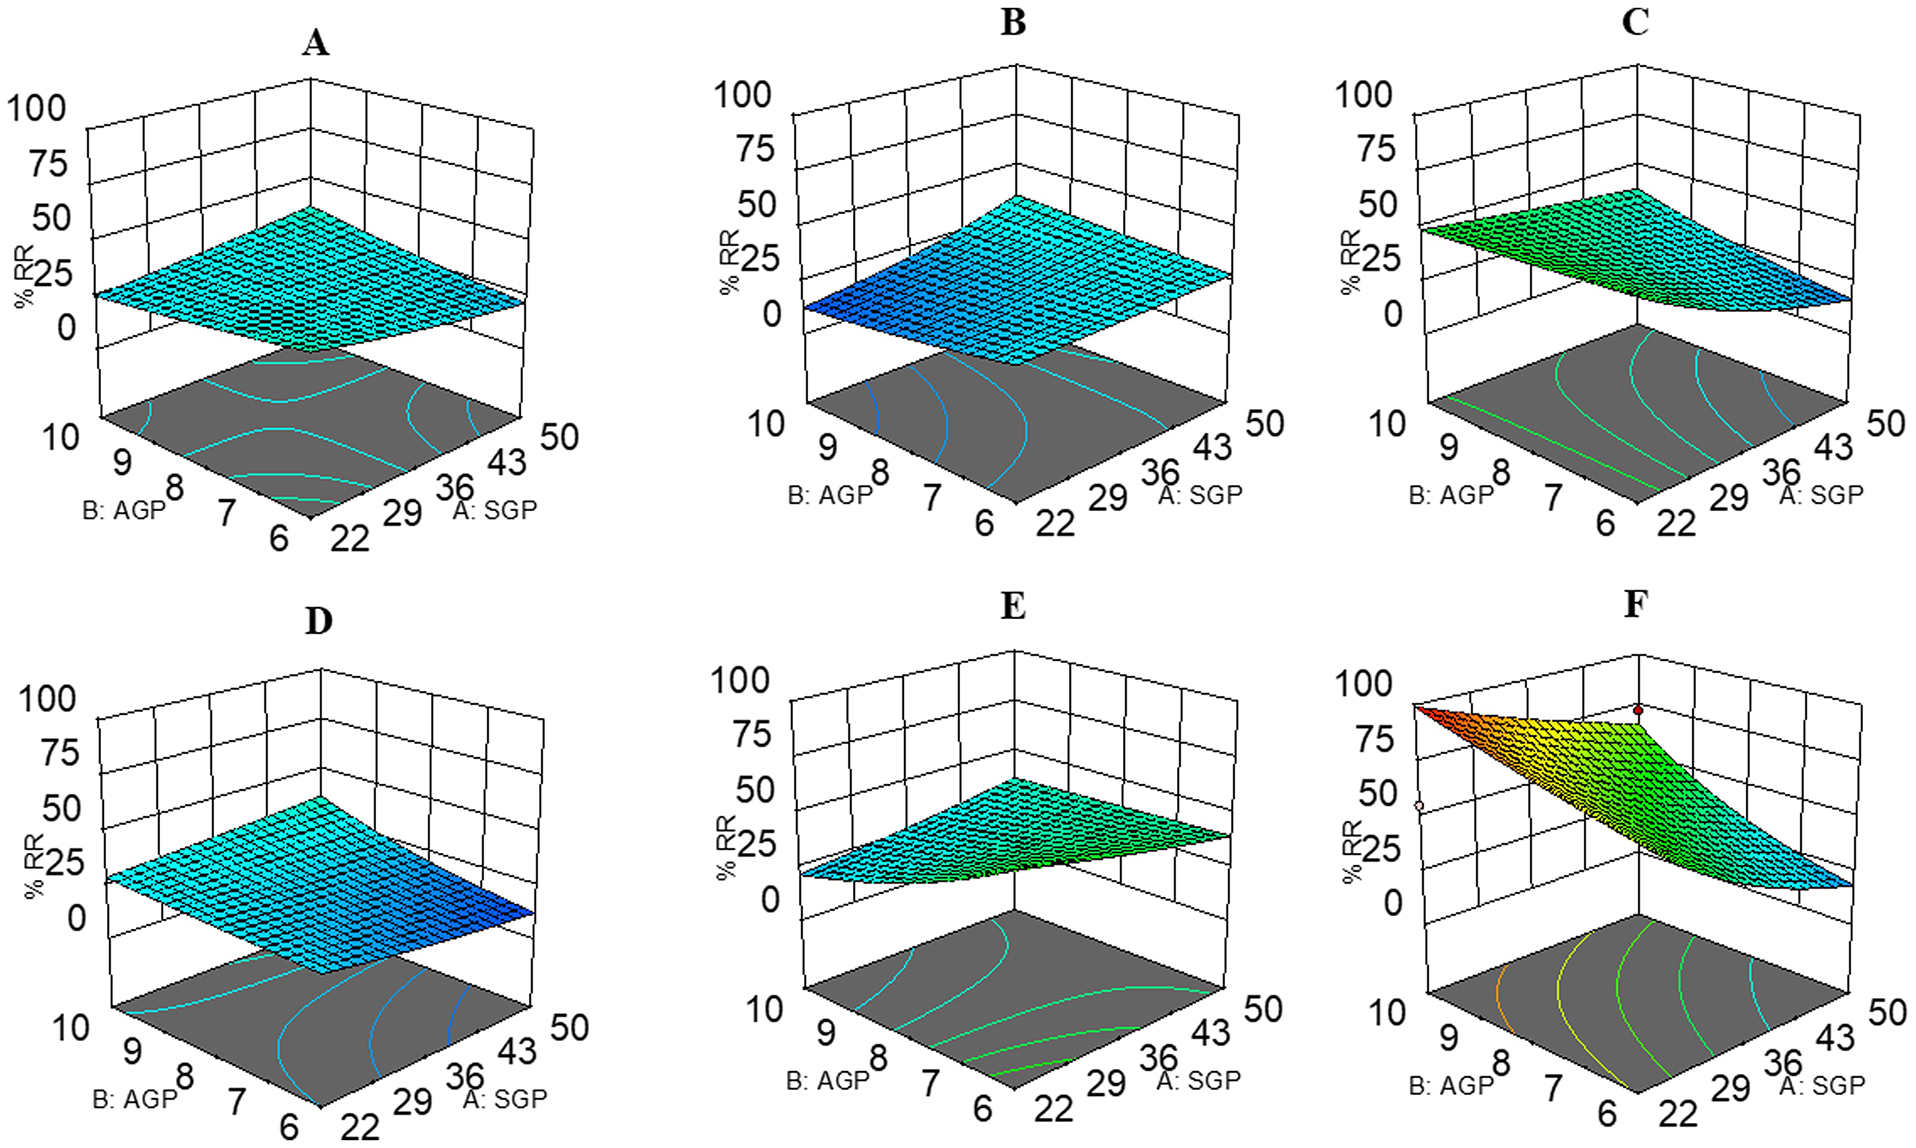
Response surface plots for the 25 central composite designs for mass spectrometric analysis: SGP (low =22; high = 50 psig), AGP (low = 5; high = 10 psig) were in common association with A) SWGP = 1, VT = 270, and ITT = 246; B) SWGP = 1, VT = 220, and ITT = 246; C) SWGP = 1, VT = 320, and ITT = 246; D) SWGP = 1, VT = 270, and ITT = 215; E) SWGP = 1, VT = 270, and ITT = 266; F) SWGP = 1.3, VT = 320, and ITT = 15.
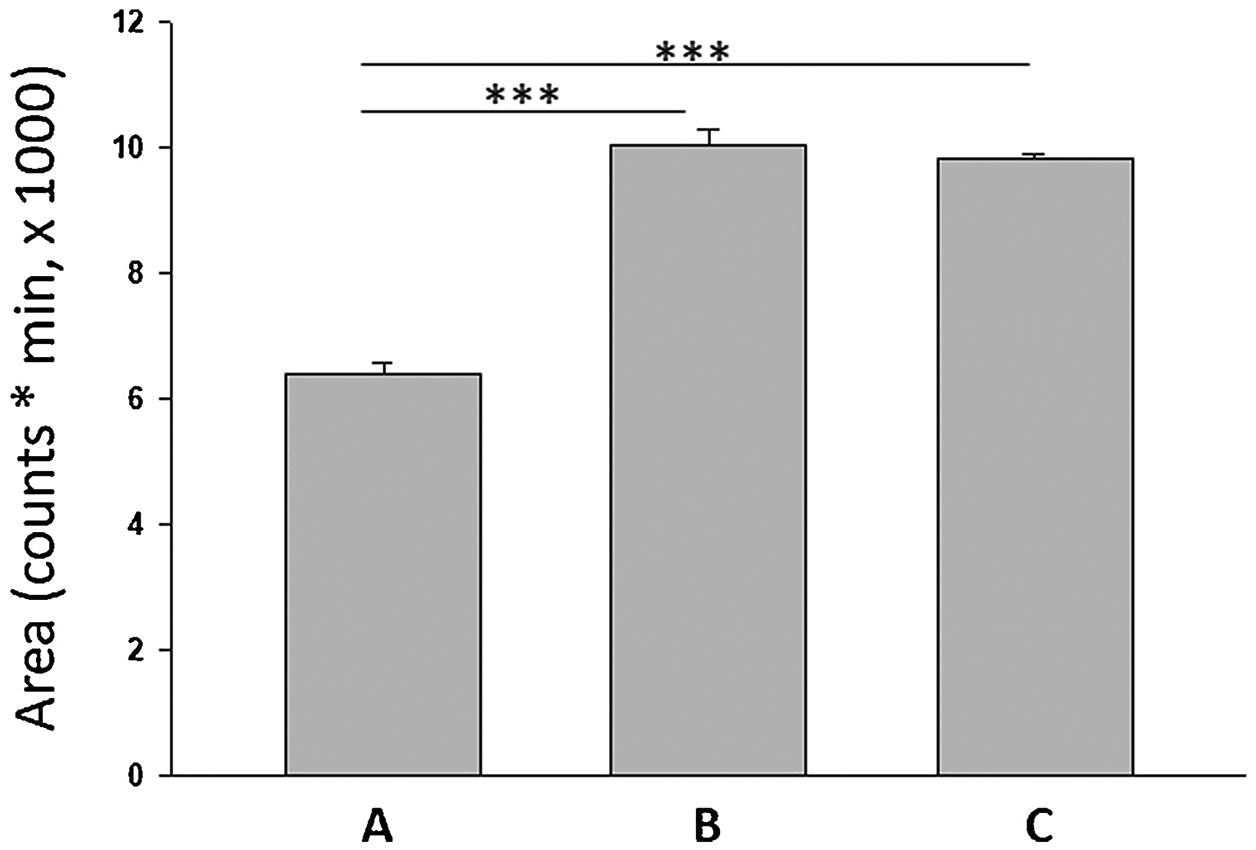
Design Expert software recommended one hundred solutions involving varying mass spectrometric parameter levels having desirability between 1.0 and 0.607 (Supplementary Table 2). Mass spectrometric responses were compared using three different parameter combinations (Figure 7), including: A) SGP = 22, AGP = 5, SWGP = 0.7, VT = 320, ITT = 266 (Table 1, #10); B) SGP = 50, AGP = 10, SWGP = 1.3, VT = 320, ITT = 266 (Suppl. Table 2; #1); and C) SGP = 22, AGP = 10, SWGP = 1.3, VT = 320, ITT = 215 (Figure 6F). Statistical comparison of these combinations did not reveal significance differences; thus, experiments using Table 1, #10 parameters were performed as the mean response exceeding that of other combinations. Fibonacci numbers or Fibonacci sequence (FS), e.g. 0, 1, 1, 2, 3, 5, 8, 13, 21, 34, 55, 89, …., is among the most popular numbers or sequence in mathematics and has gained recent widespread use for design analysis in multiple scientific disciplines [25–27], after first appearing in Pisano’s Liber Abaci in 1202 [28]. A FS design [29] using CCD minimum and maximal variable limits was implemented to corroborate optimum mass spectrometric variable level combinations identified by the latter design approach.
Figure 7.
Comparison of mass spectrometric responses of three different methods: I. SGP = 22, AGP = 5, SWGP = 0.7, VT = 320, ITT = 266 (belongs to #10 of Table 1); II. SGP = 50, AGP = 10, SWGP = 1.3, VT = 320, ITT = 266 (belongs to #1 of Supp Table 2); III. SGP = 22, AGP = 10, SWGP = 1.3, VT = 320, ITT = 215 (belongs to Response Surface plot Figure 6F). ANOVA test outcome: no significance (p=0.1662, n=3, F=2.45)
R-program software (https://www.r-project.org/) was used to generate Akaike Information Criterion (AIC)- and AIC-correction-for-small-sample-size (AICc)-based models for combinations of five or fewer critical mass spectrometric parameter variables [30,31]. Table 2 shows that the least AICc value (798.81) was associated with the model for interaction of sheath gas pressure (SGP), auxiliary gas pressure (AGP), sweep gas pressure (SWGP), ion transfer tube temperature (ITT), and vaporizer temperature (VT).
Table 2.
Akaike Information Criterion analysis of combinations (all five variables versus fewer) of AGP, ITT, SGP, SWGP, and VT was done using R-program software. Lowest AIC value identifies the most suitable model for variable interaction effects on chromatographic response.
| Models | AIC | AICc |
|---|---|---|
| AGP, ITT, SGP, SWGP, VT | 849 | 798.8 |
| AGP, ITT, SGP, SWGP | 849 | 802.1 |
| AGP, ITT, SWGP, VT | 847.2 | 803.1 |
| AGP, SGP, SWGP, VT | 847.2 | 805.9 |
| AGP, ITT, SWGP | 847.2 | 806.5 |
2.1.5. CCD improvement of FMP-E-2 signal:
E-2 derivatization was optimized using CCD to assess reactant effects on derivative chromatographic response. Minimum and maximum quantities of 1) FMP Vol. (2.5 mg/mL), 2) TEA Conc., 3) Methanol (A), 4) Vol. of A (FA, 0.1%, v/v) were selected to observe the effect of each reactant and its concentration on the area of E-2 derivative. The minimum and maximum input values for FMP volume was 100 μL and 200 μL, triethyamine (TEA) concentration was 1.5 and 3% (v/v), Methanol (A) concentration was 45 and 80% (v/v), Vol. of MeOH that has FA 0.1%, (v/v) was taken between 75 and 200 μL, respectively. Numbers of variables and center points were four and (v = 4, N0 = 6), respectively. Design Expert software was used to generate a series of thirty experimental runs (Supplementary Table 5). Solutions of E-2 and FMP-TS (2.5 mg/mL) were prepared in ACN. FA (0.1%, v/v) was added to varying concentrations of MeOH in water [Supplementary Table 4; Methanol (A) % (v/v)]; corresponding volumes of combined FA and MeOH are described in Supplementary Table 4 as Vol. of A (FA, 0.1%, v/v). FMP-TS was added to different TEA concentrations [Supplementary Table 4; TEA Conc. % (v/v)]; corresponding volumes of TEA containing FMP-TS are listed in Supplementary Table 4 as [FMP Vol. μL (2.5 mg/mL)]. Each derivatization reaction was initiated by addition of freshly prepared FMP-TS in TEA to 100 μL standard E-2. Vortexed mixtures were incubated under ambient conditions (2 hr) prior to heating at 40°C (15 min). Reactions were quenched by addition of FA (0.1%, v/v) in MeOH: water. Normal percent probability of residuals (Figure 11A) showed close alignment after deletion of one outlier (#run 24); residuals were assumed to follow normal distribution (Figure 11B). Plotting of residuals distribution vs predicted or runs showed that no observations exceeded maximum limits (Figure 12A–B). No observations exceeded Cook’s distance maximum limit of 0.89 (Figure 12C). Natural log transformation of residuals sums of squares produced a vertical line (λ=1, no transformation) that lies in the confidence limits of a Box-Cox plot (Figure 12D). Depiction of actual response values versus the predicted response showed that data points were split by the 45-degree line and all the responses were scattered in two regions (Figure 12E). Analysis of leverage vs runs showed that residuals did not exceed 0.34 and were present in two unique lanes (Figure 12F). No responses fell outside DFFITS limits (Figure 12G).
Figure 11.
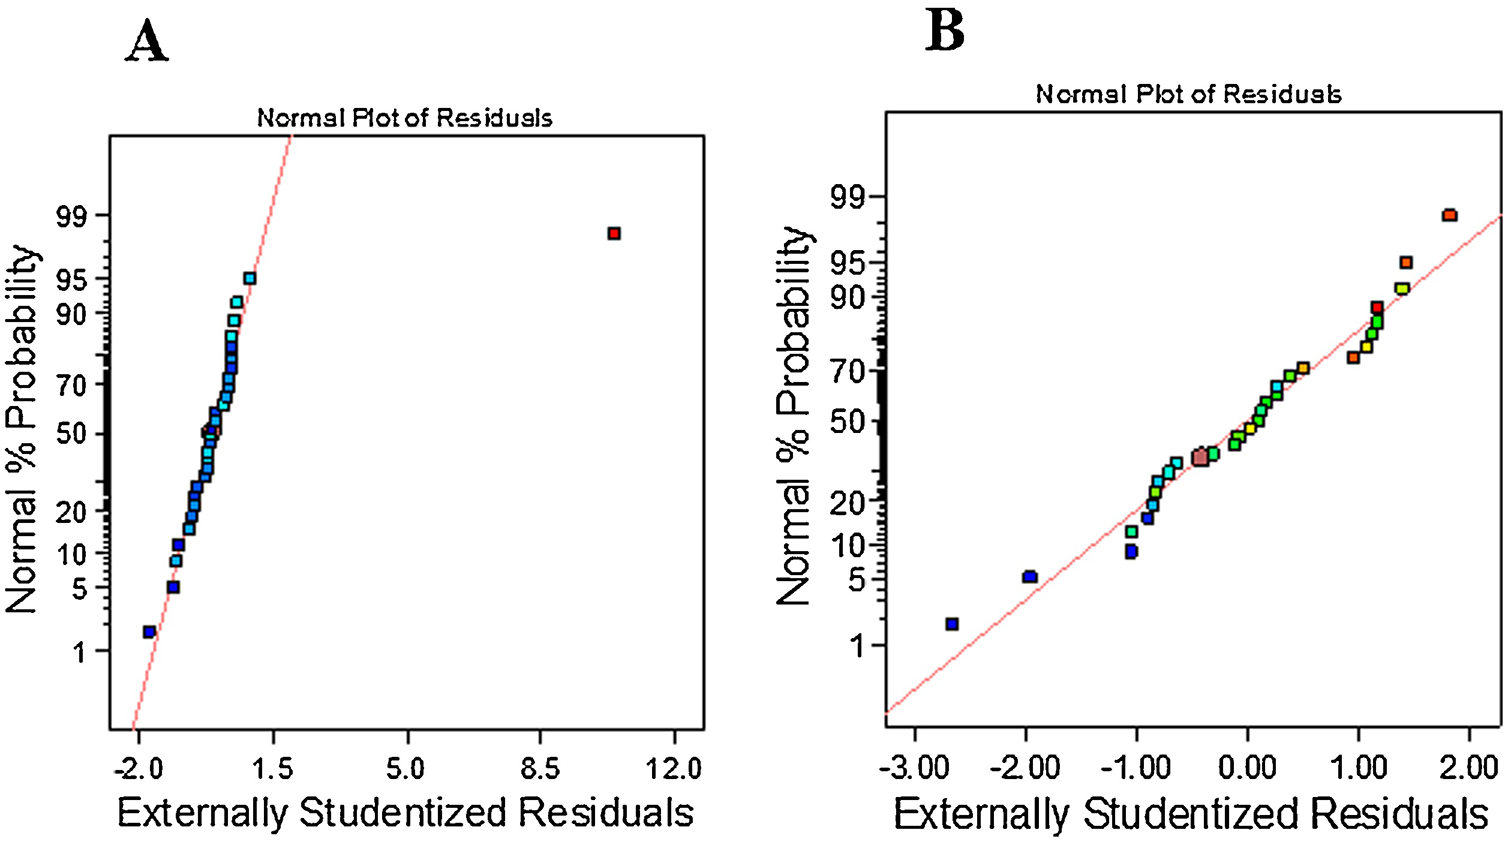
A) Normal % Probability plot of residuals showed one outlier, #24; B) Deletion of this single resulted in the close residual alignment to the inclined line to follow normal distribution.
Figure 12.
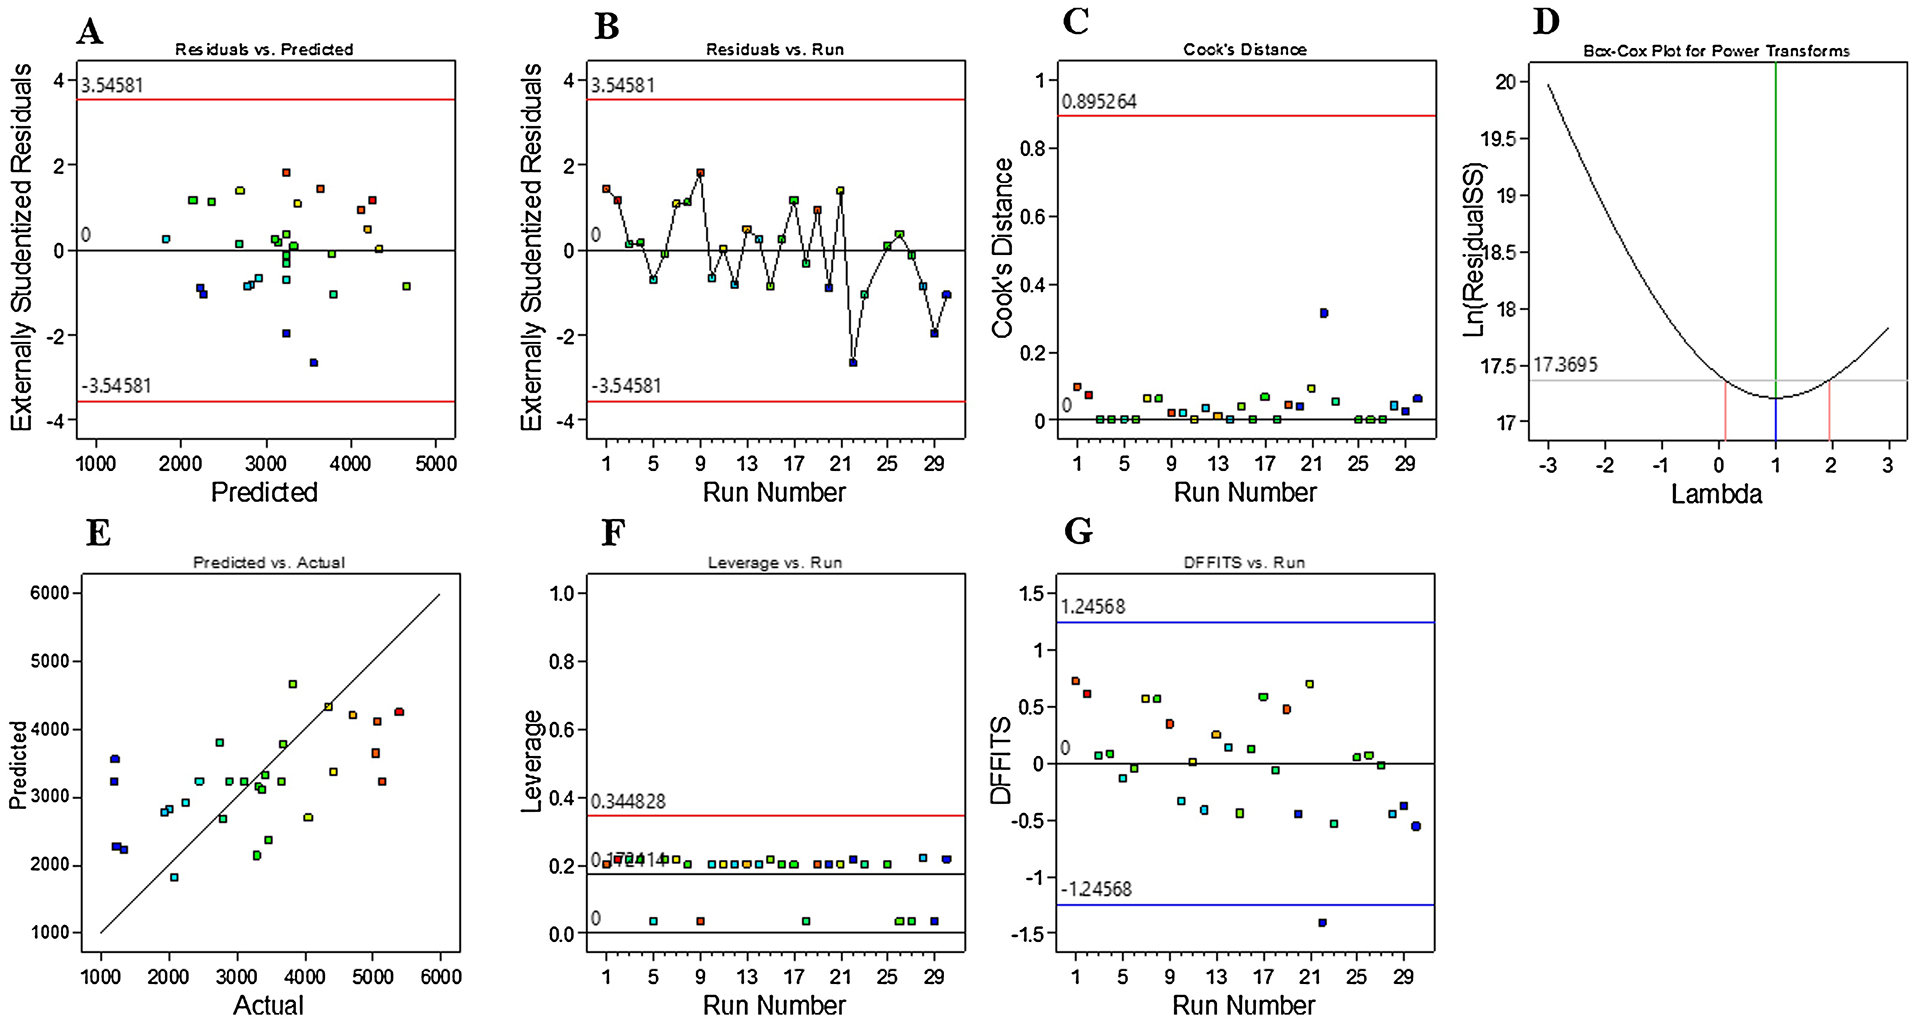
A) Plotting of externally studentized residuals vs predicted shows that most data points were scattered along the midline and were within the limits; B) Plotting of externally studentized residuals vs Run indicated that responses did not exceed minimum and maximum limits; C) Cook’s distance showed one influential observation; D) Natural log of residual sums of squares versus power transform yielded a vertical line (λ=1) that was within the limits; E) Plot of predicted versus actual indicated that residuals were scattered along the slanted line; F-G) Observations were within plot limits and did not show high leverage influence on the model.
The program-selected linear model exhibited a Predicted R2 value of 0.0112, which differs from the Adjusted R2 (0.203) by less than 0.2. An Adeq Precision ratio of 6.123 denotes an adequate signal for the model (Supplementary Table 7). Sequential Model Sum of Squares [Type I] revealed the Linear vs Mean model that was significant and not aliased (Supplementary Table 8). An ANOVA F value of 2.78 implies that the model is significant, with model term C as significant. A Lack of Fit F value of 0.66 implies that Lack of Fit is not significant relative to the pure error, indicating adequacy of the fitted model (Supplementary Table 9). Surface plots in Figure 13A–F show that component A (low) and B (high) yielded area ≈3208, ≈3763, ≈2663, ≈3650, ≈2230, and ≈4200, respectively; component A (low) and B (low) yielded area ≈3666, ≈4203, ≈3107, ≈4094, ≈2665, ≈4640, respectively; component A (high) and B (low) yielded area ≈3260, ≈3804, ≈2716, ≈3700, ≈2270, ≈4244, respectively; component A (high) and B (high) yielded area ≈2820, ≈3366, ≈2271, ≈3260, ≈1830, ≈3805, respectively; low levels of C=45 (Figure 13B and 13F); medium levels of C=62.5 (Figure 13A and 13D); high levels of C=80 (Figure 13C and 13E); and surface plot utilized low levels of D=137.2 (Figure 13D and 13F); medium levels of D=137.5 (Figure 13A–13C); high levels of D=200 (Figure 13E).
Figure 13.
The response surface plots for the 24 central composite designs for derivatization reaction: The component A: FMP Vol. (min=100; max=200), and B: TEA Conc. (min=1.5; max=3) were in common with (Panel. A) C=62.5 and D=80. (Panel. B) C=45 and D=137.5, (Panel. C) C=80 and D=137.5, (Panel. D) C=62.5 and D=75, (Panel. E) C=80 and D=200, and (Panel. F) C=45 and D=75, respectively.
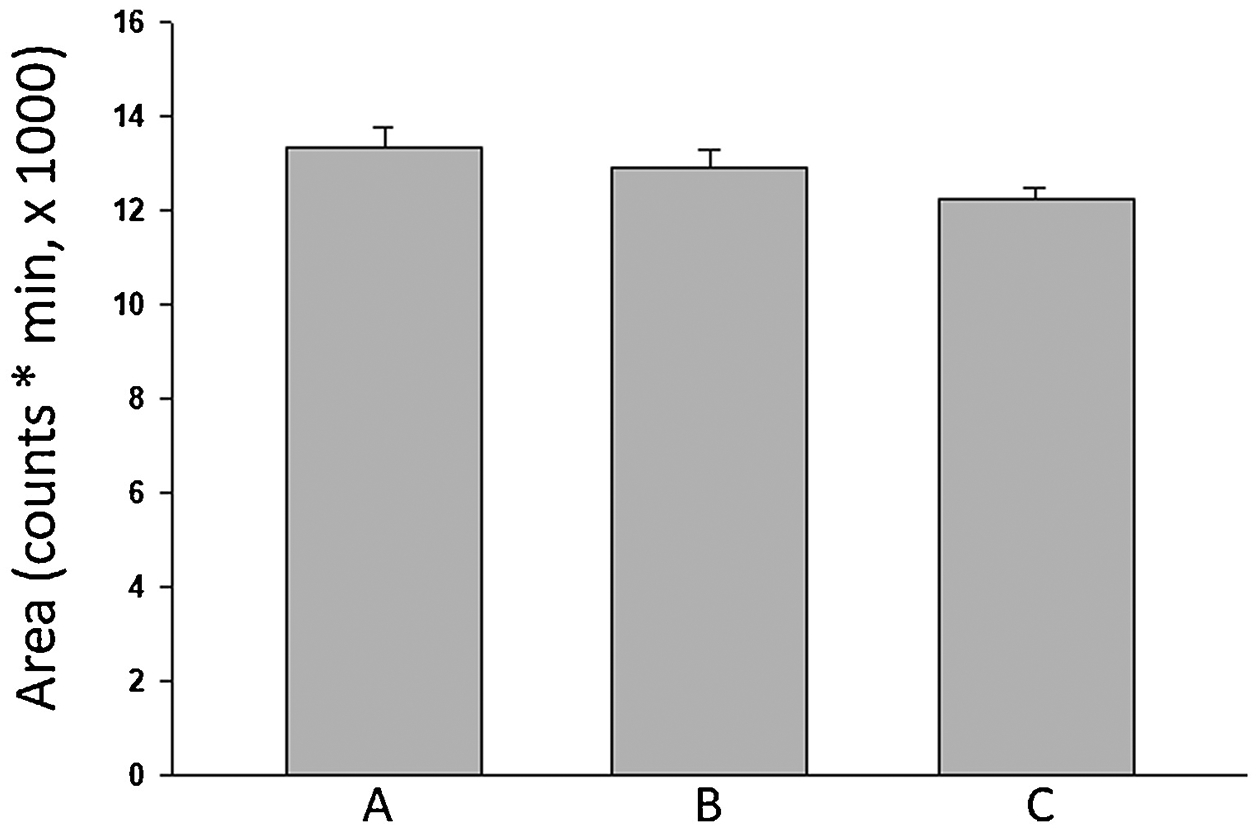
E-2 mass spectrometric responses to three distinct derivatization parameter combinations, e.g. A) 150 μL of FMP Vol. (2.5 mg/mL), 2.25% TEA, 62.5% Methanol, 137.5 μL of Vol. of A (Suppl. Table 5, #18), B) 150 μL of FMP Vol. (2.5 mg/mL), 0.75% TEA, 62.5% Methanol, 137.5 μL of Vol. of A (Suppl. Table 5, #24), C) 100 μL of FMP Vol. (2.5 mg/mL), 1.5% TEA, 45% Methanol, 75 μL of Vol. of A (Figure 13F) were analyzed. Combinations A and B yielded significantly different response, whereas no differences were observed between B and C (Figure 14). As drawbacks of TEA include reactivity with formic acid to suppress E-2 derivative signal intensity and marked effects of slight change in reactant composition on chromatographic response [32], superior performance of combination B here is likely due to low TEA concentration and reactant stability.
Figure 14.
Mean responses of parameter combination A (Suppl. Table 5, #18) and B (Table 5, #245, whereas B and C (100 μL of FMP Vol. (2.5 mg/mL), 1.5% TEA, 45% Methanol, 75 μL of Vol. of A) responses were similar. ANOVA test, (p<0.0001, n=3, F=126).
2.2. Application of combinatory microdissection/high-sensitivity estradiol LS-ESI-MS analytical methods for assessment of effects of acute versus recurring IIH on estradiol content of rostro-caudal VMN segments.
2.2.1. Experimental Design:
Adult male and female Sprague-Dawley rats (2–3 months of age) were housed under a 14 h light/10 h dark lighting schedule (lights on at 05:00 h), and allowed free access to standard laboratory rat chow (Harlan Teklad LM-485; Harlan Industries, Madison, WI, USA) and tap water. Animals were acclimated to daily handling. All experimental protocols were carried out in compliance with NIH guidelines for care and use of laboratory animals, under approval by the ULM Institutional Animal Care and Use Committee. On study day 1, female rats were bilaterally ovariectomized under ketamine/xylazine anesthesia (0.1 mL/100 g bw; 90 mg ketamine:10 mg xylazine/mL; Henry Schein Inc., Melville, NY), then implanted on day 7 with a subcutaneous (sc) silastic capsule containing 17β-estradiol-3-benzoate (30ug/mL safflower oil) to replicate circulating plasma hormone levels measured in ovary-intact female rats on metestrus [33]. At 09:00 h on study days 14–17, animals were injected according to one of the following schedules: 1) sc injection with vehicle (sterile diluent; V; Eli Lilly & Co., Indianapolis, IN, US) on days 14–17 (group identifier: VVVV; n=3 males, n=3 females); sc V injection on days 14–16, sc injection of neutral protamine Hagedorn insulin (INS; 10.0 U/kg bw) on day 17 (group identifier: VVVI; n=3 males, n=3 females); sc INS injection on days 14–16, sc V injection on day 17 (group identifier: IIIV; n=3 males, n=3 females); sc INS injection on days 14–17 (group identifier: IIII; n=3 males, n=3 females). Animals were sacrificed by rapid decapitation at 10.00 h on day 17; dissected brains were snap-frozen in isopentane and stored at −80 °C.
2.2.2. VMN tissue microdissection and estradiol solid phase extraction:
Each brain was cut into consecutive frozen 100 μm thick sections in a cryostat over the rostro-caudal extent of the VMN, as described [7]. For each animal, VMN tissue was harvested bilaterally from each tissue section using a calibrated 0.50 mm-diameter hollow micropunch tool (Stoelting, Inc., Wood Dale, IL), and pooled within two distinctive rostro-caudal segments, e.g. −1.80 to −.2.30 (rostral VMN) versus −2.80 to −3.30 mm (caudal VMN) posterior to bregma, by collection into 100 μL ultrapure water prior to storage at −80° C. Thawed sample aliquots were vortexed (30 sec), homogenized, and centrifuged. Clear supernatant aliquots were combined with 100 μL water containing internal standard (IS) for solid phase extraction (SFE). SPE was performed using Oasis® MCX (3 cc/60 mg, Waters) cartridges. Cartridges were eluted first with MeOH and water (2 mL each), followed by FA (2% v/v, 2 mL); estrogens were subsequently eluted with ACN, after assessment of various solvents [34] as chromatogram area (Figure 2B) was improved compared to reported methods involving MeOH elution [24]. Residues were dried in a speed vacuum concentrator, lyophilized to remove water, and derivatized with FMP-TS, as described above.
2.2.3. VMN tissue estradiol quantification:
A FMP-E-2 (m/z 364.2) calibration curve was established with FMP-EE as IS, as this derivative exhibited a highly-stable mass spectrometric response (m/z 388.2) in standard and brain samples. Accuracy, i.e. percent relative error of calibration concentrations relative to chromatogram area varied between −19 and 24.27; precision (relative standard deviation) ranged from 2.75 to 11.02%; limits of detection and quantification were 152.8 and 463 pg/μL, respectively. Sample protein content was determined using a ThermoFisherScientific NanoDrop Onec microvolume UV-Vis spectrophotometer (840–274200). For each animal, estradiol concentrations in rostral or caudal VMN regions were determined using the linear equation y = 0.537x - 0.0387, over a range of 5.0 – 1280 pg/μL, R2=0.9982, and expressed as pg/mg protein. For each VMN segment, data were analyzed between sexes by three-way analysis of variance and Student Newman Kuels post-hoc test. Differences of p<0.05 were considered significant.
3. Results:
Data presented in Supplementary Figures 2 and 3 show that Experiment Run 10, featuring mass chromatographic operational parameters set at VT=320 ° C, ITT=266 ° C, SGP=22 psig, AGP=5 psig, and SWGP=0.7 psig, produced a chromatographic response that exceeded all other runs. Effects of individual critical mass spectrometric variables on estrogen derivatives percent relative area responses are depicted in Figure 3. The SIM and relative abundance of FMP-E-2 (Supplementary Figures 5A–B), FMP-E-1 (Supplementary Figures 4A–B), and FMP-E-3 (Supplementary Figures 6A–B) demonstrate selectivity of the current method. The software-generated quadratic equation identified synergistic factors that improve area (indicated by a positive sign) and antagonistic factors that decrease area (denoted by a negative sign).
Prediction analysis using that equation did not further enhance chromatogram area compared to Run 10 outcomes. CCD application to LC mobile phase composition, column temperature and flow rate variables did not significantly improve E-2 chromatographic response (data not shown).
Figure 3.
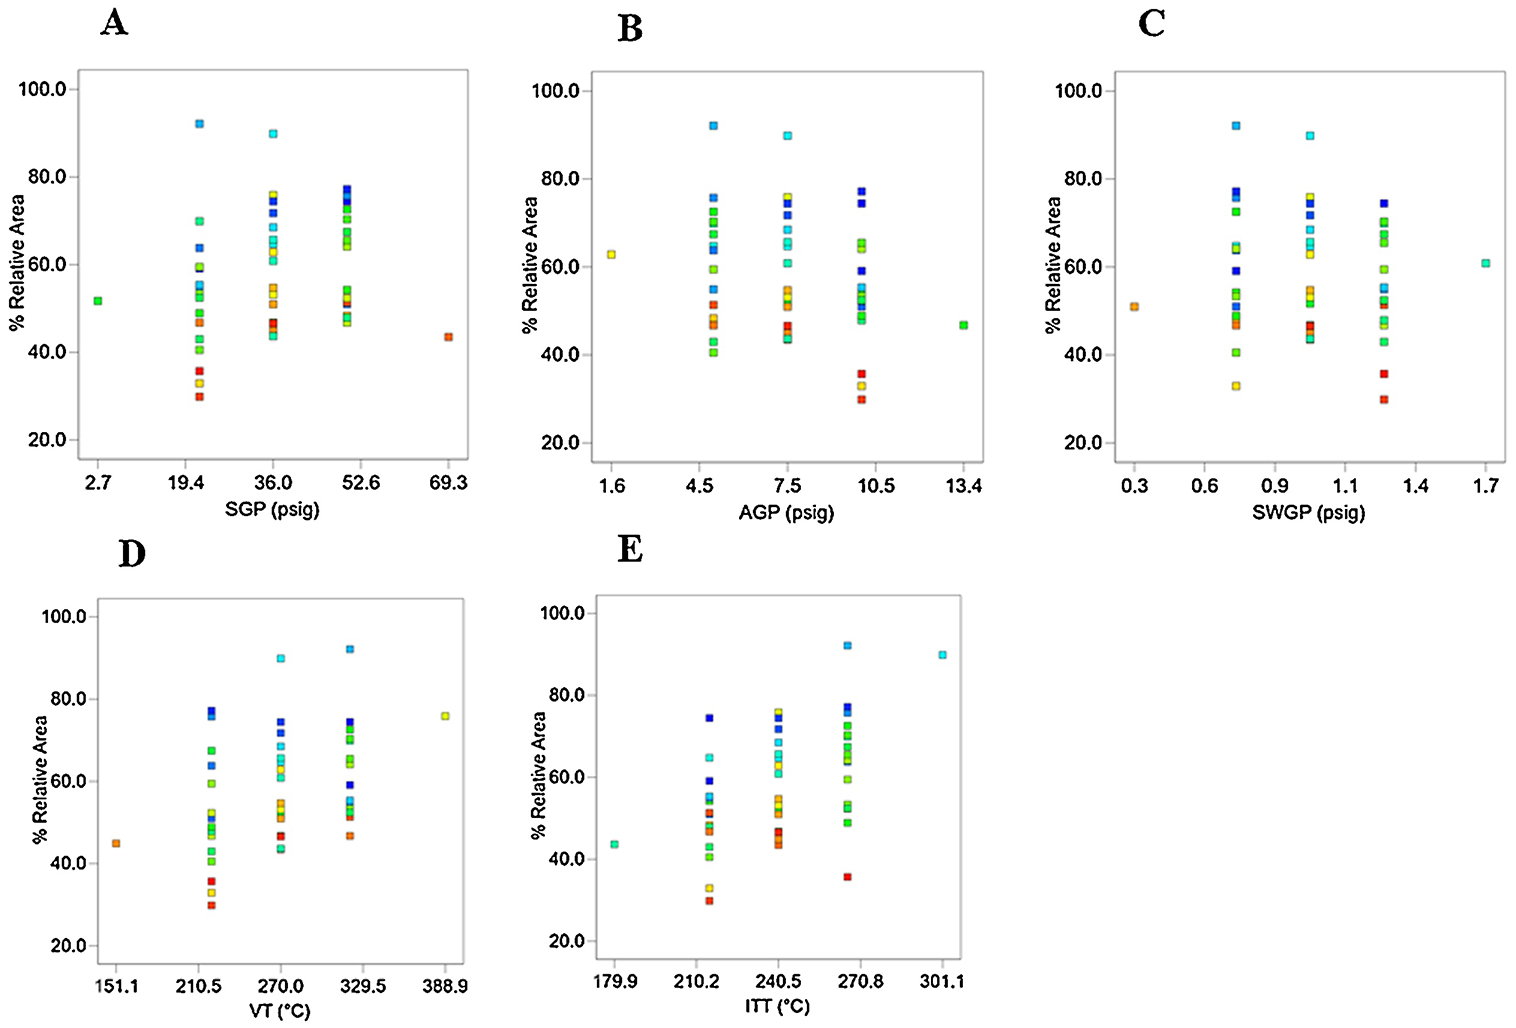
Effect of individual mass spectrometric operational variables on percent relative area of standard estrogen derivatives. A) SGP on %relative area of estrogen derivatives: 22 psig showed highest area; B) AGP on % relative area of estrogen derivatives: 5 psig showed highest area; C) SWGP on % relative area of estrogen derivatives: 0.7 psig showed highest area; D) VT on % relative area of estrogen derivatives: 320 °C showed highest area; E) ITT on % relative area of estrogen derivatives: 270 °C showed highest area.
FS-generated DOE based upon minimum and maximal variable limits employed for the design (Supplementary Table 3) showed that a total of only four runs, including Run Number 4, were necessary to reproduce an FMP-E-2 chromatographic response that was equivalent to maximum CCD output (Figures 8 and 9). Moreover, the AIC value for the FS quadratic equation, which incorporates all five critical mass spectrometric variable responses, was negative infinity, highly indicative of a superior model, and the AICc value for each experimental model was −9.59 (data not shown).
Figure 8.
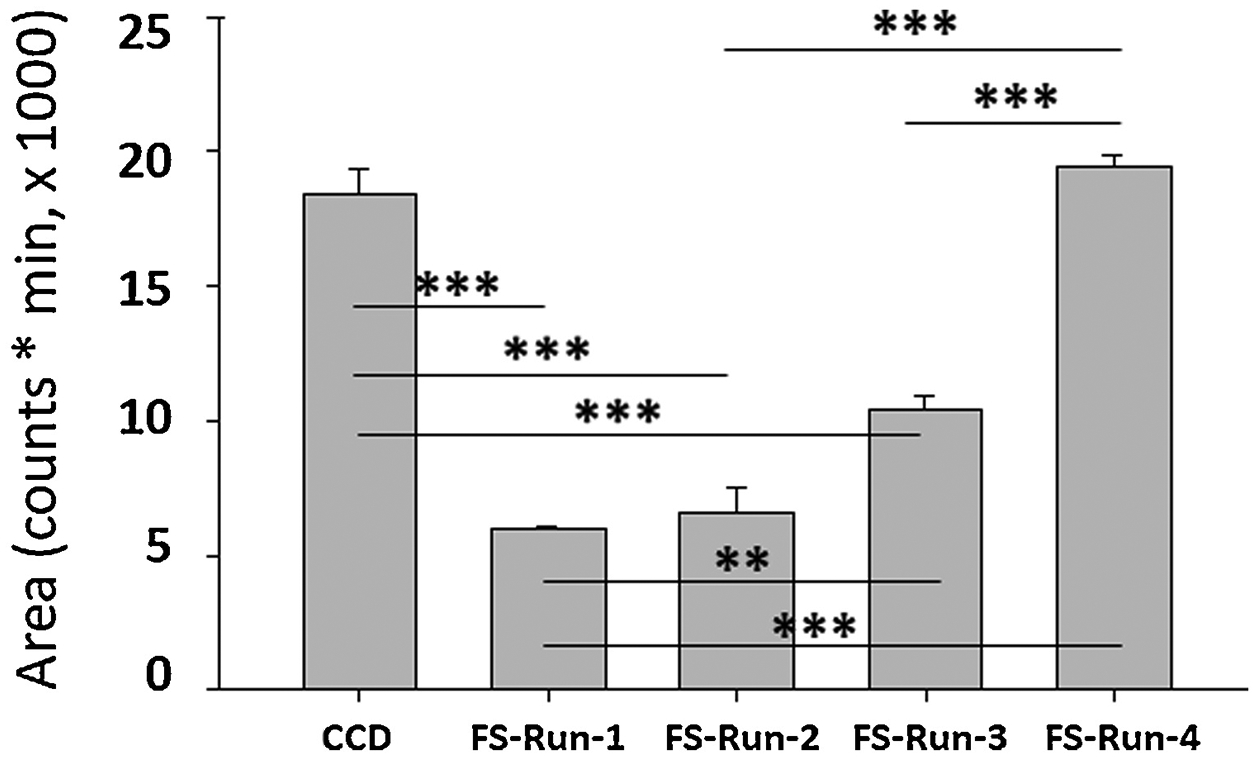
Comparison of CCD-derived maximum FMP-E-2 chromatographic response with Fibonacci Sequence (FS) design Run 4 (FS-Run-4) shows that outcomes were equivalent, and that FS design can efficiently produce maximum response with minimum experimental runs.
Figure 9.
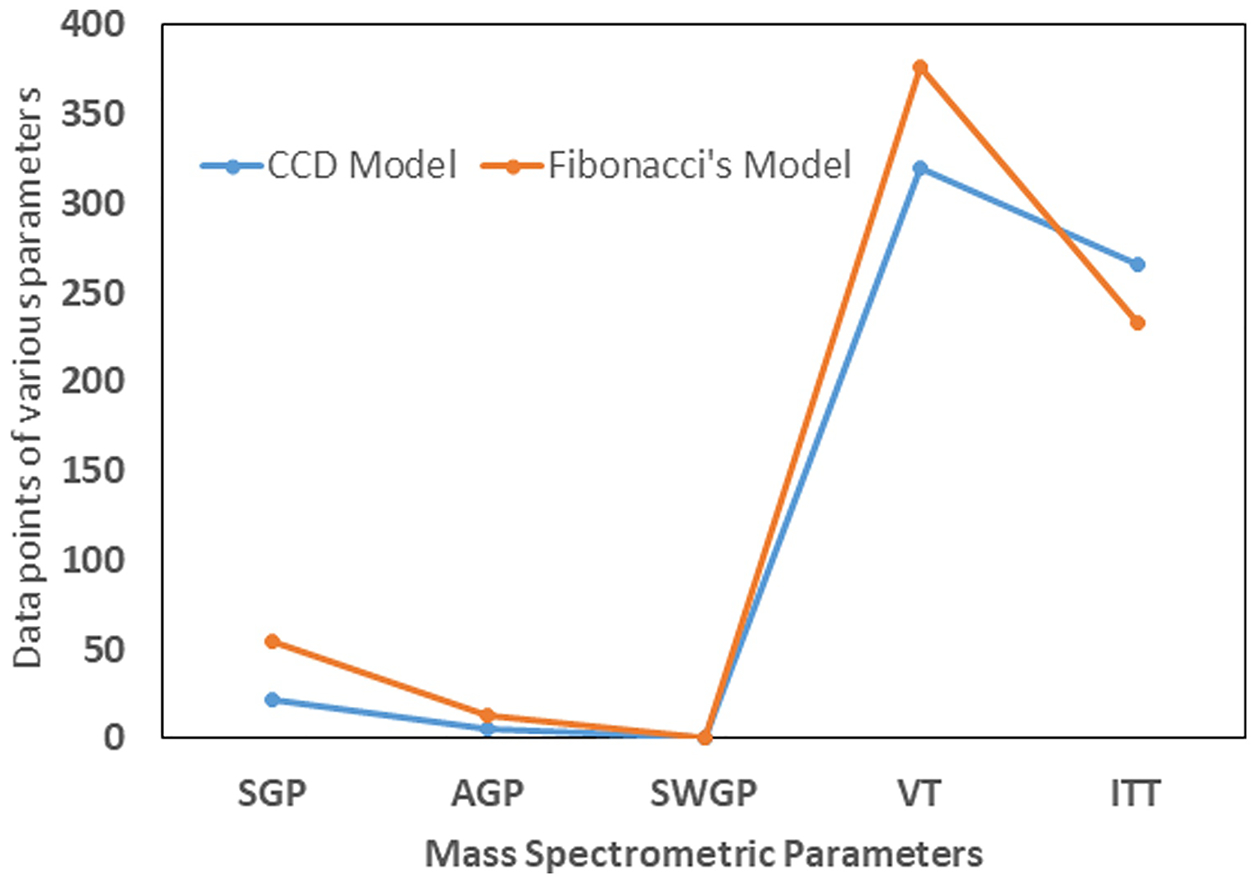
Model comparison of mass spectrometric parameters of CCD vs FS-Run-4. CCD parameters were SGP=22 psig, AGP=5 psig, SWGP=0.7 psig, VT=320 °C, and ITT=266 °C (Refer Table. 1: Run #10), whereas FS-Run-4 determined SGP=55 psig, AGP=13 psig, SWGP=1 psig, VT=377 °C, and ITT=233 °C (Refer Supplementary Table.2).
Results shown in Supplementary Table 5 depict outcomes of experiment runs involving FA (0.1%, v/v) combined with varying MeOH concentrations, designated as Vol. of A (FA, 0.1%, v/v), and FMP-TS added to varying TEA concentrations [FMP Vol. μL (2.5 mg/mL)]. Data presented in the last column of Supplementary Table 5 show that the Run 24 response was an outlier compared to all other runs.
Area generated under Run 24 conditions, involving a 25% reduction in TEA concentration, augmentation of MeOH from 35 to 62.5%, and increased addition of FA, exceeded the chromatographic response produced by the conventional derivatization protocol (Supplementary Figure 7). AICc analysis of combinations of four or fewer of the derivatization factors indicated above showed that interaction of all four variables optimally enhances the FMP-E-2 signal (Supplementary Table 6). Software generated the following linear equation:
Elution of FMP-E-2 derivative generated with (Figure 10B) or without (Figure 10A) CCD design produced or two split peaks versus a single symmetric peak, respectively. The former outcome was unaffected by manipulation of formic acid strength, column temperature, gas pressures, or ionization temperatures. We initially utilized a wash protocol consisting of the following sequence of runs over 15–20 min: 1) 100% water run (0.12 mL/min, 3 min duration), 2) 100% 1.77 mM FA (0.16 mL/min, 3 min duration), 3) incremental increase from 0 to 75% ACN (0.2 mL/min, 4 min duration), and 4) 75% ACN and 25% 1.77 mM FA (5–10 min duration), which produced a pressure window required for generation of a FMP-E-2 symmetric peak. An alternative run sequence [1) gradient elution of 75% ACN with 25% 1.77 mM FA (3 min), 2) incremental increase (Supplementary Figure 8A) of ACN from 75 to 100% (3–4 min), 3) reduction of ACN from 100 to 75% (to 6 min), 4) 75% ACN run until 9 min (Supplementary Figure 8A and 8B)] produced a symmetrical FMP-E-2 peak from CCD-designed derivatization (Figure 10C), indicating that mobile phase composition is critical for generation of that peak. This novel wash run sequence elicits a pressure decrease that is succeeded by restoration of initial pressure (Supplementary Figure 8C).
Figure 10.
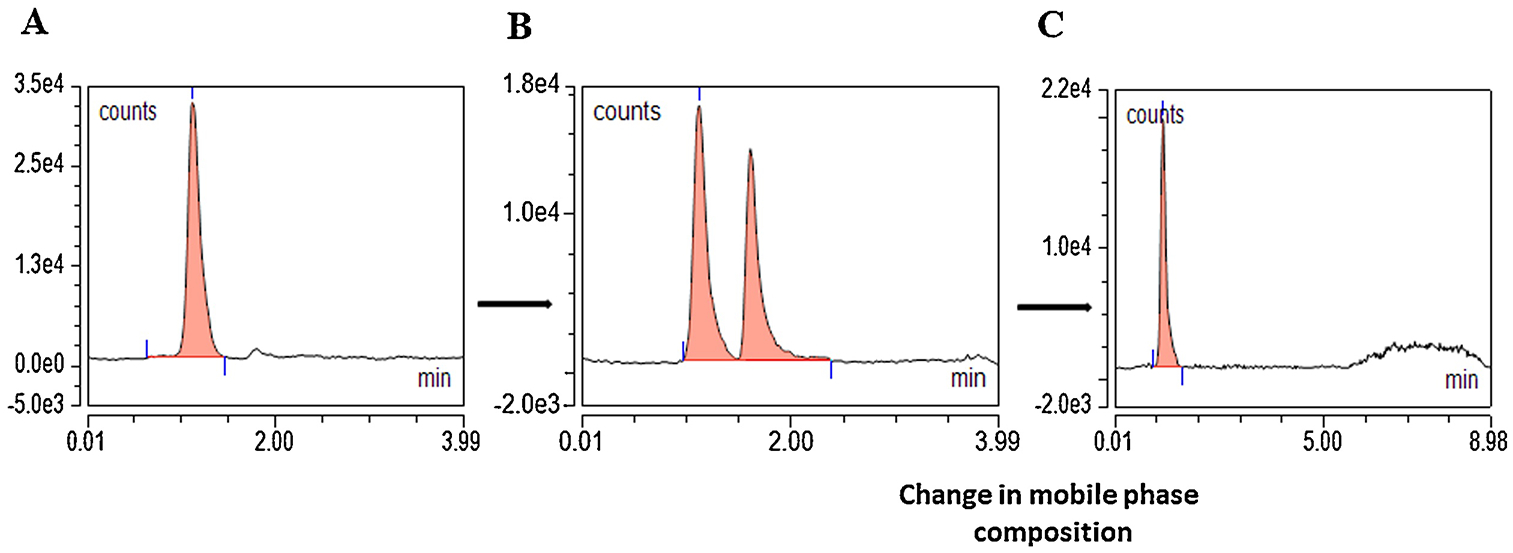
CCD parameters for E-2 derivatization optimization resulted in FMP-E-2 split peaks, which were resolved to a single symmetrical peak by manipulation of gradient mobile phase. (A) FMP-E-2 produced a peak at 1.1 min at mobile phase composition ACN (75%) and 1.77-mM – FA (25%) in a 3 min run. (B) A FMP-E-2 split peak was observed after CCD. (C) A trial-and-error approach to gradient mobile phase composition resulted in one symmetric FMP-E-2 peak.
Effects of CCD design on mass spectrometric operational variable settings produced a quantification range of 32–193 pg/μL (data not shown), while CCD optimization of E-2 derivatization expanded that range to 5–1280 pg/μL. These outcomes show that DOE – guided optimization of instrument and derivatization reaction parameters improved LC-ESI-MS capabilities for measurement of brain tissue E-2 concentrations.
Pre-incubation of FMP-E-2 and TEA at ambient temperature (25 °C) prior to heat application (40 °C) was carried out between 0 and 240 min (Supplementary Figure 9). Outcomes show that E-2 chromatographic response was increased versus 0 min incubation at 60, 120, and 240 min. Maximum enhancement was achieved by pre-incubation of 120- or 240-min. duration (one-way ANOVA, p<0.0001, n=3).
Effects of mass spectrometric voltage parameters, i.e. ionization and collision induced dissociation (CID) voltages on FMP-E-2 chromatographic response were evaluated without DoE. Source voltage is applied to electrospray capillary for ionization, and can be either positive or negative. Positive source voltage was used in current analyses as the positively-charged estradiol derivative favors positive ionization. CID voltage facilitates fragmentation of selected ions in the gas phase. Here, we observed that gradual increase in source voltage at a constant CID of 27V increased FMP-E-2 chromatogram area (Supplementary Figure 10). Likewise, intensification of CID at constant ionization voltage (5000V) significantly improved FMP-E-2 response (Supplementary Figure 11).
LC-ESI-MS analysis of micropunch-dissected VMN tissue after administration of one versus four INS injections, one dose per day, to male or female rats showed that VMN E-2 concentrations habituated to RIIH in a sex-specific manner (Figure 15). During acute hypoglycemia (VVVI; diagonal-striped white bars) tissue E-2 levels were elevated in both VMN regions investigated in the male, but were only increased in the rostral VMN in the other sex. On day 17, male rats recovered from prior exposure to hypoglycemia on days 14–16 (IIIV; solid gray bars), showed significant augmentation of baseline VMN E-2 concentrations compared to the hypoglycemia-naïve VVVV control group [IIIV versus VVVI]. Yet, IIIV-treated females exhibited a reduction in rostral VMN E-2 levels compared to VVVV controls. In the male, induction of a fourth of four daily hypoglycemic episodes on day 17 (IIII; diagonal-striped gray bars) resulted in significant diminution of rostral and caudal E-2 content relative to acclimated high baseline levels. The IIII group of female rats, on the other hand, showed an increase in caudal VMN E-2 concentrations compared to the IIIV treatment group.
Fig. 15.
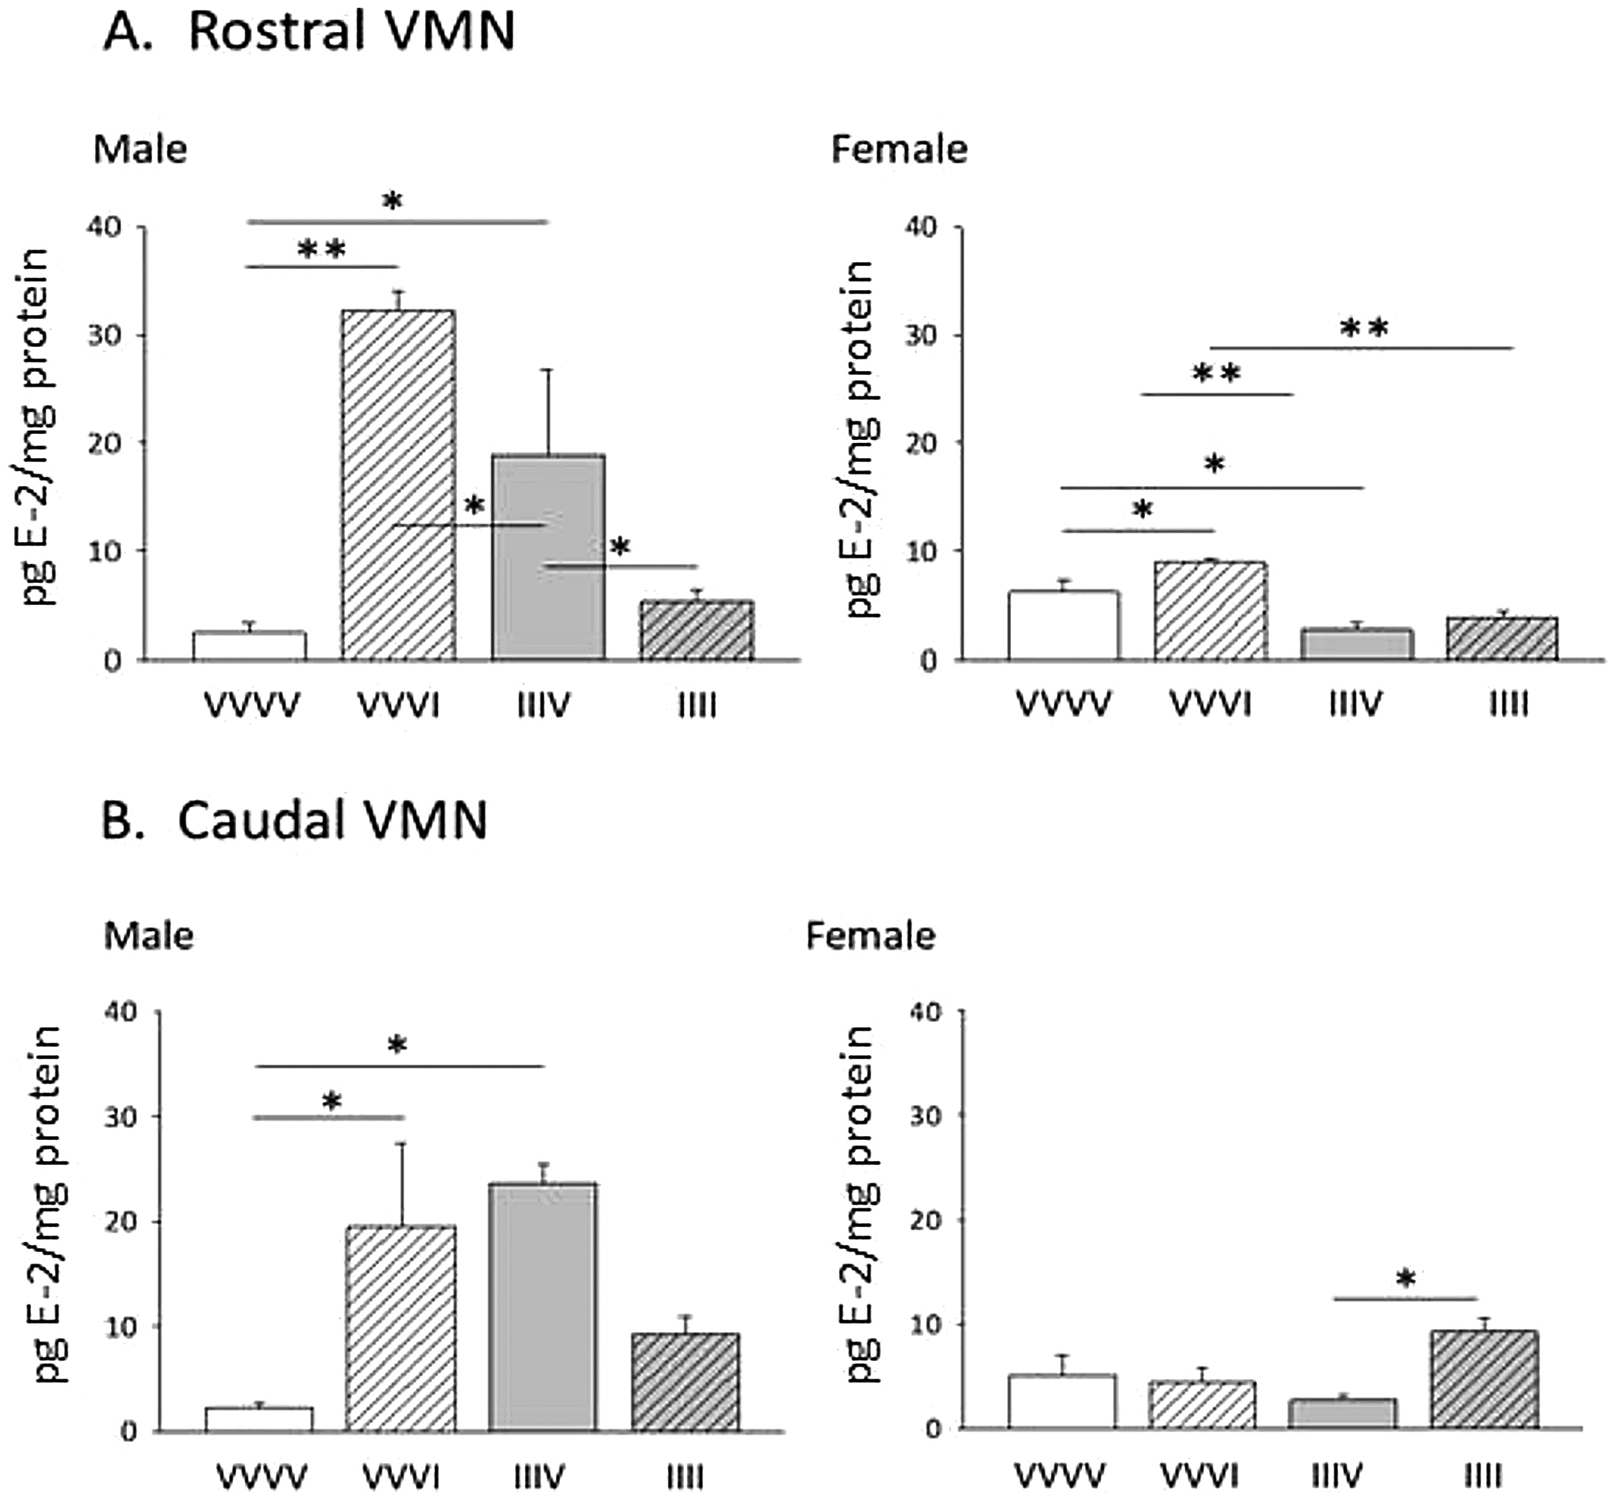
Effects of acute versus recurring insulin-induced hypoglycemia on rostral (A) or caudal (B) VMN tissue E-2 concentrations in male and female rats. Data show mean VMN E-2 content ± S.E.M. for groups of testes-intact male and ovariectomized, estradiol-implanted female rats injected subcutaneously with vehicle (V) or insulin (I; 10.0 U/kg bw on four consecutive days as follows: V injection on days 14–17 (VVVV); V injection on days 14–16, I injection on day 17 (VVVI); I injection on days 14–16, V injection on day 17 (IIIV); or I injection on days 14–17 (IIII).
4. Summary:
DOE assessment of critical mass spectrometric instrumentation (AGP, SGP, SWGP, VT, and ITT) and estrogen derivatization reagent (TEA, MeOH) variables enhanced LC-ESI-MS sensitivity for E-2, enabling selective quantification of this important regulatory stimulus in brain tissue samples acquired with high neuroanatomical specificity. Results document utility of Akaike Information Criterion Correction and FS-Design for modeling of E-2 chromatographic response. FMP-E-2 signal strength was also improved by sample SPE with ACN and pre-incubation with FMP-TS prior to heating. Application of optimized analytical methodology to micro-dissected VMN substructures showed that RIIH elicits sex-dimorphic adjustments in baseline E-2 tissue concentrations between hypoglycemia exposures and habituation of hypoglycemic regulation of E-2 signal volume.
5. Conclusions:
E-2 regulation of vital physiological and behavior functions by actions on the brain involves regulatory efficacy determined by local hormone signal strength as well as target cell sensitivity. Although analytical tools for analysis of estrogen receptor expression/binding in small-volume brain tissue samples are widely available, reliable methods for analysis of E-2 concentrations in equivalent-size samples are uncommon. Optimized LC-ESI-MS methodology described here exhibits requisite sensitivity for pairing with high-precision neuroanatomical micro-dissection technology, a combinatory approach that is poised to advance research on E-2 regulatory actions within small, physiologically-characterized areas of the brain. Novel evidence here for residual effects of precedent hypoglycemia on VMN tissue E-2 concentrations infers that associated up- (males) or down- (females) regulated E-2 signaling may cause divergent, sex-specific changes in multiple systemic functions controlled by the VMN, including gluco-regulation, in diabetes patients between episodes of hypoglycemia. Results offer unique proof that RIIH causes adaptive changes in hypoglycemic regulation of VMN E-2 content (thereby altering hypoglycemia-mediated E-2 stimulation of local receptors), involving a switch from positive to negative response in males irrespective of VMN segment versus either loss (rostral VMN) or gain (caudal VMN) of positive response in females. Further research is urgently needed to ascertain if and how adjustments in VMN E-2 levels impact gluco-regulatory signaling during hypoglycemia, and to determine functional consequences of RIIH-associated adaptation of sex-specific E-2 responses for counter-active defenses against hypoglycemia.
Supplementary Material
Highlights:
Ventromedial hypothalamic nucleus (VMN) control of glucostasis is estradiol (E-2)-dependent.
Segmental VMN tissue was microdissected after single or serial insulin (INS) dosing of male and female rats.
Central Composite Design (CCD) optimized LC-ESI-MS settings and derivatization to enhance E-2 chromatographic response.
Fibonacci Sequence design using CCD minimum and maximal variable limits produced a small-run model replicating CCD maximal response.
Recurrent hypoglycemia causes sex-dimorphic acclimation of baseline and hypoglycemia-associated tissue VMN E-2 content.
Funding:
This research was supported by NIH grant DK-109382
Abbreviations:
- ACN
acetonitrile
- AGP
aux gas pressure
- CCD
central composite design
- E-1
estrone
- E-2
estradiol
- E-3
estriol
- EE
ethinylestradiol
- FA
formic acid
- FMP-TS
2-fluoro-1-methylpyridinium-p-toluenesulfonate
- GABA
γ-aminobutyric acid
- IIH
insulin-induced hypoglycemia
- INS
insulin
- ITT
ion transfer tube temperature
- LC-ESI-MS
uHPLC-electrospray ionization mass spectrometry
- MeOH
methanol
- NO
nitric oxide
- OVX
ovariectomized
- SGP
sheath gas pressure
- SWGP
sweep gas pressure
- TEA
triethylamine
- VT
vaporizer temperature
- VMN
ventromedial hypothalamic nucleus
Footnotes
Publisher's Disclaimer: This is a PDF file of an unedited manuscript that has been accepted for publication. As a service to our customers we are providing this early version of the manuscript. The manuscript will undergo copyediting, typesetting, and review of the resulting proof before it is published in its final form. Please note that during the production process errors may be discovered which could affect the content, and all legal disclaimers that apply to the journal pertain.
Disclosure Statement: The authors have nothing to disclose.
Submission Declaration:
The authors verify that this work has not been published previously, is not under consideration for publication elsewhere, that it is approved by all authors, and that if accepted for publication, it will not be published elsewhere in the same form without written consent of the copyright-holder.
Statement by Authors:
All authors have read the manuscript and have authorized submission for publication, and agree that no changes will be permitted thereafter.
Declaration of Animal Use:
All animal experimental was carried out in compliance with the National Institutes of Health guide for the care and use of Laboratory animals (NIH Publications No. 8023, revised 1978), as stated in the submitted manuscript. Sex of animals used is included, along with discussion of sex impacts on study outcomes.
Declaration of interest:
The authors have no conflicts of interests to declare.
Statement on animal use: All animal experimental was carried out in compliance with the National Institutes of Health guide for the care and use of Laboratory animals (NIH Publications No. 8023, revised 1978), as stated in the submitted manuscript. Sex of animal used is included, along with discussion of impacts on study outcomes.
Submission declaration and verification: The authors verify that this work has not been published previously, is not under consideration for publication elsewhere, that it is approved by all authors and tacitly by the University of Louisiana at Monroe, and that if accepted, it will not be published elsewhere in the same form with written consent of the copyright-holder.
References:
- [1].Cryer PE, Davis SN, Shamoon H, Hypoglycemia in diabetes, Diabetes Care. 26 (2003) 1902–1912. [DOI] [PubMed] [Google Scholar]
- [2].Cryer PE, Hypoglycemia in type 1 diabetes mellitus, Endocrinol. Metab. Clin 39 (2010) 641–654. [DOI] [PMC free article] [PubMed] [Google Scholar]
- [3].Davis SN, Shavers C, Costa F, Gender-related differences in counterregulatory responses to antecedent hypoglycemia in normal humans, J. Clin. Endocrinol. Metab 85 (2000) 2148–2157. [DOI] [PubMed] [Google Scholar]
- [4].Watts AG, Donovan CM, Sweet talk in the brain: glucosensing, neural networks, and hypoglycemic counterregulation, Front. Neuroendocrinol 31 (2010) 32–43. [DOI] [PMC free article] [PubMed] [Google Scholar]
- [5].Shimazu T, Minokoshi Y, Systemic glucoregulation by glucose-sensing neurons in the ventromedial hypothalamic nucleus (VMH), J. Endocr. Soc 1 (2017) 449–459. [DOI] [PMC free article] [PubMed] [Google Scholar]
- [6].Nedungadi TP, Briski KP, Site-specific effects of intracranial estradiol administration on recurrent insulin-induced hypoglycemia in the ovariectomized female rat, Neuroendocrinology. 96 (2012) 311–323. [DOI] [PubMed] [Google Scholar]
- [7].Mahmood ASMH, Uddin MM, Ibrahim MMH, Mandal SK, Alhamami HN, Briski KP, Sex differences in forebrain estrogen receptor regulation of hypoglycemic patterns of counter-regulatory hormone secretion and ventromedial hypothalamic nucleus glucoregulatory neurotransmitter and astrocyte glycogen metabolic enzyme expression, Neuropeptides. 72 (2018) 65–74. [DOI] [PMC free article] [PubMed] [Google Scholar]
- [8].Uddin MM, Mahmood ASMH, Ibrahim MMH, Briski KP, Sex-dimorphic estrogen receptor regulation of ventromedial hypothalamic nucleus glucoregulatory neuron adrenergic receptor expression in hypoglycemic male and female rats, Brain Res. 1720 (2019) 146311. [DOI] [PMC free article] [PubMed] [Google Scholar]
- [9].Lauber ME, Lichtensteiger W, Pre-and postnatal ontogeny of aromatase cytochrome P450 messenger ribonucleic acid expression in the male rat brain studied by in situ hybridization, Endocrinology. 135 (1994) 1661–1668. [DOI] [PubMed] [Google Scholar]
- [10].Roselli CE, Resko JA, Aromatase activity in the rat brain: hormonal regulation and sex differences, J. Steroid Biochem. Mol. Biol 44 (1993) 499–508. [DOI] [PubMed] [Google Scholar]
- [11].Stanić D, Dubois S, Chua HK, Tonge B, Rinehart N, Horne MK, Boon WC, Characterization of aromatase expression in the adult male and female mouse brain. I. Coexistence with oestrogen receptors α and β, and androgen receptors, PLoS One. 9 (2014) e90451. [DOI] [PMC free article] [PubMed] [Google Scholar]
- [12].Taves MD, Ma C, Heimovics SA, Saldanha CJ, Soma KK, Measurement of steroid concentrations in brain tissue: methodological considerations, Front. Endocrinol. (Lausanne) 2 (2011) 39. [DOI] [PMC free article] [PubMed] [Google Scholar]
- [13].Konkle ATM, McCarthy MM, Developmental time course of estradiol, testosterone, and dihydrotestosterone levels in discrete regions of male and female rat brain, Endocrinology. 152 (2011) 223–235. [DOI] [PMC free article] [PubMed] [Google Scholar]
- [14].Paranjape SA, Briski KP, Recurrent insulin-induced hypoglycemia causes site-specific patterns of habituation or amplification of CNS neuronal genomic activation, Neuroscience. 130 (2005) 957–970. [DOI] [PubMed] [Google Scholar]
- [15].Sahu PK, Ramisetti NR, Cecchi T, Swain S, Patro CS, Panda J, An overview of experimental designs in HPLC method development and validation, J. Pharm. Biomed. Anal 147 (2018) 590–611. [DOI] [PubMed] [Google Scholar]
- [16].Petrozzo DP, Stepper JC, Successful reengineering, John Wiley & Sons, 1994. [Google Scholar]
- [17].Breysse D, Probabilities and materials: tests, models and applications, Springer Science & Business Media, 2012. [Google Scholar]
- [18].Bai Y, Saren G, Huo W, Response surface methodology (RSM) in evaluation of the vitamin C concentrations in microwave treated milk, J. Food Sci. Technol 52 (2015) 4647–4651. [DOI] [PMC free article] [PubMed] [Google Scholar]
- [19].Zheng H, Clausen MR, Dalsgaard TK, Mortensen G, Bertram HC, Time-saving design of experiment protocol for optimization of LC-MS data processing in metabolomic approaches, Anal. Chem 85 (2013) 7109–7116. [DOI] [PubMed] [Google Scholar]
- [20].Moreiras G, Leão JM, Gago‐ Martínez A, Design of experiments for the optimization of electrospray ionization in the LC‐ MS/MS analysis of ciguatoxins, J. Mass Spectrom 53 (2018) 1059–1069. [DOI] [PubMed] [Google Scholar]
- [21].Székely G, Henriques B, Gil M, Ramos A, Alvarez C, Design of experiments as a tool for LC–MS/MS method development for the trace analysis of the potentially genotoxic 4-dimethylaminopyridine impurity in glucocorticoids, J. Pharm. Biomed. Anal 70 (2012) 251–258. [DOI] [PubMed] [Google Scholar]
- [22].Bheemanapally K, Ibrahim MMH, Briski KP, Optimization of Ultra-High-Performance Liquid Chromatography-Electrospray Ionization-Mass Spectrometry Detection of Glutamine-FMOC Ad-Hoc Derivative by Central Composite Design, Sci. Rep 10 (2020) 1–9. [DOI] [PMC free article] [PubMed] [Google Scholar]
- [23].Metil DS, Sonawane SP, Pachore SS, Mohammad A, Dahanukar VH, McCormack PJ, Reddy CV, Bandichhor R, Synthesis and optimization of canagliflozin by employing quality by design (QbD) principles, Org. Process Res. Dev 22 (2018) 27–39. [Google Scholar]
- [24].Faqehi AMM, Cobice DF, Naredo G, Mak TCS, Upreti R, Gibb FW, Beckett GJ, Walker BR, Homer NZM, Andrew R, Derivatization of estrogens enhances specificity and sensitivity of analysis of human plasma and serum by liquid chromatography tandem mass spectrometry, Talanta. 151 (2016) 148–156. [DOI] [PMC free article] [PubMed] [Google Scholar]
- [25].Supriatna AK, Carnia E, Ndii MZ, Fibonacci numbers: A population dynamics perspective, Heliyon. 5 (2019) e01130. [DOI] [PMC free article] [PubMed] [Google Scholar]
- [26].Park AE, Fernandez JJ, Schmedders K, Cohen MS, The Fibonacci sequence: relationship to the human hand, J. Hand Surg. Am 28 (2003) 157–160. [DOI] [PubMed] [Google Scholar]
- [27].Maciá E, Electronic structure and transport properties of double-stranded Fibonacci DNA, Phys. Rev. B 74 (2006) 245105. [Google Scholar]
- [28].Sigler L, Abaci FL, A translation into modern English of Leonardo Pisano’s Book of calculation, (2002).
- [29].Hsu C-H, Jiang J-C, Dang H-S, Chang C-C, Investigating the design parameters on spiral micro-channel by using Fibonacci sequence and Taguchi method, Microsyst. Technol 24 (2018) 255–271. [Google Scholar]
- [30].Barton K, Barton MK, Package ‘MuMIn,’ Version. 1 (2015) 18. [Google Scholar]
- [31].Snipes M, Taylor DC, Model selection and Akaike Information Criteria: An example from wine ratings and prices, Wine Econ. Policy 3 (2014) 3–9. [Google Scholar]
- [32].Lindegardh N, Annerberg A, White NJ, Day NPJ, Development and validation of a liquid chromatographic-tandem mass spectrometric method for determination of piperaquine in plasma: stable isotope labeled internal standard does not always compensate for matrix effects, J. Chromatogr. B 862 (2008) 227–236. [DOI] [PubMed] [Google Scholar]
- [33].Briski KP, Marshall ES, Sylvester PW, Effects of estradiol on glucoprivic transactivation of catecholaminergic neurons in the female rat caudal brainstem, Neuroendocrinology. 73 (2001) 369–377. [DOI] [PubMed] [Google Scholar]
- [34].Li C, Chen J, Chen Y, Wang J, Ping H, Lu A, Graphene-Derivatized Silica Composite as Solid-Phase Extraction Sorbent Combined with GC–MS/MS for the Determination of Polycyclic Musks in Aqueous Samples, Molecules. 23 (2018) 318. [DOI] [PMC free article] [PubMed] [Google Scholar]
Associated Data
This section collects any data citations, data availability statements, or supplementary materials included in this article.