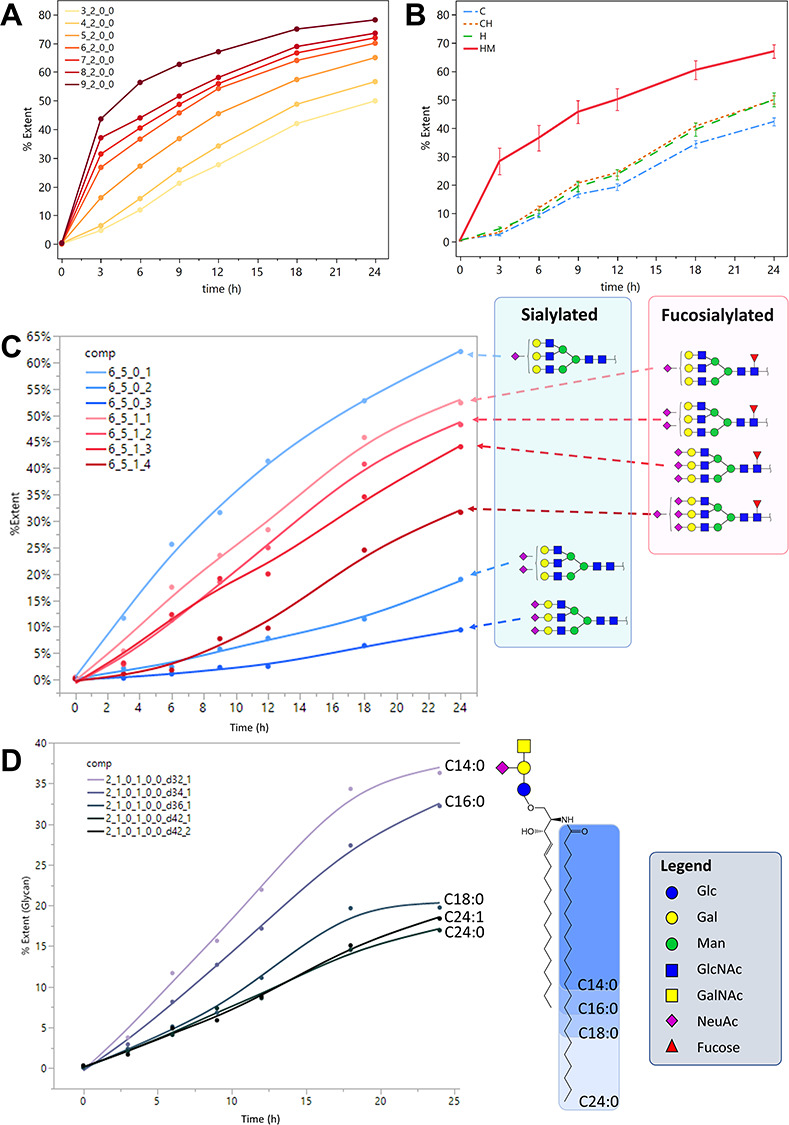
Fig. 6.

Incorporation curves showing the extent of incorporation %E plotted against time. (A) High-mannose type N-glycans. (B) The mean %E of N-glycans grouped by subtype: C, complex; H, hybrid; C/H, complex/hybrid; HM, high-mannose. Error bars represent the standard error among the N-glycans of each subtype. N(C) = 95, N(C/H) = 76, N(H) = 29, N(HM) = 30. (C) Incorporation curves for triantennary complex-type N-glycans with 1–3 NeuAc and 0–1 Fuc. (D) Ganglioside GM2 with 32, 34, 36 and 42 ceramide carbons. N-Glycan composition legend: Hex_HexNAc_Fuc_NeuAc; GSL comp. legend: Hex_HexNAc_Fuc_NeuAc_NeuGc_Sulf_Ceramide lipid length_Degree of unsaturation.
