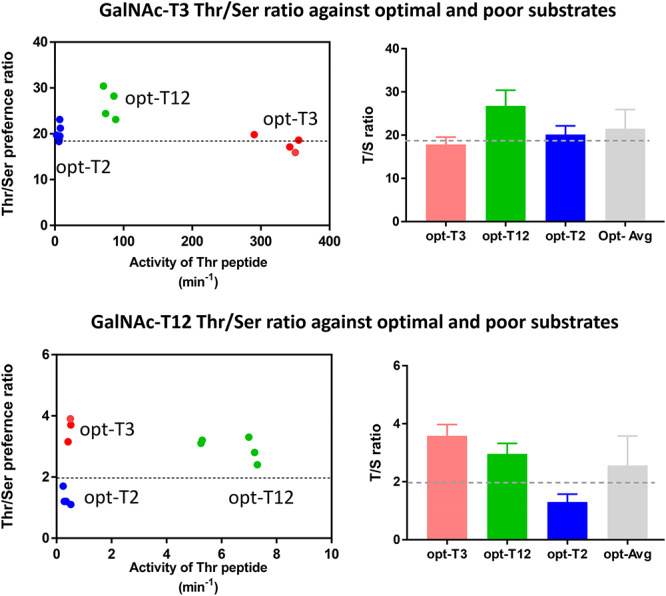
Fig. 3.

Thr/Ser rate ratios do not appreciably change with peptide sequence or intrinsic substrate activity for GalNAc-T3 or GalNAc-T12. Left Panels: Dot plots showing individually obtained Thr/Ser rate ratios plotted against relative substrate activity (in (moles product/mole transferase)/min) for the three unique peptides of different relative activity (see Table III). The dotted line through the plots represents the intrinsic Thr/Ser ratio obtained from the random peptide substrates (see Figure 2 and Table II). Note that for GalNAc-T12 the large difference in the Thr/Ser rate ratios for the opt-T2 and opt-T3 peptides is likely due to their very low activities and high rates of UDP-GalNAc hydrolysis. Right panels: Bar graphs showing the average Thr/Ser ratio obtained for each peptide substrate, and the average of all three, again a line representing the random peptide derived intrinsic Thr/Ser rate ratio for each transferase is also plotted. Averaged Thr/Ser rate ratios obtained from Table III. Data for the peptide substrates (see Table III) are color coded as red for opt-T3, green for opt-T12 and blue for opt-T2. Note the “opt” peptides refer to the transferase specific optimal peptides given in Table III as predicted by the ISOGlyP predictor http//isoglyp.utep.edu.
