Abstract
This paper demonstrates the essential and efficient methods to design, and fabricate optimal vascular network for tissue engineering structures based on their physiological conditions. Comprehensive physiological requirements in both micro and macro scales were considered in developing the optimisation design for complex vascular vessels. The optimised design was then manufactured by stereolithography process using materials that are biocompatible, elastic and surface bio-coatable. The materials are self-developed photocurable resin consist of BPA-ethoxylated-diacrylate, lauryl acrylate and isobornylacrylate with Irgacure® 184, the photoinitiator. The optimised vascular vessel offers many advantages: 1) it provides the maximum nutrient supply; 2) it minimises the recirculation areas and 3) it allows the wall shear stress on the vessel in a healthy range. The stereolithography manufactured vascular vessels were then embedded in the hydrogel seeded with cells. The results of in vitro studies show that the optimised vascular network has the lowest cell death rate compared with a pure hydrogel scaffold and a hydrogel scaffold embedded within a single tube in day seven. Consequently, these design and manufacture routes were shown to be viable for exploring and developing a high range complex and specialised artificial vascular networks.
Keywords: artificial vascular network, skin tissue engineering, additive manufacturing, stereolithography, design optimisation
1. Introduction
Successfully producing full skin models with an overall thickness of several millimetres is a significant goal in skin tissue engineering. Full skin models can be used as implants or grafts to replace damaged skin or used to reduce and replace animal testing in the pharmaceutical industry[1,2]. The most significant challenge in producing full thickness skin models is that the artificial skin needs to develop adequate vascularisation for long-term survival[3]. Without a functional vascular network, the diffusion of oxygen is limited to a distance of 100–200 microns[4]. This can be addressed by pre-embedding an artificial vascular network into the skin scaffolds. The embedded network has two primary functions: 1) to supply nutrients and other soluble factors and remove waste products from the surrounding cells and 2) to develop small sprouting capillaries that can be connected with existing blood vessels, also known as angiogenesis[5-8]. Nutrition supply in the human body is realized by a very complex blood vessel network. It consists of vessels in dimensions between several millimetres down to several micrometres in diameter. To mimic this system, flexible structuring processes are needed. Traditional manufacturing technologies, such as spinning, dip-coating or extrusion, can produce linear tubes with different inner-diameters[9]. However, it is not possible to generate branched vessels, with decreasing or increasing internal diameters to mimic the natural changes in blood vessel networks.
With Additive Manufacturing (AM), three-dimensional (3D) objects can be produced from 3D computer-aided design (CAD) data by joining materials together using a layer-by layer manner. It is been employed widely in fabricating scaffolds and complete constructions for tissue engineering applications. There are many AM techniques served as bioprinting systems, such as microvalve-based, ink-jetting based, extrusion-based and stereolithography (SLA)-based techniques[10,11]. The use of these AM technologies will enable the generation and mimicking of complex blood vessel networks under controlled conditions. It offers the freedom to design a vascular network. Currently, some research groups have successfully constructed and tested branched vascular vessels[5,12–16]. Wu et al.[14] used fugitive inks to print solid template within the substrate and then removed the ink to create microchannels. Hinton et al.[17] invented a freeform reversible embedding of suspended hydrogels method (called FRESH in their paper) to print hydrated materials which enable printing of complex vascular architectures. However, in their work, vascular networks were printed with little understanding of the physiological demands. There is currently a lack of detailed and validated guidance for the design of artificial vascular networks of skin scaffolds.
In our previous work[18,19], a set of design rules were developed for designing one single artificial vascular branch made by 3D printing. This paper focuses on further development of design rules for complex artificial vascular networks based on multiscale physiological demands. At the microscale, the local bifurcation design needs to ensure that the shear stress on the vessel wall is in the healthy range. The wall shear stress (WSS) is a critical hemodynamic indicator that affects endothelial cell development[20–23]. WSS outside the normal range between 1Pa to 7Pa[24] is considered harmful to vessel development and may lead to cardiovascular diseases[20,25,26]. Many researchers have found that the branching angles have a significant effect on WSS in the bifurcation of a branch vessel[27–31]. Another physiological requirement at the micro-scale is to ensure minimal recirculation areas where nutrient and oxygen may be trapped. At the macro-scale, the main objective of the design is to maximise the nutrient supply and the waste exchange to surrounding tissues and cells. This can be achieved in two ways: firstly, the blood resistance needs to be minimized to use minimal energy supplying surrounding cells; secondly, the artificial network needs to cover the greatest area of the skin patch to achieve a satisfactory and uniform nutrient supply. While the final design will be limited to a two-dimensional geometry; it could be converted to enable 3D structures by stacking repeated copies. The optimized vascular network will be then constructed using SLA. SLA has advantages in printing micro vascular vessel networks due to 1) its high resolution, 2) its ability to produce flexible materials and 3) its easy to control ability. The photocurable resin used in the project has advantages of elasticity, biocompatibility and surface readiness for “bio-coatability”. Preliminarily physical validations were carried out in vitro to show that the optimised artificial vascular network can support cells in an adipose scaffold. Though further in vitro investigation is needed to provide systematic results, the work presented in this paper provides significant results to tissue engineering researchers. Together with previous studies, a complete design methodology for 3D printing an artificial vascular network has been fully developed and preliminarily tested.
2. Design Rules of Vascular Network
Previous design approaches to optimise a vascular network have been based on the minimisation of the sum of the energy required for pumping blood through the network and the energy required for the metabolic supply of the blood volume. To minimize the energy, Murray’s law is applied[32,33]:

Using Murray’s law, the radii of daughter vessels (Rd1 and Rd2) can be obtained based on the radius of their parent vessels (Rp). It has been confirmed that most natural vascular systems follow Murray’s law[34]. A volume minimisation routine was applied in the design method to determine the position of the branching point. These technologies were used recently by researchers to generate different vascular systems[35,36]. However, several issues were not considered in their research due to the restrictions imposed by the traditional method used to manufacture the artificial vascular vessels. Firstly, the branches were created using straight tubes, and the vascular branching design was missing. The second issue is that nutrient diffusion through the vessel wall to the surrounding cells was not considered in their design. Unlike previous attempts, the application of 3D printing enables arbitrary vascular system design. In this work, we addressed these issues by developing comprehensive design rules for 3D printing artificial vascular networks to be embedded in tissue-engineered skin models.
The main parameters considered in our design can be described in two categories: 1) the macroscale parameters and 2) the micro-scale parameters. The macro-scale parameters include branch levels and branching point locations. The micro-scale parameters include branch angles, vessel diameters, the daughter vessel asymmetry ratio, the wall shear stress and the recirculation areas. Their definition and illustration are shown in Figure 1.
Figure 1.
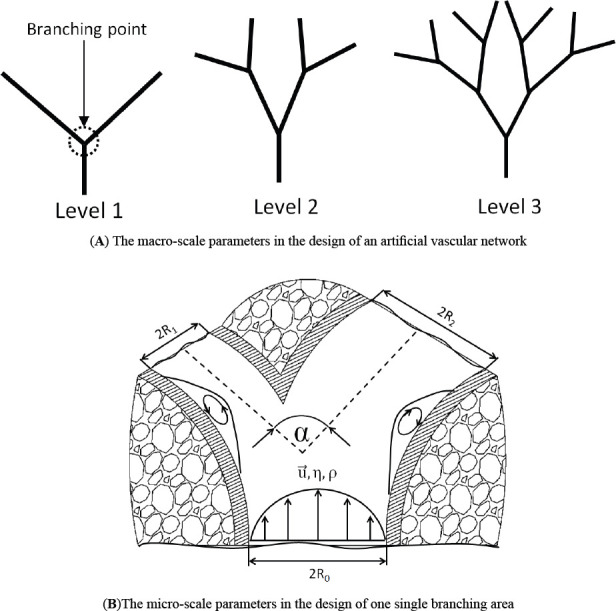
The macro-scale (A) and the micro-scale (B) parameter definitions.
In Figure 1(A), branch levels and branching point are illustrated while Figure 1(B) demonstrates parent diameter Rp , daughter diameters Rdl and Rd2, total branching angle α, blood velocity μ⇀, viscosity η, density ρ and WSS τ and the recirculation areas. In the following sub-sections, developing the design methodology at both scales is the main objective.
2.1 The macro-scale design (vascular system configuration design)
First of all, in this design, we focused on bifurcations because, in normal vasculature, around 98% of blood vessels bifurcate at each junction, while only 2% trifurcate[22,37]. We also limit our design to a 2D plane. 3D structures can be formed by stacking some 2D vascular systems. The locations of the branching points are evenly distributed on the skin patch, which can be illustrated in Figure 2.
Figure 2.
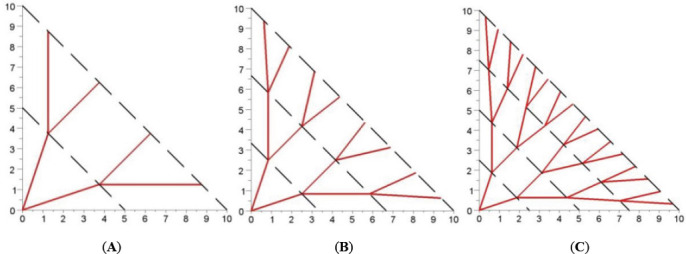
Distributed configuration of the vascular network with different branching levels: A) 2 levels, B) 3 levels and C) 4 levels.
The position of a point Mij belonging to the ith branching level and being the jth on it are given by the equation below:

where, A is the width of the skin patch, B is the length of the skin patch. This configuration is selected because it shows less sharp turns than Kamiya’s configuration[38], which minimised the volume of the vascular system. It also shows less agglomeration close to the branching points. The pressure drop at each branching point in the same level is set to be identical:

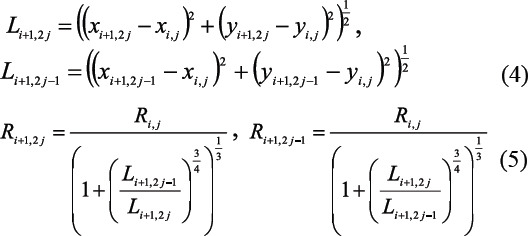
Equations (4) and (5) are derived from equations (1–3) which enable the calculation of the length and the radius of each vessel in the vascular system, respectively:
As the main function of the artificial vascular network is supplying the tissue and cells with nutrients and removing metabolic products nutrient diffusion performance into the area between vessels is a determining design factor. Fick’s law and Michaelis- Menten kinetics were applied to investigate the nutrient diffusion and cell consumption performance of the proposed configuration with different branching levels,

where D is the nutrient diffusion coefficient rate which is selected as D = 5.7×10⁻¹⁰m2s-1, C is the concentration of the nutrient, ε is a characteristic metabolic time which is depend on cells. Experimental studies[39] show that the metabolic rate of glucose in adipose tissue is around 500 s and in skeletal muscle is approximately 545 s. The metabolic time and the diffusion coefficient can be combined in a characteristic length called “penetration depth” dp defined as:

We define a parameter P to measure the performance (quality) of the vascular configurations:

where Vlive is the volume of the skin model occupied by living cells while is Vtotel the total volume of the skin model. The total volume is composed of the volume occupied by the blood vessel system (i.e. there is a “penalty” for the performance if a complex (i.e. large) vessel system is used), the volume of the substrate Vlive which is sufficiently supplied by nutrients, and the volume Vdead which does not provide enough nutrients to the cells in order to survive. The threshold glucose concentration Ccrit which needs to be reached to supply cells adequately was set to Ccrit = 2.2 mM. Below this concentration, severe symptoms of hypoglycaemia occur. Finite difference method was used to solve the equation (6). In this work, we obtained a diagram illustrating the relationship between performance and the penetration depth dp for different levels of vascular vessels, shown in Figure 3.
Figure 3.
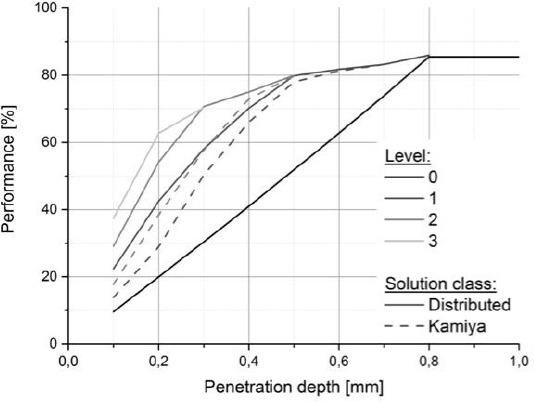
Comparison of performance P of a 5mm wide patch for the branching levels from 0 to 3.
In Figure 3, two conclusions can be made. Firstly, the value of performance P obtained from the distributed configuration is larger than that in the Kamiya configuration. Secondly, a higher-level configuration has a larger P using the same penetration depth. Based on this, it is possible to select the “least complex” vessel system, which is necessary to achieve the optimal performance. A three-level distributed configuration was therefore determined and it is at least complex and relatively high performance. The first configuration sketch of the vascular system is shown in Figure 4.
Figure 4.
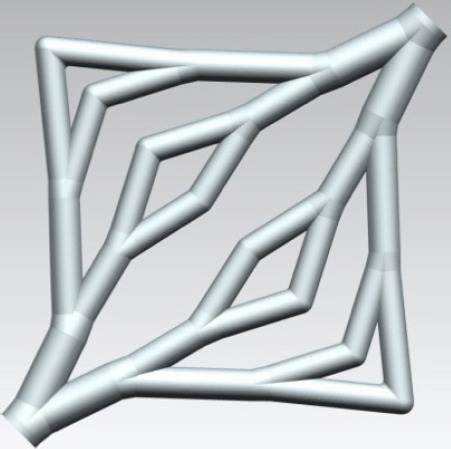
the first version of the vascular system
2.2 Micro-scale design
Endothelial cells are programmed to respond to mechanical stimulation[24–26]. Endothelial cells in vivo are typically exposed to, and presumably adapted to, a normal level of shear stress in the range of 1 Pa to 7 Pa[24]. The endothelial stimulation theory says that when the WSS is higher than 7 Pa, it can damage the endothelial cells during vascular remodelling while a WSS lower than 1 Pa will form plaque due to insufficient mechanical stimulation on endothelial cells[24]. Therefore, the local geometry optimisation will take place based on the endothelial stimulation theory.
According to Khamassi et al.[40], the WSS in a vascular bifurcation is related to two local parameters. They are R+, the asymmetry ratio and α, the total bifurcation angle. The definition of α is shown in Figure 1(B) and R+ is calculated using equation (9):

Khamassi et al.[40] established a CFD simulation to analyse how φtotal and R+ effect the minimal WSS at bifurcation junctions. They also generated a diagram to explain their correlations. This diagram is used as a guide for selecting the bifurcation angles shown in Figure 5.
Figure 5.
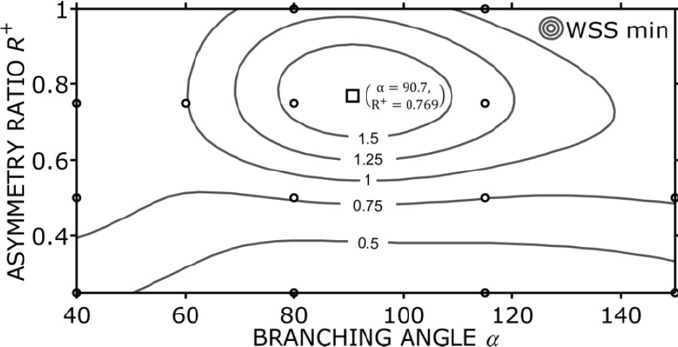
WSS as a function of the bifurcation geometry.
In Figure 5, the circles represent the founding WSS using different combinations of R+ and α. The contour lines in Figure 5 demonstrate the interpolated WSS values based on the founding values. A distinct optimum appears when R+ = 0.769 and α = 90.7 degrees, which is shown as a square in Figure 5. This diagram suggests that the branch angle and the asymmetry are the major geometry parameters of physiological bifurcations. The selection of bifurcation angle and the asymmetry should be in the range of the contour lines to lead to a proper function: the bifurcation angle ranges from 60° to 140° while the asymmetry ratio ranged from 0.6 to 1. Previous vascular optimisations did not consider WSS. The presented design rules for vascular bifurcations addressed this shortage. In the first version of the vascular system, we checked all the bifurcation angles and the asymmetry and found out that two bifurcation angles are out of the range. An algorithm was then developed to fix this problem automatically.
In Figure 7(A), the farthest branch angles in the third branching level are out of the range discussed in Figure 5, which are circled. The correction algorithm is shown in Figure 6. The main idea is to add another turning point to achieve a moderate branching and turning. In Figure 6, the two red margins are the boundaries of the skin patch. The original branches in level 3 are marked as l0 and l1. The algorithm is described as following 6 steps:
Figure 7.
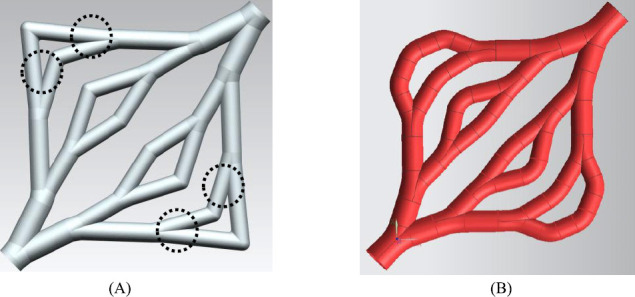
the new version of the vascular system
Figure 6.
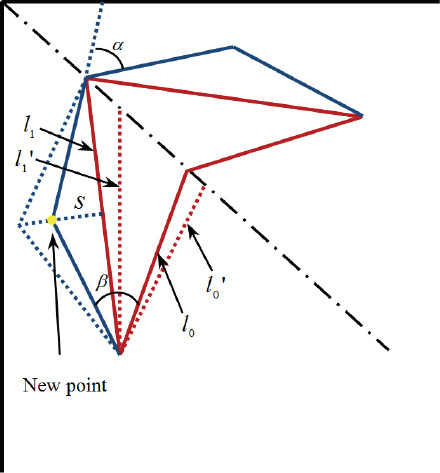
The correction algorithm
Step 1: Choose a small value of s = s0, and then calculate angles b1 and α;
Step 2: s = s0+Δs until φtotal_min <b1< φtotal_max and α<45°
Step 3: get the “new point”; if the new point is inside the patch, go to step 4; else go to Step 5;
Step 4: Update the diameters of these new vessels using according to equation (5);
Step 5: Get a new l0and l1 (dashed lines in Figure 6), then go to step 1;
Step 6: End of the algorithm.
By applying this algorithm, an update vascular system is shown in Figure 7(B).
From Figure 7(A), it is shown that sharp junctions are used in all bifurcation points. These sharp apices at junctions of bifurcated vessels need to be avoided because they are considered as risk factors for local mechanical weakness[23]. Rounding the apex at each junction can be one of the solutions. The authors developed an algorithm of computational geometry for the construction of vascular branches using a rounded apex[18,19]. CFD simulations were also carried out to test the design and they concluded that rounded junctions in the bifurcation branch result in a more uniform WSS distribution compared to sharp junctions. They also concluded that the construction generated using their algorithm will minimise the recirculation area and thus minimise the trapped nutrient and oxygen. This algorithm was applied to employ rounded junctions instead of sharp joints. the STL file of the vascular system will also be generated automatically[18,19] using this algorithm.
2.3 The design summary and the porous vessel wall generation
To optimise a vascular network embedded in the skin patch to supply tissues and cells nutrient and oxygen, exchange waste and to support angiogenesis, we considered the design criteria in both macro-scale and micro-scale. It can be described as four criteria, which are:
(a)To maximise the nutrient supply and waste exchange
(b)To minimise the resistance to blood flow
(c)To ensure the shear stress on the vessel wall is in the healthy range
(d)To avoid the blood recirculation.
Using the methodology discussed in sections 2.1 and 2.2; these four criteria can be achieved. Additionally, the final construction of the vascular system is easy to transfer to the STL file format. Actual blood vessel walls are of a semi-permeable material, and thus enable diffusion of nutrients, oxygen, waste products and CO2, from and to the blood flow. This function is however difficult to reproduce with materials compatible with AM techniques. Instead, our proposed solution aims to enable the diffusion through engineered pores in the vascular walls. Because of the limited spatial resolution and relatively slow build-up time offered by AM equipment, direct manufacturing of capillaries with smaller diameters (< 10 μm) is infeasible. The pores were also designed to enable angiogenesis – the natural generation and growth of new vessels out of the vessel pores. This approach allows the smaller capillaries to extend where they are needed the most. The pore diameters were engineered to maximise the diffusion rate (yielding a lower pore diameter bound for pore radii range), support angiogenesis, enable steady blood circulation inside the vessels and maintain their manufacturability via AM system (yielding an upper pore diameter boundary). The conical pores were selected with larger outer diameter pore diameter and smaller inner diameter. This type of pore leads to a reduction of the pore diameter without the formation of membranes. The design of the conical pore is shown in Figure 8.
Figure 8.
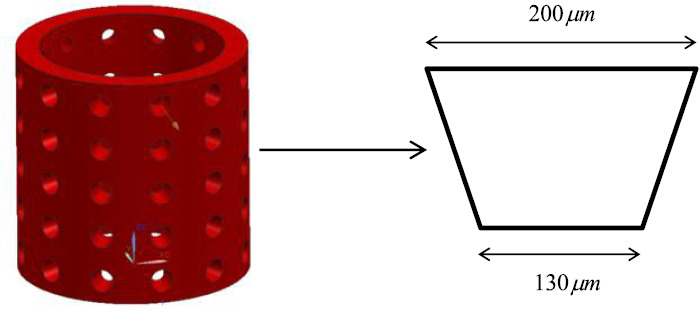
the design of the conical pore on the vascular vessel wall.
3. Material and Methods
3.1 Photocurable resin and photoinitiator
The material selected in this work needs to have appropriate viscosity and polymerisation characteristics to allow it be printed successfully. Additionally, it also needs to have vessel-like properties, such as appropriate elasticity, biocompatibility and surface readiness for bio-coatability. The material chosen for this study consisted of three monomers plus a photoinitiator. The formulations are BPA-ethoxylated-diacrylate, lauryl acrylate and isobornylacrylate (BLI) shown in Figure 9.
Figure 9.
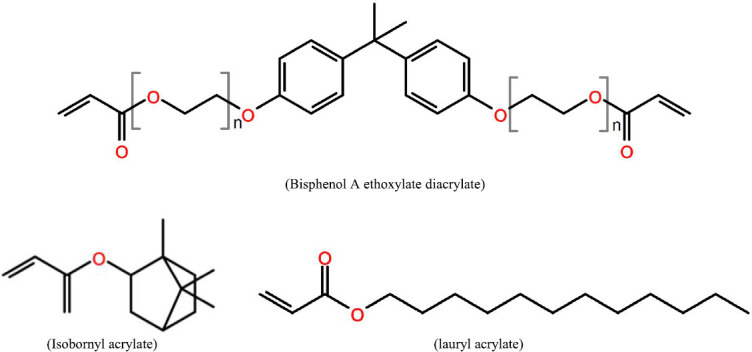
Three monomers in this composite
Three types of photo-initiator were tested to select the most appropriate one that has the lowest cytotoxicity. They are Irgacure® 184, Irgacure® 2959 and Irgacure® 369. BLI samples with three photoinitiators were investigated by the two methods WST-1assay (three replicates of each kind of a material; characteristic of the sample: diameter: 14 mm, height: 1–2 mm, weight: 200 mg) and live/dead assay (characteristic of the sample: diameter: 14 mm, height: 2–3 mm, weight: 300 mg). All samples were disinfected in 70 % ethanol for 30 min (meanwhile the samples swelled), washed two times for 30 min with PBS and equilibrated in cell culture medium. For both methods the mouse fibroblast cell line (3T3) was used, cultured in DMEM with glutamine (Biochrome AG, Berlin, Germany) containing 10% fetal calf serum, 50 U/mL penicillin, and 50 μg/mL streptomycin under 5% CO2 atmosphere at 37 °C.
For live/dead assay the cells were seeded at 25,000 cells/cm2, and after 1, 4 and 14 days, the cells on the samples were stained by adding a twofold concentrated solution consisting of 30 μg/mL fluorescein diacetate (FDA) and twofold GelRed (VWR International, Darmstadt, Germany). Fluorescence staining was captured by Axiotech microscope with filter sets FS09 and FS14 (Carl Zeiss Microscopy, Jena, Germany). Living cells showed a bright green fluorescence, whereas dead nuclei appeared in red. Fluorescence micrographs from BLI samples had to be contrasted by image processing due to the high background fluorescence.
In the WST-1 assay, eluates from different specimens were tested for cytotoxic components. The specimens were eluted by incubation in complete cell culture medium for 24 h and following periods at 37 °C. According to ISO norm 10993-5 a volume of 1 mL medium was applied per 0.2 g material. Eluate samples were taken after 1, 2, 3, 6, 7, 8, 9, 10, 13, 15, 17, 21 and 24 days and the medium was completely renewed. The elution period day 0–1, 1–2, 2–3, 6–7, 10–13 and 21–24 was finally tested. For this 3T3 cells have been pre-cultured for one day in a 96 well tissue culture plate inoculated with care with about 8,000 cells per well. Then the medium was changed against the eluate samples (four replicates from each eluate sample resulting in 12 replicates representing the same material sample) and cells were incubated with the eluates for 24 hours under cell culture conditions at 37 °C in a 5% CO2 atmosphere. The negative control (representing no cytotoxic influence) received pure cell culture medium whereas the positive control (representing highest level of cytotoxicity and complete inhibition of dehydrogenase activities) were obtained from wells without cells containing only culture medium. Eluate samples and controls were changed after 24 hours against medium with WST-1® reagent but without phenol red and cultured for about 20 minutes to 1 hour. Formation of coloured formazan was measured by the optical density at 450 nm. The development of dye intensity was kept under control to measure at a time point, when the optical density of the negative control was between 0.2 and 0.6. Relative dehydrogenase activity was calculated after subtracting the mean of the positive controls by dividing the obtained values through that of the averaged negative controls according to x̅re1 = (x̅ – PC̅)/NC̅. By this procedure measured activities were placed on a scale between 0 (positive control) and 1.0 (negative control) or above.
3.2 AM manufacturing using stereolithography (SLA)
SLA was developed in 1980’s and was one of the first commercial AM processes[41,42]. Conventional SLA machines have vertical resolutions in the range of 150 μm. Further developments known as “micro SLA” can create geometries with high complexity[ 43] and with resolutions below 150 μm in all three spatial directions. Behind the background of biomimetic structures, layer heights of less than 10 μm, e.g. allow the replication of capillaries that are essential for the metabolism in the tissue. Alternative AM methods are not able to produce such high-resolution structures[13,44,45]. The high resolution of AM cell scaffolds or membranes enables targeted cell alignment, cell growth and cell interaction[44,46]. The SLA process relies on a photo-polymerisation process and suitable resins consist of monomers and photo-initiators (PI) that are typically toxic. Consequently, for biomedical applications, it is paramount to guarantee that the PI degrades completely during the polymerisation process. This challenge can only be overcome by interdisciplinary process improvement, including material, SLA-process and environmental conditions since in state-of-the-art implementations a typical degree of polymerisation is between 40–70% resulting in a considerable amount of remaining PI[47]. A promising approach to guarantee complete polymerisation and to prevent the formation of unwanted compounds uses inert atmosphere. Only in the absence of oxygen, it is possible to achieve complete crosslinking and full disappearance of cytotoxic PI and monomers. The SLA process was developed in this work to produce the vascular network. Figure 9 illustrates the setup of the SLA process. It consists of a 3 illustrates CryLaS GmbH, Germany), a scanner system (ProSeries PS1 Scan Heads - Cambridge Technology) with an F-theta lens (f=100mm) for fast beam deflection in x-y-direction. The polymer bath was positioned on a platform connected to a piezo-axis to allow positioning in the z-direction. For process development, different photo resins in combination with a photo-initiator 355 nm were investigated. Detailed SLA setting is shown in Figure 10.
Figure 10.
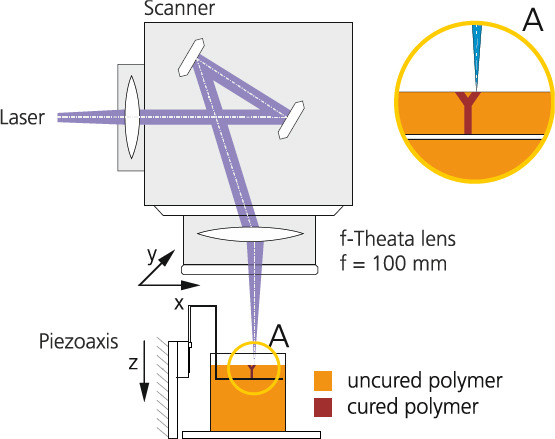
SLA process setups.
3.3 Degradation test method of a printed tube
Degradation tests were carried out using dip coated tubes and SLA fabricated tubes. Quantification method of degradation was similar to ISO 10993-13. Dip coated tubes were prepared by dipping a mandrel with a diameter of 1.1 mm in the BLI with Irgacure® 184 resin and cured manually six times for a minute under an argon-filled beaker by turning the mandrel gently. After the sample was exposed to 50% ethanol for 5 minutes, tubes are pull up from the mandrel, dried in vacuum and irradiated for another 5 minutes under an inert condition with UV light. SLA fabricated tubes were prepared as discussed in the previous section. Two groups of dip coated samples, and two groups of SLA fabricated tubes were treated at 36 °C in each case in PBS buffer or 3% H2O2 for two months. The difference in weight of all samples was determined and analysed.
3.4 In vitro testing of the vascular network
3.4.1 3.4.1. Cell Culture
Human adipose-derived stem cells (hASCs) and pericytes were isolated from human tissue derived from patients that underwent regular surgical treatment and signed an informed content at the BG University Hospital Bergmannsheil in Bochum, Germany. The hASCs were cultured in DMEM-HAMS-F12, and the pericytes were cultured in a pericytes-growth-medium (PGM, PromoCell).
3.4.2 3.4.2. Cell Seeding
In the context of the study as a scaffold methacrylated gelatin (5%; IGB) was used[5]. Using methacrylated gelatin and a photoinitiator (LAP; INN) a stable hydrogel was created. Within this hydrogel, three diverse species of cells were spread: 600,000 HUVECS, 600,000 hASCs and 60,000 pericytes. In the hydrogel three different shapes of tubes were created: 1) a stainless steel moulded tube, 2) a single tube printed using BLI with Irgacure® 184 and 3) a branched network printed using BLI with Irgacure® 184.
3.4.3 3.4.3. The bioreactor system
The bioreactor system was developed in[27] driven by a pump-sleeve-system to deliver medium (620 μL/min) to the hydrogels. The pump was connected to a nutrient bottle and the hydrogel containing chamber (see Figure 11). To run the bioreactor system a medium mixture was performed in the same ratio as the corresponding cells were distributed. The hydrogels were at least cultured and 37°C and 5% CO2 for seven days.
Figure 11.
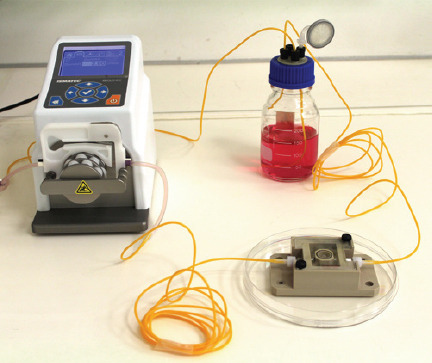
The bioreactor system used for the tube supported tissue culture. It is connected to a medium reservoir and a peristaltic pump delivering culture media through stainless steel moulded, a single BLI with Irgacure® 184 tubes or a branched BLI with Irgacure® 184 tubes.
3.4.4 3.4.4. Cell staining
After seven days a live/dead assay was performed staining the hASCs with Calcein (green) and Propidiumiodid (red).
4. Results and Discussion
4.1 4.1. Cytotoxicity testing for photoinitiators
Firstly, in the live/dead assay, to evaluate the cytotoxic effect observable in case of direct contact of the cells to the material, the percentage of dead cells was determined by manually counting live and dead cells from fluorescence micrographs (Figure 12). Below 5% dead cells (during longer culture below 10%) was considered to be not cytotoxic since this can be observed in control cultures too. Low cytotoxicity is assumed from 5% to 20% dead cells, moderate cytotoxicity is from 20% to 50%, and high cytotoxicity is above 50%. Already the viability staining revealed the high cytotoxicity of BLI with Irgacure® 2959, where no viable cells could be detected even at higher magnification. In contrast, cells at BLI with Irgacure® 184 and at BLI with Irgacure® 369 developed higher cell densities from about 135–225 to 360–625 cells/mm2 during culture time and had less than 10% dead cells (Table 1).
Figure 12.
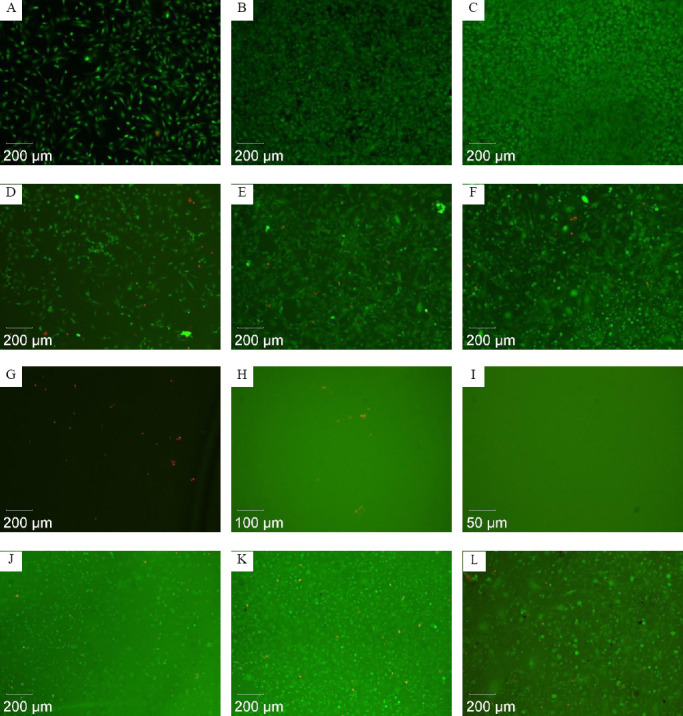
Fluorescence micrographs showing representative results of viability staining of 3T3 cells cultured for one day (left column), 4 days (middle column), and 14 days (right column) at samples of the reference material glass (A–C), at BLI with Irgacure® 184 (D–F), at BLI with Irgacure® 2959 (G–I), and at BLI with Irgacure® 369 (J–L).
Table 1.
Levels of cytotoxicity determined by live/dead staining.
| Material | Control (glass) | BLI with Irgacure® 184 | BLI with Irgacure® 2959 | BLI with Irgacure® 369 |
|---|---|---|---|---|
| Day 1 | No cytotoxicity | No cytotoxicity | High cytotoxicity | No cytotoxicity |
| Day 4 | No cytotoxicity | Low cytotoxicity; increased number of cells from day 1 to day 4 | High cytotoxicity | Low cytotoxicity; increased number of cells from day 1 to day 4 |
| Day 14 | No cytotoxicity | Low cytotoxicity | High cytotoxicity | Low cytotoxicity |
The results of the WST-1 assays are presented in Figure 13 as boxplot diagrams for each kind of material and the different periods of elution. The relative dehydrogenase activity was determined by subtraction of the averaged blank value (identical with the positive control) from the raw data at first, and subsequent division of all blank corrected values by the averaged negative control (defining an activity value of 1.0 (100%) for the metabolic rate of untreated cells). Relative dehydrogenase activities were divided into the categories “no, low, moderate, and high cytotoxicity” by the separation limits 0.9, 0.75, 0.5, and < 0.5. The materials BLI with Irgacure® 2959 and BLI with Irgacure® 369 released cytotoxic compounds during the first two days of elution: revealing moderate to strong cytotoxicity at day 1 and weak to moderate cytotoxicity at day 2. The material Irgacure® 184 did not cause cytotoxicity at day 1 and a weak moderate at day 2.
Figure 13.
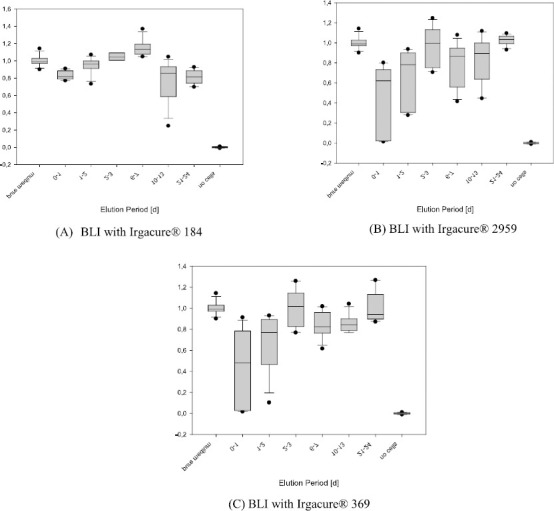
Results of the WST-1 assays. The Box-whisker-plots indicate the median in the centre of the box, 25th and 75th percentile by the lower and upper margin of the box, 10th and 90th percentile by the whiskers and values outside this range.
BLI with Irgacure® 184 showed no to low cytotoxicity in both live/dead and WST-1 assay. For the sample BLI with Irgacure® 2959, very high cytotoxicity was found in the live/dead assay. Although for the sample BLI with Irgacure® 369 no or only low cytotoxicity was observed in the live/dead assay, a release of cytotoxic compounds was detected at the beginning of elution. Besides, the data from staining could only poorly be assessed because these samples showed a very high background fluorescence and possibly not all cells were counted. Therefore, BLI with Irgacure® 184 showed the best results in both assays. Although this kind of photocured tube material was not wholly free of cytotoxicity, it should be well accepted in the current medical application.
4.2 The printed vascular vessels
To define a reliable process regime, PI concentration (0.5 wt% and 1 wt%), scan speed (5–600mm/s), layer thickness (30μm, 100μm 150μm) and the distance between two lines were varied. Firstly, photo resin 3D-03H-87, Marabu with 1wt% PI was used in printing to get the best set of parameters, which were 15 kHz, power: 10.1 mW, scan speed: 80 mm/s, line distance 30μm and a layer thickness: 800μm. Non-crosslinked photo resin was washed away with ethanol (70%). Postcuring with a UV-lamp was necessary. Linear tube structures have been investigated with scanning electron microscopy as shown in Figure 13 (A–C).
A branched vessel system was also printed from this material using the above parameters, shown in Figure 14 (D). It has been proven that this SLA system can print the vascular network designed in section 2. However, the first test material is stiff and not proven for biocompatibility. BLI with Irgacure® 184 was then printed for its use in stereolithography with the same set of parameters. We could show that by using the SLA technique, the designed branched blood vessel network could be structured. The structure of the printed vascular network using BLI with Irgacure® 184 with pores is shown in Figure 15. The printing accuracy of angles and pores was tested by flow test with dye solution. We could demonstrate that all pores are open. In first experiments we observed, that branching angles show irregularities due to pores or problems from data slicing. After correcting this a homogeneous flow through the vessel system was observed. Long-term studies with seeded surfaces and a blood equivalent have to be done in later studies, to show the effect on cells.
Figure 14.
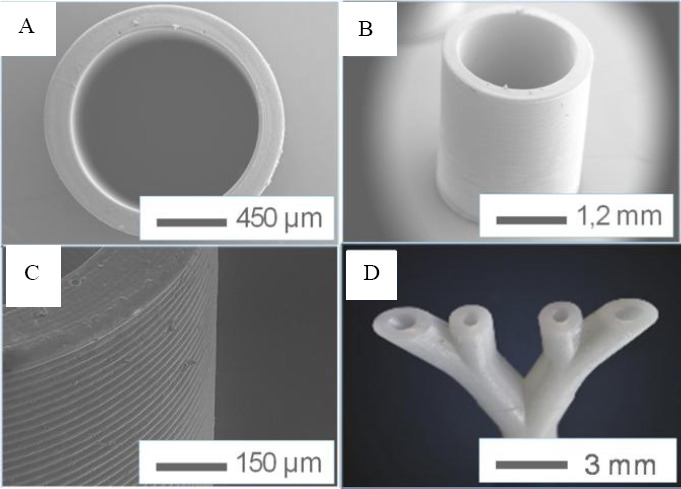
Structures of the linear tube in different scales (A to C) and the structure of the branched tube (D).
Figure 15.
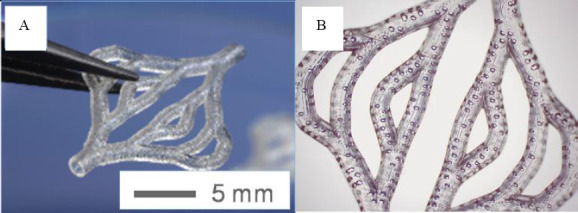
the structures of the printed branched vessel network using BLI with Irgacure® 184 with pores.
4.3 Degradation test of a printed tube
The gravimetric analysis of the dip-coated tubes shows a slight mass loss of approximately -1% (-1.9%) after two months shaking in PBS buffer (H2O2 respectively) with a standard deviation of 0.5% (1.9%). The results of the tubes show no uniform degradation behaviour, which would have to be expressed in a mass decrease. In some measurements, even mass increases were observed, which could probably be due to inclusions of PBS salts. Overall, it is assumed that the inconsistent results in the stereolithographic samples are due to a nonhomogeneous production method and the results show no significant degradation effect rather than the washing out of not reacted monomers and inclusion effects since we could not observe structural changes of the samples by sight test. The more uniform results with less scattering of the dip-coated samples show, although very low mass loss both in the hydrolytic and oxidative cases. So we can assume a very slow degradable material.
4.4 In vitro testing
hASCs were evaluated regarding their viability using a live/dead assay for seven days of culture. Results of cell viability are shown in Figure 17. Figure 17 illustrates the cell vitality within a 1 x 1 cm hydrogel supported via a stainless steel moulded central tube (Figure 17(A)), an SLA-formed branched PA tube containing pores (Figure 17(B–C)) and a single central SLA-formed PA tube containing pores (Figure 17(D)). By comparing Figure 17(A,B), it is demonstrated that the ability of a branched tube can support the whole volume more appropriately compared with the central steel tube. Additionally, it is also shown that the surrounding cells get in contact to parts of the material, infiltrating the pores (in Figure 17(C)) and form more complex structures within the hydrogel (in Figure 17(D)).
Figure 17.
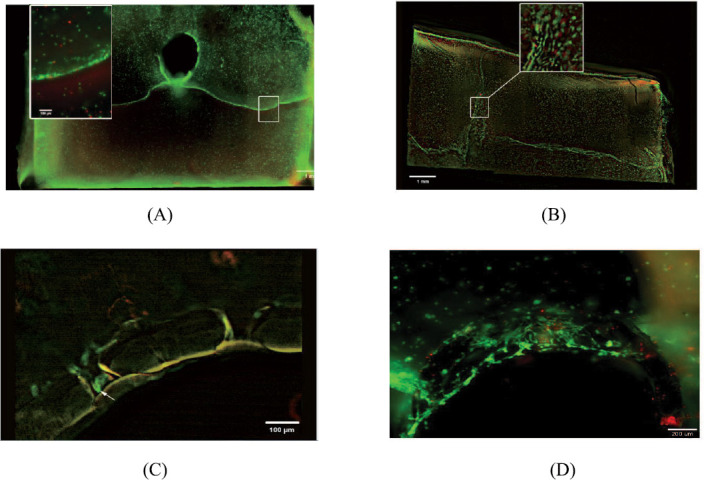
Cell vitality within a 1 x 1 cm hydrogel supported via (A) a stainless steel moulded central tube; (B,C) a branched BLI with Irgacure® 184 tube containing pores; (D) single central SLA-formed BLI with Irgacure® 184 tube containing pores.
Figure 16.
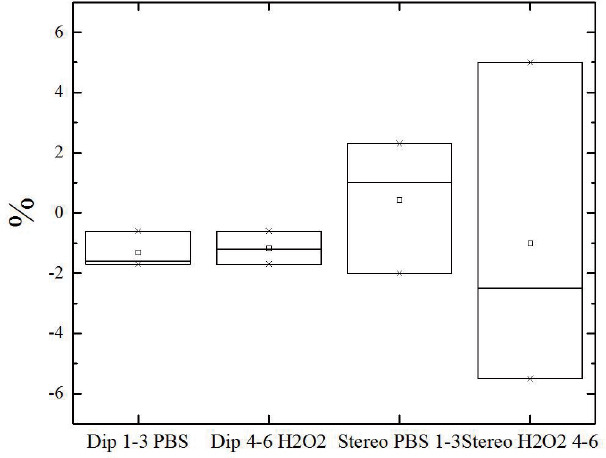
Blot-Plot results from gravimetric study dip-coated tubes (DIP) and fabricated by SLA (Stereo) to observe hydrolytic degradation in PBS buffer (pH = 7.4) and oxidative degradation in 3% H2O2.
Figure 18 gives a preliminary comparison of dead cell rate with different embedded tubes. It can be seen from this picture that after seven days, cell death rate in the branched vessel is the lowest (27%) compared with the pure hydrogel (35%) and hydrogel with a single tube (55%).
Figure 18.
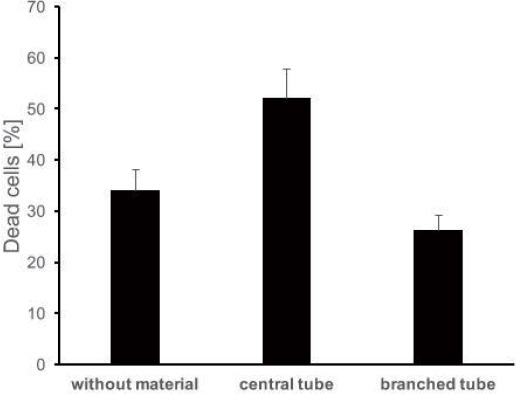
The dead cell rate (%) after seven days with no embedded tube, single tube and branched tube (sample size for each is 3).
The pure hydrogel used as a scaffold in this work has proven to be non-toxic and has a good biocompatibility. This can also be seen in Figure 18 that the pure hydrogel scaffold has less than 50% percent cell death rate after seven days. The curable resin made of BLI with Irgacure® 184 was proven to be biocompatible and cytocompatible among other photopolymers used in the previous testing in section. However, when a single tube was embedded in the scaffold, the cell death rate increased after seven days compared with the pure hydrogel scaffold. This may be a reason for sub-optimal nutrient supply. The cell death rate was decreased significantly by embedding an optimised branched vascular vessel network into the scaffold. It shows a sharp drop (from 55% to 27%) of the cell death rate. This testing indicates that using the optimised vascular network, cells viability may be improved by having a better oxygen and nutrient supply from the bioreactor. Further investigations are needed to determine the longterm cell survival and the further behaviour of the cells in the bioreactor system.
5. Conclusion and Future Work
In this paper, an optimised vascular network was developed using a set of comprehensive design rules. These design rules considered the physiological requirements in both macro- and micro-scales. The optimised vascular network has several advantages: 1) this design provides the maximum nutrient supply with minimal complexity; 2) this design minimises the recirculation areas and 3) this design allows the WSS on the vessel in a healthy range. Suitable photo-curable resin with photoinitiators was then selected based on the WST-1 assays and live/dead assays. The results show that BLI with Irgacure® 184 has the lowest cytotoxicity among three and it is the best candidate used in SLA for printing the design. Preliminary in vitro studies were carried out by integrating the artificial vascular vessels into an adipose tissue scaffold. The in vitro study only has two tested time steps, and the results show that branched resin made vascular network has the lowest cell death rate compared with the pure hydrogel scaffold and the hydrogel scaffold embedded with a single tube. The design and manufacturing route for vascular vessels developed in this paper proven to be feasible and have potentials to be further developed. Plan of the future work following this paper will be, 1) more in vitro experiments need to be carried out in order to validate the design; 2) in the current skin model, they surrounding hydrogel is biodegradable which allowing remodelling in vivo. Currently, the material (BLI) used to manufacture the vascular network is none or very slow degradable according to the degradation analysis. The biodegradable polymer will be used to manufacture the vascular network allowing remodelling; 3) top skin layers (epidermis and dermis) will be added to the skin model as complete skin integration.
6. Acknowledgement
This work is part of the project ArtiVasc 3D (http://www. artivasc.eu/). It is financially supported by the European Union’s Seventh Framework Programme (FP/2007-2013) under grant agreement No. 263416 (ArtiVasc 3D). The authors thank Dr Kirsten Borchers (Fraunhofer IGB, Germany) for providing methacryl-modified gelatin, and Dr Birgit Huber (formerly University of Stuttgart, Germany), Dr Petra Kluger (formerly Fraunhofer IGB, Germany) and Ivan Calderon (Unitechnologies SA, Switzerland) for design and production of the perfusion bioreactor.
References
- 1.Ng WL, Qi JTZ, Yeong WY, et al. Proof-of-concept:3D bioprinting of pigmented human skin constructs. Biofabrication. 2018;10(2):025005. doi: 10.1088/1758-5090/aa9e1e. https://doi.org/10.1088/17585090/aa9e1e. [DOI] [PubMed] [Google Scholar]
- 2.Ng WL, Wang S, Yeong WY, et al. Skin Bioprinting:Impending Reality or Fantasy? Trends Biotechnol. 2016;34(9):689–699. doi: 10.1016/j.tibtech.2016.04.006. https://aoi.org/10.1016/j.tit>tech.2016.04.006. [DOI] [PubMed] [Google Scholar]
- 3.Rose FR, Oreffo RO. Bone Tissue Engineering:Hope vs Hype. Biochem Biophys Res Commun. 2002;292(1):1–7. doi: 10.1006/bbrc.2002.6519. https://doi.org/10.1006/bbrc.2002.6519. [DOI] [PubMed] [Google Scholar]
- 4.Radisc M, Yang L, Boublik J, et al. Medium perfusion enables engineering of compact and contractile cardiac tissue. Am J Physiol Heart Circ Physiol. 2004;286(2):H507–H516. doi: 10.1152/ajpheart.00171.2003. https://doi.org/10.1152/ajpheart.00171.2003. [DOI] [PubMed] [Google Scholar]
- 5.Hoch E, Tovar G, Borchers K. Bioprinting of artificial blood vessels:current approaches towards a demanding goal. Eur J Cardiothorac Surg. 2014;46(5):767–778. doi: 10.1093/ejcts/ezu242. https://doi. org/10.1093/ejcts/ezu242. [DOI] [PubMed] [Google Scholar]
- 6.Kannan RY, Salacinski HJ, Sales K, et al. The roles of tissue engineering and vascularisation in the development of micro-vascular networks:A review. Biomaterials. 2005;26(14):1857–1875. doi: 10.1016/j.biomaterials.2004.07.006. https://doi.org/10.1016/ j.biomaterials.2004.07.006. [DOI] [PubMed] [Google Scholar]
- 7.Patrick CW., Jr Adipose tissue engineering:The future of breast and soft tissue reconstruction following tumor resection. Semin Surg Oncol. 2000;19(3):302–311. doi: 10.1002/1098-2388(200010/11)19:3<302::aid-ssu12>3.0.co;2-s. [DOI] [PubMed] [Google Scholar]
- 8.Kamel RA, Ong JF, Eriksson E, et al. Tissue Engineering of Skin. J Am Coll Surg. 2013;217(3):533–555. doi: 10.1016/j.jamcollsurg.2013.03.027. https://doi.org/10.1016/j.jamcollsurg.2013.03.027. [DOI] [PubMed] [Google Scholar]
- 9.Zdrahala R. Small caliber vascular grafts Part II:Polyurethanes revisited. J Biomater Appl. 1996;11(1):37–61. doi: 10.1177/088532829601100102. https://doi.org/10.1177/088532829601100102. [DOI] [PubMed] [Google Scholar]
- 10.Ng WL, Lee JM, Yeong WY, et al. Microvalve-based bioprinting process, bio-inks and applications. Biomater Sci. 2017;5(4):632. doi: 10.1039/c6bm00861e. https://doi.org/10.1039/c6bm00861e. [DOI] [PubMed] [Google Scholar]
- 11.Melchels FPW, Domingos MAN, Klein TJ, et al. Additive manufacturing of tissues and organs. Prog Polym Sci. 2012;37(8):1079–1104. http://dx.doi.org/10.1016/j.progpolymsci.2011.11.007. [Google Scholar]
- 12.Miller JS, Stevens KR, Yang MT, et al. Rapid casting of patterned vascular networks for perfusable engineered three-dimensional tissues. Nat Mater. 2012;11(9):768–774. doi: 10.1038/nmat3357. https://doi.org/10.1038/nmat3357. [DOI] [PMC free article] [PubMed] [Google Scholar]
- 13.Kolesky D, Truby R, Gladman S, et al. 3D Bioprinting of Vascularized, Heterogeneous Cell-Laden Tissue Constructs. Adv Mater. 2014;26(19):3124–3130. doi: 10.1002/adma.201305506. https:// doi.org/10.1002/adma.201305506. [DOI] [PubMed] [Google Scholar]
- 14.Wu W, DeConinck A, Lewis J. Omnidirectional Printing of 3D Microvascular Networks. Adv Mater. 2011;23(24):H178–H183. doi: 10.1002/adma.201004625. https://doi.org/10.1002/adma.201004625. [DOI] [PubMed] [Google Scholar]
- 15.Kucukgul C, Ozler B, Karakas HE, et al. 3D hybrid bioprinting of macrovascular structures. Procedia Eng. 2013;59:183–192. https://doi.org/10.1016/j.proeng.2013.05.109. [Google Scholar]
- 16.Wegener M, Burkhard E, Novosel E, et al. Soft polymers for building up small and smallest blood supplying system by stereolithography. J Funct Biomater. 2012;3(2):257268. doi: 10.3390/jfb3020257. https://doi.org/10.3390/jfb3020257. [DOI] [PMC free article] [PubMed] [Google Scholar]
- 17.Hinton T, Jallerat Q, Palchesko R. Three-dimensional printing of complex biological structures by freeform reversible embedding of suspended hydrogels. Sci Adv. 2015;1(9):e1500758. doi: 10.1126/sciadv.1500758. https://doi.org/10.1126/sciadv.1500758. [DOI] [PMC free article] [PubMed] [Google Scholar]
- 18.Han X, Bibb R, Harris R. Design of bifurcation junctions in artificial vascular vessels additively manufactured for skin tissue engineering. J Vis Lang Comput. 2015;28:238–249. https://doi.org/10.1016/jjvlc.2014.12.005. [Google Scholar]
- 19.Han X, Bibb R, Harris R. Engineering Design of Artificial Vascular Junctions for 3D Printing. Biofabrication. 2016;8(2):025018. doi: 10.1088/1758-5090/8/2/025018. https://doi.org/10.1088/1758-5090/8Z2/025018. [DOI] [PubMed] [Google Scholar]
- 20.Kohler U, Marshall I, Robertson MB, et al. MRI measurement of wall shear stress vectors in bifurcation models and comparison with CFD predictions. J Magn Reson Imaging. 2001;14(5):563–573. doi: 10.1002/jmri.1220. [DOI] [PubMed] [Google Scholar]
- 21.Marshall I, Zhao S, Papathanasopoulou P, et al. MRI and CFD studies of pulsatile flow in healthy and stenosed carotid bifurcation models. J Biomech. 2004;37(5):679–687. doi: 10.1016/j.jbiomech.2003.09.032. https://doi.org/10.1016/j.jbiomech.2003.09.032. [DOI] [PubMed] [Google Scholar]
- 22.Ravensbergen J, Krijger J, Hillen B, et al. Merging flows in an arterial confluence:the vertebra-basilar junction. J Fluid Mech. 1995;304:119–141. https://doi.org/10.1017/ S0022112095004368. [Google Scholar]
- 23.Ravensbergen J, Krijger JKB, Verdaasdonk AL, et al. The influence of the blunting of the apex on the flow in a Vertebro-Basilar junction model. J Biomech Eng. 1997;119(2):195–205. doi: 10.1115/1.2796080. [DOI] [PubMed] [Google Scholar]
- 24.Papaioannou TG, Stefanadis C. Vascular wall shear stress:Basic principles and methods. Hellenic J Cardiol. 2004;46(1):9–15. [PubMed] [Google Scholar]
- 25.Caro CG. Discovery of the role of wall shear in atherosclerosis. Arterioscler Thromb Vasc Biol. 2009;29(2):158161. doi: 10.1161/ATVBAHA.108.166736. https://doi.org/10.1161/ATVBAHA.108.166736. [DOI] [PubMed] [Google Scholar]
- 26.Coppola G, Caro CG. Arterial geometry, flow pattern, wall shear and mass transport:Potential physiological significance. J R Soc Interface. 2009;6(35):1–10. doi: 10.1098/rsif.2008.0417. https://doi. org/10.1098/rsif.2008.0417. [DOI] [PMC free article] [PubMed] [Google Scholar]
- 27.Liu G, Wu J, Ghista DNH, et al. Hemodynamic characterization of transient blood flow in right coronary arteries with varying curvature and side-branch bifurcation angles. Comput Biol Med. 2015;64:117–126. doi: 10.1016/j.compbiomed.2015.06.009. https://doi.org/10.1016/j.compbiomed.2015.06.009. [DOI] [PubMed] [Google Scholar]
- 28.Edelman ER. Vascular Tissue Engineering:Designer Arteries. Circ Res. 1999;85(12):1115–1117. doi: 10.1161/01.res.85.12.1115. [DOI] [PubMed] [Google Scholar]
- 29.Friedman MH, Deters OJ, Mark FF, et al. Arterial geometry affects hemodynamics:a potential risk factor for atherogenesis. Atherosclerosis. 1983;46(2):225–231. doi: 10.1016/0021-9150(83)90113-2. [DOI] [PubMed] [Google Scholar]
- 30.Peng CN, Wang XQ, Xian ZC, et al. The Impact of the Geometric Characteristics on the Hemodynamics in the Stenotic Coronary Artery. PLoS One. 2016;11(6):e0157490. doi: 10.1371/journal.pone.0157490. https://dx.doi.org/10.1371%2Fjournal.pone.0157490. [DOI] [PMC free article] [PubMed] [Google Scholar]
- 31.Rabinovitz RS, Levesque MJ, Nerem RM. Effects of branching angle in the left main coronary bifurcation. Circulation. 1987:IV-387. [Google Scholar]
- 32.Murray C. The physiological principle of minimum work I. the vascular system and the cost of the blood volume. Proc Natl Acad Sci USA. 1926;12(3):207–214. doi: 10.1073/pnas.12.3.207. [DOI] [PMC free article] [PubMed] [Google Scholar]
- 33.Murray C. The physiological principle of minimum work:II Oxygen exchange in capillaries. Proc Natl Acad Sci USA. 1926;12(5):299–304. doi: 10.1073/pnas.12.5.299. [DOI] [PMC free article] [PubMed] [Google Scholar]
- 34.Zamir M. Optimality principles in arterial branching. J Theor Biol. 1976;62(1):227–251. doi: 10.1016/0022-5193(76)90058-8. https://doi.org/10.1016/00225193(76)90058-8. [DOI] [PubMed] [Google Scholar]
- 35.Schreiner W, Karch R, Neumann M, et al. Optimized arterial trees supplying hollow organs. Med Eng Phys. 2006;28(5):416–429. doi: 10.1016/j.medengphy.2005.07.019. https://doi.org/10.1016/j.medengphy.2005.07.019. [DOI] [PubMed] [Google Scholar]
- 36.Kretoeski M, Rolland Y, Bezy-Wendling J, et al. Fast algorithm for 3-D vascular tree modeling. Computer Methods and Programs in Biomedicine. 2003;70(2):129–136. doi: 10.1016/s0169-2607(01)00200-0. [DOI] [PubMed] [Google Scholar]
- 37.Kassab GS, Rider CA, Tang NJ, et al. Morphometry of pig coronary arterial trees. Am J Physiol. 1993;265(1 Pt 2):H350–365. doi: 10.1152/ajpheart.1993.265.1.H350. https://doi.org/10.1152/ajpheart.1993.265.1.H350. [DOI] [PubMed] [Google Scholar]
- 38.Kamiya A, Togawa T. Optimal branching structure of the vascular tree. Bull Math Biophys. 1972;34(4):431–438. doi: 10.1007/BF02476705. [DOI] [PubMed] [Google Scholar]
- 39.Regittnig W, Ellmerer M, Fauler G, et al. Assessment of transcapillary glucose exchange in human skeletal muscle and adipose tissue. Am J Physiol Endocrinol Metab. 2003;285(2):E241–E251. doi: 10.1152/ajpendo.00351.2002. https://doi.org/10.1152/ajpendo.00351.2002. [DOI] [PubMed] [Google Scholar]
- 40.Khamassi J, Bierwisch C, Pelz P. Geometry optimization of branchings in vascular networks. Phys Rev E. 2016;93(6):062408. doi: 10.1103/PhysRevE.93.062408. https://doi.org/10.1103/PhysRevE.93.062408. [DOI] [PubMed] [Google Scholar]
- 41.Gebhardt A. Generative Fertigungsverfahren:Additive Manufacturing und 3D Drucken für PrototypingTooling-Produktion. Carl Hanser Verlag, München. 2013 Available from: https://www.hanser-elibrary.com/doi/ pdf/10.3139/9783446436527.fm .
- 42.Gibson I, Rosen DW, Stucker B. Additive manufacturing technologies:Rapid prototyping to direct digital manufacturing. Springer, US. 2010 https://doi. org/10.1007/978-1-4419-1120-9. [Google Scholar]
- 43.Maruo S, Ikuta K. Submicron stereolithography for the production of freely movable mechanisms by using singlephoton polymerization. Sens Actuators A Phys. 2002;100(1):7076. https://doi.org/10.1016/S0924-4247(02)00043-2. [Google Scholar]
- 44.Engelhardt S, Hu Y, Seiler N, et al. 3D-microfabrication of polymer-protein hybrid structures with a q-switched microlaser. J Laser Micro Nanoen. 2011;6(1):54–58. http://dx.doi.org/10.2961/jlmn.2011.01.0012. [Google Scholar]
- 45.Young S. Blut für Kunstorgane. 2014 Available from: https:// www.heise.de/tr/artikel/Blut-fuer-Kunstorgane-2156687. html .
- 46.Engelhardt S, Hoch E, Borchers K, et al. Fabrication of 2D protein microstructures and 3D polymer-protein hybrid microstructures by two-photon polymerization. Biofabrication. 2011;3(2):025003. doi: 10.1088/1758-5082/3/2/025003. https://doi.org/10.1088/17585082/3/2/025003. [DOI] [PubMed] [Google Scholar]
- 47.Labana S. Chemistry and properties of crosslinked polymers. Academic Press, New York 1977 [Google Scholar]


