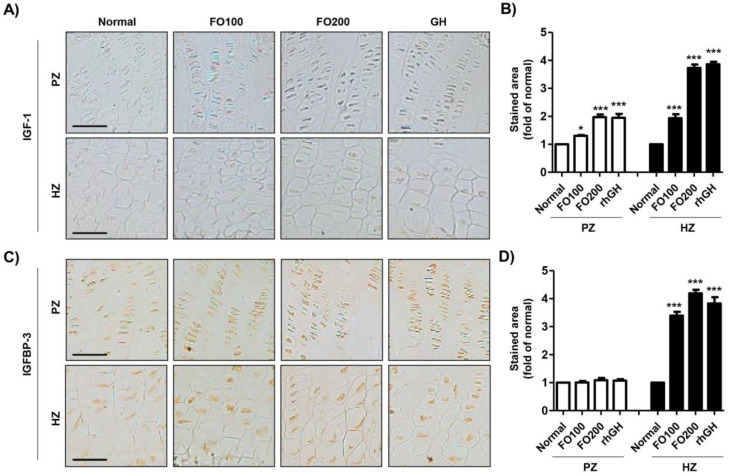
Figure 5.
Immunohistochemical localization of IGF-1 and IGFBP-3 in the proximal tibial growth plate. IGF-1 (A) and IGFBP-3 (C) were detected in the proliferating and hypertrophic zones in the proximal tibial growth plate. Scale bar; 50 μm. (B,D) The stained area of IGF-1 and IGFBP-3 was analyzed using ImageJ® and calculated in terms of the fold of the control. Data are expressed as means ± SD (n = 6). * p < 0.05 and *** p < 0.001 vs. normal. IGF-1, insulin-like growth factor-1; IGFBP-3, insulin-like growth factor binding protein-3; PZ, proliferating zone; HZ, hypertrophic zone.

