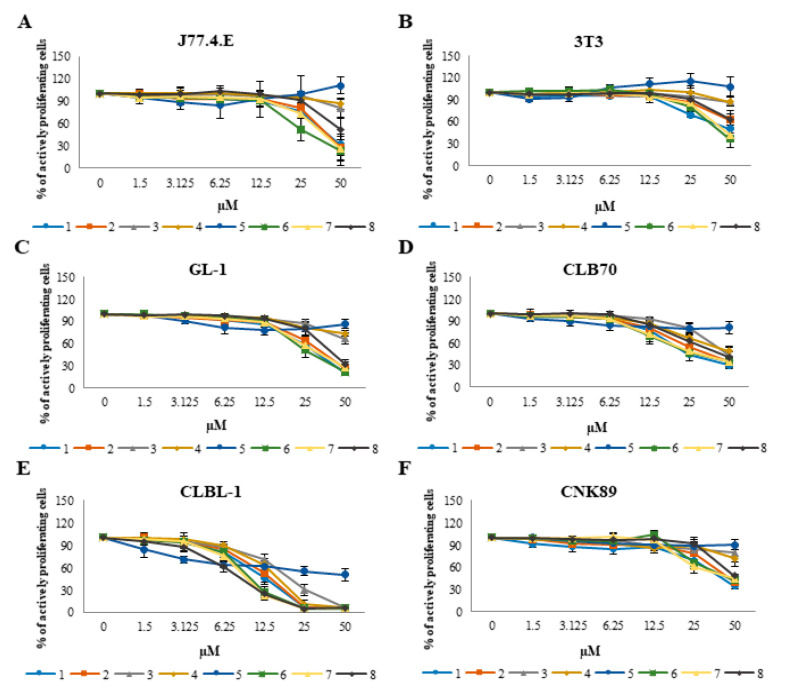
Figure 1.
Concentration-dependent curves presenting the effects of the tested chalcones on viability of normal (A,B) and canine cancer cell lines (C–F) after 48 h of incubation with different concentrations of the individual chalcones (1.5, 3.125, 6.25, 12.5, 25 and 50 µM). The values are means from three independent experiments.

