

Abstract

Single-molecule super-resolution microscopy has developed from a specialized technique into one of the most versatile and powerful imaging methods of the nanoscale over the past two decades. In this perspective, we provide a brief overview of the historical development of the field, the fundamental concepts, the methodology required to obtain maximum quantitative information, and the current state of the art. Then, we will discuss emerging perspectives and areas where innovation and further improvement are needed. Despite the tremendous progress, the full potential of single-molecule super-resolution microscopy is yet to be realized, which will be enabled by the research ahead of us.
1. Introduction
1.1. Historical Development
For much of the early decades of modern chemistry, it was an undisputed dogma that it is impossible to directly detect and investigate a single molecule.1 Indeed, this task poses unique challenges: To sense a single molecule, it must be efficiently excited, and the emitted signal must be recorded with exquisite sensitivity. Both requirements seemed unachievable for a long time, and with the exception of certain experiments in vacuum, only large assemblies of putatively identical molecules were investigated and measured parameters suffered from ensemble averaging.2−5 However, the advent of lasers, novel camera types (such as electron-multiplying charge-coupled device, EMCCD, cameras), and creative experimental techniques brought single molecules in condensed phases within reach in the 1980s, culminating in the first optical detection of a single molecule in 1989.6 For several years, the precise investigation of single molecules at low temperatures was a huge playground for physicists: quantum phenomena, molecular properties, energy transfer mechanisms, and so on could be studied without ensemble averaging and thus at the ultimate level of detail.7−11
A second revolution enabled optical or chemical control over the emissive state of single molecules or fluorescent proteins.12 Blinking or fluctuation of single emitters was initially thought to be a problem,13 but this capability eventually brought single molecules and microscopy together: Super-resolution microscopy with single molecules was born, which relies on the precise localization of single-molecule signals to obtain structural information about a labeled specimen at unprecedented spatial resolution (see section 1.2 for an overview).14 With this, single molecules were no longer only relevant for researchers interested in fundamental molecular properties: They became a powerful and versatile tool enabling a large class of super-resolution imaging methods. Super-resolution microscopy was and still is predominantly used in biology. This is no surprise—the spatial scale of structures that can be studied with these approaches is on the order of a few to a few tens of nanometers. This is precisely the length scale that is vital for cellular biology. For example, mammalian cells may be microns in size, but the fine structure of subcellular organelles, protein complexes, membrane domains, and so on ranges from a few nanometers to a few hundreds of nanometers. Similarly, bacteria typically exhibit sizes of few hundreds of nanometers, and proteins within them can be localized on the nanometer scale.15,16 Due to a crucial and fundamental limitation of optical microscopy at the relatively nondestructive visible wavelengths, the finer architecture of cells and bacteria is not accessible with conventional light microscopy. The capability of super-resolution approaches to resolve structures at the level of single proteins was a considerable improvement, which could be readily realized as previous research had already established protocols for specific labeling of cellular targets.
Today, single-molecule super-resolution microscopy is close to becoming a standard technique: Core facilities regularly implement it, and many commercial solutions are offered. However, compared to e.g. confocal microscopy, a large vista is still ahead of us. Improvements on many methodological fronts are required to make single-molecule microscopy a more robust and generally useable tool. Without careful thought in experimental design and execution, the exquisite sensitivity and resolution pose the risk of producing artifactual results.
In this article, after describing the fundamental concepts and basic experimental considerations as well as surveying the state of the art, we will discuss two main perspectives for the field: First, we will focus on innovations needed to improve current implementations of single-molecule localization microscopy. We will organize these ideas using the three key experimental areas—sample preparation, optical setups, and data analysis. Then, we will focus on perspectives for the field that are emerging and not yet in the center of present research, i.e. bringing single-molecule super-resolution microscopy to unexplored topics and joining forces with other powerful methods.
1.2. Concept
We will first describe the key ideas behind single-molecule super-resolution microscopy. For more in-depth discussions, we refer to the literature.14,17−23
Conventional optical microscopy with visible wavelengths (approximately 400–700 nm) is fundamentally limited by diffraction which causes two emitters that are spatially separated by less than ∼200 nm to appear as one. Diffraction defines a best-case achievable resolution which appears as a blurriness in the image that cannot be removed with a “better” microscope, as first stated by Ernst Abbe in 1873.24 In other words, the response function of the microscope, i.e. the image of an infinitely small point emitter (or, in good approximation, a single molecule a few nm in size), appears as a blurred spot of about 200 nm in size. This image is called the point-spread-function (PSF) of the microscope, shown in Figure 1A (with camera pixelation). However, it is possible to circumvent this “resolution limit” with related techniques which are called “super-resolution microscopy” methods. Two fundamental types exist: Targeted and stochastic schemes. Broadly, targeted schemes rely on optical control of the emission wavelength with shaped excitation spots to shrink the effective PSF of the microscope. Two emitters that are separated less than 200 nm are thus spatially differentiated. A prominent example is STED (stimulated emission depletion) microscopy,25 which has been reviewed elsewhere.18,26 Another approach is structured illumination microscopy, which also does not require single molecules.27,28
Figure 1.

Key ideas of single-molecule active control microscopy (SMACM). (A) The camera image of a point emitter or, in good approximation, of a single molecule (point-spread-function, PSF) showing pixelation from a camera detector. (B) Determination of the emitter location by fitting with a model function (here, a 2D Gaussian). (C) Result of the localization procedure. The uncertainty in the position estimate is much smaller than the original width of the PSF. (D) Switching of a single molecule between an emissive state (orange) and a dark state (gray). (E) A simulated structure consisting of concentric rings with different diameter (gray lines) and fluorescently labeled with the orange emitters. The widest ring can just barely be resolved whereas the three smaller rings are not resolved. (F) Active control of emission, yielding a sparse subset of emitting molecules in each single camera frame, and sequential acquisition of many emitter subsets. (G) Super-resolved reconstruction.
Single-molecule based methods are the focus of stochastic schemes and of this review. Employing them to surpass the diffraction limit relies on two key principles. The first is the precise localization of a single emitter by approximating the recorded camera profile of the PSF with a suitable function. For a standard microscope, a two-dimensional (2D) Gaussian is a reasonable choice as shown in Figure 1B, as long as the emitting dipole is freely rotating.29 The position of the center of the 2D Gaussian is an estimate for the position of the molecule.30,31 The uncertainty in the position estimate scales inversely with the square root of the photons detected in the image, which leads to localization uncertainties much smaller than the original width of the PSF (Figure 1C).32,33 One could compare this to a mountain with gently sloped mountainsides: Even though the mountain (Figure 1A) extends over a wide area, the location of its summit is well-defined. However, precise localization only works when a single emitter is investigated, and the goal here is to show how to deal with the case when many emitters are close together. The solution is to use an on–off active control mechanism, typically optical or chemical, which ensures that only a sparse subset of molecules is emissive in each frame (often called “blinking” of fluorophores, Figure 1D), yielding well-separated PSFs in each frame.34 Without a scheme to control the emitting concentration, all fluorophores emit at the same time, giving rise to the standard diffraction-limited image where localization of individual PSFs is impossible (Figure 1E). With active control over the emitter state, in contrast, the different single molecules labeling the target structure can be recorded over time with a movie of the emitted fluorescence (Figure 1F). The position of each single molecule is localized, and the final, super-resolved image is reconstructed from the records of the positions of the single molecules (Figure 1G). Thus, two molecules separated less than 200 nm are temporally differentiated. Note that this approach is in principle the same for more complex flavors of super-resolution microscopy which allow e.g. for 3D imaging. However, the model function and the fitting process are more elaborate in these cases.35,36
This method for achieving super-resolution detail with single molecules first appeared in 2006, termed (f-)PALM37,38 for “Photo-Activated Localization Microscopy”, based on photoactivation, or STORM39 for “Stochastic Optical Reconstruction Microscopy”, based on forcing molecules to blink by repeatedly entering and returning from dark states. Very quickly a large number of additional active control mechanisms appeared, producing a flood of new acronyms. Since all these methods rely on single-molecule images and an experimentally chosen active control mechanism, we will use the term SMACM, short for “Single-Molecule Active Control Microscopy”, for all of them. Other researchers use the term SMLM (for “Single-Molecule Localization Microscopy”) for this area, but SMLM is a broader term which also applies to single-molecule tracking experiments at extremely low concentrations where emitter overlap is not an issue,40−49 which have had a much longer history than super-resolution microscopy.
1.3. Experimental Considerations
Experimentally, there are three main “components” to be considered for SMACM (Figure 2):
-
1.
The sample. This component prominently contains the labeling of the target structure with the desired fluorophore via an appropriate labeling strategy, and the overall sample preparation procedure. Notably, the sample preparation must be as clean as possible: Due to the high sensitivity required for the detection of single molecules, fluorescent contaminants or unspecific binding of the labeling agent to nontarget structures is much more problematic than for conventional light microscopy. If blinking of fluorophores in and out of dark states is induced by chemical means, the sample preparation also contains the choice of blinking buffer composition.
-
2.
The optical setup. This component covers all the parts of the microscope used to excite the fluorophores, to filter out the excitation light from the emitted fluorescence, to manipulate the fluorescence to gain more insight about the studied system (e.g., 3D information), and to detect the fluorescence. In fact, the optical setup can be very simple—a minimal design requires not more than an excitation source (typically a laser, but a lamp can work, too), some lenses, mirrors, and filters, an objective, a sample holder, and a sensitive camera. Of course, elaborate designs for more demanding tasks can become quite complicated.
-
3.
Data analysis: While sample preparation and optical setups are required for all flavors of optical microcopy, data analysis is of specific importance in single-molecule microscopy, and therefore for SMACM. This is because the final image is not directly recorded by the camera—it is reconstructed from the information obtained from the single-molecule signals. Thus, special attention must be paid to the analysis algorithms. A data set of the highest quality can lead to inferior results if analyzed carelessly.
Figure 2.
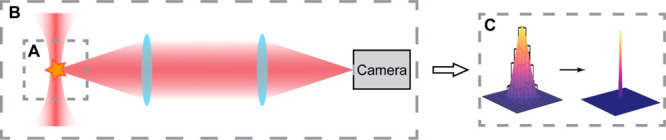
Three key experimental components required of all SMACM experiments. (A) Sample preparation and labeling. (B) Optical setup, from fluorophore excitation to detection. (C) Data analysis, i.e. identification and localization of single-molecule signals for image reconstruction.
We will now briefly present a few examples of the current state of the art in the application of SMACM in cell biology. Then, we will discuss perspectives related to these major experimental components.
2. State of the Art in Biological Applications
SMACM is currently mostly applied in biological contexts, especially eukaryotic and bacterial cell biology. As described above, this is mainly due to two reasons: First, the length scales of interest match the achievable resolution of few to few tens of nanometers well, and second, protocols to specifically attach a fluorescent label to the target have been investigated for many decades. Already the first implementations of SMACM at room temperature demonstrated the imaging modality in cells.37−39 Thus, we will give a general overview of prominent uses of the method in cell biology. Figure 3 shows several examples of the fascinating structures which can now be observed using SMACM methods (in three dimensions in fact, discussed in Section 3).
Figure 3.

Selected examples of 3D super-resolution images using single-molecule active control microscopy (SMACM) in cells. (A) Super-resolution image of actin in a COS7 cell revealing the dual-layer organization, where labeling has been done by an Affimer reagent.50 A site-specifically attached DNA strand has been added to the protein via a Cys mutation and then in the fixed cell, reaction with maleimide-DBCO is performed, and an azide-terminated target DNA strand has been covalently added. Then fluorescently labeled DNA-capture strands are added, and the active control mechanism is binding and unbinding of singles (DNA-PAINT). (B) 3D super-resolution images of synaptonemal complexes in whole mouse spermatocytes, imaged by immunolabeling synaptonemal complex protein 3 (SYCP3) with a blinking fluorescent label.51 This image required 21 optical sections through six cycles, covering nearly 9 μm in the cell nucleus, and shows the twisting band of the paired lateral elements; the resulting organization of the chromosomes is clear. (C) 3D super-resolution images of tiny membrane tubules on the surface of a cancer cell, where the sialic acids have been covalently labeled with a blinking dye.52 Here the cell has been imaged with the TILT3D microscope,53 and individual hollow tubules are shown in the insets.
Probably the most frequently imaged cellular structures are microtubules or other cytoskeletal elements such as actin meshwork (Figure 3A). This is not only because fascinating insights can be extracted, e.g. about the architecture of the whole network,54 but also because microtubules in particular are a popular target to test the resolution: The true width of microtubules is known from electron microscopy and the only increase beyond this arises from the size of the labeling agents (e.g., primary and secondary antibodies). Moreover, their linear appearance makes them easy to identify. Thus, the difference between measured and expected dimensions is a metric for the resolution capability of the system. It should be noted, however, that one must be careful not to overestimate the conclusions drawn from such measurements: Microtubules are one-dimensional; therefore, more complex or nonstructured cellular components might exhibit artifacts that are not easily detectable when looking at microtubules alone. Moreover, aberrations at the glass–water interface are not too prominent when imaging microtubules close to the coverslip, yet they may become a major factor when moving deeper into the cell.55,56
SMACM unfolds its full potential when structures exhibiting nanoscale detail within a complex environment that are specifically targetable are investigated. An excellent example are studies of the nucleus and of the nuclear membrane. Here, SMACM has contributed significantly to our understanding of this vital, incredibly dense, and complicated organelle. It was predicted for a long time that the nucleus, despite its seemingly chaotic nature, exhibits some organization. Super-resolution microscopy, together with orthogonal techniques, provided evidence for this hypothesis, demonstrating order and regulation by directly visualizing nuclear structures.57 In recent work, much has been learned about chromatin and nucleus architecture,58,59 chromatin decompaction via Myc,60 the nuclear lamina,51,53 reorganization of the nucleus upon shifts in cellular state,61,62 and structures of the DNA-organizing synaptonemal complexes51 (Figure 3B) to name just a few.
In fact, in recent years, the nuclear pore complex has been developed into something of a standard for super-resolution microscopy.63 Compared to microtubules, they have the advantage of having more structural features (such as domain symmetry, precisely known distances, and 3D architecture). Furthermore, they are typically located deeper in the cell, i.e., farther away from the coverslip, which allows for more realistic aberration correction.
Another cellular organelle that features nanoscale details within an environment of similar complexity as the nucleus is the mammalian glycocalyx. The glycocalyx is a meshwork of myriads of different sugar structures surrounding every cell in the body.64 These sugar structures either are attached to proteins or lipids or are free. By combining SMACM with highly specific, bioorthogonal labeling strategies,65,66 it was possible to gain insights into nanoscale glycocalyx architecture and reorganization upon changes of the cellular state in recent years (see Figure 3C).52
Single-molecule super-resolution microscopy plays a critical role in the investigation of the cell membrane and of events at the cell membrane.67,68 Again, many relevant processes occur at length scales of few nanometers, which is ideally matched by SMACM. Often, labeling extracellular targets tends to be cleaner, i.e. causing less unspecific binding, than labeling intracellular targets where the cell membrane and the cytosol must be passed, which is an important factor to take into account. Moreover, the combination of localization with total internal reflection fluorescence (TIRF) microscopy is an especially effective approach: TIRF microscopy generates only ∼200 nm spatial imaging depth, and more is not required to study the basal cell membrane, so any background fluorescence from the cell is easily suppressed, further improving the imaging quality. Consequently, the power of SMACM has been used to investigate many areas of membrane biology—from membrane protein distributions69,70 to the immunosynapse and membrane domains,71−74 to clathrin- and caveolin-mediated endocytosis.75−77
Another organelle at the cell membrane that has been extensively investigated by our lab and others is the primary cilium, a densely populated tube-like protrusion with a diameter of a few hundreds of nanometers and length of a few microns which acts as a vital signaling hub. In recent decades, researchers learned that the primary cilium is a key regulator of cellular and organismic fate.78 These discoveries have been enhanced and extended by single-molecule localization microscopy as well as other advanced microscopy approaches.79−83
Finally, single-cell organisms such as yeast or bacteria have also been studied extensively with SMACM.16,84−86 Their total size is typically at or below the diffraction limit; therefore, any fine structure is lost when imaged with conventional optical microscopy. Super-resolution methods have enabled the investigation of key bacterial proteins,87 DNA organization and transcription,88−90 or bacterial membrane organization.91,92 Similarly, yeast biology could be investigated at unprecedented length scales.93−95 When SMACM is combined with single-molecule tracking, further insights have been obtained about bacterial microdomains and their roles in regulation.
3. Perspectives on Methods and Applications
In this section, we will discuss innovations required to overcome some current limitations of SMACM in order to unleash its full potential. We will follow the outline presented in section 1.3, discussing each of the three major experimental components separately.
3.1. Sample Preparation
Dyes
The quality of the dye used for SMACM chiefly determines the quality of the final reconstruction. While SMACM has been demonstrated with a range of different dyes,96 only a smaller subset of fluorophores exhibit the required quality (mainly high photostability, good blinking statistics, and high quantum yield) to generate reconstructions with exceptional resolution. Very popular are AlexaFluor647, CF568, and the JF dyes;97,98 additionally, there are a few more dyes in the infrared spectrum.99 Fluorescent proteins such as eYFP are widely used as well and have improved considerably over the past years extending to new classes of photoactivatable fluorescent proteins,100−104 but they still perform inferior to organic dyes in total photons emitted before photobleaching.105 Advances in this area are highly desirable. Although currently available dyes and fluorescence proteins allow for a range of experiments, all of them would immediately benefit from improved properties and an expanded color spectrum. The goal in this area should be to ensure that the choice of dyes is not the deciding factor for the obtained resolution.
Induction of Active Control Process
The active control of emission is vital for all flavors of SMACM. One broad strategy is photoactivation, where a dye is converted from a dark fluorogen to an emissive form by a secondary control beam,106 but photoinduced blinking is more common.107,108 In a simple physical picture, a molecule’s emission can blink due to reversible entry into a dark state followed by subsequent return to the ground state to emit again. While the underlying physical mechanisms for blinking by reversible photoreduction have been teased out via cleverly designed experiments for several dyes and mechanisms have been explored in proteins,109−112 we often do not have an in-depth understanding of all processes that cause a fluorescent dye or protein to blink. Consequently, only a fraction of available dyes can be used for SMACM at the moment. In principle, it should be possible to induce blinking for all types of dyes, provided that the underlying molecular properties and accessible states are precisely known. Therefore, studies aimed at a deeper understanding of photophysics and photochemistry via e.g. transient absorption spectroscopy should be expanded. The generated insights will yield central benefits: First, existing dyes will be made compatible with SMACM, and second, the synthesis of novel dye structures will be informed, tailoring the molecular properties according to the photophysical and environmental sensing requirements.
A highly relevant area regarding induction of active control is cryogenic imaging. At low temperatures, bleaching of fluorophores is significantly reduced, which greatly increases the number of photons detected per dye molecule. As the localization precision scales inversely with the square root of the detected photons, this allows for localization precisions below 1 nm. However, only a few active control options exist currently in this regime as most high-quality dyes and fluorescent proteins stop blinking at cryogenic temperatures.103,113,114 A deeper understanding of dye photophysics and photochemistry is certainly needed and will enable the development of tailored dyes for cryogenic localization microscopy, which would significantly expand the scope of single-molecule experiments.
An orthogonal approach to direct induction of blinking is PAINT (short for “point accumulation for imaging in nanoscale topography”).115−120 Here, a diffusing fluorescent molecule binds to the target structure, concentrating the emitted photons at the binding site, which leads to a bright burst of fluorescence. This burst can be further increased by temporary unquenching of the fluorophore.121 Thus, blinking is not introduced photophysically, but via transient binding and unbinding events, which uncouples the blinking statistics from the dye properties. A powerful implementation of this idea uses DNA strands to create binding sites at the target structures and complementary sequences tagged with fluorophores.122 This leads to a fundamental trade-off between imaging speed and interaction specificity: Shorter DNA strands yield faster dynamics, but also more unspecific binding. Certainly, innovation in this area will allow for faster imaging without losing specificity, enabling a versatile alternative for direct induction of blinking.
Precise control over blinking is highly desirable as blinking statistics are one of the key determinants for the achievable resolution, and some control, especially improved counting has been achieved by tailoring of the optical pulse.123 This is because each precisely localized single molecule acts as a reporter for the imaged structure. Therefore, the labels must sample the fine details of the structure densely to make them resolvable. The basis for this requirement is the famous Nyquist–Shannon Sampling Criterion.124−126 Originally, this concept states that a signal in time, composed of many frequencies, must be sampled at least twice as fast as the highest frequency component in order to be reconstructed from the samples. This criterion can be directly translated to images and spatial frequencies. As shown in Figure 4A, a test pattern with low spatial frequency can be reconstructed from both low and high numbers of localizations. In contrast, for the high spatial frequency case, low numbers of localizations fail. This is also clearly visible from the respective power spectra (Figure 4B). Thus, even if the structure is densely labeled, it will be poorly resolved if the blinking statistics are suboptimal (cf. also Figure 5 and the related discussion).
Figure 4.

Importance of sampling the imaged structure. (A) Test patterns consisting of five (left columns) or 20 (right column) stripes, sampled with low (top row) or high numbers (bottom row) of localizations. (B) Corresponding 2D power spectra, radially averaged. PSD = Power spectral density.
Figure 5.

High localization precision, small labeling footprint, and high labeling efficiency are equally important for high-quality reconstructions. Shown are simulated patterns of 4 × 4 infinitely small spots with a spacing of 25 nm. Each spot contains 10 binding sites. For each combination of localizations precision and labeling footprint, 0.2, 0.5, and 0.8 average labeling efficiencies are simulated (standard deviation, SD, 0.1 between spots). Each labeled binding site yields on average 10 localizations (SD: 5 localizations). The localizations are binned into 2D histograms with 2 nm bin width, and the edge length for each reconstruction is 125 nm. The color bar ranges from blue through green to yellow. Blue always corresponds to 0 localizations, and yellow to 2 localizations for poor reconstructions and up to 12 localizations for good reconstructions, respectively.
Labeling Methods
Much effort has been and is currently devoted to the development of advanced labeling protocols, for example via incorporation of unnatural biomolecules that carry a bioorthogonal reporter for subsequent targeting, artificial amino acids, or, most recently, CRISPR-based approaches.127−132 However, there is a lot of room for improvement. Many experiments in the field still rely on standard immunochemistry protocols. As the achievable localization precision is nowadays routinely around 10 nm or below, this is becoming a significant problem. The size of a single antibody is approximately 10 nm and thus no longer negligible. As bound antibodies are rotationally not completely flexible, their labeling footprint is smaller than their full size, but still at least several nanometers. Moreover, when target epitopes are spaced apart just a few nanometers (which is, considering the crowded environment of the cell, often the case), steric hindrance can lead to low labeling efficiencies.133 Both effects render localization precision of few nanometers essentially useless.
Thus, beside the needs for low unspecific binding and overall robustness, the ideal labeling protocol must fulfill two additional key requirements: small labeling footprint and high labeling efficiency. To illustrate this, we simulated a test pattern and consider different combinations of localization precision, labeling footprint, and labeling efficiency (Figure 5). Evidently, high-quality reconstructions mandate optimization of all three parameters (provided good blinking statistics, as discussed above). Among them, we think that labeling efficiency is the one currently least in focus. The simulation highlights that this should change. Obviously, for low labeling efficiencies and otherwise excellent parameters, the test pattern is simply incomplete. While this is already problematic, the situation is more serious for cases where the other parameters are also not ideal. For example, consider the case of 2 nm localization precision and 8 nm labeling footprint: For a labeling efficiency of 0.8, the test pattern is quite fuzzy, but visible, and it blurs for lower labeling efficiencies.
These simulations exemplify that the field should move away from immunostaining when possible and pay close attention to the details of the labeling process. One useful approach with good results uses enzymatic attachment of fluorophore-functionalized tags.134,135 SMACM is an ideally suited method to disentangle the many overlapping interactions of biomolecules that take place on small length scales within the cell. However, to unfold its full potential, proper labeling with rigorous control experiments is as important as tailored optical setups and dyes.
Tissue Sections, Organoids, and Whole Organisms
Imaging cultured cells is itself not always easy, but all experimental steps become even harder when moving toward investigation of tissue sections, organoids, or whole organisms: Mere handling and mounting the sample is more difficult. Also, labeling of the target structure is more challenging—unspecific binding usually strongly increases, and new problems arise, such as penetration of the labeling agent through many layers of cells as well as the presence of elevated autofluorescence. Finally, on the optical side, imaging deep in tissue gives rise to significant aberrations, requiring sophisticated correction schemes. All these factors and many more make detection and precise localization of single molecules considerably more difficult.
One might wonder—why try to address these difficulties? The answer is simple: While many insights into biological processes can be drawn from experiments in cultured cells, the true environment of an individual cell is the 3D tissue matrix of other cells and various extracellular components. Thus, a significant portion of the picture is lost when cells are investigated in culture. It is therefore desirable to move away from cultured cells and toward more realistic settings when possible. It would be too much to ask to directly switch from SMACM in cultured cells to e.g. live Zebrafish embryos, so the shift should be gradual. Fortunately, a wide space exists between artificial and physiological conditions. For example, instead of culturing cells on glass coverslips, an alternative is cell culture on less stiff substrates, similar to the mechanical properties encountered in tissue. Simply the removal of glass as substrate shifts the cell into a more physiological state.136 Co-culturing of different cell lines can help to emulate the complex tissue environment better.137 Cell spheroids and organoids are more difficult to create and maintain, but still manageable, and they are considerably closer to the physiological case.138 Finally, of course, the ultimate level of realism lies in tissue sections and live animals, and certainly they are experimentally most challenging to handle.139−141 A moderate increase in complexity of the studied system can pay off a great deal, and it is desirable that these considerations become a standard part of experimental planning.
3.2. Optical Setup
Setup Designs
All research thrusts discussed in this section are in one way or another linked to innovation in the design of the microscopes used, enabling improved localization precision, investigation of multiple fluorescent species, or recording of other parameters than fluorescence brightness alone. This is because implementation of such improvements mandates various enhancements on the instrumental side: More powerful lasers allow for more efficient shelving and rapid blinking of single molecules; faster cameras enable higher frame rates and thus shorter acquisition times; creative designs for excitation and detection geometries (e.g., lattice light sheet, TILT3D, 4Pi, etc.)51,53,139,142−144 minimize unwanted out-of-focus fluorescence and maximize the number of detected photons; and automated acquisition makes super-resolution high-throughput imaging possible. Progress on the instrumental side is likely to continue, thus opening windows to either currently not implementable excitation and detection schemes or simplified, more robust layouts.
Happily, it does not seem necessary to desperately enforce innovation in setup design as the impetus will naturally follow from the research questions addressed. However, microscopes employed for state-of-the-art detection of single molecules are almost exclusively noncommercial. Desiderata in this area are more user-friendly documentations of setups. Today, setups are usually described briefly in the materials and methods sections of publications, and schematic drawings are standard. However, thanks to the broad availability of computer-aided design software, detailed blueprints and 3D animations are straightforward to create, which give a much more detailed picture and allow for easier reproduction. More common utilization of such resources would significantly facilitate the implementation of successful setup designs.
Multicolor Imaging
Much can be learned from imaging a single cellular structure, but eventually, almost all biological questions can be traced to interactions of all the different cellular entities like proteins, DNA, organelles, and so on (sometimes called “interactome”).145,146 Therefore, two- or multicolor super-resolution studies do not just add another imaged species; rather, they are essential for investigation of fundamentally new types of questions.
As always, the added information content comes at a cost. For example, registration of different color channels at the required precisions is far from trivial. Resolving two structures at the length scale of a few nanometers is futile when the registration error between the channels is tens of nanometers. Thus, registration typically requires more than just affine transformations—local variations induced by field-dependent and chromatic aberrations must be corrected as well.147 This process is complex in two dimensions and can become a major challenge in three dimensions. Another key problem is the choice of dyes: As discussed above, not too many dyes exist that can be effectively employed in single-molecule super resolution microscopy, although some progress has been made based on decomposition of spectra.148 When used simultaneously, it is highly advantageous when all dyes require identical experimental conditions, e.g. the same blinking buffer.149 Changing parameters between the acquisitions of different channels is possible, but it increases the complexity of the registration further. Progress especially for precise registration and high-quality, compatible dyes is therefore essential to further improve multicolor SMACM.
3D Imaging
Similar to the transition from one to two or more imaged species, the transition from knowledge of the 2D to the 3D position of a localized emitter significantly increases the scope of the experiment. Ultimately, cells are 3D objects, and thus, their investigation requires 3D information.150 Therefore, shortly after the first description of SMACM in 2D, methods had been developed to include the axial dimension,151,152 based on the well-known ability of cylindrical lenses to provide 3D localization.153 Since then, the field has progressed considerably. Various engineered PSFs, tailored to the desired axial range, a small camera footprint, and others, have been developed.154−158 Thanks to these efforts, axial localization precisions of 10–20 nm can be easily reached. This should motivate the field to push the limits of 3D imaging toward routinely achieving single-digit nanometer precisions. Provided efficient labeling with small footprints, such an improvement can make the difference between resolving individual proteins in 3D or not.
To achieve this goal, effects that were so far not in the focus of research must be investigated. Most urgent is a better understanding of the various consequences of index mismatch between the cellular environment (with an index of refraction around 1.33) and the optical elements (with an index of refraction around 1.52). Index mismatch effects are noticeable in 2D imaging as well, but in 3D, they are considerably more problematic. A key example is focal shift, i.e. the disagreement between nominal focus position and true focus. It had been characterized early on, but so far mostly for emitter positions dozens of microns away from the interface.56,159 Our own lab has recently shown that, at the length scales relevant for the analysis of single cells, the focal shift varies quickly and needs to be accurately characterized to yield e.g. correct 3D distance measurements.55
Generally, 3D imaging is an excellent example of the interconnected nature of various requirements encountered in SMACM: Dyes with tailored photophysical properties and precisely tunable blinking statistics are needed to maximize the emitted photons from each emitter and the information content per frame. Clever setup designs make it possible to reduce aberrations and detect complex PSFs reliably. Finally, a detailed understanding of the image formation and optimized algorithms for rapid and accurate localization are necessary for final image reconstruction.
Aberration Correction
As mentioned above, the shape of the PSF in a standard microscope is, in good approximation, a 2D Gaussian. If engineered PSFs are used for e.g. 3D imaging, the theoretical shape of the PSF is more complex, but can still be calculated precisely. However, the theoretical PSF always departs from the experimental PSF, which is caused by imperfections in the various optical elements of the microscope. These aberrations can be minimized by careful calibration and high-quality optics, but not completely ruled out. This is especially the case for aberrations induced by the sample itself: If the fluorescence detected from a single molecule passes through a whole cell or even a layer of cells, the experimental PSF will differ significantly from the theoretical one due to the many changes in the index of refraction that the emitted wavefront encounters. If this path length is small, the induced aberrations are less of a problem, but in this case, the investigation is limited to areas close to the coverslip. Methods have been described to retrieve the PSF in situ and should be considered.160 In any case, disagreement between theoretical and experimental PSFs cause poor fitting results in e.g. PSF localization, which deteriorates the quality of the reconstruction.
Luckily, it is possible to correct for the aberrations in an experiment. The underlying idea is simple: As the various sources of aberrations act together to deform the wavefront that is detected by the camera, giving rise to a distorted PSF, one just needs to install a device that precisely counteracts the induced distortions, such as deformable mirrors (DMs) or spatial light modulators (SLMs) which alter the phase of the detected light. As these devices can adjust to various situations, they are called “adaptive optics”, which is often used synonymously with the whole process of aberration correction. The experimental implementation is a little more challenging than the underlying idea, but not too cumbersome. The key problem to be solved is the measurement of the aberrated wavefront in order to decide how to balance the aberrations. Many strategies exist, but probably the most straightforward method is image-based correction: Here, PSF images obtained from point-like emitters such as fluorescent beads are directly analyzed at the start of the experiment, and the adaptive optics of the system are changed in a feedback loop until the experimental PSF is as close as possible to the unaberrated, theoretical PSF.161−165
Using adaptive optics for aberration correction has been demonstrated to significantly enhance the quality of super-resolution reconstructions or to even make reconstructions possible in the first place. Still, they are currently mainly implemented in specialized setups for deep-tissue imaging or related experimental questions. More general dissemination of aberration correction approaches would nevertheless be beneficial, as it is a relatively easy to implement a method to significantly improve the quality of the recorded data set.
On a more fundamental level, aberration correction highlights the benefit of learning from fields that face conceptually similar problems as single-molecule studies. In the case of aberration correction, much inspiration has been taken from astronomy, and also for efficient photon detection, cameras from astronomy have driven advances in single-molecule imaging.166 Just as for single-molecule studies, astronomy faces the challenge to optically detect dim light from a point-like object while background light and aberrations are present. In astronomy, however, aberration correction is mandatory for earth-bound observatories as atmospheric dynamics severely distort the incoming wavefront. For this reason, the problem was studied early, and many clever strategies have been put forward. Such inspirations from neighboring fields are extremely advantageous for single-molecule studies and should be actively sought after.
We have now discussed roughly half of the emerging perspectives for future improvements of SMACM. Here, we would like to pause for a moment and put the issues discussed into a broader context. Ultimately, we think that innovations in the three main experimental components of SMACM and their respective subcategories serve one key purpose: To improve and facilitate current applications of SMACM on the one hand, and to develop novel applications of SMACM in fields that currently do not prominently employ single-molecule approaches on the other hand. These innovations cooperate as schematically shown in Figure 6.
Figure 6.

Cooperation between advances in the three key components of SMACM, allowing for improvements in current applications and development of novel applications.
Correlation of Single-Molecule and Electron Microscopy
Biological imaging is dominated by two methods: Light and electron microscopy. While the latter yields higher resolution, it suffers from poor contrast information (specificity) as the final image is, independent of the modality, usually a grayscale representation of electron density alone. Thus, it is a logical approach to combine light and electron microscopy: Information on the identity of the imaged species can be obtained via highly specific fluorescent labeling and light microscopy, whereas exquisite spatial information and cellular context are achieved via electron microscopy. However, there is a price to pay in terms of experimental complexity—electron microscopy and light microscopy differ considerably in sample preparation and imaging conditions; thus, protocol optimization is crucial. Such approaches are termed correlative light and electron microscopy (CLEM), and they have been used to investigate various biological systems with reasonable success within the constraints of the diffraction limit.167−172
In recent years, increased attention has been focused toward the correlation of SMACM with electron microscopy. The main motivation is that information on the imaged species is diffraction-limited if standard optical microscopy is employed, which is problematic because there is a huge mismatch between the resolution of the electron microscopy and DL optical imaging when dense biological systems are investigated. Happily, imaging single molecules at cryogenic temperatures improves localization precision as discussed above. The experimental demands for correlation of electron and localization microscopy are unfortunately even higher than those for CLEM; however, if successfully implemented, the information content of the obtained data is considerably increased as demonstrated by our group and others. To make the various correlative approaches more accessible, innovation on all fronts is required: Improved dyes for better blinking or activation capabilities at low temperatures, robust sample handling for smooth transition between microscopes, precise registration schemes for overlaying of the two image modalities with subnanometer precision, and many more improvements are needed (for an in-depth discussion, please see an upcoming review by P. D. Dahlberg and W. E. M. in Annual Review of Physical Chemistry). In that sense, correlation of electron and localization microscopy is an incredibly exciting area as its huge potential is obvious while the realization of the full potential is not straightforward at the moment. General progress in the field of single-molecule techniques will directly influence the development and improvement of correlative approaches.
Active Sample Stabilization
Although the acquisition speed for SMACM experiments has considerably increased over the past years, the total time to record a data set is still rarely below several minutes, except for certain tour de force experiments.173 Even a sturdy setup design after full temperature equilibration cannot prevent sample drift of tens of nanometers during long time spans, which is much larger than the achievable resolution. Thus, drift correction must be performed. At the moment, this is often done in postprocessing, e.g. using a fluorescent bead (called a “fiducial”) which is recorded in parallel to the single-molecule data. The fiducial’s apparent motion during the acquisition then allows for drift correction.174,175 Image correlation is another oft-used strategy.176
In recent years, increased attention has been focused toward alternative feedback-based sample stabilization approaches. In some demonstrations, a fiducial is localized in real time; the position estimate is used to move the stage during the experiment to correct for drift.164,177 Compared to drift correction in postprocessing, such approaches feature several advantages: For example, they often do not rely on fluorescence-based detection of a fiducial, but rather white-light scattering-based imaging of e.g. polystyrene beads, which yields localization precisions in 3D of few nanometers without bleaching of the fiducial or spectral crosstalk. Furthermore, the decoupling of single-molecule data from fiducial data acquisition enables feedback at subframe rates, i.e. the position of the stage can be adjusted several times during a single camera frame for fluorescence acquisition. Such fine correction is not possible in postprocessing.
These promising strategies are enabled by significant advances in camera and stage design as well as data processing, which allow for rapid recording and localization of the fiducial and equally rapid stage movement. These advances have also enabled much easier implementation into new or existing setups, so it is realistic to hope that active sample stabilization will continue to evolve into a standard tool.
Multiparameter Imaging
So far, the fluorescence emitted from a single molecule was only discussed with respect to localization: The detected PSF is used to estimate the position of the emitter from the pattern of detected photons on the camera. However, it is vital to note that much more information is contained in molecular fluorescence. Ultimately, the properties of the fluorescence emission, e.g. wavelength or polarization, are determined by quantum phenomena that underlie the excitation and emission processes. Moreover, external factors such as pH or electrostatic interactions can significantly affect the emission properties. Due to the small size of a single molecule, it is only sensitive to influences in the immediate neighborhood. Therefore, each single molecule acts both as a reporter of its position in space and as a uniquely sensitive reporter of its local environment.
Multiparameter imaging thus uses the additional information contained in the emission not only to image a structure but also to draw conclusions on local variations within that structure. For example, polarization of the emitted fluorescence reports on the rotational mobility of a single molecule and its orientation during emission.178−180 Similarly, shifts in the emitted wavelength are evidence for a change in the dye’s microenvironment. Such measurements can notably increase the scope of a single molecule-based investigation and provide valuable orthogonal data. Consequently, numerous studies have used multiparameter imaging to investigate, for example, membrane architecture, DNA intercalation, polarity, the behavior of amyloid aggregates, and many more local properties.181−188
The considerably increased information content, however, comes at the cost of a more challenging experimental procedure. For example, polarization microscopy requires additional optimization of the labeling step as the dye must be rigidly attached to the target; otherwise, the measurement will not capture the true orientation of the target. Spectroscopic imaging necessitates photon budget considerations: a fraction of the detected photons must be used for detection of the spectrum and are thus not fully available for localization, reducing the localization precision. Generally, multiparameter imaging requires more advanced optical systems than pure localization microscopy. In our opinion, however, the additional complexity is easily outweighed by the gained information. A broader use of multiparameter imaging is highly desirable in order to make use of the huge potential of the approach.
3.3. Data Analysis
Neural Networks
In recent years, the advent of neural networks and deep learning and their success in analyzing images has revolutionized the field of microscopy in general and specifically of SMACM. It has been demonstrated by various groups that all data-related aspects can significantly benefit from deep learning: Previously impossible image analysis methods can be performed, or existing analysis methods significantly accelerated. Thus, deep learning has been successfully implemented for detection and localization of PSFs,189−191 for phase retrieval and background correction,192−195 for phase mask design of optimized PSFs,157,196 and for compressed sensing,197,198 to just name a few applications, and work in this area has been recently reviewed.199
Therefore, convincing anyone that deep learning offers intriguing potential for the field is no longer necessary. Instead, careful calibration of deep learning as a powerful tool is now required. In the wake of the initial general enthusiasm, it should not be overlooked that deep learning, just as any other analysis method, is not able to “create information”; more seriously, it must not be allowed to do so. If, for example, a neural network-based approach adds fine details to an initial super-resolution reconstruction, it infers the existence of these details from the data it was presented during training. The seemingly created information is just the assumption of a general law of the appearance of the imaged structure. Thus, without proper controls, deep learning-based analysis can be especially prone to creation of artifacts: For example, a rare structural feature that was not present in the training data set will likely be skewed or missed completely, both of which are problematic.199
As a result, there are two key tasks for deep learning in the single-molecule field: On the one hand, the method itself should be standardized and made more generally accessible, e.g. by creating user-friendly software packages.200,201 This will allow laboratories that are not actively developing deep learning-based analysis methods to benefit from the substantial capacity of the method. On the other hand, however, this process of dissemination should not present deep learning as a black box. Users should always be informed upfront about potential problems of the method, and rigorous, orthogonal controls should be mandatory.
Effective Computing
Data processing has become a vital step in SMACM. Several gigabytes of imaging data are typical for less sophisticated systems, and hundreds of gigabytes or even terabytes can easily be acquired in more complex scenarios. There are two main reasons for these exceptional numbers. First, as described above, the imaged structure must be spatially sampled in detail to achieve the highest resolution, necessitating extended acquisition times and large numbers of recorded camera frames. Second, the requirement for sparse single-molecule signals demands that a considerable part of each recorded camera frame is empty (which again highlights that the precise control of blinking is highly desirable as it allows for maximal information content per camera frame).
Currently, these huge amounts of data are broadly met with imperfect tools. Frequent copying of data from one location to another is slow. Real-time streaming of data to a common storage location would be much more efficient. Programming languages and apps commonly used for evaluation and visualization, such as Matlab or ImageJ, are not designed to handle dozens of gigabytes of data—Python or C could often be superior. Using more or less standard desktop computers for data processing is not ideal either. Many tasks encountered in data evaluation can be parallelized, making GPU computing the method of choice.202−204
Of course, various strategies have been demonstrated to implement all these aspects, showing that the time span between data generation and final result can be considerably reduced.205 This is highly beneficial, and not only to save time: If the data can be analyzed in or close to real time, the experimental parameters can be tuned flexibly, improving the quality of the generated data and the science learned, and throughput can be significantly improved.
To make progress toward this goal, a different attitude toward data analysis is required that exceeds mere problem solving. Evaluation of single-molecule data should be viewed as a separate data science and estimation problem and treated accordingly. This would also mean a change in education. Although GPU or cloud computing is becoming more and more user-friendly, it is far from being trivial. Thus, education in single-molecule techniques should include a prominent section on data science, be it efficient storage, parallelization techniques, or its various other aspects.
Benchmarking
When confronted with an experimental result, any researcher will ask: Can I trust it? SMACM is no exception. Quite the contrary, accurate benchmarking is vital in the field: First, the length scales of interest are so small that tiny inaccuracies can substantially skew the result. Second, the required exquisite sensitivity bears the risk of artifacts—e.g. due to nonspecific binding, overcounting (repeated detection of the same molecule emitting over several camera frames, causing artifactual clusters with sizes of approximately the localization precision), or the detection of fluorescent “dirt”. It is always essential to be sure that the labeling itself is not affecting the visualized structure, and this can occur more often as resolution improves.206 Finally, from a more practical point of view, SMACM is in many cases still a very custom method, where each lab builds its own optical setup, uses its own sample preparation protocols, and writes its own evaluation code.
Considering this, it is especially unfortunate that the field has yet to agree on a common standard to measure the quality of an experiment. Certainly, there are developments in that direction, for example the “single-molecule fight club” as a place where analysis algorithms can be compared, the nuclear pore complex samples, or, leaving the imaging space, the multilab FRET study.63,207,208 However, there is no universally accepted number or set of numbers that need to be reported when publishing SMACM results. Certainly all researchers should report numbers of detected photons and estimated localization precisions, but the metrics are only a start. Again, we could learn from other fields: For example, when publishing crystallography or cryo-EM protein structures, a set of metrics that accurately state the quality of the data set must be included. Of course, compared to finding the structure of a single purified protein, imaging the microtubule network in a cell is already less defined and more chaotic (but certainly interesting and useful). Nevertheless, more rigorous assessments than those currently used can be easily conceived. An example would be Fourier Ring or Shell Correlation (FRC/FSC).209,210 One can hope that a simple, “one size fits all” approach, i.e. either a quick control experiment or an easy to calculate set of metrics, would be a wise choice. Otherwise, such a standard will probably be difficult to find general acceptance in practice. If the field could converge on a standard that needs to be included in any publication, it would be a key step toward making SMACM a robust tool with straightforward comparison of results between different laboratories. Also, it would force every researcher to carefully calibrate the optical system, preventing the publication of poor-quality data sets.
4. Conclusion and Outlook
The previous sections have discussed various topics in single-molecule super-resolution microscopy (SMACM) where innovation is needed to further develop the method into a general, robust approach to investigate all areas of biology. We would like to conclude this review with some more general and speculative thoughts on applications of the general principle of localization-based super resolution imaging.
Clearly, images such as those shown in Figure 3 are filled with detail far beyond that obtainable from diffraction-limited imaging, and it is to be expected that these techniques can be expected to be continuously applied. But to consider future developments, it is useful to briefly revisit the fundamentals: What is really needed to achieve super-resolution via localization of an individual signal? Essentially, it comes down to a few key requirements—first, an emitter is necessary. Second, its emission must undergo detectable changes, ideally from a “bright” to a “dark” state and back, yielding nonoverlapping signals in the spatial (or another imaging) dimension. Third, the expected profile of the emission on the detector must be known reasonably well to allow for fitting of an appropriate model function to extract the single emitter position precisely. (The intriguing new MINFLUX method400 actually uses a zero of the optical pumping pattern to find the position of the molecule, so the emission profile shape is not so essential.) Finally, the time scale of the emission on–off process must be fast enough to facilitate data acquisition in a reasonable time and to avoid intrinsic changes of the investigated sample during acquisition. If the sample is not fixed, the imaging should be restricted to relatively static structures.
Considering these prerequisites, it becomes clear that the principle of signal localization is universal. In that sense, the approach is not limited to fluorescence—one could imagine other types of signals in time and space that could be analyzed in a similar fashion, for example nuclear or electron spin resonance. Certainly, the details of such an implementation would differ quite significantly from current approaches in optical microscopy and would necessitate some out-of-the-box thinking. The essential first step is to be able to detect individuals and this could possibly be envisioned, via linking to fluorescence211−213 or to index changes from thermal perturbations.214,215 In any case, these approaches would certainly be intriguing applications.
SMACM is predominantly used in biology at the moment. This is not too surprising, considering that optical microscopy has a long tradition in this area. However, applications in other areas are increasingly reported, for example in material sciences.216 The capability to detect and localize individual emitters to investigate e.g. the distribution of catalysis activity on different areas of a nanoparticles,217−219 or to observe the behavior of separation polymers,220,221 avoiding ensemble averaging and revealing surprising heterogeneity, has turned out to be immensely powerful in this area. Another area involves single molecules interacting with metallic nanoantennas in order to observe nanoscale properties such as hot spots involved in surface-enhanced Raman scattering;222−224 indeed various combinations of plasmonics with super-resolution have recently been reviewed.225 Fundamentally, super-resolution microscopy with single molecules provides a unique window into complex systems, be it biological or otherwise. There can be no doubt that this potential will be increasingly employed in all areas of natural sciences: Single molecules will continue to shine brightly.
Acknowledgments
This work was supported in part by the National Institute of General Medical Sciences Grant No. R35-GM118067.
The authors declare no competing financial interest.
References
- Schrödinger E. R. J. A. Are there quantum jumps? Part II. British J. Philos. Science 1952, III, 233–242. 10.1093/bjps/III.11.233. [DOI] [Google Scholar]
- Gorokhovskii A. A.; Kaarli R. K.; Rebane L. A. Hole burning in the contour of a pure electronic line in a Shpol’skii system. JETP Lett. 1974, 20, 474–497. [Google Scholar]
- Kharlamov B. M.; Personov R. I.; Bykovskaya L. A. Stable “gap” in absorption spectra of solid solutions of organic molecules by laser irradiation. Opt. Commun. 1974, 12 (2), 191–193. 10.1016/0030-4018(74)90388-5. [DOI] [Google Scholar]
- Personov R. I.; Al’Shits E. I.; Bykovskaya L. A. The effect of fine structure appearance in laser-excited fluorescence spectra of organic compounds in solid solutions. Opt. Commun. 1972, 6 (2), 169–173. 10.1016/0030-4018(72)90220-9. [DOI] [Google Scholar]
- Pope M.; Swenberg C. E.. Electronic Processes in Organic Crystals and Polymers; Oxford Univ. Press: London, 1999. [Google Scholar]
- Moerner W. E.; Kador L. Optical detection and spectroscopy of single molecules in a solid. Phys. Rev. Lett. 1989, 62, 2535–2538. 10.1103/PhysRevLett.62.2535. [DOI] [PubMed] [Google Scholar]
- Brown R.; Orrit M., Spectral Jumps of Single Molecules. In Single Molecule Optical Detection, Imaging, and Spectroscopy; Basché T., Moerner W. E., Orrit M., Wild U. P., Eds.; Verlag-Chemie: Munich, 1997. [Google Scholar]
- Orrit M.; Bernard J. Single pentacene molecules detected by fluorescence excitation in a p-terphenyl crystal. Phys. Rev. Lett. 1990, 65, 2716–2719. 10.1103/PhysRevLett.65.2716. [DOI] [PubMed] [Google Scholar]
- Basché T.; Kummer S.; Bräuchle C. Direct Spectroscopic Observation of Quantum Jumps of a Single Molecule. Nature 1995, 373, 132–134. 10.1038/373132a0. [DOI] [Google Scholar]
- Güttler F.; Irngartinger T.; Plakhotnik T.; Renn A.; Wild U. P. Fluorescence microscopy of single molecules. Chem. Phys. Lett. 1994, 217, 393–397. 10.1016/0009-2614(94)87003-9. [DOI] [Google Scholar]
- Ambrose W. P.; Moerner W. E. Fluorescence spectroscopy and spectral diffusion of single impurity molecules in a crystal. Nature 1991, 349, 225–227. 10.1038/349225a0. [DOI] [Google Scholar]
- Dickson R. M.; Cubitt A. B.; Tsien R. Y.; Moerner W. E. On/Off Blinking and Switching Behavior of Single Molecules of Green Fluorescent Protein. Nature 1997, 388, 355–358. 10.1038/41048. [DOI] [PubMed] [Google Scholar]
- Moerner W. E. Those Blinking Single Molecules. Science 1997, 277, 1059–1060. 10.1126/science.277.5329.1059. [DOI] [Google Scholar]
- Moerner W. E. Microscopy beyond the diffraction limit using actively controlled single molecules. J. Microsc. 2012, 246 (3), 213–220. 10.1111/j.1365-2818.2012.03600.x. [DOI] [PMC free article] [PubMed] [Google Scholar]
- Gahlmann A.; Ptacin J. L.; Grover G.; Quirin S.; von Diezmann A. R. S.; Lee M. K.; Backlund M. P.; Shapiro L.; Piestun R.; Moerner W. E. Quantitative multicolor subdiffraction imaging of bacterial protein ultrastructures in 3D. Nano Lett. 2013, 13, 987–993. 10.1021/nl304071h. [DOI] [PMC free article] [PubMed] [Google Scholar]
- Gahlmann A.; Moerner W. E. Exploring bacterial cell biology with single-molecule tracking and super-resolution imaging. Nat. Rev. Microbiol. 2014, 12 (1), 9–22. 10.1038/nrmicro3154. [DOI] [PMC free article] [PubMed] [Google Scholar]
- Moerner W. E.; Fromm D. P. Methods of Single-Molecule Fluorescence Spectroscopy and Microscopy. Rev. Sci. Instrum. 2003, 74, 3597–3619. 10.1063/1.1589587. [DOI] [Google Scholar]
- Hell S. W. Far-Field Optical Nanoscopy. Science 2007, 316 (5828), 1153–1158. 10.1126/science.1137395. [DOI] [PubMed] [Google Scholar]
- Gräslund A.; Rigler R.; Widengren J.. Single Molecule Spectroscopy in Chemistry, Physics and Biology: Nobel Symposium 138 Proceedings; Springer: 2010.
- Schermelleh L.; Ferrand A.; Huser T.; Eggeling C.; Sauer M.; Biehlmaier O.; Drummen G. P. C. Super-resolution microscopy demystified. Nat. Cell Biol. 2019, 21 (1), 72–84. 10.1038/s41556-018-0251-8. [DOI] [PubMed] [Google Scholar]
- Sahl S. J.; Moerner W. E. Super-resolution fluorescence imaging with single molecules. Curr. Opin. Struct. Biol. 2013, 23 (5), 778–787. 10.1016/j.sbi.2013.07.010. [DOI] [PMC free article] [PubMed] [Google Scholar]
- Sigal Y. M.; Zhou R.; Zhuang X. Visualizing and discovering cellular structures with super-resolution microscopy. Science 2018, 361 (6405), 880–887. 10.1126/science.aau1044. [DOI] [PMC free article] [PubMed] [Google Scholar]
- Coltharp C.; Xiao J. Superresolution microscopy for microbiology. Cell. Microbiol. 2012, 14 (12), 1808–1818. 10.1111/cmi.12024. [DOI] [PMC free article] [PubMed] [Google Scholar]
- Abbe E. Contributions to the theory of the microscope and microscopic detection (Translated from German). Arch. Mikroskop. Anat. 1873, 9, 413–468. 10.1007/BF02956173. [DOI] [Google Scholar]
- Hell S. W.; Wichmann J. Breaking the diffraction resolution limit by stimulated emission: stimulated-emission-depletion fluorescence microscopy. Opt. Lett. 1994, 19, 780–782. 10.1364/OL.19.000780. [DOI] [PubMed] [Google Scholar]
- Hell S. W. Nanoscopy with Focused Light (Nobel Lecture). Angew. Chem., Int. Ed. 2015, 54 (28), 8054–8066. 10.1002/anie.201504181. [DOI] [PubMed] [Google Scholar]
- Gustafsson M. G. L. Surpassing the lateral resolution limit by a factor of two using structured illumination microscopy. J. Microsc. 2000, 198 (2), 82–87. 10.1046/j.1365-2818.2000.00710.x. [DOI] [PubMed] [Google Scholar]
- Gustafsson M. G. L.; Shao L.; Carlton P. M.; Wang C. J. R.; Golubovskaya I. N.; Cande W. Z.; Agard D. A.; Sedat J. W. Three-dimensional resolution doubling in wide-field fluorescence microscopy by structured illumination. Biophys. J. 2008, 94 (12), 4957–4970. 10.1529/biophysj.107.120345. [DOI] [PMC free article] [PubMed] [Google Scholar]
- Stallinga S.; Rieger B. Accuracy of the Gaussian point spread function model in 2D localization microscopy. Opt. Express 2010, 18 (24), 24461–24476. 10.1364/OE.18.024461. [DOI] [PubMed] [Google Scholar]
- Yildiz A.; Forkey J. N.; McKinney S. A.; Ha T.; Goldman Y. E.; Selvin P. R. Myosin V walks hand-over-hand: Single fluorophore imaging with 1.5-nm localization. Science 2003, 300, 2061–2065. 10.1126/science.1084398. [DOI] [PubMed] [Google Scholar]
- Yildiz A.; Selvin P. R. Fluorescence imaging with one nanometer accuracy: application to molecular motors. Acc. Chem. Res. 2005, 38 (7), 574–582. 10.1021/ar040136s. [DOI] [PubMed] [Google Scholar]
- Rieger B.; Stallinga S. The Lateral and Axial Localization Uncertainty in Super-Resolution Light Microscopy. ChemPhysChem 2014, 15 (4), 664–670. 10.1002/cphc.201300711. [DOI] [PubMed] [Google Scholar]
- Mortensen K. I.; Churchman L. S.; Spudich J. A.; Flyvbjerg H. Optimized localization analysis for single-molecule tracking and super-resolution microscopy. Nat. Methods 2010, 7 (5), 377–381. 10.1038/nmeth.1447. [DOI] [PMC free article] [PubMed] [Google Scholar]
- Heilemann M.; Dedecker P.; Hofkens J.; Sauer M. Photoswitches: Key molecules for subdiffraction-resolution fluorescence imaging and molecular quantification. Laser Photonics Rev. 2009, 3 (1–2), 180–202. 10.1002/lpor.200810043. [DOI] [Google Scholar]
- Pavani S. R. P.; Thompson M. A.; Biteen J. S.; Lord S. J.; Liu N.; Twieg R. J.; Piestun R.; Moerner W. E. Three-dimensional, single-molecule fluorescence imaging beyond the diffraction limit by using a double-helix point spread function. Proc. Natl. Acad. Sci. U. S. A. 2009, 106 (9), 2995–2999. 10.1073/pnas.0900245106. [DOI] [PMC free article] [PubMed] [Google Scholar]
- Shechtman Y.; Sahl S. J.; Backer A. S.; Moerner W. E. Optimal Point Spread Function Design for 3D Imaging. Phys. Rev. Lett. 2014, 113 (13), 133902. 10.1103/PhysRevLett.113.133902. [DOI] [PMC free article] [PubMed] [Google Scholar]
- Hess S. T.; Girirajan T. P. K.; Mason M. D. Ultra-high resolution imaging by fluorescence photoactivation localization microscopy. Biophys. J. 2006, 91 (11), 4258–4272. 10.1529/biophysj.106.091116. [DOI] [PMC free article] [PubMed] [Google Scholar]
- Betzig E.; Patterson G. H.; Sougrat R.; Lindwasser O. W.; Olenych S.; Bonifacino J. S.; Davidson M. W.; Lippincott-Schwartz J.; Hess H. F. Imaging intracellular fluorescent proteins at nanometer resolution. Science 2006, 313 (5793), 1642–1645. 10.1126/science.1127344. [DOI] [PubMed] [Google Scholar]
- Rust M. J.; Bates M.; Zhuang X. Sub-diffraction-limit imaging by stochastic optical reconstruction microscopy (STORM). Nat. Methods 2006, 3 (10), 793–796. 10.1038/nmeth929. [DOI] [PMC free article] [PubMed] [Google Scholar]
- Hirschfeld T. Optical microscopic observation of single small molecules. Appl. Opt. 1976, 15 (12), 2965–2966. 10.1364/AO.15.002965. [DOI] [PubMed] [Google Scholar]
- Gelles J.; Schnapp B. J.; Sheetz M. P. Tracking kinesin-driven movements with nanometre-scale precision. Nature 1988, 331, 450–453. 10.1038/331450a0. [DOI] [PubMed] [Google Scholar]
- Anderson C. M.; Georgiou G. N.; Morrison I. E.; Stevenson G. V.; Cherry R. J. Tracking of cell surface receptors by fluorescence digital imaging microscopy using a charge-coupled device camera. Low-density lipoprotein and influenza virus receptor mobility at 4 degrees C. Journal of Cell Science 1992, 101 (2), 415–425. [DOI] [PubMed] [Google Scholar]
- Schmidt T.; Schuetz G. J.; Baumgartner W.; Gruber H. J.; Schindler H. Characterization of Photophysics and Mobility of Single Molecules in a Fluid Lipid Membrane. J. Phys. Chem. 1995, 99, 17662–17668. 10.1021/j100049a030. [DOI] [Google Scholar]
- Vrljic M.; Nishimura S. Y.; Brasselet S.; Moerner W. E.; McConnell H. M. Translational Diffusion of Individual Class II MHC Membrane Proteins in Cells. Biophys. J. 2002, 83, 2681–2692. 10.1016/S0006-3495(02)75277-6. [DOI] [PMC free article] [PubMed] [Google Scholar]
- Zurner A.; Kirstein J.; Doblinger M.; Brauchle C.; Bein T. Visualizing single-molecule diffusion in mesoporous materials. Nature 2007, 450 (7170), 705–708. 10.1038/nature06398. [DOI] [PubMed] [Google Scholar]
- Vrljic M.; Nishimura S. Y.; Moerner W. E., Single-Molecule Tracking. In Methods in Molecular Biology, Vol. 398; Lipid Rafts Humana Press: Totowa, NJ, 2007; Vol. 398, pp 193–219. [DOI] [PubMed] [Google Scholar]
- Bräuchle C.; Lamb D. C.; Michaelis J.. Single particle tracking and single molecule energy transfer; Wiley-VCH: Darmstadt, Germany, 2010. [Google Scholar]
- Kusumi A.; Tsunoyama T. A.; Hirosawa K. M.; Kasai R. S.; Fujiwara T. K. Tracking single molecules at work in living cells. Nat. Chem. Biol. 2014, 10 (7), 524–532. 10.1038/nchembio.1558. [DOI] [PubMed] [Google Scholar]
- Backlund M. P.; Joyner R.; Moerner W. E. Chromosomal locus tracking with proper accounting of static and dynamic errors. Phys. Rev. E 2015, 91, 062716. 10.1103/PhysRevE.91.062716. [DOI] [PMC free article] [PubMed] [Google Scholar]
- Schlichthaerle T.; Eklund A. S.; Schueder F.; Strauss M. T.; Tiede C.; Curd A.; Ries J.; Peckham M.; Tomlinson D. C.; Jungmann R. Site-Specific Labeling of Affimers for DNA-PAINT Microscopy. Angew. Chem., Int. Ed. 2018, 57 (34), 11060–11063. 10.1002/anie.201804020. [DOI] [PubMed] [Google Scholar]
- Huang F.; Sirinakis G.; Allgeyer E. S.; Schroeder L. K.; Duim W. C.; Kromann E. B.; Phan T.; Rivera-Molina F. E.; Myers J. R.; Irnov I.; Lessard M.; Zhang Y.; Handel M. A.; Jacobs-Wagner C.; Lusk C. P.; Rothman J. E.; Toomre D.; Booth M. J.; Bewersdorf J. Ultra-High Resolution 3D Imaging of Whole Cells. Cell 2016, 166 (4), 1028–1040. 10.1016/j.cell.2016.06.016. [DOI] [PMC free article] [PubMed] [Google Scholar]
- Möckl L.; Pedram K.; Roy A. R.; Krishnan V.; Gustavsson A. K.; Dorigo O.; Bertozzi C. R.; Moerner W. E. Quantitative Super-Resolution Microscopy of the Mammalian Glycocalyx. Dev. Cell 2019, 50 (1), 57–72. 10.1016/j.devcel.2019.04.035. [DOI] [PMC free article] [PubMed] [Google Scholar]
- Gustavsson A. K.; Petrov P. N.; Lee M. Y.; Shechtman Y.; Moerner W. E. 3D single-molecule super-resolution microscopy with a tilted light sheet. Nat. Commun. 2018, 9 (123), 1–8. [DOI] [PMC free article] [PubMed] [Google Scholar]
- Zhang Z.; Nishimura Y.; Kanchanawong P. Extracting microtubule networks from superresolution single-molecule localization microscopy data. Mol. Biol. Cell 2017, 28 (2), 333–345. 10.1091/mbc.e16-06-0421. [DOI] [PMC free article] [PubMed] [Google Scholar]
- Petrov P. N.; Moerner W. E. Addressing systematic errors in axial distance measurements in single-emitter localization microscopy. Opt. Express 2020, 28, 18616–18632. 10.1364/OE.391496. [DOI] [PMC free article] [PubMed] [Google Scholar]
- Booth M.; Andrade D.; Burke D.; Patton B.; Zurauskas M. Aberrations and adaptive optics in super-resolution microscopy. Microscopy 2015, 64 (4), 251–261. 10.1093/jmicro/dfv033. [DOI] [PMC free article] [PubMed] [Google Scholar]
- Szczurek A.; Xing J.; Birk U. J.; Cremer C. Single Molecule Localization Microscopy of Mammalian Cell Nuclei on the Nanoscale. Front Genet 2016, 7, 114. [DOI] [PMC free article] [PubMed] [Google Scholar]
- Ricci M. A.; Manzo C.; Garci-A-Parajo M. a. F.; Lakadamyali M.; Cosma M. P. Chromatin Fibers Are Formed by Heterogeneous Groups of Nucleosomes In Vivo. Cell 2015, 160 (6), 1145–1158. 10.1016/j.cell.2015.01.054. [DOI] [PubMed] [Google Scholar]
- Cremer T.; Cremer M.; Huebner B.; Strickfaden H.; Smeets D.; Popken J.; Sterr M.; Markaki Y.; Rippe K.; Cremer C. The 4D nucleome: Evidence for a dynamic nuclear landscape based on co-aligned active and inactive nuclear compartments. FEBS Lett. 2015, 589 (20), 2931–2943. 10.1016/j.febslet.2015.05.037. [DOI] [PubMed] [Google Scholar]
- Kieffer-Kwon K. R.; Nimura K.; Rao S. S. P.; Xu J. L.; Jung S.; Pekowska A.; Dose M.; Stevens E.; Mathe E.; Dong P.; Huang S. C.; Ricci M. A.; Baranello L.; Zheng Y.; Ardori F. T.; Resch W.; Stavreva D.; Nelson S.; McAndrew M.; Casellas A.; Finn E.; Gregory C.; St Hilaire B. G.; Johnson S. M.; Dubois W.; Cosma M. P.; Batchelor E.; Levens D.; Phair R. D.; Misteli T.; Tessarollo L.; Hager G.; Lakadamyali M.; Liu Z.; Floer M.; Shroff H.; Aiden E. L.; Casellas R. Myc Regulates Chromatin Decompaction and Nuclear Architecture during B Cell Activation. Mol. Cell 2017, 67 (4), 566–578. 10.1016/j.molcel.2017.07.013. [DOI] [PMC free article] [PubMed] [Google Scholar]
- Liu Z.; Legant W. R.; Chen B. C.; Li L.; Grimm J. B.; Lavis L. D.; Betzig E.; Tjian R. 3D imaging of Sox2 enhancer clusters in embryonic stem cells. eLife 2014, 3, e04236 10.7554/eLife.04236. [DOI] [PMC free article] [PubMed] [Google Scholar]
- Bohn M.; Diesinger P.; Kaufmann R.; Weiland Y.; Müller P.; Gunkel M.; von Ketteler A.; Lemmer P.; Hausmann M.; Heermann D. W.; Cremer C. Localization Microscopy Reveals Expression-Dependent Parameters of Chromatin Nanostructure. Biophys. J. 2010, 99 (5), 1358–1367. 10.1016/j.bpj.2010.05.043. [DOI] [PMC free article] [PubMed] [Google Scholar]
- Thevathasan J. V.; Kahnwald M.; Cieslinski K.; Hoess P.; Peneti S. K.; Reitberger M.; Heid D.; Kasuba K. C.; Hoerner S. J.; Li Y.; Wu Y. L.; Mund M.; Matti U.; Pereira P. M.; Henriques R.; Nijmeijer B.; Kueblbeck M.; Sabinina V. J.; Ellenberg J.; Ries J. Nuclear pores as versatile reference standards for quantitative superresolution microscopy. Nat. Methods 2019, 16, 1045–1053. 10.1038/s41592-019-0574-9. [DOI] [PMC free article] [PubMed] [Google Scholar]
- Möckl L. The Emerging Role of the Mammalian Glycocalyx in Functional Membrane Organization and Immune System Regulation. Front. Cell Dev. Biol. 2020, 8, 253. 10.3389/fcell.2020.00253. [DOI] [PMC free article] [PubMed] [Google Scholar]
- Laughlin S. T.; Bertozzi C. R. Metabolic labeling of glycans with azido sugars and subsequent glycan-profiling and visualization via Staudinger ligation. Nat. Protoc. 2007, 2 (11), 2930–2944. 10.1038/nprot.2007.422. [DOI] [PubMed] [Google Scholar]
- Sletten E. M.; Bertozzi C. R. Bioorthogonal chemistry: fishing for selectivity in a sea of functionality. Angew. Chem., Int. Ed. 2009, 48 (38), 6974–6998. 10.1002/anie.200900942. [DOI] [PMC free article] [PubMed] [Google Scholar]
- Stone M. B.; Shelby S. A.; Veatch S. L. Super-Resolution Microscopy: Shedding Light on the Cellular Plasma Membrane. Chem. Rev. 2017, 117 (11), 7457–7477. 10.1021/acs.chemrev.6b00716. [DOI] [PMC free article] [PubMed] [Google Scholar]
- Baranov M. V.; Olea R. A.; van den Bogaart G. Chasing Uptake: Super-Resolution Microscopy in Endocytosis and Phagocytosis. Trends Cell Biol. 2019, 29 (9), 727–739. 10.1016/j.tcb.2019.05.006. [DOI] [PubMed] [Google Scholar]
- Konig A. I.; Sorkin R.; Alon A.; Nachmias D.; Dhara K.; Brand G.; Yifrach O.; Arbely E.; Roichman Y.; Elia N. Live cell single molecule tracking and localization microscopy of bioorthogonally labeled plasma membrane proteins. Nanoscale 2020, 12 (5), 3236–3248. 10.1039/C9NR08594G. [DOI] [PubMed] [Google Scholar]
- Waldchen F.; Schlegel J.; Gotz R.; Luciano M.; Schnermann M.; Doose S.; Sauer M. Whole-cell imaging of plasma membrane receptors by 3D lattice light-sheet dSTORM. Nat. Commun. 2020, 11 (1), 887. 10.1038/s41467-020-14731-0. [DOI] [PMC free article] [PubMed] [Google Scholar]
- Rossy J.; Pageon S. V.; Davis D. M.; Gaus K. Super-resolution microscopy of the immunological synapse. Curr. Opin. Immunol. 2013, 25 (3), 307–312. 10.1016/j.coi.2013.04.002. [DOI] [PubMed] [Google Scholar]
- Mace E. M.; Orange J. S. High- and Super-Resolution Microscopy Imaging of the NK Cell Immunological Synapse. Methods Mol. Biol. 2016, 1441, 141–150. 10.1007/978-1-4939-3684-7_12. [DOI] [PMC free article] [PubMed] [Google Scholar]
- Sengupta P.; Jovanovic-Talisman T.; Skoko D.; Renz M.; Veatch S. L.; Lippincott-Schwartz J. Probing protein heterogeneity in the plasma membrane using PALM and pair correlation analysis. Nat. Methods 2011, 8, 969–975. 10.1038/nmeth.1704. [DOI] [PMC free article] [PubMed] [Google Scholar]
- Ji C.; Zhang Y. D.; Xu P. Y.; Xu T.; Lou X. L. Nanoscale Landscape of Phosphoinositides Revealed by Specific Pleckstrin Homology (PH) Domains Using Single-molecule Superresolution Imaging in the Plasma Membrane. J. Biol. Chem. 2015, 290 (45), 26978–26993. 10.1074/jbc.M115.663013. [DOI] [PMC free article] [PubMed] [Google Scholar]
- Mund M.; van der Beek J. A.; Deschamps J.; Dmitrieff S.; Hoess P.; Monster J. L.; Picco A.; Nedelec F.; Kaksonen M.; Ries J. Systematic Nanoscale Analysis of Endocytosis Links Efficient Vesicle Formation to Patterned Actin Nucleation. Cell 2018, 174 (4), 884–896. 10.1016/j.cell.2018.06.032. [DOI] [PMC free article] [PubMed] [Google Scholar]
- Manenschijn H. E.; Picco A.; Mune M.; Rivier-Cordey A. S.; Ries J.; Kaksonen M. Type-I myosins promote actin polymerization to drive membrane bending in endocytosis. eLife 2019, 8, e44215 10.7554/eLife.44215. [DOI] [PMC free article] [PubMed] [Google Scholar]
- Khater I. M.; Meng F.; Wong T. H.; Nabi I. R.; Hamarneh G. Super Resolution Network Analysis Defines the Molecular Architecture of Caveolae and Caveolin-1 Scaffolds. Sci. Rep. 2018, 8, 1–15. [DOI] [PMC free article] [PubMed] [Google Scholar]
- Singla V.; Reiter J. F. The primary cilium as the cell’s antenna: signaling at a sensory organelle. Science 2006, 313, 629–633. 10.1126/science.1124534. [DOI] [PubMed] [Google Scholar]
- Weiss L. E.; Milenkovic L.; Yoon J.; Stearns T.; Moerner W. E. Motional dynamics of single Patched1 molecules in cilia are controlled by Hedgehog and cholesterol. Proc. Natl. Acad. Sci. U. S. A. 2019, 116, 5550–5557. 10.1073/pnas.1816747116. [DOI] [PMC free article] [PubMed] [Google Scholar]
- Yoon J.; Comerci C. J.; Weiss L. E.; Milenkovic L.; Stearns T.; Moerner W. E. Revealing Nanoscale Morphology of the Primary Cilium Using Super-Resolution Fluorescence Microscopy. Biophys. J. 2019, 116 (2), 319–329. 10.1016/j.bpj.2018.11.3136. [DOI] [PMC free article] [PubMed] [Google Scholar]
- Bennett H. W.; Gustavsson A. K.; Bayas C. A.; Petrov P. N.; Mooney N.; Moerner W. E.; Jackson P. K. Novel fibrillar structure in the inversin compartment of primary cilia revealed by 3D single-molecule super-resolution microscopy. Mol. Biol. Cell 2020, 31, 619–639. 10.1091/mbc.E19-09-0499. [DOI] [PMC free article] [PubMed] [Google Scholar]
- Ye F.; Nager A. R.; Nachury M. V. BBSome trains remove activated GPCRs from cilia by enabling passage through the transition zone. J. Cell Biol. 2018, 217 (5), 1847–1868. 10.1083/jcb.201709041. [DOI] [PMC free article] [PubMed] [Google Scholar]
- Yang T. T.; Hampilos P. J.; Nathwani B.; Miller C. H.; Sutaria N. D.; Liao J.-C. Superresolution STED microscopy reveals differential localization in primary cilia. Cytoskeleton 2013, 70 (1), 54–65. 10.1002/cm.21090. [DOI] [PubMed] [Google Scholar]
- Tuson H. H.; Biteen J. S. Unveiling the inner workings of live bacteria using super-resolution microscopy. Anal. Chem. 2015, 87 (1), 42–63. 10.1021/ac5041346. [DOI] [PubMed] [Google Scholar]
- Laplante C.; Huang F.; Bewersdorf J.; Pollard T. D. High-Speed Super-Resolution Imaging of Live Fission Yeast Cells. Methods Mol. Biol. 2016, 1369, 45–57. 10.1007/978-1-4939-3145-3_4. [DOI] [PMC free article] [PubMed] [Google Scholar]
- Buss J.; Coltharp C.; Huang T.; Pohlmeyer C.; Wang S. C.; Hatem C.; Xiao J. In vivo organization of the FtsZ-ring by ZapA and ZapB revealed by quantitative super-resolution microscopy. Mol. Microbiol. 2013, 89 (6), 1099–1120. 10.1111/mmi.12331. [DOI] [PMC free article] [PubMed] [Google Scholar]
- Holden S. J.; Pengo T.; Meibom K. L.; Fernandez Fernandez C.; Collier J.; Manley S. High throughput 3D super-resolution microscopy reveals Caulobacter crescentus in vivo Z-ring organization. Proc. Natl. Acad. Sci. U. S. A. 2014, 111 (12), 4566–4571. 10.1073/pnas.1313368111. [DOI] [PMC free article] [PubMed] [Google Scholar]
- Bayas C. A.; Wang J.; Lee M. K.; Schrader J. M.; Shapiro L.; Moerner W. E. Spatial organization and dynamics of RNase E and ribosomes in Caulobacter crescentus. Proc. Natl. Acad. Sci. U. S. A. 2018, 115 (16), E3712–E3721. 10.1073/pnas.1721648115. [DOI] [PMC free article] [PubMed] [Google Scholar]
- Le Gall A.; Cattoni D. I.; Nollmann M. Imaging of Bacterial Chromosome Organization by 3D Super-Resolution Microscopy. Methods Mol. Biol. 2017, 1624, 253–268. 10.1007/978-1-4939-7098-8_19. [DOI] [PubMed] [Google Scholar]
- Stracy M.; Kapanidis A. N. Single-molecule and super-resolution imaging of transcription in living bacteria. Methods 2017, 120, 103–114. 10.1016/j.ymeth.2017.04.001. [DOI] [PMC free article] [PubMed] [Google Scholar]
- Zhang Y. D.; Lara-Tejero M.; Bewersdorf J.; Galan J. E. Visualization and characterization of individual type III protein secretion machines in live bacteria. Proc. Natl. Acad. Sci. U. S. A. 2017, 114 (23), 6098–6103. 10.1073/pnas.1705823114. [DOI] [PMC free article] [PubMed] [Google Scholar]
- Schlegel J.; Peters S.; Doose S.; Schubert-Unkmeir A.; Sauer M. Super-Resolution Microscopy Reveals Local Accumulation of Plasma Membrane Gangliosides at Neisseria meningitidis Invasion Sites. Front. Cell Dev. Biol. 2019, 7, 194. 10.3389/fcell.2019.00194. [DOI] [PMC free article] [PubMed] [Google Scholar]
- Black L.; Fiche J. B.; Tollis S.; Cheng J.; Notley S.; Crevier B.; Tyers M.; Nollmann M.; Royer C. Super Resolution Imaging of Start Transcription Factors in Yeast. Biophys. J. 2018, 114 (3), 547a–547a. 10.1016/j.bpj.2017.11.2990. [DOI] [Google Scholar]
- Mund M.; Kaplan C.; Ries J. Localization microscopy in yeast. Methods Cell Biol. 2014, 123, 253–271. 10.1016/B978-0-12-420138-5.00014-8. [DOI] [PubMed] [Google Scholar]
- Laplante C.; Huang F.; Tebbs I. R.; Bewersdorf J.; Pollard T. D. Molecular organization of cytokinesis nodes and contractile rings by super-resolution fluorescence microscopy of live fission yeast. Proc. Natl. Acad. Sci. U. S. A. 2016, 113 (40), E5876–E5885. 10.1073/pnas.1608252113. [DOI] [PMC free article] [PubMed] [Google Scholar]
- Dempsey G. T.; Vaughan J. C.; Chen K. H.; Bates M.; Zhuang X. Evaluation of fluorophores for optimal performance in localization-based super-resolution imaging. Nat. Methods 2011, 8, 1027–1036. 10.1038/nmeth.1768. [DOI] [PMC free article] [PubMed] [Google Scholar]
- Grimm J. B.; English B. P.; Chen J.; Slaughter J. P.; Zhang Z.; Revyakin A.; Patel R.; Macklin J. J.; Normanno D. D.; Singer R. H.; Lionnet T.; Lavis L. D. A general method to improve fluorophores for live-cell and single-molecule microscopy. Nat. Methods 2015, 12, 244–250. 10.1038/nmeth.3256. [DOI] [PMC free article] [PubMed] [Google Scholar]
- Grimm J. B.; Muthusamy A. K.; Liang Y. J.; Brown T. A.; Lemon W. C.; Patel R.; Lu R. W.; Macklin J. J.; Keller P. J.; Ji N.; Lavis L. D. A general method to fine-tune fluorophores for live-cell and in vivo imaging. Nat. Methods 2017, 14 (10), 987–994. 10.1038/nmeth.4403. [DOI] [PMC free article] [PubMed] [Google Scholar]
- Bates M.; Dempsey G. T.; Chen K. H.; Zhuang X. Multicolor Super-Resolution Fluorescence Imaging via Multi-Parameter Fluorophore Detection. ChemPhysChem 2012, 13 (1), 99–107. 10.1002/cphc.201100735. [DOI] [PMC free article] [PubMed] [Google Scholar]
- Kremers G.-J.; Gilbert S. G.; Cranfill P. J.; Davidson M. W.; Piston D. W. Fluorescent proteins at a glance. J. Cell Sci. 2011, 124 (2), 157–160. 10.1242/jcs.072744. [DOI] [PMC free article] [PubMed] [Google Scholar]
- Rodriguez E. A.; Campbell R. E.; Lin J. Y.; Lin M. Z.; Miyawaki A.; Palmer A. E.; Shu X.; Zhang J.; Tsien R. Y. The Growing and Glowing Toolbox of Fluorescent and Photoactive Proteins. Trends Biochem. Sci. 2017, 42 (2), 111–129. 10.1016/j.tibs.2016.09.010. [DOI] [PMC free article] [PubMed] [Google Scholar]
- Annibale P.; Scarselli M.; Kodiyan A.; Radenovic A. Photoactivatable Fluorescent Protein mEos2 Displays Repeated Photoactivation after a Long-Lived Dark State in the Red Photoconverted Form. J. Phys. Chem. Lett. 2010, 1 (9), 1506–1510. 10.1021/jz1003523. [DOI] [Google Scholar]
- Dahlberg P. D.; Sartor A. M.; Wang J.; Saurabh S.; Shapiro L.; Moerner W. E. Identification of PAmKate as a Red Photoactivatable Fluorescent Protein for Cryogenic Super-Resolution Imaging. J. Am. Chem. Soc. 2018, 140 (39), 12310–12313. 10.1021/jacs.8b05960. [DOI] [PMC free article] [PubMed] [Google Scholar]
- Grimm J. B.; English B. P.; Choi H.; Muthusamy A. K.; Mehl B. P.; Dong P.; Brown T. A.; Lippincott-Schwartz J.; Liu Z.; Lionnet T.; Lavis L. D. Bright photoactivatable fluorophores for single-molecule imaging. Nat. Methods 2016, 13 (12), 985–988. 10.1038/nmeth.4034. [DOI] [PubMed] [Google Scholar]
- Peterman E. J. G.; Brasselet S.; Moerner W. E. The Fluorescence Dynamics of Single Molecules of Green Fluorescent Protein. J. Phys. Chem. A 1999, 103, 10553–10560. 10.1021/jp991968o. [DOI] [Google Scholar]
- Lord S. J.; Lee H. D.; Samuel R.; Weber R.; Liu N.; Conley N. R.; Thompson M. A.; Twieg R. J.; Moerner W. E. Azido push–pull fluorogens photoactivate to produce bright fluorescent labels. J. Phys. Chem. B 2010, 114, 14157–14167. 10.1021/jp907080r. [DOI] [PMC free article] [PubMed] [Google Scholar]
- Jradi F. M.; Lavis L. D. Chemistry of Photosensitive Fluorophores for Single-Molecule Localization Microscopy. ACS Chem. Biol. 2019, 14 (6), 1077–1090. 10.1021/acschembio.9b00197. [DOI] [PubMed] [Google Scholar]
- Zheng Q.; Ayala A. X.; Chung I.; Weigel A. V.; Ranjan A.; Falco N.; Grimm J. B.; Tkachuk A. N.; Wu C.; Lippincott-Schwartz J.; Singer R. H.; Lavis L. D. Rational Design of Fluorogenic and Spontaneously Blinking Labels for Super-Resolution Imaging. ACS Cent. Sci. 2019, 5 (9), 1602–1613. 10.1021/acscentsci.9b00676. [DOI] [PMC free article] [PubMed] [Google Scholar]
- Kottke T.; van de Linde S.; Sauer M.; Kakorin S.; Heilemann M. Identification of the Product of Photoswitching of an Oxazine Fluorophore Using Fourier Transform Infrared Difference Spectroscopy. J. Phys. Chem. Lett. 2010, 1 (21), 3156–3159. 10.1021/jz101300t. [DOI] [Google Scholar]
- Andresen M.; Wahl M. C.; Stiel A. C.; Grater F.; Schafer L. V.; Trowitzsch S.; Weber G.; Eggeling C.; Grubmuller H.; Hell S. W.; Jakobs S. Structure and mechanism of the reversible photoswitch of a fluorescent protein. Proc. Natl. Acad. Sci. U. S. A. 2005, 102 (37), 13070–13074. 10.1073/pnas.0502772102. [DOI] [PMC free article] [PubMed] [Google Scholar]
- Dempsey G. T.; Bates M.; Kowtoniuk W. E.; Liu D. R.; Tsien R. Y.; Zhuang X. Photoswitching Mechanism of Cyanine Dyes. J. Am. Chem. Soc. 2009, 131 (51), 18192–18193. 10.1021/ja904588g. [DOI] [PMC free article] [PubMed] [Google Scholar]
- Woodhouse J.; Nass Kovacs G.; Coquelle N.; Uriarte L. M.; Adam V.; Barends T. R. M.; Byrdin M.; de la Mora E.; Bruce Doak R.; Feliks M.; Field M.; Fieschi F.; Guillon V.; Jakobs S.; Joti Y.; Macheboeuf P.; Motomura K.; Nass K.; Owada S.; Roome C. M.; Ruckebusch C.; Schiro G.; Shoeman R. L.; Thepaut M.; Togashi T.; Tono K.; Yabashi M.; Cammarata M.; Foucar L.; Bourgeois D.; Sliwa M.; Colletier J. P.; Schlichting I.; Weik M. Photoswitching mechanism of a fluorescent protein revealed by time-resolved crystallography and transient absorption spectroscopy. Nat. Commun. 2020, 11 (1), 741. 10.1038/s41467-020-14537-0. [DOI] [PMC free article] [PubMed] [Google Scholar]
- Weisenburger S.; Boening D.; Schomburg B.; Giller K.; Becker S.; Griesinger C.; Sandoghdar V. Cryogenic optical localization provides 3D protein structure data with Angstrom resolution. Nat. Methods 2017, 14, 141. 10.1038/nmeth.4141. [DOI] [PubMed] [Google Scholar]
- Dahlberg P. D.; Saurabh S.; Sartor A. M.; Wang J.; Mitchell P. G.; Chiu W.; Shapiro L.; Moerner W. E. Cryogenic single-molecule fluorescence annotations for electron tomography reveal in situ organization of key proteins in Caulobacter. Proc. Natl. Acad. Sci. U.S.A. 2020, 117 (25), 13937–13944. [DOI] [PMC free article] [PubMed] [Google Scholar]
- Sharonov A.; Hochstrasser R. M. Wide-field subdiffraction imaging by accumulated binding of diffusing probes. Proc. Natl. Acad. Sci. U. S. A. 2006, 103 (50), 18911–18916. 10.1073/pnas.0609643104. [DOI] [PMC free article] [PubMed] [Google Scholar]
- Jungmann R.; Steinhauer C.; Scheible M.; Kuzyk A.; Tinnefeld P.; Simmel F. C. Single-Molecule Kinetics and Super-Resolution Microscopy by Fluorescence Imaging of Transient Binding on DNA Origami. Nano Lett. 2010, 10, 4756–4761. 10.1021/nl103427w. [DOI] [PubMed] [Google Scholar]
- Jungmann R.; Avendano M. S.; Woehrstein J. B.; Dai M.; Shih W. M.; Yin P. Multiplexed 3D cellular super-resolution imaging with DNA-PAINT and Exchange-PAINT. Nat. Methods 2014, 11, 313–318. 10.1038/nmeth.2835. [DOI] [PMC free article] [PubMed] [Google Scholar]
- Schnitzbauer J.; Strauss M. T.; Schlichthaerle T.; Schueder F.; Jungmann R. Super-resolution microscopy with DNA-PAINT. Nat. Protoc. 2017, 12 (6), 1198. 10.1038/nprot.2017.024. [DOI] [PubMed] [Google Scholar]
- Spahn C. K.; Glaesmann M.; Grimm J. B.; Ayala A. X.; Lavis L. D.; Heilemann M. A toolbox for multiplexed super-resolution imaging of the E. coli nucleoid and membrane using novel PAINT labels. Sci. Rep. 2018, 8, 1–12. [DOI] [PMC free article] [PubMed] [Google Scholar]
- Ondrus A. E.; Lee H.-l. D.; Iwanaga S.; Parsons W. H.; Andresen B. M.; Moerner W. E.; Du Bois J. Fluorescent Saxitoxins for Live Cell Imaging of Single Voltage-Gated Sodium Ion Channels beyond the Optical Diffraction Limit. Chem. Biol. 2012, 19 (7), 902–912. 10.1016/j.chembiol.2012.05.021. [DOI] [PMC free article] [PubMed] [Google Scholar]
- Chung K. K. Z. Z; Kidd P.; Zhang Y.; Williams N. D.; Rollins B.; Yang Y.; Lin C.; Baddeley D.; Bewersdorf J. Fluorogenic probe for fast 3D whole-cell DNA-PAINT. BioRxiv 2020, 066886. [Google Scholar]
- Nieves D. J.; Gaus K.; Baker M. A. B. DNA-Based Super-Resolution Microscopy: DNA-PAINT. Genes 2018, 9 (12), 621. 10.3390/genes9120621. [DOI] [PMC free article] [PubMed] [Google Scholar]
- Lee S.-H.; Shin J. Y.; Lee A.; Bustamante C. Counting single photoactivatable fluorescent molecules by photoactivated localization microscopy (PALM). Proc. Natl. Acad. Sci. U. S. A. 2012, 109 (43), 17436–17441. 10.1073/pnas.1215175109. [DOI] [PMC free article] [PubMed] [Google Scholar]
- Nyquist H. Certain Topics in Telegraph Transmission Theory. Trans. Am. Inst. Electr. Eng. 1928, 47, 617–644. 10.1109/T-AIEE.1928.5055024. [DOI] [Google Scholar]
- Shannon C. E. Communication in the Presence of Noise. Proc. IRE 1949, 37 (1), 10–21. 10.1109/JRPROC.1949.232969. [DOI] [Google Scholar]
- Shroff H.; Galbraith C. G.; Galbraith J. A.; White H.; Gillette J.; Olenych S.; Davidson M. W.; Betzig E. Dual-color superresolution imaging of genetically expressed probes within individual adhesion complexes. Proc. Natl. Acad. Sci. U. S. A. 2007, 104 (51), 20308–20313. 10.1073/pnas.0710517105. [DOI] [PMC free article] [PubMed] [Google Scholar]
- Baskin J. M.; Prescher J. A.; Laughlin S. T.; Agard N. J.; Chang P. V.; Miller I. A.; Lo A.; Codelli J. A.; Bertozzi C. R. Copper-free click chemistry for dynamic in vivo imaging. Proc. Natl. Acad. Sci. U. S. A. 2007, 104 (43), 16793–16797. 10.1073/pnas.0707090104. [DOI] [PMC free article] [PubMed] [Google Scholar]
- Ambrogelly A.; Palioura S.; Soll D. Natural expansion of the genetic code. Nat. Chem. Biol. 2007, 3 (1), 29–35. 10.1038/nchembio847. [DOI] [PubMed] [Google Scholar]
- Chatterjee A.; Guo J. T.; Lee H. S.; Schultz P. G. A Genetically Encoded Fluorescent Probe in Mammalian Cells. J. Am. Chem. Soc. 2013, 135 (34), 12540–12543. 10.1021/ja4059553. [DOI] [PMC free article] [PubMed] [Google Scholar]
- Prescher J. A.; Bertozzi C. R. Chemistry in living systems. Nat. Chem. Biol. 2005, 1 (1), 13–21. 10.1038/nchembio0605-13. [DOI] [PubMed] [Google Scholar]
- Chen B. H.; Zou W.; Xu H. Y.; Liang Y.; Huang B. Efficient labeling and imaging of protein-coding genes in living cells using CRISPR-Tag. Nat. Commun. 2018, 9, 1–9. [DOI] [PMC free article] [PubMed] [Google Scholar]
- Ma H. H.; Naseri A.; Reyes-Gutierrez P.; Wolfe S. A.; Zhang S. J.; Pederson T. Multicolor CRISPR labeling of chromosomal loci in human cells. Proc. Natl. Acad. Sci. U. S. A. 2015, 112 (10), 3002–3007. 10.1073/pnas.1420024112. [DOI] [PMC free article] [PubMed] [Google Scholar]
- Zanacchi F. C.; Manzo C.; Alvarez A. S.; Derr N. D.; Garcia-Parajo M. F.; Lakadamyali M. A DNA origami platform for quantifying protein copy number in super-resolution. Nat. Methods 2017, 14 (8), 789–792. 10.1038/nmeth.4342. [DOI] [PMC free article] [PubMed] [Google Scholar]
- Sun X.; Zhang A.; Baker B.; Sun L.; Howard A.; Buswell J.; Maurel D.; Masharina A.; Johnsson K.; Noren C. J.; Xu M. Q.; Correa I. R. Jr. Development of SNAP-tag fluorogenic probes for wash-free fluorescence imaging. ChemBioChem 2011, 12, 2217–2226. 10.1002/cbic.201100173. [DOI] [PMC free article] [PubMed] [Google Scholar]
- Los G. V.; Encell L. P.; McDougall M. G.; Hartzell D. D.; Karassina N.; Zimprich C.; Wood M. G.; Learish R.; Ohana R. F.; Urh M.; Simpson D.; Mendez J.; Zimmerman K.; Otto P.; Vidugiris G.; Zhu J.; Darzins A.; Klaubert D. H.; Bulleit R. F.; Wood K. V. HaloTag: A Novel Protein Labeling Technology for Cell Imaging and Protein Analysis. ACS Chem. Biol. 2008, 3 (6), 373–382. 10.1021/cb800025k. [DOI] [PubMed] [Google Scholar]
- Lam M. T.; Longaker M. T. Comparison of several attachment methods for human iPS, embryonic and adipose-derived stem cells for tissue engineering. J. Tissue Eng. Regen M 2012, 6, s80-s86. [DOI] [PMC free article] [PubMed] [Google Scholar]
- Bogdanowicz D. R.; Lu H. H. Studying cell-cell communication in co-culture. Biotechnol. J. 2013, 8 (4), 395–396. 10.1002/biot.201300054. [DOI] [PMC free article] [PubMed] [Google Scholar]
- Lancaster M. A.; Knoblich J. A. Organogenesis in a dish: Modeling development and disease using organoid technologies. Science 2014, 345 (6194), 1247125. 10.1126/science.1247125. [DOI] [PubMed] [Google Scholar]
- Chen B. C.; Legant W. R.; Wang K.; Shao L.; Milkie D. E.; Davidson M. W.; Janetopoulos C.; Wu X. S.; Hammer J. A. 3rd; Liu Z.; English B. P.; Mimori-Kiyosue Y.; Romero D. P.; Ritter A. T.; Lippincott-Schwartz J.; Fritz-Laylin L.; Mullins R. D.; Mitchell D. M.; Bembenek J. N.; Reymann A. C.; Bohme R.; Grill S. W.; Wang J. T.; Seydoux G.; Tulu U. S.; Kiehart D. P.; Betzig E. Lattice light-sheet microscopy: imaging molecules to embryos at high spatiotemporal resolution. Science 2014, 346 (6208), 1257998. 10.1126/science.1257998. [DOI] [PMC free article] [PubMed] [Google Scholar]
- Legant W. R.; Shao L.; Grimm J. B.; Brown T. A.; Milkie D. E.; Avants B. B.; Lavis L. D.; Betzig E. High-density three-dimensional localization microscopy across large volumes. Nat. Methods 2016, 13 (4), 359–365. 10.1038/nmeth.3797. [DOI] [PMC free article] [PubMed] [Google Scholar]
- Liu T.-L.; Upadhyayula S.; Milkie D. E.; Singh V.; Wang K.; Swinburne I. A.; Mosaliganti K. R.; Collins Z. M.; Hiscock T. W.; Shea J.; Kohrman A. Q.; Medwig T. N.; Dambournet D.; Forster R.; Cunniff B.; Ruan Y.; Yashiro H.; Scholpp S.; Meyerowitz E. M.; Hockemeyer D.; Drubin D. G.; Martin B. L.; Matus D. Q.; Koyama M.; Megason S. G.; Kirchhausen T.; Betzig E. Observing the cell in its native state: Imaging subcellular dynamics in multicellular organisms. Science 2018, 360 (6386), eaaq1392 10.1126/science.aaq1392. [DOI] [PMC free article] [PubMed] [Google Scholar]
- Bewersdorf J.; Schmidt R.; Hell S. W. Comparison of I5M and 4Pi-microscopy. J. Microsc. 2006, 222 (2), 105–117. 10.1111/j.1365-2818.2006.01578.x. [DOI] [PubMed] [Google Scholar]
- Liu S.; Huang F. Enhanced 4Pi single-molecule localization microscopy with coherent pupil based localization. Commun. Biol. 2020, 3 (1), 220. 10.1038/s42003-020-0908-2. [DOI] [PMC free article] [PubMed] [Google Scholar]
- Dean K. M.; Roudot P.; Reis C. R.; Welf E. S.; Mettlen M.; Fiolka R. Diagonally Scanned Light-Sheet Microscopy for Fast Volumetric Imaging of Adherent Cells. Biophys. J. 2016, 110, 1456–1465. 10.1016/j.bpj.2016.01.029. [DOI] [PMC free article] [PubMed] [Google Scholar]
- Valm A. M.; Cohen S.; Legant W. R.; Melunis J.; Hershberg U.; Wait E.; Cohen A. R.; Davidson M. W.; Betzig E.; Lippincott-Schwartz J. Applying systems-level spectral imaging and analysis to reveal the organelle interactome. Nature 2017, 546 (7656), 162–167. 10.1038/nature22369. [DOI] [PMC free article] [PubMed] [Google Scholar]
- Cohen S.; Valm A. M.; Lippincott-Schwartz J. Interacting organelles. Curr. Opin. Cell Biol. 2018, 53, 84–91. 10.1016/j.ceb.2018.06.003. [DOI] [PMC free article] [PubMed] [Google Scholar]
- von Diezmann A.; Lee M. Y.; Lew M. D.; Moerner W. E. Correcting field-dependent aberrations with nanoscale accuracy in three-dimensional single-molecule localization microscopy. Optica 2015, 2 (11), 985–993. 10.1364/OPTICA.2.000985. [DOI] [PMC free article] [PubMed] [Google Scholar]
- Zhang Z.; Kenny S. J.; Hauser M.; Li W.; Xu K. Ultrahigh-throughput single-molecule spectroscopy and spectrally resolved super-resolution microscopy. Nat. Methods 2015, 12 (10), 935–938. 10.1038/nmeth.3528. [DOI] [PubMed] [Google Scholar]
- Zhao T.; Wang Y.; Zhai Y. L.; Qu X. X.; Cheng A. F.; Du S. W.; Loy M. M. T. A user-friendly two-color super-resolution localization microscope. Opt. Express 2015, 23 (2), 1879–1887. 10.1364/OE.23.001879. [DOI] [PubMed] [Google Scholar]
- von Diezmann A.; Shechtman Y.; Moerner W. E. Three-Dimensional Localization of Single Molecules for Super-Resolution Imaging and Single-Particle Tracking. Chem. Rev. 2017, 117 (11), 7244–7275. 10.1021/acs.chemrev.6b00629. [DOI] [PMC free article] [PubMed] [Google Scholar]
- Huang B.; Wang W.; Bates M.; Zhuang X. Three-dimensional super-resolution imaging by stochastic optical reconstruction microscopy. Science 2008, 319 (5864), 810–813. 10.1126/science.1153529. [DOI] [PMC free article] [PubMed] [Google Scholar]
- Huang B.; Jones S. A.; Brandenburg B.; Zhuang X. Whole-cell 3D STORM reveals interactions between cellular structures with nanometer-scale resolution. Nat. Methods 2008, 5 (12), 1047–1052. 10.1038/nmeth.1274. [DOI] [PMC free article] [PubMed] [Google Scholar]
- Holtzer L.; Meckel T.; Schmidt T. Nanometric three-dimensional tracking of individual quantum dots in cells. Appl. Phys. Lett. 2007, 90, 053902. 10.1063/1.2437066. [DOI] [Google Scholar]
- Pavani S. R. P.; Thompson M. A.; Biteen J. S.; Lord S. J.; Liu N.; Twieg R. J.; Piestun R.; Moerner W. E. Three-dimensional, single-molecule fluorescence imaging beyond the diffraction limit by using a double-helix point spread function. Proc. Natl. Acad. Sci. U. S. A. 2009, 106 (9), 2995–2999. 10.1073/pnas.0900245106. [DOI] [PMC free article] [PubMed] [Google Scholar]
- Pavani S. R. P.; DeLuca J. G.; Piestun R. Polarization sensitive, three-dimensional, single-molecule imaging of cells with a double-helix system. Opt. Express 2009, 17 (22), 19644–19655. 10.1364/OE.17.019644. [DOI] [PubMed] [Google Scholar]
- Shechtman Y.; Weiss L. E.; Backer A. S.; Sahl S. J.; Moerner W. E. Precise 3D scan-free multiple-particle tracking over large axial ranges with Tetrapod point spread functions. Nano Lett. 2015, 15 (6), 4194–4199. 10.1021/acs.nanolett.5b01396. [DOI] [PMC free article] [PubMed] [Google Scholar]
- Nehme E.; Freedman D.; Gordon R.; Ferdman B.; Weiss L. E.; Alalouf O.; Naor T.; Orange R.; Michaeli T.; Shechtman Y. DeepSTORM3D: dense 3D localization microscopy and PSF design by deep learning. Nat. Methods 2020, 17, 734–740. 10.1038/s41592-020-0853-5. [DOI] [PMC free article] [PubMed] [Google Scholar]
- Baddeley D.; Cannell M. B.; Soeller C. Three-dimensional sub-100 nm super-resolution imaging of biological samples using a phase ramp in the objective pupil. Nano Res. 2011, 4 (6), 589–598. 10.1007/s12274-011-0115-z. [DOI] [Google Scholar]
- Hell S. W.; Reiner G.; Cremer C.; Stelzer E. H. K. Aberrations in confocal fluorescence microscopy induced by mismatches in refractive index. J. Microsc. 1993, 169 (3), 391–405. 10.1111/j.1365-2818.1993.tb03315.x. [DOI] [Google Scholar]
- Xu F.; Ma D.; MacPherson K. P.; Liu S.; Bu Y.; Wang Y.; Bi C.; Kwok T.; Yin P.; Calve S.; Landreth G. E.; Huang F. Three dimensional nanoscopy of whole cells and tissues with in situ point spread function retrieval. Nat. Methods 2020, 17, 531–540. 10.1038/s41592-020-0816-x. [DOI] [PMC free article] [PubMed] [Google Scholar]
- Booth M. J. Adaptive optics in microscopy. Philos. Trans. R. Soc., A 2007, 365, 2829–2843. 10.1098/rsta.2007.0013. [DOI] [PubMed] [Google Scholar]
- Azucena O.; Crest J.; Kotadia S.; Sullivan W.; Tao X.; Reinig M.; Gavel D.; Olivier S.; Kubby J. Adaptive optics wide-field microscopy using direct wavefront sensing. Opt. Lett. 2011, 36, 825–827. 10.1364/OL.36.000825. [DOI] [PubMed] [Google Scholar]
- Gould T. J.; Burke D.; Bewersdorf J.; Booth M. J. Adaptive optics enables 3D STED microscopy in aberrating specimens. Opt. Express 2012, 20 (19), 20998–21009. 10.1364/OE.20.020998. [DOI] [PMC free article] [PubMed] [Google Scholar]
- Grover G.; Mohrman W.; Piestun R. Real-time adaptive drift correction for super-resolution localization microscopy. Opt. Express 2015, 23 (18), 23887–23898. 10.1364/OE.23.023887. [DOI] [PubMed] [Google Scholar]
- Mlodzianoski M. J.; Cheng-Hathaway P. J.; Bemiller S. M.; McCray T. J.; Liu S.; Miller D. A.; Lamb B. T.; Landreth G. E.; Huang F. Active PSF shaping and adaptive optics enable volumetric localization microscopy through brain sections. Nat. Methods 2018, 15, 583–586. 10.1038/s41592-018-0053-8. [DOI] [PMC free article] [PubMed] [Google Scholar]
- Hardy J. W.Adaptive Optics for Astronomical Telescopes; Oxford University Press: New York, 1998. [Google Scholar]
- Sartori A.; Gatz R.; Beck F.; Rigort A.; Baumeister W.; Plitzko J. M. Correlative microscopy: bridging the gap between fluorescence light microscopy and cryo-electron tomography. J. Struct. Biol. 2007, 160 (2), 135–145. 10.1016/j.jsb.2007.07.011. [DOI] [PubMed] [Google Scholar]
- Koning R. I.; Celler K.; Willemse J.; Bos E.; van Wezel G. P.; Koster A. J., Correlative Cryo-Fluorescence Light Microscopy and Cryo-Electron Tomography of Streptomyces. In Correlative Light and Electron Microscopy II; Müller-Reichert T., Verkade P., Eds.; Academic Press: 2014; Vol. 124, pp 217–239. [DOI] [PubMed] [Google Scholar]
- Wolff G.; Hagen C.; Grünewald K.; Kaufmann R. Towards correlative super-resolution fluorescence and electron cryo-microscopy. Biology of the Cell 2016, 108 (9), 245–258. 10.1111/boc.201600008. [DOI] [PMC free article] [PubMed] [Google Scholar]
- Tuijtel M. W.; Koster A. J.; Jakobs S.; Faas F. G. A.; Sharp T. H. Correlative cryo super-resolution light and electron microscopy on mammalian cells using fluorescent proteins. Sci. Rep. 2019, 9 (1), 1369. 10.1038/s41598-018-37728-8. [DOI] [PMC free article] [PubMed] [Google Scholar]
- Dahlberg P. D.; Perez D.; Su Z.; Chiu W.; Moerner W. E. Cryogenic Correlative Single-Particle Photoluminescence Spectroscopy and Electron Tomography for Investigation of Nanomaterials. Angew. Chem., Int. Ed. 2020, 59 (36), 15642–15648. 10.1002/anie.202002856. [DOI] [PMC free article] [PubMed] [Google Scholar]
- Wu G.-H.; Mitchell P. G.; Galaz-Montoya J. G.; Hecksel C. W.; Sontag E. M.; Gangadharan V.; Marshman J.; Mankus D.; Bisher M. E.; Lytton-Jean A. K. R.. Multi-Scale 3D Cryo-Correlative Microscopy for Vitrified Cells. Structure 2020, in press. 10.1016/j.str.2020.07.017. [DOI] [PMC free article] [PubMed] [Google Scholar]
- Huang F.; Hartwich T. M. P.; Rivera-Molina F. E.; Lin Y.; Duim W. C.; Long J. J.; Uchil P. D.; Myers J. R.; Baird M. A.; Mothes W.; Davidson M. W.; Toomre D.; Bewersdorf J. Video-rate nanoscopy using sCMOS camera-specific single-molecule localization algorithms. Nat. Methods 2013, 10 (7), 653–658. 10.1038/nmeth.2488. [DOI] [PMC free article] [PubMed] [Google Scholar]
- Mlodzianoski M. J.; Schreiner J. M.; Callahan S. P.; Smolková K.; Dlasková A.; Šantorová J.; Ježek P.; Bewersdorf J. Sample drift correction in 3D fluorescence photoactivation localization microscopy. Opt. Express 2011, 19 (16), 15009–15019. 10.1364/OE.19.015009. [DOI] [PubMed] [Google Scholar]
- Elmokadem A.; Yu J. Optimal Drift Correction for Superresolution Localization Microscopy with Bayesian Inference. Biophys. J. 2015, 109 (9), 1772–1780. 10.1016/j.bpj.2015.09.017. [DOI] [PMC free article] [PubMed] [Google Scholar]
- McGorty R.; Kamiyama D.; Huang B. Active Microscope Stabilization in Three Dimensions Using Image Correlation. Opt Nanoscopy 2013, 2 (1), 3. 10.1186/2192-2853-2-3. [DOI] [PMC free article] [PubMed] [Google Scholar]
- Coelho S.; Baek J.; Graus M. S.; Halstead J. M.; Nicovich P. R.; Feher K.; Gandhi H.; Gooding J. J.; Gaus K., Ultraprecise single-molecule localization microscopy enables in situ distance measurements in intact cells. Science Advances 2020, 6 ( (16), ). [DOI] [PMC free article] [PubMed] [Google Scholar]
- Backer A. S.; Backlund M. P.; Lew M. D.; Moerner W. E. Single-molecule orientation measurements with a quadrated pupil. Opt. Lett. 2013, 38 (9), 1521–1523. 10.1364/OL.38.001521. [DOI] [PMC free article] [PubMed] [Google Scholar]
- Hashimoto M.; Yoshiki K.; Kurihara M.; Hashimoto N.; Araki T. Orientation detection of a single molecule using pupil filter with electrically controllable polarization pattern. Optical Review 2015, 1–7. [Google Scholar]
- Kress A.; Wang X.; Ranchon H.; Savatier J.; Rigneault H.; Ferrand P.; Brasselet S. Mapping the local organization of cell membranes using excitation-polarization-resolved confocal fluorescence microscopy. Biophys. J. 2013, 105, 127–136. 10.1016/j.bpj.2013.05.043. [DOI] [PMC free article] [PubMed] [Google Scholar]
- Zhang W.; Tang B.; Liu X.; Liu Y.; Xu K.; Ma J.; Tong L.; Yang G. A highly sensitive acidic pH fluorescent probe and its application to HepG2 cells. Analyst 2009, 134 (2), 367–371. 10.1039/B807581F. [DOI] [PubMed] [Google Scholar]
- Kim T.; Moon S.; Xu K. Information-rich localization microscopy through machine learning. Nat. Commun. 2019, 10, 1996. 10.1038/s41467-019-10036-z. [DOI] [PMC free article] [PubMed] [Google Scholar]
- Yushchenko D. A.; Zhang M.; Yan Q.; Waggoner A. S.; Bruchez M. P. Genetically targetable and color-switching fluorescent probe. ChemBioChem 2012, 13 (11), 1564–1568. 10.1002/cbic.201200334. [DOI] [PMC free article] [PubMed] [Google Scholar]
- Schroeyers W.; Vallée R.; Patra D.; Hofkens J.; Habuchi S.; Vosch T.; Cotlet M.; Müllen K.; Enderlein J.; De Schryver F. C. Fluorescence lifetimes and emission patterns probe the 3D orientation of the emitting chromophore in a multichromophoric system. J. Am. Chem. Soc. 2004, 126, 14310–14311. 10.1021/ja0474603. [DOI] [PubMed] [Google Scholar]
- Ding T.; Wu T.; Mazidi H.; Zhang O.; Lew M. D. Single-molecule orientation localization microscopy for resolving structural heterogeneities between amyloid fibrils. Optica 2020, 7, 602–607. 10.1364/OPTICA.388157. [DOI] [PMC free article] [PubMed] [Google Scholar]
- Moon S.; Yan R.; Kenny S. J.; Shyu Y.; Xiang L. M.; Li W.; Xu K. Spectrally Resolved, Functional Super-Resolution Microscopy Reveals Nanoscale Compositional Heterogeneity in Live-Cell Membranes. J. Am. Chem. Soc. 2017, 139 (32), 10944–10947. 10.1021/jacs.7b03846. [DOI] [PubMed] [Google Scholar]
- Bongiovanni M. N.; Godet J.; Horrocks M. H.; Tosatto L.; Carr A. R.; Wirthensohn D. C.; Ranasinghe R. T.; Lee J. E.; Ponjavic A.; Fritz J. V.; Dobson C. M.; Klenerman D.; Lee S. F. Multi-dimensional super-resolution imaging enables surface hydrophobicity mapping. Nat. Commun. 2016, 7, 13544. 10.1038/ncomms13544. [DOI] [PMC free article] [PubMed] [Google Scholar]
- Lee J. E.; Sang J. C.; Rodrigues M.; Carr A. R.; Horrocks M. H.; De S.; Bongiovanni M. N.; Flagmeier P.; Dobson C. M.; Wales D. J.; Lee S. F.; Klenerman D. Mapping Surface Hydrophobicity of alpha-Synuclein Oligomers at the Nanoscale. Nano Lett. 2018, 18 (12), 7494–7501. 10.1021/acs.nanolett.8b02916. [DOI] [PMC free article] [PubMed] [Google Scholar]
- Zhang P.; Liu S.; Chaurasia A.; Ma D.; Mlodzianoski M. J.; Culurciello E.; Huang F. Analyzing complex single-molecule emission patterns with deep learning. Nat. Methods 2018, 15, 913–916. 10.1038/s41592-018-0153-5. [DOI] [PMC free article] [PubMed] [Google Scholar]
- Nehme E.; Weiss L. E.; Michaeli T.; Shechtman Y. Deep-STORM: super-resolution single-molecule microscopy by deep learning. Optica 2018, 5 (4), 458–464. 10.1364/OPTICA.5.000458. [DOI] [Google Scholar]
- Zhu L.; Zhang W.; Elnatan D.; Huang B. Faster STORM using compressed sensing. Nat. Methods 2012, 9 (7), 721–723. 10.1038/nmeth.1978. [DOI] [PMC free article] [PubMed] [Google Scholar]
- Paine S. W.; Fienup J. R. Machine learning for improved image-based wavefront sensing. Opt. Lett. 2018, 43 (6), 1235–1238. 10.1364/OL.43.001235. [DOI] [PubMed] [Google Scholar]
- Saha D.; Schmidt U.; Zhang Q.; Barbotin A.; Hu Q.; Ji N.; Booth M.; Weigert M.; Myers E. Practical sensorless aberration estimation for 3D microscopy with deep learning. Opt. Express 2020, 28 (20), 29044–29053. 10.1364/OE.401933. [DOI] [PMC free article] [PubMed] [Google Scholar]
- Möckl L.; Petrov P. N.; Moerner W. E. Accurate phase retrieval of complex 3D point spread functions with deep residual neural networks. Appl. Phys. Lett. 2019, 115, 251106. 10.1063/1.5125252. [DOI] [PMC free article] [PubMed] [Google Scholar]
- Möckl L.; Roy A. R.; Petrov P. N.; Moerner W. E. Accurate and rapid background estimation in single-molecule localization microscopy using the deep neural network BGnet. Proc. Natl. Acad. Sci. U. S. A. 2020, 117 (1), 60–67. 10.1073/pnas.1916219117. [DOI] [PMC free article] [PubMed] [Google Scholar]
- Hershko E.; Weiss L. E.; Michaeli T.; Shechtman Y. Multicolor localization microscopy and point-spread-function engineering by deep learning. Opt. Express 2019, 27 (5), 6158–6183. 10.1364/OE.27.006158. [DOI] [PubMed] [Google Scholar]
- Ouyang W.; Aristov A.; Lelek M.; Hao X.; Zimmer C. Deep learning massively accelerates super-resolution localization microscopy. Nat. Biotechnol. 2018, 36 (5), 460–468. 10.1038/nbt.4106. [DOI] [PubMed] [Google Scholar]
- Zhang H.; Fang C. Y.; Xie X. L.; Yang Y. C.; Mei W.; Jin D.; Fei P. High-throughput, high-resolution deep learning microscopy based on registration-free generative adversarial network. Biomed. Opt. Express 2019, 10 (3), 1044–1063. 10.1364/BOE.10.001044. [DOI] [PMC free article] [PubMed] [Google Scholar]
- Möckl L.; Roy A. R.; Moerner W. E. Deep learning in single-molecule microscopy: fundamentals, caveats, and recent developments. Biomed. Opt. Express 2020, 11, 1633–1661. 10.1364/BOE.386361. [DOI] [PMC free article] [PubMed] [Google Scholar]
- Haberl M. G.; Churas C.; Tindall L.; Boassa D.; Phan S.; Bushong E. A.; Madany M.; Akay R.; Deerinck T. J.; Peltier S. T.; Ellisman M. H. CDeep3M-Plug-and-Play cloud-based deep learning for image segmentation. Nat. Methods 2018, 15 (9), 677–680. 10.1038/s41592-018-0106-z. [DOI] [PMC free article] [PubMed] [Google Scholar]
- Ouyang W.; Mueller F.; Hjelmare M.; Lundberg E.; Zimmer C. ImJoy: an open-source computational platform for the deep learning era. Nat. Methods 2019, 16 (12), 1199–1200. 10.1038/s41592-019-0627-0. [DOI] [PubMed] [Google Scholar]
- Li L.; Xin B.; Kuang W.; Zhou Z.; Huang Z.-L. Divide and conquer: real-time maximum likelihood fitting of multiple emitters for super-resolution localization microscopy. Opt. Express 2019, 27 (15), 21029–21049. 10.1364/OE.27.021029. [DOI] [PubMed] [Google Scholar]
- Kechkar A.; Nair D.; Heilemann M.; Choquet D.; Sibarita J. B. Real-Time Analysis and Visualization for Single-Molecule Based Super-Resolution Microscopy. PLoS One 2013, 8 (4), e62918 10.1371/journal.pone.0062918. [DOI] [PMC free article] [PubMed] [Google Scholar]
- Munro I.; Garcia E.; Yan M.; Guldbrand S.; Kumar S.; Kwakwa K.; Dunsby C.; Neil M. A. A.; French P. M. W. Accelerating single molecule localization microscopy through parallel processing on a high-performance computing cluster. J. Microsc. 2019, 273 (2), 148–160. 10.1111/jmi.12772. [DOI] [PMC free article] [PubMed] [Google Scholar]
- Barentine A. E. S.; Lin Y.; Liu M.; Kidd P.; Balduf L.; Grace M. R.; Wang S.; Bewersdorf J.; Baddeley D. 3D Multicolor Nanoscopy at 10,000 Cells a Day. bioRxiv 2019, 606954. [Google Scholar]
- Swulius M. T.; Jensen G. J. The Helical MreB Cytoskeleton in Escherichia coli MC1000/pLE7 Is an Artifact of the N-Terminal Yellow Fluorescent Protein Tag. J. Bacteriol. 2012, 194 (23), 6382–6386. 10.1128/JB.00505-12. [DOI] [PMC free article] [PubMed] [Google Scholar]
- Sage D.; Pham T.; Babcock H.; Lukes T.; Pengo T.; Chao J.; Velmurugan R.; Herbert A.; Agrawal A.; Colabrese S.; Wheeler A.; Archetti A.; Rieger B.; Ober R.; Hagen G. M.; Sibarita J. M.; Ries J.; Henriques R.; Unser M.; Holden S. Super-resolution fight club: assessment of 2D and 3D single-molecule localization microscopy software. Nat. Methods 2019, 16, 387. 10.1038/s41592-019-0364-4. [DOI] [PMC free article] [PubMed] [Google Scholar]
- Hellenkamp B.; Schmid S.; Doroshenko O.; Opanasyuk O.; Kuhnemuth R.; Adariani S. R.; Ambrose B.; Aznauryan M.; Barth A.; Birkedal V.; Bowen M. E.; Chen H. T.; Cordes T.; Eilert T.; Fijen C.; Gebhardt C.; Gotz M.; Gouridis G.; Gratton E.; Ha T.; Hao P. Y.; Hanke C. A.; Hartmann A.; Hendrix J.; Hildebrandt L. L.; Hirschfeld V.; Hohlbein J.; Hua B. Y.; Hubner C. G.; Kallis E.; Kapanidis A. N.; Kim J. Y.; Krainer G.; Lamb D. C.; Lee N. K.; Lemke E. A.; Levesque B.; Levitus M.; McCann J. J.; Naredi-Rainer N.; Nettels D.; Ngo T.; Qiu R. Y.; Robb N. C.; Rocker C.; Sanabria H.; Schlierf M.; Schroder T.; Schuler B.; Seidel H.; Streit L.; Thurn J.; Tinnefeld P.; Tyagi S.; Vandenberk N.; Vera A. M.; Weninger K. R.; Wunsch B.; Yanez-Orozco I. S.; Michaelis J.; Seidel C. A. M.; Craggs T. D.; Hugel T. Precision and accuracy of single-molecule FRET measurements-a multi-laboratory benchmark study. Nat. Methods 2018, 15 (9), 669–676. 10.1038/s41592-018-0085-0. [DOI] [PMC free article] [PubMed] [Google Scholar]
- Banterle N.; Bui K. H.; Lemke E. A.; Beck M. Fourier ring correlation as a resolution criterion for super-resolution microscopy. J. Struct. Biol. 2013, 183, 363–367. 10.1016/j.jsb.2013.05.004. [DOI] [PubMed] [Google Scholar]
- Nieuwenhuizen R. P. J.; Lidke K. A.; Bates M.; Puig D. L.; Grunwald D.; Stallinga S.; Rieger B. Measuring image resolution in optical nanoscopy. Nat. Methods 2013, 10 (6), 557–562. 10.1038/nmeth.2448. [DOI] [PMC free article] [PubMed] [Google Scholar]
- Balzarotti F.; Eilers Y.; Gwosch K. C.; Gynna A. H.; Westphal V.; Stefani F. D.; Elf J.; Hell S. W. Nanometer resolution imaging and tracking of fluorescent molecules with minimal photon fluxes. Science 2017, 355, 606–612. 10.1126/science.aak9913. [DOI] [PubMed] [Google Scholar]
- Köhler J.; Disselhorst J. A. J. M.; Donckers M. C. J. M.; Groenen E. J. J.; Schmidt J.; Moerner W. E. Magnetic Resonance of a Single Molecular Spin. Nature 1993, 363, 242–244. 10.1038/363242a0. [DOI] [Google Scholar]
- Wrachtrup J.; Gruber A.; Fleury L.; von Borczyskowski C. Magnetic Resonance on Single Nuclei. Chem. Phys. Lett. 1997, 267, 179–185. 10.1016/S0009-2614(97)00073-0. [DOI] [Google Scholar]
- Gruber A.; Dräbenstedt A.; Tietz C.; Fleury L.; Wrachtrup J.; von Borczyskowski C. Scanning Confocal Optical Microscopy and Magnetic Resonance on Single Defect Centers. Science 1997, 276, 2012–2014. 10.1126/science.276.5321.2012. [DOI] [Google Scholar]
- Heylman K. D.; Knapper K. A.; Goldsmith R. H. Photothermal Microscopy of Nonluminescent Single Particles Enabled by Optical Microresonators. J. Phys. Chem. Lett. 2014, 5 (11), 1917–1923. 10.1021/jz500781g. [DOI] [PubMed] [Google Scholar]
- Heylman K. D.; Thakkar N.; Horak E. H.; Quillin S. C.; Cherqui C.; Knapper K. A.; Masiello D. J.; Goldsmith R. H. Optical microresonators as single-particle absorption spectrometers. Nat. Photonics 2016, 10 (12), 788–795. 10.1038/nphoton.2016.217. [DOI] [Google Scholar]
- Zhang Q.; Hernandez T.; Smith K. W.; Hosseini Jebeli S. A.; Dai A. X.; Warning L.; Baiyasi R.; McCarthy L. A.; Guo H.; Chen D.-H.; Dionne J. A.; Landes C. F.; Link S. Unraveling the origin of chirality from plasmonic nanoparticle-protein complexes. Science 2019, 365 (6460), 1475–1478. 10.1126/science.aax5415. [DOI] [PubMed] [Google Scholar]
- Zhou X.; Andoy N. M.; Liu G.; Choudhary E.; Han K.-S.; Shen H.; Chen P. Quantitative super-resolution imaging uncovers reactivity patterns on single nanocatalysts. Nat. Nanotechnol. 2012, 7 (4), 237–241. 10.1038/nnano.2012.18. [DOI] [PubMed] [Google Scholar]
- Roeffaers M. B. J.; De Cremer G.; Uji-I H.; Muls B.; Sels B. F.; Jacobs P. A.; De Schryver F. C.; De Vos D. E.; Hofkens J. Single-molecule fluorescence spectroscopy in (bio)catalysis. Proc. Natl. Acad. Sci. U. S. A. 2007, 104 (31), 12603–12609. 10.1073/pnas.0610755104. [DOI] [PMC free article] [PubMed] [Google Scholar]
- Dong B.; Pei Y. C.; Zhao F.; Goh T. W.; Qi Z. Y.; Xiao C. X.; Chen K. C.; Huang W. Y.; Fang N. In situ quantitative single-molecule study of dynamic catalytic processes in nanoconfinement. Nat. Catal 2018, 1 (2), 135–140. 10.1038/s41929-017-0021-1. [DOI] [Google Scholar]
- Bishop L. D. C.; Landes C. F. From a Protein’s Perspective: Elution at the Single-Molecule Level. Acc. Chem. Res. 2018, 51 (9), 2247–2254. 10.1021/acs.accounts.8b00211. [DOI] [PubMed] [Google Scholar]
- Moringo N. A.; Shen H.; Tauzin L. J.; Wang W. X.; Landes C. F. Polymer Free Volume Effects on Protein Dynamics in Polystyrene Revealed by Single-Molecule Spectroscopy. Langmuir 2020, 36 (9), 2330–2338. 10.1021/acs.langmuir.9b03535. [DOI] [PubMed] [Google Scholar]
- Li Z.; Shegai T.; Haran G.; Xu H. Multiple-particle nanoantennas for enormous enhancement and polarization control of light emission. ACS Nano 2009, 3 (3), 637–42. 10.1021/nn800906c. [DOI] [PubMed] [Google Scholar]
- Rogobete L.; Kaminski F.; Agio M.; Sandoghdar V. Design of plasmonic nanoantennae for enhancing spontaneous emission. Opt. Lett. 2007, 32, 1623–1625. 10.1364/OL.32.001623. [DOI] [PubMed] [Google Scholar]
- Weber M. L.; Willets K. A. Correlated Super-Resolution Optical and Structural Studies of Surface-Enhanced Raman Scattering Hot Spots in Silver Colloid Aggregates. J. Phys. Chem. Lett. 2011, 2 (14), 1766–1770. 10.1021/jz200784e. [DOI] [Google Scholar]
- Wang M.; Li M.; Jiang S.; Gao J.; Xi P. Plasmonics meets super-resolution microscopy in biology. Micron 2020, 137, 102916. 10.1016/j.micron.2020.102916. [DOI] [PubMed] [Google Scholar]