Abstract
Intrinsic fluorescence and versatile optical properties of Graphene Oxide (GO) in visible and near-infrared range introduce this nanomaterial as a promising candidate for numerous clinical applications for early-diagnose of diseases. Despite recent progresses in the impact of major features of GO on the photoluminescence properties of GO, their modifications have not yet systematically understood. Here, to study the modification effects on the fluorescence behavior, poly ethylene glycol (PEG) polymer, metal nanoparticles (Au and Fe3O4) and folic acid (FA) molecules were used to functionalize the GO surface. The fluorescence performances in different environments (water, DMEM cell media and phosphate buffer with two different pH values) were assessed through fluorescence spectroscopy and fluorescent microscopy, while Fourier-transform infrared spectroscopy (FTIR) and X-ray diffraction (XRD) and Scanning electron microscopy (SEM) were utilized to evaluate the modifications of chemical structures. The modification of GO with desired molecules improved the photoluminescence property. The synthesized platforms of GO-PEG, GO-PEG-Au, GO-PEG-Fe3O4 and GO-PEG-FA illustrated emissions in three main fluorescence regions (blue, green and red), suitable for tracing and bio-imaging purposes. Considering MTT results, these platforms potentially positioned themselves as non-invasive optical sensors for the diagnosis alternatives of traditional imaging agents.
Subject terms: Biochemistry, Chemistry
Introduction
Graphene Oxide (GO) with two-dimensional (2D) network and heterogeneous chemical and electronic structure has attracted considerable attentions in recent years1,2. GO possesses numerous favorable properties, such as high mechanical strength, photo-stability, easy surface modification, and excitation-wavelength-dependent photoluminescence (PL)3–6. The 2D surface of GO with oxygen-containing functional groups provides a chemically tunable platform to interact with a wide range of biomolecules via covalent/non-covalent interactions, electrostatic forces, π-π absorption and hydrogen bonding7,8. Besides, GO consists of sp2 and sp3 carbons which turns to electronic and optical band gaps for PL phenomenon9,10. Each fluorescence peaks in chemically modified GO is a fingerprint of specific electronic transition between the bonding and anti-bonding molecular orbitals11. The electronic band structure adjusted by the ratio of sp2/sp3 orbitals, tunes up the fluorescence property from visible light state to near-infrared (NIR) wavelength range12,13. As soon as π electrons are confined in the localized sp2 regions (alteration in the localized domains), it further tunes the fluorescence of GO14. Here, the distance between charge/energy donor and charge/energy acceptor plays a key role in the electronic energy transitions and fluorescence behavior15,16. In fact, small molecular distance between GO and adjacent fluorophores (~ 6 nm) quenches the fluorescence emission of GO when it acts as an energy donor17. On the other hand, GO as an energy acceptor quenches the fluorescence of fluorophores when the molecular distance is extended to ~ 30 nm18.
The variety of functional groups, lateral size, localized domains and dopants of solvents can effectively influence the electronic energy transitions and fluorescence property of GO19. Based on a study by Ming, the position and intensity of fluorescence peak were distorted when GO was treated by KOH or HNO3, this respectively resulted in blue-shift and red-shift phenomena, due to the enrichment of GO with OH or COOH groups11. Moreover, the PL behavior of GO is typically dependent on the pH values of solvents, causing an excited-state proton transfer20,21. Upon the excitation, the protonation of COO- to COOH results in the broad fluorescence peak, while the intensity is relatively quenched. Under basic conditions, however, the fluorescence intensity may be recovered due to the produced COO- moieties20,21. Besides, the fluorescence emission and intensity of GO are further affected by the size, chemical functional groups, oxidation degree and other related factors22,23. GO can perform as an efficient quencher through either charge transfer or resonance energy24. In the customized dopamine biosensor utilizing GO fluorescence, the detection was based on the charge transfer between GO and dopamine quenching the fluorescence property of GO25,26. Based on another study, the GO sensor platform was used for the detection of metal cations27,28, where GO was applied as a fluorophore (electron donor) and the metal ions acted as the electron acceptor29,30.
The nature of fluorescence property of fluorophores, such as quantum dots and organic dyes, basically quenches by GO through the Fluorescence Resonance Energy Transfer (FRET)31,32. According to recent findings, quencher GO possesses a large number of bonding sites through oxygen-containing groups, which is ideal for targeting and delivery purposes33,34. The captured molecules on the surface of GO, including the fluorophore-labeled single stranded aptamers, double-stranded DNA molecules or antibodies/antigens35–37 in the optimized distance, would turn on the fluorescence38. The dual role of GO, as a fluorophore and quencher, introduces that as a potential polymer for developing new sensors with multiplex detection capability, however, the broad fluorescence emission restricted its bio-imaging performances39,40. Proper modification of GO, using polymers, noble-metal nanoparticles and molecules, improves its fluorescence emission for definite detection/biosensing purposes41,42. For targeting delivery purposes, the modification with polymers increases the hydrophilicity and circulation of GO through the biological environment and reduces the steric hindrance between the targeting ligand and biomarker43,44. There are some reports on several polymers, including polyethyleneimine-polylactide (PEI-PLA) and polyethylene glycol (PEG), with bright and multi-color auto-fluorescence properties for theranostic systems45,46. Metal nanoparticles, on the other hand, are widely used to construct structures with unique electric, catalytic and photonic properties, such as local surface plasmon resonance (LSPR)47, surface-enhanced Raman scattering (SERS)48,49, and surface-enhanced fluorescence (SEF)50. Noble-metal nanoparticles-modified GO produce nano-platform with numerous applications in targeting, delivery, therapy, imaging and sensing properties51,52. Among various targeting ligands in delivery conjugates, the fluorescence spectroscopic behavior of folic acid (FA) was seen to be suitable for targeted imaging approaches53. These auto-fluorescence molecules had a large absorption cross-section bond overlapping with GO spectrum, where the emission peaks shifted from UV to NIR region, improving the detected fluorescence behavior54. These findings triggered our research interests towards investigating derivetized GO as a new theranostic agent for biomedical approaches. The fluorescent biosensors, used in the near-IR region by facilitating the effective interference-free signals, can avoid the interferences (e.g., auto-fluorescence and scattering light) in biological environments55.
Experimental
Materials
GO, 1-ethyl-3-(3-dimethylaminopropyl) carbodiimide (EDC), N, N′-Dicyclohexylcarbodiimide (DCC), Chloroauric acid (HAuCl4), and Folic acid (FA), 3-(4,5-Dimethylthiazol-2-yl)-2,5-diphenyltetrazolium bromide (MTT) and fetal bovine serum (FBS) were purchased from Sigma Aldrich, USA. Polyethylene glycol (PEG6000) was purchased from ROTH, Germany. 4- Dimethylaminopyridine (DMAP), Dimethyl sulfoxide (DMSO), sodium citrate, FeCl3·6H2O and FeCl2·6H2O received from Merck, Germany. Dulbecco’s Modified Eagle Medium (DMEM), Penicillin/Streptomycin (Pen/Strep), Trypsin–EDTA enzyme were provided by Gibco, USA.
Methods
Synthesis of nano-conjugates
GO-PEG
To prepare PEGylated graphene oxide (GO-PEG), GO was acylated using EDC and DMAP connecting PEG molecules via ester bonds56–59. In brief, 50 mg GO was dispersed in 100 ml deionized water (DI) with 50 mg EDC and DMAP under bath sonication followed by adding 100 mg PEG6000 at room temperature. The solution was kept stirring vigorously at 60 °C overnight. The final product, GO-PEG, was washed and purified in a dialysis tube (MW cut off: 12,000 KDa).
GO-PEG-Fe3O4
GO-PEG (400 mg) was added to 70 mL of 0.1 M NaOH solution and sonicated at room temperature for 45 min. The desired product was separated by centrifuging and washed with DI water for several times to adjust the pH to 6. The volume of 20 ml of degassed water was added to the isolated product and dispersed by an ultrasonic bath for 30 min. A solution of FeCl3·6H2O (48 mg) and FeCl2·4H2O (17.6 mg) in 5 ml degassed water was mixed dropwise with the suspension at 60 °C in an ultrasonic bath for 60 min. Then, ammonium hydroxide solution (23%) was added to the mixture through a funnel to adjust pH to 11–12. The final product, GO-PEG-Fe3O4, was separated by a magnet and washed several times60.
GO-PEG-Au
AuNPs were synthesized separately using Turkevich method based on reduction of the HAuCl4 by citrate in water61. In brief, chloroauric acid solution (HAuCl4) (200 ml of 0.01 wt. %) was heated for 20 min and refluxed in a 500 ml-round-bottom flask using a temperature-controlled hot plate under continuous stirring. A 4.5-ml aliquot of 1 wt. % sodium citrate solution was heated for 20 min and added to the boiling chloroauric acid solution, while heating under reflux for 15 min to reach the complete reaction. Then, the solution was allowed to cool down to room temperature with continuous stirring to yield citrate-capped AuNPs. In the following step, the synthesized gold nanoparticles were added to GO-PEG solution under sonication for 2 h; another stirring process was performed subsequently for further 5 h at room temperature. The final product, GO-PEG-Au, was obtained after the crude product was purified through dialysis (MW cut off 12,000 KDa).
GO-PEG-FA
GO-PEG (400 mg) was dispersed in 250 ml DMSO in a bath sonication followed by adding DCC (45 mg), DMAP (25 mg) and FA (67 mg) at room temperature. The solution was kept stirring vigorously at 60 °C under nitrogen gas for 36 h. The final product, GO-PEG-FA, was washed and purified in a dialysis tube (MW cut off 12,000 KDa)62.
Characterization nano-conjugates
The chemical states and physical properties of nano-conjugates were studied using Fourier-transform infrared spectroscopy (FTIR) (JACSO 6300, Japan) and X-ray diffraction (XRD) (Asenware AW-DX300, England). Scanning electron microscopy (SEM, TESCAN MIR3, Czech Republic) was used to study the morphology of synthesized conjugations.
Fluorescence study
The fluorescence intensity of each conjugation was assessed through three different solvents (water, cell media, phosphate buffer at two pH values of 6.6 and 7.4) using a Luminescence Spectrometer (LS 55). The multicolor fluorescence property of conjugations was further assessed by a fluorescence microscopy.
Biocompatibility study
Cell viability was measured using MTT assay. Briefly, MCF-7 as a tumor cell line and L-929 as a non-tumor cell line were cultured in DMEM media with 10% (v/v) FBS and 1% pen/strep. The cells were incubated at 37 °C in a humidified incubator containing 4% CO2 in 25 cm3 tissue culture-treated flasks. MCF-7 and L-929 (104 cells/well) were seeded at 96-well plates in full medium and incubated overnight at 37 °C. Two cell lines were treated with GO-PEG, GO-PEG-Fe3O4, GO-PEG-AuNPs, GO-PEG-FA at different concentrations (200, 100, 50 μg.ml-1), as well as the untreated cells as the negative control. After 48 h, the supernatant was removed and cells were washed immediately by PBS. An aliquot of 90 μL DMEM and 10 μL MTT stock solution were subsequently added to each well incubated for 4 h at 37 °C. In the following stage, the MTT solution was removed, while 100 μL DMSO added to each well incubated for further 40 min at 37 °C. Finally, the absorbance was read at 490 nm with an ELISA reader (Biorad-USA). The experiment was performed in triplicate.
Statistical analysis
SPSS software (version 21, parametric analysis of variance [ANOVA (Tukey)]) was used for quantitative data analysis and results are reported as mean values ± standard deviation (SD) with significant value at p ≤ 0.05.
Results and discussion
Characterization
GO-PEG
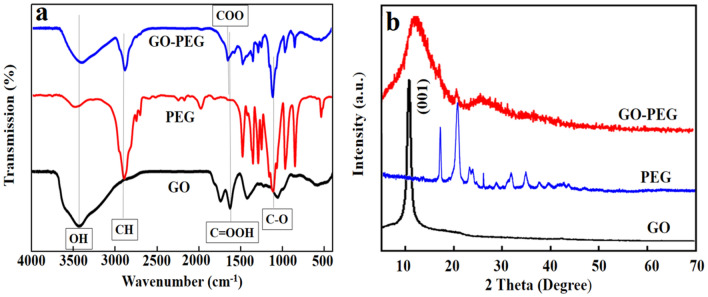
The chemical composition and interfacial interaction of the GO-PEG nano-conjugate were characterized by FTIR. Figure 1a represents the FTIR spectra of GO, PEG and GO-PEG where the broad peaks of GO at ~ 3000 to 3700 cm-1 are related to the stretching vibrations of hydroxyl (O–H) group. The peak at ~ 1737 cm-1 is attributed to the stretching vibrations of C = O band of carbonyl groups demonstrating the lack of carboxyl groups on the surface of GO63 . The PEG related bands are attributed to the stretching vibrations of C–H , C = O, and bending vibration of C–O, respectively, at 2847, 1647, and 1104 cm-1. The deformation vibration of C–H bonds are determined at 1468 and 1342 cm-1, the bending vibration of O–H at 1280 and 1242 cm-1, and C–O stretching vibration at 1149 cm-164. Considering the FTIR spectrum of GO-PEG, the major absorption peaks of PEG and GO are preserved in GO-PEG with a trivial shift of peak positions and relative change of intensity. Additionally, as there are C = O and O–H groups in both PEG and GO, FT-IR curve represents the ester bonding between PEG carboxyl groups and GO. These are the signatures of functional groups of GO, PEG and GO-PEG which confirm the successful conjugation of GO-PEG.
Figure 1.
(a) FTIR of GO, PEG and GO-PEG, (b) XRD patterns of GO, PEG and GO-PEG.
The XRD patterns of GO, PEG and GO-PEG are displayed in Fig. 1b. GO has an influence on the arrangement of molecular chain of PEG in the crystal lattice, disturbing the order of its crystallization. This decreases the crystallinity of PEG and concludes in an effective conjugation of PEG to GO nano-sheets by ester bonding.
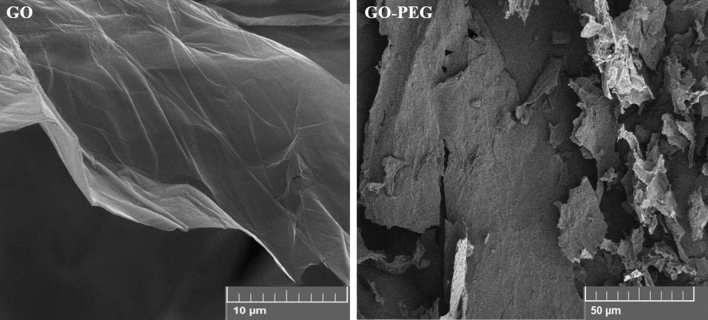
The XRD pattern of pure GO was analyzed based on a sharp diffraction peak at 2θ = 10.4°, corresponded to the (001) crystalline plane diffraction peak of GO65. The XRD diffraction pattern of PEG was confirmed by the characteristic diffraction peaks at 19.2°, 23.3° and 26.4°66. The XRD diffraction pattern of GO-PEG represented the amorphic pattern of the nano-conjugate at 2θ = 15°. The diffraction peak at 2θ = 29° was expanded, indicating more amorphous structure of nano-conjugate. The morphology of GO and GO-PEG was further assessed using FE-SEM; GO had a layered distribution stacking together in a flocculent manner. The surface was relatively flat while the GO-PEG curled to an irregular shape due to the inter-molecular ester bonding (Fig. 2).
Figure 2.
FE-SEM images of GO and GO-PEG.
GO-PEG-Fe3O4
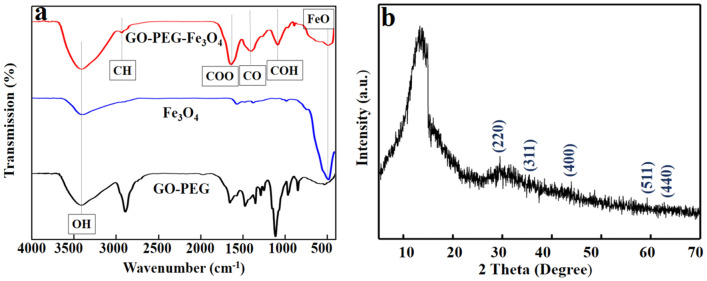
In Fig. 3a, the sharp peak in FTIR pattern of GO-PEG-Fe3O4 at 577 cm−1 is attributed to Fe–O bond of pure Fe3O4 nanoparticles67. Broad bonds at ~ 1383, 1065, 1623 and 3300 cm−1 are corresponded to C–O–C, C–OH, C = O and O–H groups, respectively68. The Fe–O bond at 577 cm-1 provides strong evidence that the surface of GO-PEG was functionalized with Fe3O4. The crystallographic structure of GO-PEG-Fe3O4 was assessed by the XRD pattern in Fig. 3b. The XRD peaks corresponding to Fe3O4, marked with the indices of (220), (311), (400), (511) and (440), are similar to those reported for Fe3O4 nanoparticles in68; These results are the other pieces of evidence for the successful grafting of Fe3O4 on the surface of GO-PEG.
Figure 3.
(a) FTIR pattern of GO-PEG-Fe3O4, (b) XRD patterns of GO-PEG-Fe3O4.
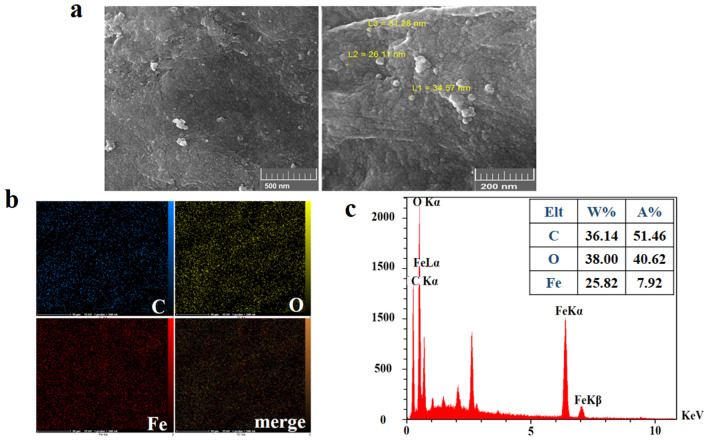
Figure 4a shows the FE-SEM micrographs of GO-PEG-Fe3O4 where the dispersed Fe3O4 NPs on the surface of GO-PEG has an average size of ~ 26–34 nm. The meaningful picture of element distribution on the surface verified the presence of carbon, oxygen and iron elements throughout the surface of GO-PEG- Fe3O4 (Fig. 4b). EDX spectra further showed the corresponding peaks of carbon (C) oxygen (O) and iron (Fe) in the final conjugate (Fig. 4c).
Figure 4.
(a) FE-SEM images of GO-PEG-Fe3O4 conjugates, Fe3O4 distribution with an average size of 27–36 nm on the surface of GO-PEG (b) EDX mapping, and (c) EDS analysis indicating the element distribution on the surface of GO-PEG- Fe3O4.
GO-PEG-Au
The crystallographic structure of synthesized GO-PEG-Au was studied using XRD (Fig. 5) with distinguished peaks at 38.2°, 44.59° and 64.7° corresponded to (220), (200) and (111) planes, respectively, confirming the formation of AuNPs in the nano-conjugate69.
Figure 5.
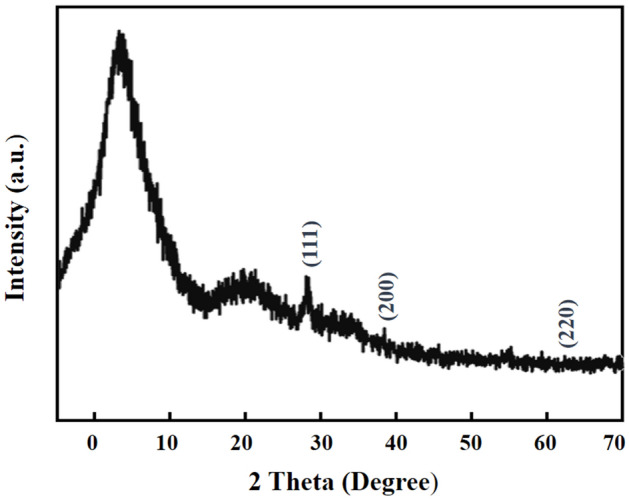
XRD patterns of GO-PEG-Au conjugate.
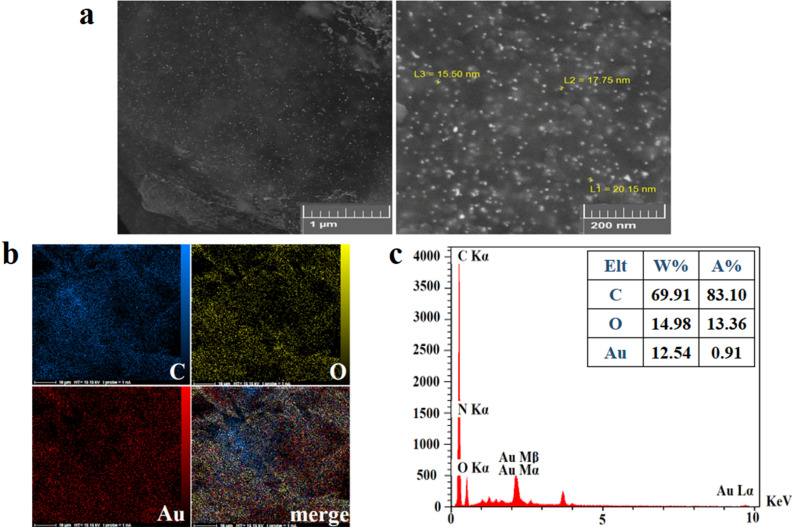
Figure 6a shows the FE-SEM micrographs of GO-PEG-Au with the uniform dispersion of AuNPs on the surface of GO-PEG and an average size of ~ 15–20 nm. The chemical composition of GO-PEG-Au was characterized through EDX analysis. The meaningful picture of element distribution on the surface verified the presence of carbon, oxygen and gold elements throughout the surface of GO-PEG-Au (Fig. 6b). EDX spectra further showed the corresponding peaks of C, O and gold (Au) in the final conjugate (Fig. 6c).
Figure 6.
(a) FE-SEM images of GO-PEG-Au conjugates showing AuNPs distribution with an average size of 15–17 nm on the surface of GO-PEG, (b) EDX mapping, and (c) EDS analysis indicating the element distribution on surface of GO-PEG-Au.
GO-PEG-FA
The grafting GO-PEG with FA led to the introduction of new absorbance peaks in the FTIR pattern of GO-PEG-FA at 1640 cm−1 and 3400–3500 cm−1, representing the N–H group, and the peak at 1400 cm−1 corresponded to the aromatic ring stretch of the pteridine ring and ρ-amino benzoic acid moieties of FA70. Another peak at ~ 1700 cm−1 was an evidence of the ester bonding between FA and GO-PEG surface (Fig. 7).
Figure 7.
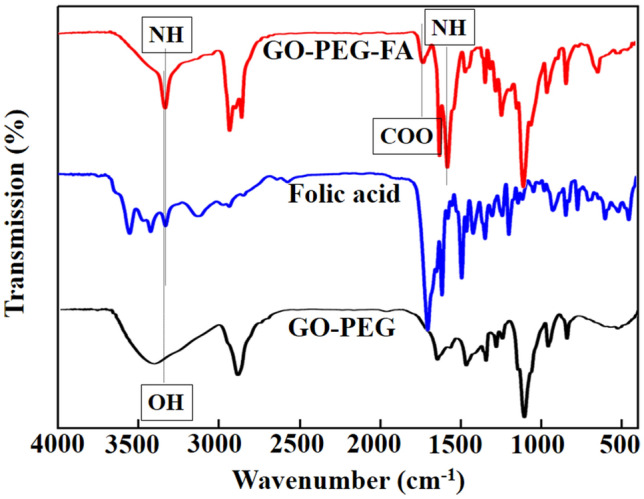
FTIR pattern of GO-PEG-FA conjugate shows the covalent interaction between FA and GO-PEG.
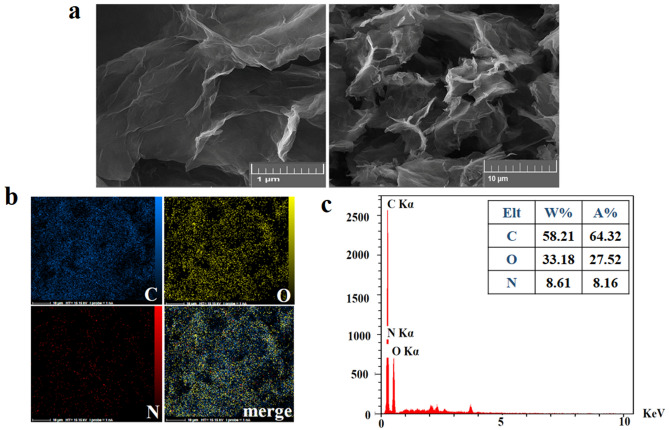
FE-SEM images of the modified GO revealed a sheet like morphology with wrinkled structure for FA-functionalized GO-PEG (Fig. 8a)71. EDX analysis presented a meaningful picture for the element distribution on the surface of conjugate, verifying the presence of nitrogen in the folic acid structure (Fig. 8b). EDX spectra contained the related peaks of C, O and nitrogen (N) (Fig. 8c).
Figure 8.
(a) FE-SEM images of GO-PEG-FA conjugate, (b) EDX mapping, and (c) EDS analysis illustrates the elemental distribution on the surface of GO-PEG-FA conjugate.
Fluorescence study
Considering the special conditions of biomedical applications and tumors environment, pH level plays a critical role in biomedical approaches. To study the solution effect on the intensity and pattern of detected fluorescence, GO derivatives were dissolved in three different solvents (water, PBS and DMEM cell media). Acidic pH particularly needs to be considered for the system design for imaging or tracking purposes, either inside (endosomes) or outside (tumor area) the cells. As discussed in the following sessions, apart from the type of functionalization, the solvent considerably affects the emitted fluorescence72.
Emission spectra at the excitation wavelength of 300 nm
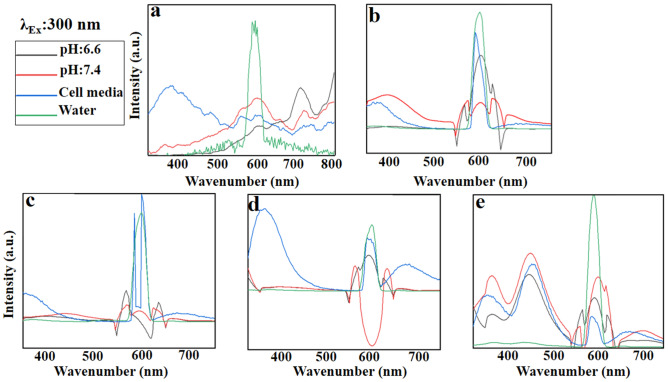
Pure GO in water indicates the maximum emission at ~ 595 nm with two broad emission peaks at 400–550 and 650–800 nm. In the DMEM cell media, the maximum emission occurs at ~ 400 nm, while by the variation in pH values it shifts to the red region; it is maximized at 610 nm in natural pH (PBS) and at 730 nm in acidic media (Fig. 9a). GO becomes the charge donor when modified with PEG (GO-PEG), its broad fluorescence spectra are quenched in water at the range of 450–550 and 650–750 nm. In return, GO acts as the energy acceptor quenching the emission peaks of PEG (energy donor) at 508 and 605 nm (Fig. 9b). Likewise, the behavior of PEGylated GO in DMEM cell media is similar to the detected emission in water, while the new peaks at ~ 300–450 and 650–800 nm are attributed to the cell media absorption. At the natural pH (7.4), the fluorescence emissions of both components (GO and PEG) are preserved and the emission peak at 400 nm is blue-shifted, representing GO-PEG as a blue fluorophore. Thus, GO-PEG can be introduced as a turn on/off biosensor in tumor studies, and a tracer for in vitro and in situ imaging.
Figure 9.
Emission patterns of (a) GO, (b) GO-PEG, (c) GO-PEG-Fe3O4, (d) GO-PEG-Au, and (e) GO-PEG-FA at the excitation wavelength of 300 nm in water, cell media (DMEM) and PBS, at two different pH values (pH 6.6 and 7.4).
GO-PEG-Fe3O4 acts similar to GO-PEG in both water and acidic pH, in which the fluorescence emission curve of GO is quenched in the acidic condition (Fig. 9c). Thereby, it could be applicable as a suitable switch-off biosensor in a tumor area. In cell media, however, the fluorescence of PEG and Fe3O4 components are both preserved, while the fluorescence of GO is quenched. This fact shows that GO can behave as an energy acceptor and simultaneous energy donor in the cell media, introducing GO-PEG-Fe3O4 conjugate as a potential tracer for in-vitro and in situ tumor imaging. Nevertheless, at natural pH (7.4), the fluorescence would be nearly quenched.
Au accelerates the blue emission (400 nm) with the new peak at red region (700 nm). This introduces GO-Au as a potential candidate for imaging and thermal therapy (Fig. 9d). GO-PEG-Au has a similar behavior in both water and DMEM cell media. As previously mentioned, the new detected peaks at 400 and 700 nm are contributed to the absorption of DMEM cell media. On the contrary, the fluorescence emission of GO would be quenched by Au NPs at both natural and acidic pH values, when GO acts as a charge donor (switch-off biosensor). Figure 9e indicates the interesting patterns of GO-PEG-FA in all various solvents (water, cell media, natural and acidic). Although the blue and red emissions are still detectable with the lower densities, green fluorescence (430–550 nm) is observed with strong peak at 460 nm.
Emission spectra at the excitation wavelength of 350 nm
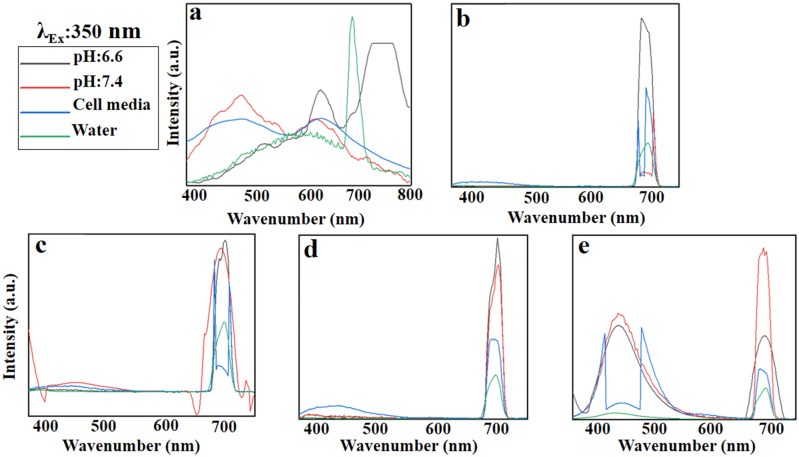
The dissolved GO in water indicates a broad emission at 400–650 nm as well as a sharp peak at 700 nm (Fig. 10a). DMEM cell media and neutral pH affect the trend resulting in a blue shift to 400–550 nm, while acidic pH causes a red-shift with a maximum emission peak at 750 nm. According to Fig. 10b, PEG acts as an energy acceptor quenches the predicted fluorescence of GO. Likewise, the metal nanoparticles have a similar behavior in the wavelength of 350 nm (Fig. 10c, d). Interestingly, FA accelerates the blue emission at 400–500 nm representing a strong fluoresce at the green zone (Fig. 10e), the range appropriated for bio-imaging applications62.
Figure 10.
Emission patterns of (a) GO, (b) GO-PEG, (c) GO-PEG-Fe3O4, (d) GO-PEG-Au, and (e) GO-PEG-FA at the excitation wavelength of 350 nm in water, cell media (DMEM), and PBS at two different pH values (pH 6.6 and 7.4).
Emission spectra at excitation wavelength of 430 nm
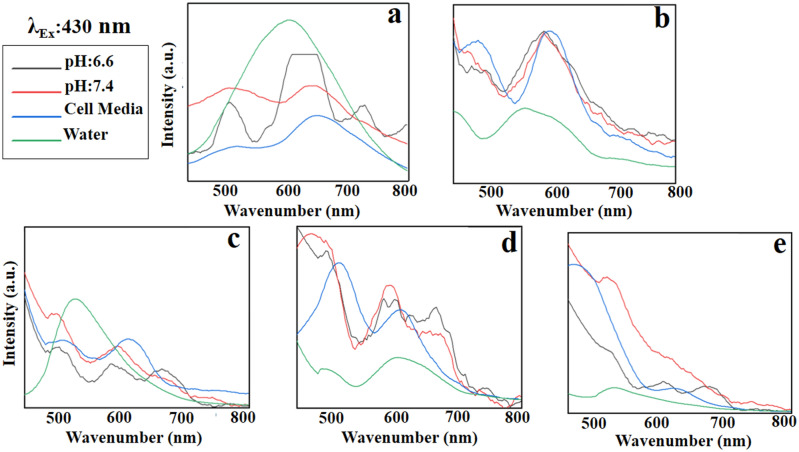
At the excitation wavelength of 430 nm, GO has a broad emission (Fig. 11a) that is improved and reinforced with the PEG modification (Fig. 11b) at the red region (560–800 nm) in all solvents. GO-PEG-Fe3O4 shows a single peak at 547 nm in water, while multiple emission peaks appear at 500, 570 and 650 nm when dissolved in DMEM cell media and PBS (Fig. 11c). Likewise, GO-PEG-Au illustrates the same behavior as GO-PEG-Fe3O4; while the fluorescence intensity is lower when dissolved in water (Fig. 11d). In the excitation wavelength of 430 nm, GO-PEG-FA does not show any identified emission suitable for imaging purposes (Fig. 11e).
Figure 11.
Emission patterns of (a) GO, (b) GO-PEG, c) GO-PEG-Fe3O4, (d) GO-PEG-Au, and (e) GO-PEG-FA at the excitation wavelength of 430 nm in water, cell media (DMEM), and PBS at two different pH values (pH 6.6 and 7.4).
Emission spectra at the excitation wavelength of 480 nm
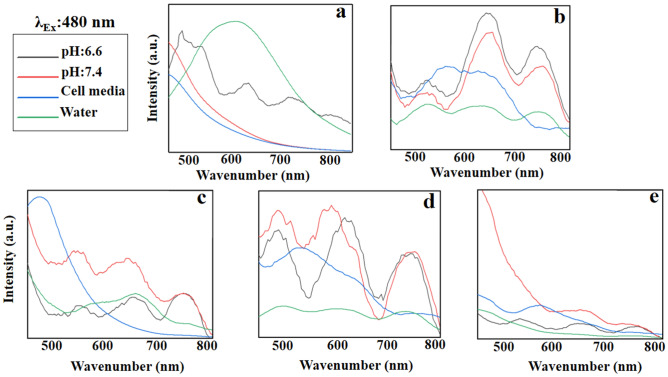
GO at the excitation wavelength of 480 nm has an inappropriate fluorescence behavior (Fig. 12a). Functionalization with PEG improves this fluorescence emission and results in a red shift maximized at 650 and 730 nm in natural and acidic conditions, respectively (Fig. 12b). Fe3O4, however, decreases the fluorescence intensity of the conjugate in acidic condition creating a blue shift in DMEM cell media (Fig. 12c). Due to the broad emission pattern of GO-PEG-Fe3O4 in water, so, it is not suggested for the detection purposes. Au, on the other hand, increases the fluorescence intensity of the conjugate in both natural and acidic conditions (Fig. 12d).
Figure 12.
Emission pattern of (a) GO, (b) GO-PEG, (c) GO-PEG-Fe3O4, (d) GO-PEG-Au, and (e) GO-PEG-FA at the excitation wavelength of 480 nm in water, cell media (DMEM), PBS at two different pH values (pH 6.6 and 7.4).
GO-PEG-Au indicates the multiple emission peaks with low intensity when dissolved in water. GO-PEG-FA decreases the fluorescence intensity of conjugate in all solvents, representing FA as an energy acceptor in the excitation wavelength of 480 nm (Fig. 12e).
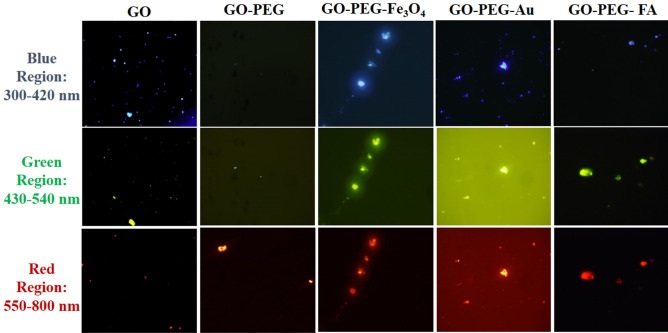
According to Figs. 9–12, the GO derivatives are potentially traceable fluorophores for imaging purposes in biological environments. Figure 13 shows the fluorescence images of modified GOs dissolved in PBS solution in three different fluorescence regions. After surface modification73, the photoluminescence property of GO differs, either quenched or accelerated, disregarding the applied excitation wavelength. PEG polymer quenches the GO emission in blue and green regions, while the red emission is still detectable. In fact, modified conjugates with metal nanoparticles are stronger at all three fluorescence regions, leading to the detectable images. The red shift occurred with folate makes this derivative an ideal sensor for bio-imaging purposes.
Figure 13.
Fluorescence properties of GO, GO-PEG, GO-PEG-Fe3O4, GO-PEG-Au, and GO-PEG-FA observed by the fluorescence microscopy in three fluorescence regions: blue (300–420 nm), green (430–540 nm) and red (550–800 nm).
Biocompatibility
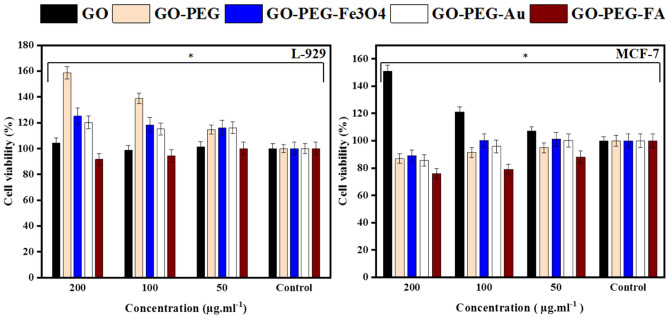
MTT analysis was performed to evaluate the biocompatibility and cell toxicity of the prepared conjugates. GO, GO-PEG, GO-PEG-Fe3O4, GO-PEG-Au and GO-PEG-FA were tested against tumor (MCF-7) and non-tumor (L-929) cell lines at three different concentrations. From Fig. 14, both treated cells showed no appreciable viability loss after 48 h treatment, demonstrating the excellent biocompatibility of the synthesized conjugates.
Figure 14.
Viability assay of non-tumor cell lines (L-929) and tumor cell lines (MCF-7) treated with GO, GO-PEG, GO-PEG-Fe3O4, GO-PEG-Au, and GO-PEG-FA conjugates at different concentrations; Each test was repeated three time and p values were calculated using one-way ANOVA test (*p < 0.05).
Conclusion
GO derivatives red shifted to the longer wavelengths, when the excitation occurred between 300 to 480 nm, representing the excitation-wavelength-dependent photoluminescence of GO. Such a behavior was the indicative of multiple fluorophore systems with aromatic and oxidation groups. The photoluminescence of modified GOs was mostly tunable at the excitation wavelength of 300 nm; the intrinsic fluorescence of both GO and PEG was not detected, when GO-PEG dissolved in water or DMEM cell media. This was due to the role of GO and PEG as the acceptor and donor, which quenches the individual fluorescence of each component. In contrast, at the physiological condition (pH = 7.4), the fluorescence of both GO and PEG was deserved. Fe3O4 and Au NPs, on the other hand, quenched the fluorescence property of PEGylated GO in acidic conditions. This characteristic preserves the detected fluorescence in cell media, deserving GO-PEG-Metal NPs as a potential switch-off biosensor in the tumor area. GO-PEG-FA however shows strong intensities at three regions, mostly green area, in all treated solutions.
The fluorescence of GO and PEG is totally quenched when GO-PEG and GO-PEG-metal NPs are excited at 350 nm wavelength (switch-off system). Whereas folate causes the blue shift in the emitted peaks.
When the excitement occurs at 430 nm, all four modified GO conjugates experienced interesting alterations. The observed red shift introduced GO-PEG ideal as the "switch-on biosensor". Metal NPs conjugates showed the multiple emission peaks, whereas folate quenched the predicated emissions at both blue and far red regions in GO-PEG-FA.
At the excitation of 480 nm, GO-PEG experienced a sharp peak and red shift in natural and acidic conditions, while metal NPs, in particular Au, as well as folate, accelerated the expected emission, representing GO-PEG-Au and GO-PEG-FA as the ideal theranostic agents.
GO and its derivatives in conclusion displayed an excited–state protonation of COOH groups in various pH conditions. The creation of localized sp2 clusters and structural defects during GO reduction through the modification were more likely to be responsible for the enhancement of green fluorescence. Besides, it was found that the fluorescence of GO and its derivatives conjugates were tunable between ultraviolet, visible and NIR with a robust intensity. These features suggested that the fluorescence aspect of GO, specifically at the excitation of 480 nm could be readily incorporated in a variety of biomedical imaging applications; Likewise, GO may act not only as a fluorophore, it can also operate as a quencher, introducing the new chances for the next generation biosensors with multiplex detections.
Acknowledgements
Financial support from the University of Isfahan is greatly acknowledged.
Authors Contributions
Y.E., E.B. and A.Z. did the experiments and analysis parts. E.B. and C.Ch. were the consultant of the project in fluorescence experiments analyses. A.Z. and A.A. were the main supervisor and assisted to analyze of data and to write of the manuscript. All authors read and approved the final manuscript.
Competing interests
The authors declare no competing interests.
Footnotes
Publisher's note
Springer Nature remains neutral with regard to jurisdictional claims in published maps and institutional affiliations.
Change history
4/21/2021
A Correction to this paper has been published: 10.1038/s41598-021-88760-0
Contributor Information
Elham Bidram, Email: ebidram@amt.mui.ac.ir.
Abbas Amini, Email: a.amini@ack.edu.kw.
References
- 1.Mei, Q., et al. Graphene Oxide: From Tunable Structures to Diverse Luminescence Behaviors. Advanced Science (2019). [DOI] [PMC free article] [PubMed]
- 2.Ahmad H, Fan M, Hui D. Graphene oxide incorporated functional materials: a review. Compos. B Eng. 2018;145:270–280. [Google Scholar]
- 3.Krishnan SK, Singh E, Singh P, Meyyappan M, Nalwa HS. A review on graphene-based nanocomposites for electrochemical and fluorescent biosensors. RSC Adv. 2019;9:8778–8881. doi: 10.1039/c8ra09577a. [DOI] [PMC free article] [PubMed] [Google Scholar]
- 4.Daniel, A., Oron, D. & Silberberg, Y. Noninvasive linear fluorescence imaging through scattering media via wavefront shaping. arXiv preprint arXiv:1904.02509 (2019). [DOI] [PubMed]
- 5.Boukhoubza I, et al. Graphene oxide/ZnO nanorods/graphene oxide sandwich structure: the origins and mechanisms of photoluminescence. J. Alloy. Compd. 2019;797:1320–1326. [Google Scholar]
- 6.Yogesh, G.K., et al. Synthesis, characterization and bioimaging application of laser-ablated graphene-oxide nanoparticles (nGOs). Diamond and Related Materials, 107733 (2020).
- 7.Aliyev E, et al. Structural characterization of graphene oxide: Surface functional groups and fractionated oxidative debris. Nanomaterials. 2019;9:1180. doi: 10.3390/nano9081180. [DOI] [PMC free article] [PubMed] [Google Scholar]
- 8.Huang H, Li Z, She J, Wang W. Oxygen density dependent band gap of reduced graphene oxide. J. Appl. Phys. 2012;111:054317. [Google Scholar]
- 9.Mei Q, et al. Highly efficient photoluminescent graphene oxide with tunable surface properties. Chem. Commun. 2010;46:7319–7321. doi: 10.1039/c0cc02374d. [DOI] [PubMed] [Google Scholar]
- 10.Mei Q, et al. Graphene oxide: from tunable structures to diverse luminescence behaviors. Adv. Sci. 2019;6:1900855. doi: 10.1002/advs.201900855. [DOI] [PMC free article] [PubMed] [Google Scholar]
- 11.Li M, Cushing SK, Zhou X, Guo S, Wu N. Fingerprinting photoluminescence of functional groups in graphene oxide. J. Mater. Chem. 2012;22:23374–23379. [Google Scholar]
- 12.Wang S, et al. The role of sp 2/sp 3 hybrid carbon regulation in the nonlinear optical properties of graphene oxide materials. RSC Adv. 2017;7:53643–53652. [Google Scholar]
- 13.Thomas HR, et al. Identifying the fluorescence of graphene oxide. J. Mater. Chem. C. 2013;1:338–342. [Google Scholar]
- 14.Zheng P, Wu N. Fluorescence and sensing applications of graphene oxide and graphene quantum dots: a review. Chem. Asian J. 2017;12:2343–2353. doi: 10.1002/asia.201700814. [DOI] [PMC free article] [PubMed] [Google Scholar]
- 15.Cheng K, et al. Tunable excitation-dependent-fluorescence of carbon dots: Fingerprint curves for super anti-counterfeiting. Dyes Pigm. 2020;174:108106. [Google Scholar]
- 16.Barroso MM. Graphene boost. Nat. Photonics. 2019;13:825–826. [Google Scholar]
- 17.Kaminska I, et al. Distance dependence of single-molecule energy transfer to graphene measured with DNA origami nanopositioners. Nano Lett. 2019;19:4257–4262. doi: 10.1021/acs.nanolett.9b00172. [DOI] [PubMed] [Google Scholar]
- 18.Morales-Narváez E, Merkoçi A. Graphene oxide as an optical biosensing platform: a progress report. Adv. Mater. 2019;31:1805043. doi: 10.1002/adma.201805043. [DOI] [PubMed] [Google Scholar]
- 19.Lai S, et al. Mechanisms behind excitation-and concentration-dependent multicolor photoluminescence in graphene quantum dots. Nanoscale. 2020;12:591–601. doi: 10.1039/c9nr08461d. [DOI] [PubMed] [Google Scholar]
- 20.Galande C, et al. Quasi-molecular fluorescence from graphene oxide. Sci. Rep. 2011;1:85. doi: 10.1038/srep00085. [DOI] [PMC free article] [PubMed] [Google Scholar]
- 21.Loh KP, Bao Q, Eda G, Chhowalla M. Graphene oxide as a chemically tunable platform for optical applications. Nat. Chem. 2010;2:1015. doi: 10.1038/nchem.907. [DOI] [PubMed] [Google Scholar]
- 22.Kim, J., Lee, J. & Lee, T.S. Size-dependent fluorescence of conjugated polymer dots and correlation with the fluorescence in solution and in the solid phase of the polymer. Nanoscale (2020). [DOI] [PubMed]
- 23.Emanuele A, et al. Precursor-dependent photocatalytic activity of carbon dots. Molecules. 2020;25:101. doi: 10.3390/molecules25010101. [DOI] [PMC free article] [PubMed] [Google Scholar]
- 24.Pk, S., Bathula, C. & Das, M. Usage of graphene oxide in fluorescence-quenching linked immunosorbent assay for the detection of Cry2Ab protein present in transgenic plants. J. Agric. Food Chem (2020). [DOI] [PubMed]
- 25.Chen J-L, Yan X-P, Meng K, Wang S-F. Graphene oxide based photoinduced charge transfer label-free near-infrared fluorescent biosensor for dopamine. Anal. Chem. 2011;83:8787–8793. doi: 10.1021/ac2023537. [DOI] [PubMed] [Google Scholar]
- 26.Zhao J, Zhao L, Lan C, Zhao S. Graphene quantum dots as effective probes for label-free fluorescence detection of dopamine. Sens. Actuators B Chem. 2016;223:246–251. [Google Scholar]
- 27.Wang D-Y, et al. Photoluminescence quenching of graphene oxide by metal ions in aqueous media. Carbon. 2015;82:24–30. [Google Scholar]
- 28.Park M, Seo TS. An integrated microfluidic device with solid-phase extraction and graphene oxide quantum dot array for highly sensitive and multiplex detection of trace metal ions. Biosens. Bioelectron. 2019;126:405–411. doi: 10.1016/j.bios.2018.11.010. [DOI] [PubMed] [Google Scholar]
- 29.Luo Z, Vora PM, Mele EJ, Johnson AC, Kikkawa JM. Photoluminescence and band gap modulation in graphene oxide. Appl. Phys. Lett. 2009;94:111909. [Google Scholar]
- 30.Kong W, et al. Investigation of photoluminescence behavior of reduced graphene quantum dots. Inorg. Chem. Commun. 2019;99:199–205. [Google Scholar]
- 31.Joshi S, et al. A review on peptide functionalized graphene derivatives as nanotools for biosensing. Microchim. Acta. 2020;187:27. doi: 10.1007/s00604-019-3989-1. [DOI] [PubMed] [Google Scholar]
- 32.Tang, S., et al. Graphene oxide based FRET probe for mast cell degranulation. in Optics in Health Care and Biomedical Optics IX, Vol. 11190 111902J (International Society for Optics and Photonics, 2019).
- 33.He Y, Jiao B. DNA covalently linked to graphene oxide for biotin–streptavidin interaction assay. Talanta. 2017;163:140–145. doi: 10.1016/j.talanta.2016.10.096. [DOI] [PubMed] [Google Scholar]
- 34.Kwak SY, et al. Luminescent graphene oxide with a peptide-quencher complex for optical detection of cell-secreted proteases by a turn-on response. Adv. Func. Mater. 2014;24:5119–5128. [Google Scholar]
- 35.Youn H, et al. Aptasensor for multiplex detection of antibiotics based on FRET strategy combined with aptamer/graphene oxide complex. Scientific reports. 2019;9:7659. doi: 10.1038/s41598-019-44051-3. [DOI] [PMC free article] [PubMed] [Google Scholar]
- 36.Wang S-Y, Wang C-F, Lv Y-K, Shen S-G. Fabrication of fluorescent biosensing platform based on graphene oxide-DNA and their application in biomolecule detection. TrAC, Trends Anal. Chem. 2018;106:53–61. [Google Scholar]
- 37.Stebunov YV, Arsenin AV, Volkov VS. SPR analysis of antibody-antigen interactions using graphene oxide linking layers. Mater Today Proc. 2018;5:17442–17446. [Google Scholar]
- 38.Chepyala, R., Badruddoza, A.Z.M., Azad, M., McCarthy, J.R. & Nurunnabi, M. Graphene and its derivatives as biosensing platform for healthcare applications. in Biomedical Applications of Graphene and 2D Nanomaterials 187–215 (Elsevier, 2019).
- 39.He L, Li J, Xin JH. A novel graphene oxide-based fluorescent nanosensor for selective detection of Fe3+ with a wide linear concentration and its application in logic gate. Biosens. Bioelectron. 2015;70:69–73. doi: 10.1016/j.bios.2015.01.075. [DOI] [PubMed] [Google Scholar]
- 40.Basko, D.M., Duchemin, I. & Blase, X. Photoluminescence of graphene quantum dots: the role of chiral symmetry. arXiv preprint arXiv:1910.14362 (2019).
- 41.Gao F, et al. Tuning the photoluminescence of graphene oxide quantum dots by photochemical fluorination. Carbon. 2019;141:331–338. [Google Scholar]
- 42.Wang Y, et al. Photoluminescence of graphene quantum dots doped with different elements. Chin. Sci. Bull. 2019;64:411–418. [Google Scholar]
- 43.Huang H, et al. Facile modification of nanodiamonds with hyperbranched polymers based on supramolecular chemistry and their potential for drug delivery. J. Colloid Interface Sci. 2018;513:198–204. doi: 10.1016/j.jcis.2017.11.009. [DOI] [PubMed] [Google Scholar]
- 44.Wang J-L, et al. The effect of surface poly (ethylene glycol) length on in vivo drug delivery behaviors of polymeric nanoparticles. Biomaterials. 2018;182:104–113. doi: 10.1016/j.biomaterials.2018.08.022. [DOI] [PubMed] [Google Scholar]
- 45.Shao L, et al. Auto-fluorescent polymer nanotheranostics for self-monitoring of cancer therapy via triple-collaborative strategy. Biomaterials. 2019;194:105–116. doi: 10.1016/j.biomaterials.2018.12.021. [DOI] [PubMed] [Google Scholar]
- 46.Li S, et al. pH-responsive biocompatible fluorescent polymer nanoparticles based on phenylboronic acid for intracellular imaging and drug delivery. Nanoscale. 2014;6:13701–13709. doi: 10.1039/c4nr04054f. [DOI] [PubMed] [Google Scholar]
- 47.Zhang Y, Wang G, Yang L, Wang F, Liu A. Recent advances in gold nanostructures based biosensing and bioimaging. Coord. Chem. Rev. 2018;370:1–21. [Google Scholar]
- 48.Wu, Y., Ali, M.R., Chen, K., Fang, N. & El-Sayed, M.A. Gold nanoparticles in biological optical imaging. Nano Today (2019).
- 49.Patel AS, et al. Gold nanoflowers as efficient hosts for SERS based sensing and bio-imaging. Nano-Struct. Nano-Objects. 2018;16:329–336. [Google Scholar]
- 50.Caponetti, V., et al. Self-assembled biocompatible fluorescent nanoparticles for bioimaging. Front. Chem.7(2019). [DOI] [PMC free article] [PubMed]
- 51.Zhao, X., et al. Recent developments in detection using noble metal nanoparticles. Crit. Rev. Anal. Chem. 1–14 (2019). [DOI] [PubMed]
- 52.Chai, Y., et al. Nobel metal particles confined in zeolites: synthesis, characterization, and applications. Adv. Sci. 1900299 (2019). [DOI] [PMC free article] [PubMed]
- 53.Tyagi A, Penzkofer A. Fluorescence spectroscopic behaviour of folic acid. Chem. Phys. 2010;367:83–92. [Google Scholar]
- 54.Jung JH, Cheon DS, Liu F, Lee KB, Seo TS. A graphene oxide based immuno-biosensor for pathogen detection. Angew. Chem. Int. Ed. 2010;49:5708–5711. doi: 10.1002/anie.201001428. [DOI] [PubMed] [Google Scholar]
- 55.Diao S, et al. Fluorescence imaging in vivo at wavelengths beyond 1500 nm. Angew. Chem. Int. Ed. 2015;54:14758–14762. doi: 10.1002/anie.201507473. [DOI] [PubMed] [Google Scholar]
- 56.Chen J, et al. One-step reduction and PEGylation of graphene oxide for photothermally controlled drug delivery. Biomaterials. 2014;35:4986–4995. doi: 10.1016/j.biomaterials.2014.02.032. [DOI] [PubMed] [Google Scholar]
- 57.Matesanz M-C, et al. The effects of graphene oxide nanosheets localized on F-actin filaments on cell-cycle alterations. Biomaterials. 2013;34:1562–1569. doi: 10.1016/j.biomaterials.2012.11.001. [DOI] [PubMed] [Google Scholar]
- 58.Luo N, et al. PEGylated graphene oxide elicits strong immunological responses despite surface passivation. Nat. Commun. 2017;8:1–10. doi: 10.1038/ncomms14537. [DOI] [PMC free article] [PubMed] [Google Scholar]
- 59.Mendonça MCP, et al. PEGylation of reduced graphene oxide induces toxicity in cells of the blood–brain barrier: an in vitro and in vivo study. Mol. Pharm. 2016;13:3913–3924. doi: 10.1021/acs.molpharmaceut.6b00696. [DOI] [PubMed] [Google Scholar]
- 60.Abdollahi Z, Taheri-Kafrani A, Bahrani SA, Kajani AA. PEGAylated graphene oxide/superparamagnetic nanocomposite as a high-efficiency loading nanocarrier for controlled delivery of methotrexate. J. Biotechnol. 2019;298:88–97. doi: 10.1016/j.jbiotec.2019.04.006. [DOI] [PubMed] [Google Scholar]
- 61.Manson J, Kumar D, Meenan BJ, Dixon D. Polyethylene glycol functionalized gold nanoparticles: the influence of capping density on stability in various media. Gold Bull. 2011;44:99–105. [Google Scholar]
- 62.Bidram E, et al. Targeted graphene oxide networks: Cytotoxicity and synergy with anticancer agents. ACS Appl. Mater. Interfaces. 2018;10:43523–43532. doi: 10.1021/acsami.8b17531. [DOI] [PubMed] [Google Scholar]
- 63.Charmi J, Nosrati H, Amjad JM, Mohammadkhani R, Danafar H. Polyethylene glycol (PEG) decorated graphene oxide nanosheets for controlled release curcumin delivery. Heliyon. 2019;5:e01466. doi: 10.1016/j.heliyon.2019.e01466. [DOI] [PMC free article] [PubMed] [Google Scholar]
- 64.Bikhof Torbati, M., Ebrahimian, M., Yousefi, M. & Shaabanzadeh, M. GO-PEG as a drug nanocarrier and its antiproliferative effect on human cervical cancer cell line. Artifi. Cells, Nanomed. Biotechnol.45, 568–573 (2017). [DOI] [PubMed]
- 65.Li M, Wang C. Preparation and characterization of GO/PEG photo-thermal conversion form-stable composite phase change materials. Renewab. Energy. 2019;141:1005–1012. [Google Scholar]
- 66.Kazempour M, Namazi H, Akbarzadeh A, Kabiri R. Synthesis and characterization of PEG-functionalized graphene oxide as an effective pH-sensitive drug carrier. Artifi. Cells Nanomed. Biotechnol. 2019;47:90–94. doi: 10.1080/21691401.2018.1543196. [DOI] [PubMed] [Google Scholar]
- 67.Kamakshi T, Sundari GS, Erothu H, Rao T. Synthesis and characterization of graphene based iron oxide (Fe3O4) nanocomposites. Rasayan Journal of Chemistry. 2018;11:1113–1119. [Google Scholar]
- 68.Mostaghasi E, Zarepour A, Zarrabi A. Folic acid armed Fe3O4-HPG nanoparticles as a safe nano vehicle for biomedical theranostics. J. Taiwan Inst. Chem. Eng. 2018;82:33–41. [Google Scholar]
- 69.Jawad M, et al. Effect of gold nanoparticles on transmittance and conductance of graphene oxide thin films and efficiency of perovskite solar cells. Appl. Nanosci. 2020;10:485–497. [Google Scholar]
- 70.Çakmak NK, Küçükyazıcı M, Eroğlu A. Synthesis and stability analysis of folic acid-graphene oxide nanoparticles for drug delivery and targeted cancer therapies. Int. Adv. Res. Eng. J. 2019;3:81–85. [Google Scholar]
- 71.Chauhan G, et al. “Gold nanoparticles composite-folic acid conjugated graphene oxide nanohybrids” for targeted chemo-thermal cancer ablation: in vitro screening and in vivo studies. Eur. J. Pharm. Sci. 2017;96:351–361. doi: 10.1016/j.ejps.2016.10.011. [DOI] [PubMed] [Google Scholar]
- 72.Esmaeili, Y., Zarrabi, A., Mirahmadi-Zare, S.Z. & Bidram, E. Hierarchical multifunctional graphene oxide cancer nanotheranostics agent for synchronous switchable fluorescence imaging and chemical therapy. Microchim. Acta187, 1–15 (2020). [DOI] [PubMed]
- 73.Yan, Y., Amini, A. & Sun, QP. On anomalous depth-dependency of the hardness of NiTi shape memory alloys in spherical nanoindentation. J. Mat. Res.28, 2031–2039 (2013).


