Abstract
Purpose
To provide a rapid, non-invasive fat-water separation technique allowing for producing quantitative maps of particular lipid components.
Methods
The calf muscles in 5 healthy adolescents (age 12–16 years; BMI = 20 ± 3 Kg/m2) were scanned by two different fat fraction (FF) measurement methods. A density-weighted concentric ring trajectory (DW-CRT) metabolite cycling (MC) magnetic resonance spectroscopic imaging (MRSI) technique was implemented to collect data with a nominal resolution of 0.25 mL within 3 minutes and 16 seconds. For comparative purposes, the standard Dixon technique was performed. The two techniques were compared using structural similarity (SSIM) analysis. Additionally, the difference in the distribution of each lipid over the adolescent calf muscles was assessed based on the MRSI data.
Results
The proposed MRSI technique provided individual FF maps for eight musculoskeletal lipid components identified by LCModel analysis (IMC/L(CH3), EMCL(CH3), IMC/L(CH2)n, EMC/L(CH2)n, IMC/L(CH2–CH), EMC/L(CH2–CH), IMC/L(–CH=CH–), and EMC/L(–CH=CH–)) with mean SSIM indices of 0.19, 0.04, 0.03, 0.50, 0.45, 0.04, 0.07, and 0.12, respectively compared to the maps generated by the used Dixon method. Further analysis of voxels with zero SSIM demonstrated an increased sensitivity of FF lipid maps from data acquired using this MRSI technique over the standard Dixon technique. The lipid spatial distribution over calf muscles was consistent with previously published findings in adults.
Conclusion
This MRSI technique can be a useful tool when individual lipid FF maps are desired within a clinically acceptable time and with a nominal spatial resolution of 0.25 mL.
Keywords: fast MRSI, fat fraction, IMCL, lipid, musculoskeletal, quantification
1 |. INTRODUCTION
The accumulation of adipose tissue in the human body is a risk factor for many common health disorders, such as type 2 diabetes mellitus (T2DM) and cardiovascular disease.1,2 Indeed, obese children and adolescents are more likely to develop such health problems.3–5 It has been found that intramyocellular triglycerides (lipids) content has a direct relationship to insulin resistance,6,7 and is hypothesized to be a precursor to T2DM.8,9 Thus, a non-invasive method to reliably evaluate particular lipid content can be useful in the early detection and prevention of such diseases in children, adolescents, and adults.
Currently, there are several methods available to investigate fat content within the muscles of the body. An invasive biopsy specimen can be extracted from a limited region of interest (ROI).10–12 Alternately, computed tomography (CT)13 and magnetic resonance imaging (MRI) can noninvasively image a larger area for fat content assessment. However, MRI is preferred over CT for fat quantification, especially in children, because CT uses ionizing radiation.
The Dixon MRI technique has been used to quantify in vivo total fat fraction (FF).14 This technique has been considered to be the standard MRI method in providing information about the fat level from a relatively large area in the body. However, the clinically available Dixon MRI techniques are utilized to map the total fat fraction rather than the individual lipid component (Table 1) as these techniques cannot differentiate the signal amplitude of each fatty acid separately. In certain situations, individual lipid component information might reflect different pathology or physiology. For instance, the methylene lipid group (CH2)n is considered to evaluate arterial stiffness.15 On the other hand, only the intramyocellular methylene (IMCL(CH2)n) is the lipid component of particular interest since its elevated level has been found to be a biomarker for insulin resistivity6,16 as well as for mitochondrial disorder MELAS.17 All these studies indicate a need to measure the lipid components separately.
TABLE 1.
Common musculoskeletal lipid signals detected by MR techniques
| Lipid | Chemical shift [ppm] | Chemical group | Location in muscles | Bone marrow & subcutaneous existence |
|---|---|---|---|---|
| IMC/L (CH3) | 0.9 | Methyl CH3 | IMCL | ✓ |
| EMCL (CH3) | 1.1 | EMCL | x | |
| IMC/L (CH2)n | 1.3 | Bulk methylene (CH2)n | IMCL | ✓ |
| EMC/L (CH2)n | 1.5 | EMCL | β-methylene CO–CH2–CH2– | |
| IMC/L (CH2–CH) | 2.1 | Allylic methylene –CH2–CH=CH– | IMCL | ✓ |
| EMC/L (CH2–CH)a | 2.3 | EMCL | α-methylene CO–CH2–CH2– | |
| IMC/L (–CH=CH–) | 5.3 | Unsaturated olefinic fat –CH=CH– | IMCL | ✓ |
| EMC/L (–CH=CH–) | 5.5 | EMCL |
Abbreviations: EMCL, Extramyocellular lipid; IMCL, Intramyocellular lipid; L, lipid in general (e.g., within the bone marrow or subcutaneous spectra).
Within the bone marrow or subcutaneous spectra, this lipid is L(CH2–CH2–).
The single-voxel magnetic resonance spectroscopy (SV-MRS) can be used to differentiate the lipid components. However, it has a limited volume of interest. Alternatively, conventional magnetic resonance spectroscopy imaging (MRSI) methods can be used to cover an entire cross-section over the region of interest, but it requires a long scan time between ~ 17 to 51 minutes.23–27 Acceleration of MRSI sequences had been achieved by reducing the flip angle and repetition time (TR),28 or by using a gradient-echo sequence with several echo time (TE) step increments.29 These accelerated methods allow a very high resolution (<0.1 mL) within a shorter acquisition time (~ 10–15 minutes). However, they compromise on large water residual and only allowing for detection of the most intense methylene peaks.30 MRSI acceleration was also achieved by using a circular sampling acquisition,31 or by implementing an echo planer acquisition technique to speed up the scan by trading the signal-to-noise ratio.30,32 However, these techniques alone do not provide water information without an extra measurement.
High spatial resolution is important since it enhances the spectral line separation and eventually the detectability of different lipid peaks. Extramyocellular lipid (EMCL) and intramyocellular lipid (IMCL) are usually separated by ~ 0.2 ppm due to the local bulk magnetic susceptibility (BMS).18,19 Unlike IMCL, EMCL extends along the muscle fibers, and thus its chemical shift may be affected by the fiber orientation relative to the main magnetic field (B0) direction because of the experienced anisotropic BMS.19,33 The separation of EMCL from IMCL was found to be maximal when the fiber orientation is parallel to B0. However, the precision frequency of the EMCL starts approaching that of IMCL as the muscle fibers orientation deviates away from B0 direction.19 Therefore, muscles with asymmetrical fibers orientation distribution such as the soleus muscle will have broader EMCL spectral linewidth.34 Thus, using techniques of high spatial resolution is desired to reduce the potential variation of the fiber orientation within the same voxel and eventually mitigate its influence of widening the EMCL spectral line width. This is especially useful to resolve the peak of EMCL(CH2)n and its adjacent smaller peak of IMCL(CH2)n.
Therefore, there is a need for a reliable and fast non-invasive in vivo acquisition method that is capable of providing the spatial distribution for each lipid component of interest within a clinically acceptable acquisition time. In this work, we demonstrate a high-resolution, density-weighted concentric ring trajectory (DW-CRT) 35 metabolite cycling (MC) free induction decay (FID) MRSI acquisition technique to provide the spatially resolved water and lipid spectra simultaneously. By using this advantage, the water signal information can be used as an internal reference to calculate the FF voxel-wisely in a similar approach used by the Dixon method, but for each lipid component individually based on their amplitude and unique resonance frequency. Thus, the aim of this study is to investigate the regional distribution of each lipid component over the calf muscles in an adolescent population.
2 |. METHODS
2.1 |. Human subjects
In vivo calf muscle scans were performed for five healthy non-obese adolescent volunteers [2 males and 3 females; age 12–16 years (median = 14 years); body mass index (BMI) = 20 ± 3 Kg/m2]. The scans were acquired at the maximum circumference of the lower leg. All subjects stated that they did not exercise for at least 24 hours before their scan. The study was conducted in accordance with the institutional review board of Purdue University. Before being scanned, an informed written assent was obtained from all the subjects, and written consent was obtained from their parents.
2.2 |. MR scanning parameters
The data were acquired by using the integrated body coil of the Siemens Prisma 3T MR system (Siemens, Germany). The FID DW-CRT MRSI was prescribed using a Hanning-windowed acquisition with an alpha of 1 and the following parameters: field of view (FOV) = 240 × 240 mm2, matrix size = 48 × 48, acquisition delay = 4 ms, repetition time (TR) = 1 s, points-per-ring = 64, temporal samples = 512, resolution = 5 × 5 × 10 mm3 (nominal resolution= 0.25 mL), number of rings = 24, spatial interleaves = 4, and spectral bandwidth = 1250 Hz. For the MC, similar parameters to that used in Steel et al.35 and Emir et al.36 were implemented: an 80 Hz transition bandwidth (−0.95 < Mz/M0 < 0.95) and 820 Hz inversion bandwidth (−1 < Mz/M0 < −0.95), 70 to −750 Hz) downfield/upfield from the carrier frequency (carrier frequency offset = +60 Hz and −60 Hz for downfield and upfield) were defined. The number of averages was 1, corresponding to a total acquisition duration of 3 minutes and 16 seconds.
For comparison, imaging with a 3-point fast-spin-echo (FSE) Dixon sequence was performed with echo time (TE) = 11 ms, TR = 5 s, 2 averages, FOV = 200 × 200 mm2, and resolution = 0.6 × 0.6 × 10 mm3. Since Dixon is considered the standard MR technique of clinical scanners to quantify FF and map the fat only and water only distributions, its results will serve as a reference to assess the goodness of the MRSI results.
To get an anatomical image suitable for segmentation, an image was acquired with a T1-FLASH sequence with TR/TE = 250 ms/2.46 ms, flip angle = 60o, 2 averages, 0.6 × 0.6 × 10 mm3 resolution, and FOV = 200 × 200 mm2.
All the above sequences were planned to collect data from the same axial slice placed at the scanner isocenter.
2.3 |. Phantom experiment
In order to assess the quantification accuracy, a lipid phantom with 50:50 lipid/water concentration has been constructed as described in Hu et al. study.37 The Dixon and MRSI sequences were used to scan the lipid and water only phantoms.
2.4 |. MRSI post-processing
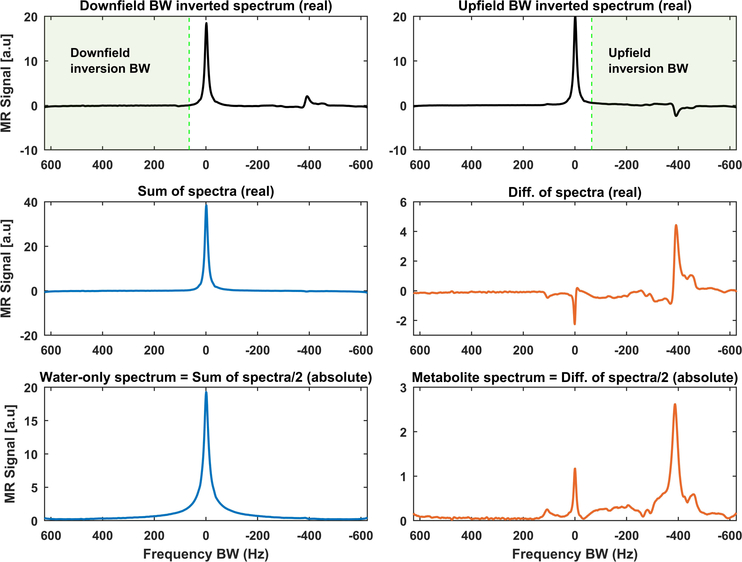
The MRSI data were reconstructed in MATLAB (MathWorks, Natick, MA, USA). The gridding and the Fast Fourier Transform were performed by utilizing the Nonuniform FFT (NUFFT) method38 without using any post-hoc density compensation since DW-CRT is already weighted by design.39 The voxel-wise frequency and phase corrections were performed using cross-correlation and least-square fit algorithms, respectively, as described in Emir, et al..36 The FIDs were smoothed by using a Gaussian filter of 250 ms timing parameter and zero filling to 1024 time points. Following, the water-only and the metabolite-only spectra were created by summing and subtracting the alternating FIDs, respectively, as described in Figure 1.
FIGURE 1.
Example of how to get water-only and metabolite-only (includes the lipid peaks) spectra using metabolite cycling (MC) acquisition. The MC acquisition technique includes two selective adiabatic inversion RF pulses, each with a transition over the water bandwidth (BW). The first adiabatic pulse inverts the downfield BW relative to the water frequency (top panel, left), while the second one inverts only the metabolites upfield of the water frequency (top panel, right). The sum of these spectra provides a pure water spectrum with a minimal residual metabolite signal (middle panel, left), while their difference gives a pure metabolite spectrum with insignificant residual water (middle panel, right). The final spectra are magnitude spectra divided by two since the summation and subtraction give double the original signal (bottom panel)
2.5 |. Quantification
The Dixon technique provides a water image and a total lipid image. In order to generate a signal fat fraction map out of these Dixon images, the following formula is used:
| (1) |
Where signalTotal= lipid + water images signals. An illustration of signal FFDixon map reconstruction can be found in Supporting Figure S1.
As for MRSI, MC FID DW-CRT provides water-only and metabolite-only resonance spectra. Following their spectral post-processing, these spectra from each voxel are passed into LCModel to fit each peak of the spectra individually and return their integrated signal.40
In order to avoid phase correction artifacts in areas overwhelmed by lipids such as bone marrow or subcutaneous fat regions, the LCModel phase correction option was set to zero. Instead, the magnitude value was used as previously done by Meisamy et al..41 In order to correct for the long water T1 relaxation time effect, the water reference attenuation correction parameter, ATTH2O, in LCModel was used. This parameter was determined based on the T1 signal relaxation term, 1-exp(−TR/T1), where the T1 value of water in skeletal muscle was assigned to 1412 ms as measured by Stanise et al. at 3T.42 LCModel’s basis set of muscle spectra, “muscle-5”, was used to fit the magnitude MRSI-spectra. To construct the MRSI maps, only peaks with Cramér-Rao lower bounds (CRLB) values of 8% or less (measured by LCModel) were used. The FF was then calculated by using a similar expression to that used to calculate the FFdixon:
| (2) |
For both techniques the water fraction (WF) is calculated by the following formula:
| (3) |
In addition, to assess the MC performance within the calf area, the residual water (RW) fraction was calculated as:
| (4) |
Where signalRW is the signal of the residual water peak within the metabolite-only spectra fitted by the LCModel.
2.6 |. Muscle segmentation
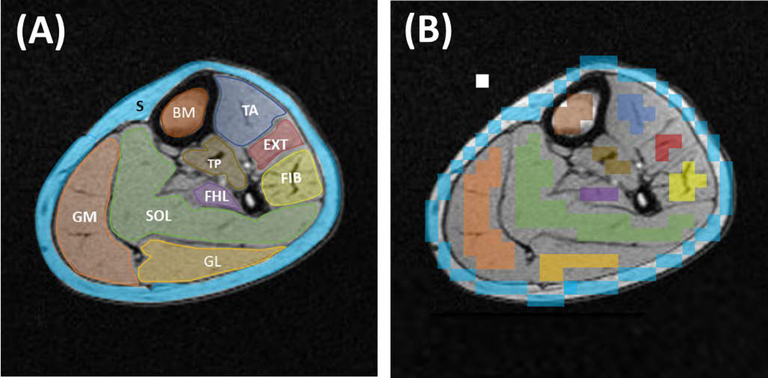
To assess the spatial FF distribution of each lipid component within the calf muscles, muscles were manually segmented by drawing ROIs over each of the eight main muscles based on their high-resolution T1-weighted image. The ROIs borders were determined by following the muscle boundaries. These ROIs were down-sampled to match MRSI resolution and co-registered to each lipid FF map to assess their distribution voxel-wisely. To avoid any partial volume effect by adjacent structures, voxels on the borders were excluded out of the down-sampled ROIs (Figure 2).
FIGURE 2.
A, Calf muscle, bone marrow (BM), and subcutaneous (S) region of interests (ROIs) drawn on a high-resolution T1 axial image, which provides a good anatomical delineation. Eight ROIs were used to cover the main eight calf muscles. SOL, Soleus muscle; FIB, Fibularis muscles; EXT, Extensor longus muscles; TA, Tibialis anterior muscle; GM, Gastrocnemius medialis muscle; GL, Gastrocnemius lateralis muscle; FHL, Flexor halluces longus muscle; TP, Tibialis posterior muscle. B, The same ROI set after being down-sampled into MRSI resolution and removing the voxels on the muscle borders. The white box represents one ROI voxel
2.7 |. Data analysis
To compare the results of the two used techniques, the Structural Similarity (SSIM) Index method,43 implemented in MATLAB, was used to find the level of similarity in fat detectability between the FF maps generated from the MRSI versus those from the Dixon technique. SSIM analysis compares two images and returns their signal intensity and structural similarity level (index) for each voxel as well as a global (mean of all voxels) value. In addition, regression comparisons with ROIs were performed between the FF values measured from the Dixon method data versus the data of the integrated IMCL and EMCL. For comparison, this regression analysis was performed with FF calculated with all eight lipid peaks, and also with only the upfield lipid peaks (methyl and bulk methylene lipid peaks).
Additionally, in order to assess each lipid component FF spatial distribution within the muscles estimated by the proposed MRSI method, the previously segmented muscle ROIs were used with each lipid component FF map. To eliminate outlier voxels from generating false-positive findings, a minimum positive voxel threshold (MPVT = 1/number of subjects = 20% of the ROI voxels from all subjects) was considered. This means that only muscles with enough (i.e., above MPVT) positive voxels (voxels containing the lipid of comparison and passed the CRLB criteria of peak fitting goodness) were included in the regional comparison. To conduct this regional comparison, the Kruskal Wallis one-way analysis of variance test was used to assess the lipid spatial distribution variation and followed by the Bonferroni multiple comparison test to determine whether a significant FF difference exists between any two muscles.
3 |. RESULTS
The phantom study showed that Dixon and MRSI were able to estimate the true FF (see Supporting Figure S2). The results of the lipid phantom FF in the defined volume of interest were 49.6 ± 9 % measured by MRSI and 47.4 ± 5.4 % by the used Dixon method.
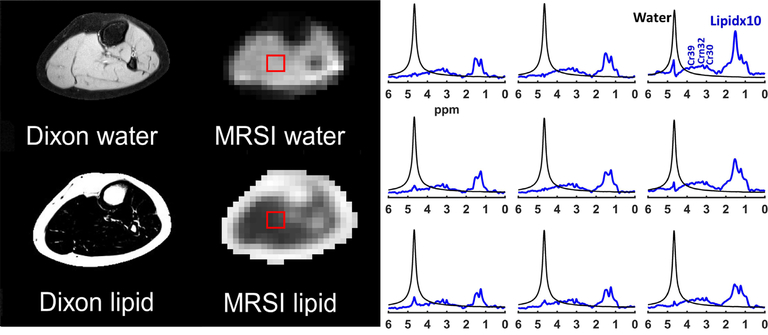
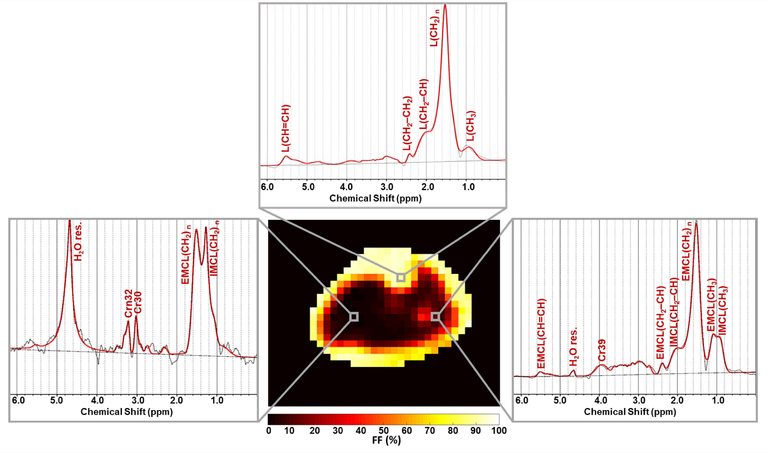
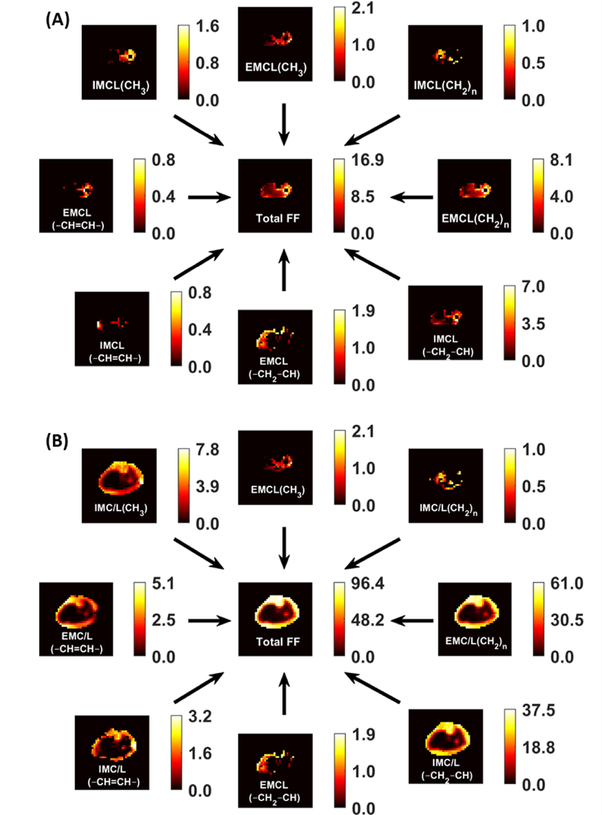
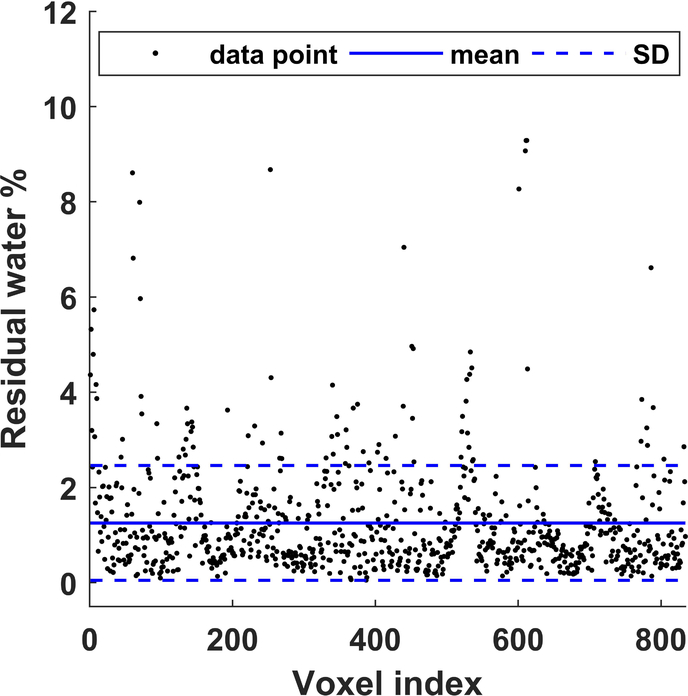
As shown in Figure 3, generated water- and lipid-only maps of MC MRSI are in agreement with the anatomical distribution of those provided by the Dixon technique. The proposed MRSI technique further provided separate pure water spectra, and spectra with different lipid components and other metabolites. The generated MRSI spectra were fitted by LCModel, which identified eight lipid peaks found within the metabolite spectra (IMC/L(CH3), EMCL(CH3), IMC/L(CH2)n, EMC/L(CH2)n, IMC/L(CH2–CH), EMC/L(CH2–CH), IMC/L(–CH=CH–), and EMC/L(–CH=CH–)) plus Cr30, Cr39, and Crn32 (see examples in Figure 4). In addition to total FF, water fraction, integrated IMCL, and integrated EMCL FF maps (see Supporting Figure S3), eight separate FF maps of each lipid component were reconstructed (Figure 5) from the quantification results by LCModel for the fitted lipid and water peaks. The MC method resulted in only 1.3 ±1.2% RW fraction that was only found in half of the calf voxels (Figure 6).
FIGURE 3.
Dixon versus MRSI output. The results of the FID density-weighted concentric ring trajectory (DW-CRT) metabolite cycling MRSI sequence are in line with the Dixon images. On the right, representative water (black) and lipid (blue) spectra acquired from the same location (box) by MRSI. The lipid peaks were magnified ten times compared to the water peak for better visualization
FIGURE 4.
Representative spectra fitted by LCModel from different locations in muscles and bone. The shown spectra (black) were acquired from the voxels highlighted on the total fat fraction map. The LCModel fit is shown in red, with the fitted lipid components labeled. H2O res. stands for the residual water signal. Other metabolites than lipids can also be detected such as CH3 and CH2 groups of creatine that resonate at 3.0 ppm (Cr30) and 3.9 ppm (Cr39), respectively, in addition to the CH3 group of carnitine (Crn32)
FIGURE 5.
Representative fat fraction (FF) maps for each lipid component that was fitted by LCModel. Only results with CRLB of 8% or less were included. The scale next to each map indicates the FF values from 0 to maximum in percent. A, the dominant lipid in the bone and subcutaneous regions were masked to better visualization of the muscle lipid components, which usually have lower contents. B, the same maps without any tissue masking
FIGURE 6.
Residual water (RW) after implementing the MC. Out of 1626 voxels within the calf area (from the five subjects), the LCModel could fit residual water in 832 voxels with a mean RW fraction of 1.3 ±1.2%
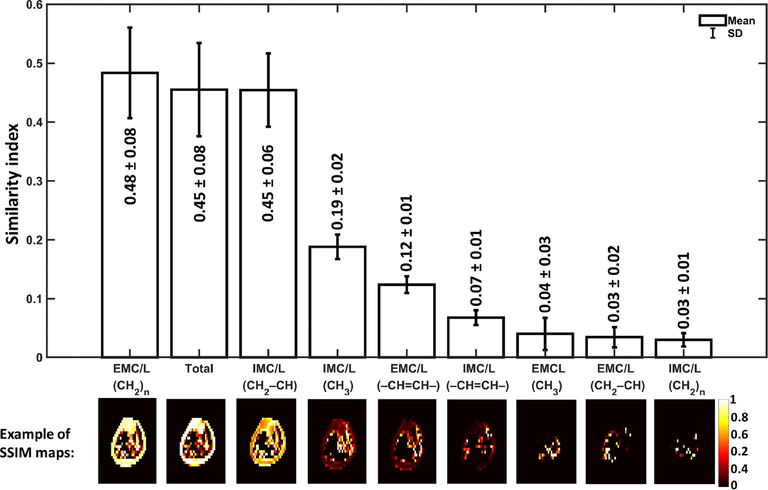
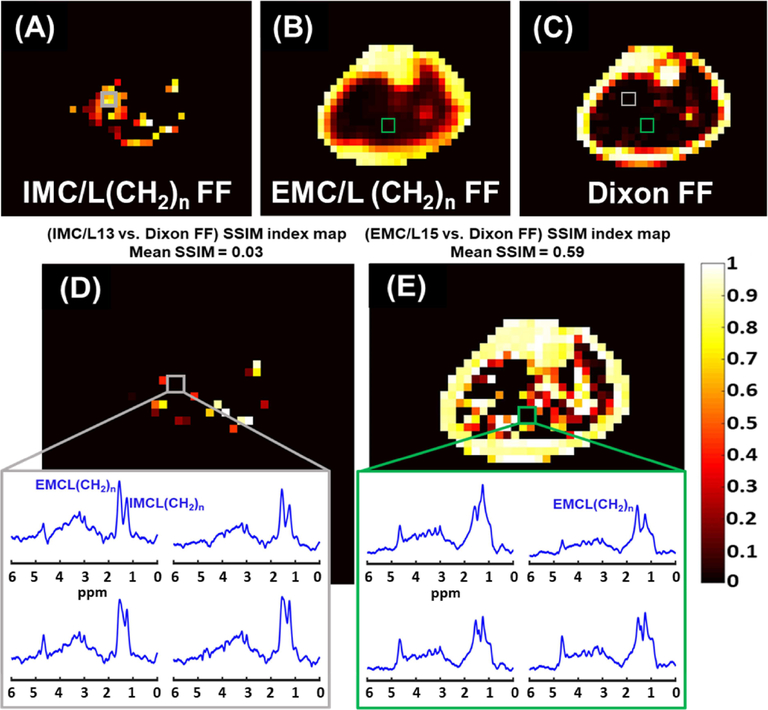
The results of the SSIM analysis comparing the signal FFDixon-map to each lipid component FF-map generated by MRSI are illustrated in Figure 7. The data presented as SSIM index mean ± standard error that was evaluated for all the five scanned subjects. Figure 8 demonstrates an example of the SSIM analysis result from one subject’s data. The example involved the lipid of the highest signal, the EMC/L(CH2)n, and the lipid of the lowest signal, the IMC/L(CH2)n. In this example, the mean SSIM index results from comparing the Dixon technique used in this study to the IMC/L(CH2)n results was very low (0.03) compared to the similarity of EMC/L(CH2)n (0.59). In fact, the Dixon technique used in this study could not detect IMC/L(CH2)n and EMC/L(CH2)n in several locations where the MRSI was able to detect considerable signals from these lipid components. For demonstration, in the same figure, spectra from 2×2 voxels covering a random area where total mismatching present (SSIM = 0) were shown. This also can be seen from the regression analysis in Supporting Figure S4, the shaded boxes. The regression analysis in Supporting Figure S4 also shows that the Dixon values mostly coming from the extramyocellular (EMCL) signal, specifically from the upfield lipid peaks (Supporting Figure S4, D), which is in-line with earlier reports.44,45
FIGURE 7.
Dixon similarity to MRSI maps results. The structural similarity (SSIM) indices mean as a result of comparing the Dixon signal fat fraction (FF) map to the FF-map of each lipid detected by MRSI. The mean and standard error were calculated based on the data from the five healthy subjects. The SSIM indices range between 0 and 1. SSIM=1 represents a perfect similarity. The results are ordered based on their order of similarity from the highest to lowest (left to right). Representative SSIM maps from one subject are depicted below each bar of their corresponding lipid component. The results suggest that Dixon’s fat signal is mainly coming from EMC/L(CH2)n, IMC/L(CH2–CH), and IMC/L(CH3)
FIGURE 8.
Fat fraction (FF) distribution maps of MRSI IMC/L(CH2)n (A), EMC/L(CH2)n (B), and the Dixon-MRI undifferentiated-fat-fraction image (C). The Dixon MRI image was down-sampled to MRSI resolution for a better comparison. The corresponding SSIM index maps show the structural similarity (SSIM) between the Dixon signal FF image and the MRSI IMC/L(CH2)n FF map (D), and the EMC/L(CH2)n FF map (E). The mean SSIM value is listed above each SSIM map. The dark areas of SSIM = 0 on the maps (box) represent total mismatching between MRSI and the used Dixon method results. Within these areas, only MRSI could identify lipid peaks
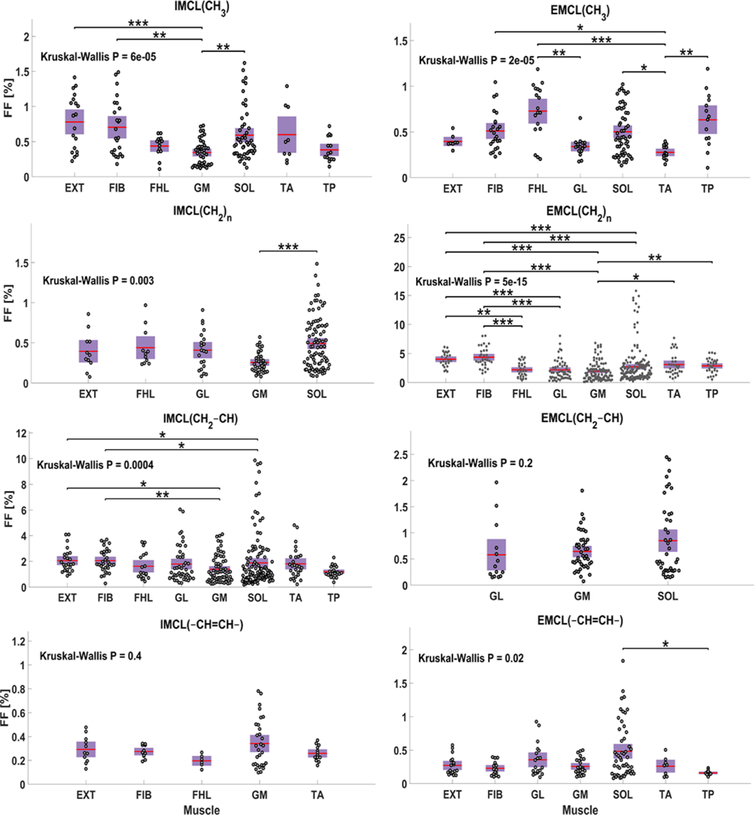
As shown in Figure 9, IMC/L(CH3) FF was present in all the muscles that were defined in Figure 2 except in the GL as IMC/L(CH3) was detected within less than 20% of its ROI voxels. According to the Kruskal-Wallis (KW) statistics, the FF of IMC/L(CH3) was highly variable among tested muscles (KW-P < 0.001), and it was significantly lower in GM than in EXT (P < 0.001), FBL and SOL (P < 0.01) based on the multi comparison statistics. For EMCL(CH3), it existed within less than 20% of the GM voxels. The KW statistics also indicated a very high variation of this lipid among the other muscles (KW-P < 0.001). The EMCL(CH3) level was significantly lower in TA compared to FHL (P < 0.001), TP (P < 0.01), SOL and FIB (P < 0.05), and it was also lower in GL relative to FHL (P < 0.01). For IMC/L(CH2)n, the MPVT was exceeded only in five muscles (EXT, FHL, GL, GM, and SOL). Its level among these muscles was only higher in SOL compared to it within GM (P < 0.001). On the other hand, EMC/L(CH2)n was detected within all the calf muscles with a very large level variation (KW-P < 0.001). The multi-comparison analysis detected that EMC/L(CH2)n has a higher FF in EXT and FIB compared to GL, GM, and SOL (P < 0.001). The EMC/L(CH2)n FF was also smaller in FHL compared to FIB (P < 0.001) and EXT (P < 0.01) and smaller in GM compared to TP (P < 0.01) and TA (P < 0.05). Similar to EMC/L(CH2)n, the IMC/L(CH2–CH) was also detected within all the muscles with a strong FF distribution variability (KW-P < 0.001), with a significantly higher FF within FIB than in GM (P < 0.01), and SOL (P < 0.05), and EXT has higher FF compared to GM and SOL as well (P < 0.05). On the other hand, EMC/L(CH2–CH) was detected with enough voxels larger than the MPVT only in the three muscles located at the posterior part of the leg (GL, GM, and SOL) and without significant FF variation among them (KW-P = 0.2). For IMC/L(–CH=CH–), The MPVT was satisfied in only five muscles (EXT, FIB, FHL, GM, and TA) without significant fat level variation (KW-P = 0.4). The EMC/L(–CH=CH–) was not above the MPVT for the FHL and GL voxels. Among the other muscles, the EMC/L(–CH=CH–) FF distribution was found to be moderately variable (KW-P = 0.02) as only SOL has significantly higher FF of EMC/L(–CH=CH–) relative to TP (P < 0.05).
FIGURE 9.
Regional comparison of each lipid component fat fraction (FF) distribution within the calf muscles. Each plotted point represents one voxel FF data. Only muscles with at least 20% of their voxels containing the lipid of comparison are included. The p-value (P) of Kruskal Wallis analysis of variance test is listed for each lipid distribution. The *, **, *** represent P <0.05, P <0.01, and P <0.001 respectively, and are shown when a significant difference exists between any two muscles according to the Bonferroni multi-comparison test
4 |. DISCUSSION
Our proposed technique has a set of advantages. It is fast, which reduces motion artifact, and reduces the MRI acquisition durations. Although this MRSI has lower spatial resolution compared to MRI, it has a high spatial (in term of MRSI) and spectral resolution to reduce the degrading influence of the point spread function and the fiber orientation heterogeneity on spectral quality. Furthermore, it has a short TE relative to the lipid and water T2 values, so quantification is possible without the need for a T2 correction. Most importantly, it provides water-only and separate lipid signals simultaneously for more precise FF quantification that eventually reflected in better diagnosing ability. Finally, the water-only spectra are used as an internal reference, to minimize sideband artefacts and to perform voxel-wise post-processing corrections without the need for an extra acquisition.
This work has shown that clinically important lipid components, but of relatively low MR signal such as IMC/L(CH2)n are better evaluated by the proposed MRSI method rather than the imaging technique. This recommendation is based on the findings observed from the SSIM analysis. As demonstrated in the results, the MRSI method showed a better performance identifying those lipid components of lower levels. Such molecules of interest normally have a low signal that is hard to be detected by imaging techniques or overwhelmed by larger signals from other molecules within the same voxel. Indeed, the lipid signal measured by the conventional Dixon techniques mainly originates from the methyl and methylene peaks. This finding agrees with a previous phantom study that showed that the Dixon method provides lower accuracy in quantifying total FF compared with MRS when the signals from all lipid peaks were summed.45
The FSE Dixon technique used here is a limitation of this study. Usually, a gradient echo proton density FF (PDFF) Dixon sequence with a shorter TE is used for more accurate FF quantification. However, we used a conventional Dixon technique that is similar to the most common Dixon sequences available with the most clinical scanners. Since we used the body coil, we had to turn off the parallel imaging feature, which resulted in prolonging the scan time. To mitigate the impact of not using the parallel imaging, we used an FSE sequence46 and adjusted its parameters (by setting the TE to the shortest possible value and using a long TR) to make it closer to a proton-density-weighted sequence. However, the used TE (11 ms) may not be short enough to avoid the potential T2 influence, especially on the faster-decaying water signal. In addition, J-coupling at a TE of 11 ms might have affected the fat signal decay of the FSE Dixon method.47,48 Thus, the FF measured by the FSE Dixon method is signal-weighted FF rather than PDFF. Although that other advanced Dixon techniques were introduced and some of them suggested methods to account for the fat multipeak existence such as the work done by Yu et al.,49 they are still not independently able to allocate different map for each lipid of interest like the proposed MRSI technique. Indeed, the multipeak modeling approach assumes that peaks have constant relative amplitudes. However, this assumption may not always be applicable. At least within the muscles, the relative peak amplitudes have been noticed to change with exercises and diseases.50,51
The phantom study showed that MRSI could provide a more accurate estimation of the true FF compared to the used Dixon method, but with lower precision. However, this lower precision is expected due to the lower spatial response function of the used DW-CRT method with an alpha of 1.39
We decided to perform this study on an adolescent population to investigate the lipid distribution in this age group as several studies have conducted a similar assessment but on adult populations.23,52,53 Most of these adult studies considered only IMC/L(CH2)n and EMC/L(CH2)n distribution. Our findings agree with all these previously published studies for IMC/L(CH2)n. However, for EMC/L(CH2)n, our findings on adolescents agree only with one study findings52 that there is no significant variation in EMC/L(CH2)n content within SOL and TA. For the other three studies, the EMC/L(CH2)n level was always significantly larger in SOL relative to it in TA. Although that our IMC/L(CH2)n distribution conclusion matches the published studies, the other studies were able to report values for IMC/L(CH2)n level in TA, which usually the lowest among the investigated muscles, but our findings suggest that no IMC/L(CH2)n was detected in this muscle. Potential reasons for these contrast in findings could be the age impact as muscles lipid content found to be lower in younger age,54,55 because some of these studies conducted by using a large SV-MRS, which is more sensitive to the partial volume effect, or MRSI without considering a method to exclude the false positives. In addition, SV-MRS was found to have more variability to reproduce the same measurement compared to MRSI based on the study done by Shen et al.56 on the TA muscle which can be another potential reason for this difference in findings of this muscle. The uneven distribution of IMC/L(CH2)n across muscles was related to the amount of slow-twitch (type I) fibers in the muscles.23,52 For instance, the majority of SOL fibers are of type I, whereas GM and GL contain more fast-twitch (type II) fibers.57 In contrast to type II fibers, type I is smaller in diameter, contains more mitochondria, depends less on the ATPase activity to produce energy and thus stores more IMCL for the mitochondrial oxidation process.57–59 In addition, the functional role52 and fiber orientation24 of muscles were suggested as a potential contributor in the lipid content regional differences. Thus, the reason for the contrast of the lipids level among muscles still needs further investigations.
Conducting this research by scanning healthy young subjects was challenging since their tissue fat content is not as high as that in obese people or patients with a condition associated with a fat level increase. Further, using the body coil exacerbate the challenge due to its lower sensitivity. However, our technique could successfully produce high-quality data. Even so, the results can be enhanced further by using a dedicated multiple receive coil. Indeed, by using the scanner-integrated body coil, we showed the feasibility to use it to achieve good spectra while an x-nuclei coil was attached to the scanner for another purpose. Furthermore, the data quality can be increased more by using a shorter TE that helps to reduce the eddy current effect on the smoothness of the spectra baseline.
A summary of the latest MRI/S methods for neuromuscular disease monitoring has been recently published.60 Within this publication, the importance of advancing quantitative MR-based fat mapping techniques was emphasized. We think that our proposed technique would help the field by providing a different approach to assess fat infiltration diseases. Actually, the importance of this proposed technique can be extended beyond the focus of this work to cover more applications such as quantifying FF in the bone marrow to assess osteoporosis,61 and Anorexia nervosa,62 or to assess the intrahepatic lipid (IHL) in the liver, which is used to evaluate the hepatic steatosis.63 Nonetheless, our proposed technique can be used to assess physiological change by mapping extra metabolites such as Crn32 that associated with muscle exercises, or maybe implemented to assess choline level to evaluate hepatic and breast tumors.64–66 Further, this MRSI sequence could fill the need for a fast fat-water separation to provide specific lipid component maps for fatty liver. This need was expressed in a study by Parente et al., where they preferred imaging technique since SV-MRS required a long time, and it may increase the chance of misinterpretation in cases of heterogeneous steatosis.67 Although that the proposed MRSI method showed its applicability on the calf region, further testing is still required at other prospective body regions. Conducting similar analysis outside the calf region is important to assess this method performance when a potential larger B0 inhomogeneity may be present which influences the lipid peaks linewidths.
To the best of our knowledge, this is the first time a technique provided to generate separate spatial FF maps for the lipid components. However, the lower spatial resolution of MRSI relative to imaging may be a limitation for some applications. Thus, a technique to improve the MRSI spatial resolution further (within the same acquisition time, or less) would be useful to serve any fat quantification application.
CONCLUSIONS
The proposed MRSI technique provides a needed tool to quantify different lipid components non-invasively. It can reliably detect fat components with high sensitivity and provides pure water information to calculate the FF accurately. Most importantly, it allows reconstructing separate quantitative spatial maps for the lipid components over the entire region of interest within clinically feasible acquisition time, ~ 3 minutes.
Supplementary Material
FIGURE S1 Dixon output and signal fat fraction map reconstruction. In order to generate a fat fraction map by the Dixon technique, at least two signal acquisitions are required. Since the strongest fat component, the bulk methylene, has a chemical shift of about 3.5 ppm lower than water, one acquisition is acquired when this fat component is in-phase (IP) with water spins and another acquisition when they are out-of-phase (OP). The signal sum of the IP and OP acquisitions will eliminate most of the fat signal contribution and render double the water signal, and their difference will result in double the fat signal without water signal. By dividing the results by two, images of water-only and fat-only signals are produced. From theses fat/water only images, a signal fat fraction map can be calculated using Equation (1)
FIGURE S2 A, structural image shows the phantoms setup. B, corresponding Dixon signal fat fraction (FF) map. C, The MRSI total FF map. Both methods were able to estimate the phantom FF. However, the MRSI provided more accurate result (49.6 ± 9 % and 47.4 ± 5.4 % measured by MRSI and Dixon, respectively). The blue circles highlight the region that quantified (the bottles border was excluded).
FIGURE S3 Additional to muscles total fat fraction (FF) and water fraction (WF) maps, an integrated intramyocellular lipid (IMCL) peaks map, and integrated extramyocellular lipid (EMCL) peaks FF maps can be generated. These maps showing the ability of the MRSI method to spatially resolve IMCL and EMCL
FIGURE S4 Region of interests (ROIs) comparison between the Dixon signal fat fraction (SFF) values versus the integrated intramyocellular lipid (IMCL) and integrated extramyocellular lipid (EMCL) fat fraction (FF) values measured by MRSI with different peak models. Among these comparisons, Dixon data values are closer to the agreement (the unity line) when compared with the integrated EMCL data which suggests that the Dixon signal is mostly coming from EMCL. The correlation agreement increases when only the upfield lipid peaks are used (D) and only for the regions of high FF (subcutaneous and bone ROIs). Muscles ROIs have low FF and MRSI was more sensitive by detecting more lipid signals at these ROIs (shaded boxes)
ACKNOWLEDGMENTS
The study was supported by the Indiana CTSI and funded in part by grant #UL1TR001108 from the NIH, NCATS, CTS Award, as well as a pilot grant by the College of Health and Human Sciences, Purdue University.
Funding information
Indiana CTSI; grant #UL1TR001108 from the NIH, NCATS, CTS Award; as well as a pilot grant by the College of Health and Human Sciences, Purdue University.
Footnotes
SUPPORTING INFORMATION
Additional supporting information may be found online in the Supporting Information section at the end of this article.
REFERENCES
- 1.Bogardus C, Lillioja S, Mott DM, Hollenbeck C, Reaven G. Relationship between degree of obesity and in vivo insulin action in man. Am J Physiol Metab. 1985. doi: 10.1152/ajpendo.1985.248.3.E286 [DOI] [PubMed] [Google Scholar]
- 2.Abbasi F, Brown BW, Lamendola C, McLaughlin T, Reaven GM. Relationship between obesity, insulin resistance, and coronary heart disease risk. J Am Coll Cardiol. 2002. doi: 10.1016/S0735-1097(02)02051–X [DOI] [PubMed] [Google Scholar]
- 3.Must A, Jaques PF, Dallal GE, Bajema CJ, Dietz WH. Long-Term Morbidity and Mortality of Overweight Adolescents — A Follow-up of the Harvard Growth Study of 1922 to 1935. N Engl J Med. 1992. doi: 10.1056/NEJM199211053271904 [DOI] [PubMed] [Google Scholar]
- 4.Dietz WH, Richardson S, Goodman N, et al. Health Consequences of Obesity in Youth: Childhood Predictors of Adult Disease. Pediatrics. 1998. doi: 10.1007/s12098-011-0489-7 [DOI] [PubMed] [Google Scholar]
- 5.Daniels SR. The consequences of childhood overweight and obesity. Futur Child. 2006. doi: 10.1353/foc.2006.0004 [DOI] [PubMed] [Google Scholar]
- 6.Krssak M, Falk Petersen K, Dresner A, et al. Intramyocellular lipid concentrations are correlated with insulin sensitivity in humans: A 1H NMR spectroscopy study. Diabetologia. 1999. doi: 10.1007/s001250051123 [DOI] [PubMed] [Google Scholar]
- 7.Perseghin G, Scifo P, De Cobelli F, et al. Intramyocellular triglyceride content is a determinant of in vivo insulin resistance in humans: A 1H-13C nuclear magnetic resonance spectroscopy assessment in offspring of type 2 diabetic parents. Diabetes. 1999. doi: 10.2337/diabetes.48.8.1600 [DOI] [PubMed] [Google Scholar]
- 8.Saad MF, Knowler WC, Pettitt DJ, Nelson RG, Charles MA, H. Bennett P. A two-step model for development of non-insulin-dependent diabetes. Am J Med. 1991. doi: 10.1016/0002-9343(91)90547-B [DOI] [PubMed] [Google Scholar]
- 9.Goodpaster BH, Wolf D. Skeletal muscle lipid accumulation in obesity, insulin resistance, and type 2 diabetes. Pediatr Diabetes. 2004. doi: 10.1111/j.1399-543X.2004.00071.x [DOI] [PubMed] [Google Scholar]
- 10.Hoppeler H, Lüthi P, Claassen H, Weibel ER, Howald H. The ultrastructure of the normal human skeletal muscle - A morphometric analysis on untrained men, women and well-trained orienteers. Pflügers Arch Eur J Physiol. 1973. doi: 10.1007/BF00588462 [DOI] [PubMed] [Google Scholar]
- 11.Goodpaster BH, Kelley DE, Thaete FL, He J, Ross R. Skeletal muscle attenuation determined by computed tomography is associated with skeletal muscle lipid content. J Appl Physiol. 2000. doi: 10.1152/jappl.2000.89.1.104 [DOI] [PubMed] [Google Scholar]
- 12.Essén B, Hagenfeldt L, Kaijser L. Utilization of blood‐borne and intramuscular substrates during continuous and intermittent exercise in man. J Physiol. 1977. doi: 10.1113/jphysiol.1977.sp011726 [DOI] [PMC free article] [PubMed] [Google Scholar]
- 13.Kelley DE, Slasky BS, Janosky J. Skeletal muscle density: Effects of obesity and non-insulin-dependent diabetes mellitus. Am J Clin Nutr. 1991. doi: 10.1093/ajcn/54.3.509 [DOI] [PubMed] [Google Scholar]
- 14.Dixon WT. Simple proton spectroscopic imaging. Radiology. 1984;153(1):189–194. [DOI] [PubMed] [Google Scholar]
- 15.Hasegawa N, Kurihara T, Sato K, et al. Intramyocellular and Extramyocellular Lipids Are Associated with Arterial Stiffness. Am J Hypertens. 2015. doi: 10.1093/ajh/hpv041 [DOI] [PubMed] [Google Scholar]
- 16.Jacob S, Machann J, Rett K, et al. Association of increased intramyocellular lipid content with insulin resistance in lean nondiabetic offspring of type 2 diabetic subjects. Diabetes. 1999. doi: 10.2337/diabetes.48.5.1113 [DOI] [PubMed] [Google Scholar]
- 17.Golla S, Ren J, Malloy CR, Pascual JM. Intramyocellular lipid excess in the mitochondrial disorder MELAS. Neurol Genet 2017. doi: 10.1212/NXG.0000000000000160 [DOI] [PMC free article] [PubMed] [Google Scholar]
- 18.Schick F, Eismann B, Jung W ‐ I, Bongers H, Bunse M, Lutz O. Comparison of localized proton NMR signals of skeletal muscle and fat tissue in vivo: Two lipid compartments in muscle tissue. Magn Reson Med. 1993. doi: 10.1002/mrm.1910290203 [DOI] [PubMed] [Google Scholar]
- 19.Boesch C, Slotboom J, Hoppeler H, Kreis R. In vivo determination of intramyocellular lipids in human muscle by means of localized1H-MR-spectroscopy. Magn Reson Med. 1997. doi: 10.1002/mrm.1910370403 [DOI] [PubMed] [Google Scholar]
- 20.Velan SS, Durst C, Lemieux SK, et al. Investigation of muscle lipid metabolism by localized one- and two-dimensional MRS techniques using a clinical 3T MRI/MRS scanner. J Magn Reson Imaging. 2007;25(1):192–199. doi: 10.1002/jmri.20786 [DOI] [PubMed] [Google Scholar]
- 21.Ren J, Dimitrov I, Sherry AD, Malloy CR. Composition of adipose tissue and marrow fat in humans by 1 H NMR at 7 Tesla. J Lipid Res. 2008. doi: 10.1194/jlr.D800010-JLR200 [DOI] [PMC free article] [PubMed] [Google Scholar]
- 22.Machann J, Stefan N, Wagner R, et al. Intra- and interindividual variability of fatty acid unsaturation in six different human adipose tissue compartments assessed by 1H-MRS in vivo at 3 T. NMR Biomed 2017. doi: 10.1002/nbm.3744 [DOI] [PubMed] [Google Scholar]
- 23.Hwang J-H, Pan JW, Heydari S, Hetherington HP, Stein DT. Regional differences in intramyocellular lipids in humans observed by in vivo 1 H-MR spectroscopic imaging. J Appl Physiol. 2001. doi: 10.1152/jappl.2001.90.4.1267 [DOI] [PubMed] [Google Scholar]
- 24.Vermathen P, Kreis R, Boesch C. Distribution of Intramyocellular Lipids in Human Calf Muscles as Determined by MR Spectroscopic Imaging. Magn Reson Med. 2004. doi: 10.1002/mrm.10721 [DOI] [PubMed] [Google Scholar]
- 25.Weis J, Courivaud F, Hansen MS, Johansson L, Ribe LR, Ahlström H. Lipid content in the musculature of the lower leg: Evaluation with high-resolution spectroscopic imaging. Magn Reson Med. 2005. doi: 10.1002/mrm.20518 [DOI] [PubMed] [Google Scholar]
- 26.Larson-Meyer DE, Newcomer BR, Hunter GR. Influence of endurance running and recovery diet on intramyocellular lipid content in women: a 1H NMR study. Am J Physiol Metab. 2002;282(1):E95–E106. [DOI] [PubMed] [Google Scholar]
- 27.Hu J, Willcott MR, Moore GJ. Two-Dimensional Proton Chemical-Shift Imaging of Human Muscle Metabolites. J Magn Reson. 1997. doi: 10.1006/jmre.1997.1163 [DOI] [PubMed] [Google Scholar]
- 28.Newcomer BR, Lawrence JC, Buchthal S, den Hollander JA. High‐resolution chemical shift imaging for the assessment of intramuscular lipids. Magn Reson Med An Off J Int Soc Magn Reson Med. 2007;57(5):848–858. [DOI] [PubMed] [Google Scholar]
- 29.Weis J, Johansson L, Courivaud F, Karlsson FA, Ahlström H. Quantification of intramyocellular lipids in obese subjects using spectroscopic imaging with high spatial resolution. Magn Reson Med. 2007. doi: 10.1002/mrm.21085 [DOI] [PubMed] [Google Scholar]
- 30.Weis J, Bruvold M, Ortiz-Nieto F, Ahlström H. High-resolution echo-planar spectroscopic imaging of the human calf. PLoS One. 2014;9(1). doi: 10.1371/journal.pone.0087533 [DOI] [PMC free article] [PubMed] [Google Scholar]
- 31.Vermathen P, Saillen P, Boss A, Zehnder M, Boesch C. Skeletal muscle 1H MRSI before and after prolonged exercise. I. muscle specific depletion of intramyocellular lipids. Magn Reson Med. 2012. doi: 10.1002/mrm.24168 [DOI] [PubMed] [Google Scholar]
- 32.Bao S, Guttmann CRG, Mugler JP, et al. Spin-echo planar spectroscopic imaging for fast lipid characterization in bone marrow. Magn Reson Imaging. 1999. doi: 10.1016/S0730-725X(99)00056-9 [DOI] [PubMed] [Google Scholar]
- 33.Szczepaniak LS, Dobbins RL, Stein DT, Denis McGarry J. Bulk magnetic susceptibility effects on the assessment of intra- and extramyocellular lipids in vivo. Magn Reson Med. 2002. doi: 10.1002/mrm.10086 [DOI] [PubMed] [Google Scholar]
- 34.Steidle G, Machann J, Claussen CD, Schick F. Separation of intra- and extramyocellular lipid signals in proton MR spectra by determination of their magnetic field distribution. J Magn Reson. 2002. doi: 10.1006/jmre.2001.2481 [DOI] [PubMed] [Google Scholar]
- 35.Steel A, Chiew M, Jezzard P, et al. Metabolite-cycled density-weighted concentric rings k-space trajectory (DW-CRT) enables high-resolution 1 H magnetic resonance spectroscopic imaging at 3-Tesla. Sci Rep 2018. doi: 10.1038/s41598-018-26096-y [DOI] [PMC free article] [PubMed] [Google Scholar]
- 36.Emir UE, Burns B, Chiew M, Jezzard P, Thomas MA. Non-water-suppressed short-echo-time magnetic resonance spectroscopic imaging using a concentric ring k-space trajectory. NMR Biomed. 2017. doi: 10.1002/nbm.3714 [DOI] [PMC free article] [PubMed] [Google Scholar]
- 37.Hu HH, Kim HW, Nayak KS, Goran MI. Comparison of fat-water MRI and single-voxel MRS in the assessment of hepatic and pancreatic fat fractions in humans. Obesity. 2010. doi: 10.1038/oby.2009.352 [DOI] [PMC free article] [PubMed] [Google Scholar]
- 38.Fessler JA, Sutton BP. Nonuniform fast Fourier transforms using min-max interpolation. IEEE Trans Signal Process. 2003. doi: 10.1109/TSP.2002.807005 [DOI] [Google Scholar]
- 39.Chiew M, Jiang W, Burns B, et al. Density-weighted concentric rings k-space trajectory for1H magnetic resonance spectroscopic imaging at 7 T. NMR Biomed. 2018. doi: 10.1002/nbm.3838 [DOI] [PMC free article] [PubMed] [Google Scholar]
- 40.Provencher SW. Estimation of metabolite concentrations from localized in vivo proton NMR spectra. Magn Reson Med. 1993. doi: 10.1002/mrm.1910300604 [DOI] [PubMed] [Google Scholar]
- 41.Meisamy S, Hines CDG, Hamilton G, et al. Quantification of Hepatic Steatosis with T1-independent, T2*-corrected MR Imaging with Spectral Modeling of Fat: Blinded Comparison with MR Spectroscopy. Radiology. 2011. doi: 10.1148/radiol.10100708 [DOI] [PMC free article] [PubMed] [Google Scholar]
- 42.Stanisz GJ, Odrobina EE, Pun J, et al. T1, T2 relaxation and magnetization transfer in tissue at 3T. Magn Reson Med. 2005. doi: 10.1002/mrm.20605 [DOI] [PubMed] [Google Scholar]
- 43.Wang Z, Bovik AC, Sheikh HR, Simoncelli EP. Image quality assessment: from error visibility to structural similarity. IEEE Trans image Process. 2004;13(4):600–612. [DOI] [PubMed] [Google Scholar]
- 44.Burakiewicz J, Sinclair CDJ, Fischer D, Walter GA, Kan HE, Hollingsworth KG. Quantifying fat replacement of muscle by quantitative MRI in muscular dystrophy. J Neurol. 2017. doi: 10.1007/s00415-017-8547-3 [DOI] [PMC free article] [PubMed] [Google Scholar]
- 45.Dyke JP, Lauto A, Schneider E, et al. Homogeneous Water-Lipid Phantoms with Matched T1 and T2 Relaxation Times for Quantitative Magnetic Resonance Imaging of Tissue Composition at 3.0 Tesla. 2004;11:2004. [Google Scholar]
- 46.Hardy PA, Hinks RS, Tkach JA. Separation of fat and water in fast spin‐echo MR imaging with the three‐point dixon technique. J Magn Reson Imaging. 1995. doi: 10.1002/jmri.1880050213 [DOI] [PubMed] [Google Scholar]
- 47.Hamilton G, Middleton MS, Bydder M, et al. Effect of PRESS and STEAM sequences on magnetic resonance spectroscopic liver fat quantification. J Magn Reson Imaging. 2009. doi: 10.1002/jmri.21809 [DOI] [PMC free article] [PubMed] [Google Scholar]
- 48.Breitkreutz DY, Fallone BG, Yahya A. Effect of J coupling on 1.3-ppm lipid methylene signal acquired with localised proton MRS at 3T. NMR Biomed. 2015. doi: 10.1002/nbm.3387 [DOI] [PubMed] [Google Scholar]
- 49.Yu H, Shimakawa A, McKenzie CA, Brodsky E, Brittain JH, Reeder SB. Multiecho water-fat separation and simultaneous R*2 estimation with multifrequency fat spectrum modeling. Magn Reson Med. 2008. doi: 10.1002/mrm.21737 [DOI] [PMC free article] [PubMed] [Google Scholar]
- 50.Golla S, Ren J, Malloy CR, Pascual JM. Intramyocellular lipid excess in the mitochondrial disorder MELAS. Neurol Genet 2017. doi: 10.1212/NXG.0000000000000160 [DOI] [PMC free article] [PubMed] [Google Scholar]
- 51.Schrauwen-Hinderling VB, Hesselink MKC, Schrauwen P, Kooi ME. Intramyocellular lipid content in human skeletal muscle. Obesity. 2006. doi: 10.1038/oby.2006.47 [DOI] [PubMed] [Google Scholar]
- 52.Rico-Sanz J, Thomas EL, Jenkinson G, Mierisová Š, Iles R, Bell JD. Diversity in levels of intracellular total creatine and triglycerides in human skeletal muscles observed by 1 H-MRS. J Appl Physiol. 1999;87(6):2068–2072. doi: 10.1152/jappl.1999.87.6.2068 [DOI] [PubMed] [Google Scholar]
- 53.Nakagawa Y, Hattori M. Intramyocellular lipids of muscle type in athletes of different sport disciplines. Open Access J Sport Med. 2017. doi: 10.2147/oajsm.s139801 [DOI] [PMC free article] [PubMed] [Google Scholar]
- 54.Schwenzer NF, Martirosian P, Machann J, et al. Aging effects on human calf muscle properties assessed by MRI at 3 Tesla. J Magn Reson Imaging. 2009. doi: 10.1002/jmri.21789 [DOI] [PubMed] [Google Scholar]
- 55.Sinha R, Dufour S, Petersen KF, et al. Assessment of skeletal muscle triglyceride content by 1H nuclear magnetic resonance spectroscopy in lean and obese adolescents: Relationships to insulin sensitivity, total body fat, and central adiposity. Diabetes. 2002. doi: 10.2337/diabetes.51.4.1022 [DOI] [PubMed] [Google Scholar]
- 56.Shen W, Mao X, Wolper C, et al. Reproducibility of single- and multi-voxel 1H MRS measurements of intramyocellular lipid in overweight and lean subjects under conditions of controlled dietary calorie and fat intake. NMR Biomed. 2008. doi: 10.1002/nbm.1218 [DOI] [PMC free article] [PubMed] [Google Scholar]
- 57.Edgerton VR, Smith JL, Simpson DR. Muscle fibre type populations of human leg muscles. Histochem J. 1975. doi: 10.1007/BF01003594 [DOI] [PubMed] [Google Scholar]
- 58.LITHELL H ÖRLANDER J, SCHÉLE R, SJÖDIN B, KARLSSON J Changes in lipoprotein-lipase activity and lipid stores in human skeletal muscle with prolonged heavy exercise. Acta Physiol Scand. 1979. doi: 10.1111/j.1748-1716.1979.tb06471.x [DOI] [PubMed] [Google Scholar]
- 59.Schiaffino S, Reggiani C. Fiber Types in Mammalian Skeletal Muscles. Physiol Rev. 2011. doi: 10.1152/physrev.00031.2010 [DOI] [PubMed] [Google Scholar]
- 60.Strijkers GJ, Araujo ECA, Azzabou N, et al. Exploration of new contrasts, targets, and MR imaging and spectroscopy techniques for neuromuscular disease-A workshop report of working group 3 of the biomedicine and molecular biosciences COST action BM1304 MYO-MRI. J Neuromuscul Dis 2019. doi: 10.3233/JND-180333 [DOI] [PMC free article] [PubMed] [Google Scholar]
- 61.Yeung DKW, Griffith JF, Antonio GE, Lee FKH, Woo J, Leung PC. Osteoporosis is associated with increased marrow fat content and decreased marrow fat unsaturation: A proton MR spectroscopy study. J Magn Reson Imaging. 2005. doi: 10.1002/jmri.20367 [DOI] [PubMed] [Google Scholar]
- 62.Bredella MA, Fazeli PK, Miller KK, et al. Increased bone marrow fat in anorexia nervosa. J Clin Endocrinol Metab. 2009. doi: 10.1210/jc.2008-2532 [DOI] [PMC free article] [PubMed] [Google Scholar]
- 63.Hussain HK, Chenevert TL, Londy FJ, et al. Hepatic Fat Fraction: MR Imaging for Quantitative Measurement and Display—Early Experience. Radiology. 2005. doi: 10.1148/radiol.2373041639 [DOI] [PubMed] [Google Scholar]
- 64.Li C, Kuo YC, Chen C, et al. Quantification of choline compounds in human hepatic tumors by proton MR spectroscopy at 3 T. Magn Reson Med An Off J Int Soc Magn Reson Med. 2005;53(4):770–776. [DOI] [PubMed] [Google Scholar]
- 65.Tse GM, Yeung DKY, King AD, Cheung HS, Yang WT. In vivo proton magnetic resonance spectroscopy of breast lesions: An update. Breast Cancer Res Treat. 2007. doi: 10.1007/s10549-006-9412-8 [DOI] [PubMed] [Google Scholar]
- 66.Roebuck JR, Cecil KM, Schnall MD, Lenkinski RE. Human breast lesions: characterization with proton MR spectroscopy. Radiology. 1998. doi: 10.1148/radiology.209.1.9769842 [DOI] [PubMed] [Google Scholar]
- 67.Parente DB, Rodrigues RS, Paiva FF, et al. Is MR spectroscopy really the best MR-based method for the evaluation of fatty liver in diabetic patients in clinical practice? PLoS One. 2014. doi: 10.1371/journal.pone.0112574 [DOI] [PMC free article] [PubMed] [Google Scholar]
Associated Data
This section collects any data citations, data availability statements, or supplementary materials included in this article.
Supplementary Materials
FIGURE S1 Dixon output and signal fat fraction map reconstruction. In order to generate a fat fraction map by the Dixon technique, at least two signal acquisitions are required. Since the strongest fat component, the bulk methylene, has a chemical shift of about 3.5 ppm lower than water, one acquisition is acquired when this fat component is in-phase (IP) with water spins and another acquisition when they are out-of-phase (OP). The signal sum of the IP and OP acquisitions will eliminate most of the fat signal contribution and render double the water signal, and their difference will result in double the fat signal without water signal. By dividing the results by two, images of water-only and fat-only signals are produced. From theses fat/water only images, a signal fat fraction map can be calculated using Equation (1)
FIGURE S2 A, structural image shows the phantoms setup. B, corresponding Dixon signal fat fraction (FF) map. C, The MRSI total FF map. Both methods were able to estimate the phantom FF. However, the MRSI provided more accurate result (49.6 ± 9 % and 47.4 ± 5.4 % measured by MRSI and Dixon, respectively). The blue circles highlight the region that quantified (the bottles border was excluded).
FIGURE S3 Additional to muscles total fat fraction (FF) and water fraction (WF) maps, an integrated intramyocellular lipid (IMCL) peaks map, and integrated extramyocellular lipid (EMCL) peaks FF maps can be generated. These maps showing the ability of the MRSI method to spatially resolve IMCL and EMCL
FIGURE S4 Region of interests (ROIs) comparison between the Dixon signal fat fraction (SFF) values versus the integrated intramyocellular lipid (IMCL) and integrated extramyocellular lipid (EMCL) fat fraction (FF) values measured by MRSI with different peak models. Among these comparisons, Dixon data values are closer to the agreement (the unity line) when compared with the integrated EMCL data which suggests that the Dixon signal is mostly coming from EMCL. The correlation agreement increases when only the upfield lipid peaks are used (D) and only for the regions of high FF (subcutaneous and bone ROIs). Muscles ROIs have low FF and MRSI was more sensitive by detecting more lipid signals at these ROIs (shaded boxes)


