

Abstract
The current pandemic threat of COVID‐19, caused by the novel coronavirus SARS‐CoV‐2, not only gives rise to a high number of deaths around the world but also has immense consequences for the worldwide health systems and global economy. Given the fact that this pandemic is still ongoing and there are currently no drugs or vaccines against this novel coronavirus available, this in silico study was conducted to identify a potential novel SARS‐CoV‐2‐inhibitor. Two different approaches were pursued: 1) The Docking Consensus Approach (DCA) is a novel approach, which combines molecular dynamics simulations with molecular docking. 2) The Common Hits Approach (CHA) in contrast focuses on the combination of the feature information of pharmacophore modeling and the flexibility of molecular dynamics simulations. The application of both methods resulted in the identification of 10 compounds with high coronavirus inhibition potential.
Keywords: COVID-19, coronavirus, virtual screening, in silico, molecular docking, common hits approach, docking consensus approach
1. Introduction
Since the outbreak of COVID‐19, caused by the SARS‐CoV‐2 virus, this disease has spread rapidly around the world leading the WHO to declare COVID‐19 as the first pandemic threat since the H1N1 swine flu outbreak 2009.1, 3 From its epicenter located in Wuhan, China (December 2019), the number of affected countries has increased rapidly to more than 200 with over 1 million confirmed cases and over 63,000 confirmed deaths, as of April 6, 2020.4, 5 Although the calculated case‐fatality percentage varies from 1.4 % to 9 % and is very heterogeneous across countries, the impact of the current COVID‐19 pandemic could potentially bring immense consequences to the worldwide health systems and global economy ‐ especially given the fact that this pandemic is still ongoing and there are currently no drugs or vaccines against this novel coronavirus available on the market.6, 8, 10, 11
Currently, different approaches are being pursued to find a solution to this global threat. The core strategy hereby is not only the development of a much‐needed vaccine but also the repositioning of U.S. Food and Drug Administration (FDA) approved drugs.,[9], [13] Although the development of a novel drug under normal circumstances is more time‐consuming than the relatively fast drug repositioning, the FDA officially facilitated the development of novel COVID‐19 therapies in order to encourage also this strategy ‐ especially because novel identified antiviral compounds could demonstrate a much higher antiviral effect against SARS‐CoV‐2.14, 16 Therefore, this in silico study was performed to identify novel potent coronavirus inhibitors.
Moreover, the relatively new drug development approach of a “multi‐target” or “promiscuous binding” compound as a new lead was used in this study. Hereby, the assumption, that such a drug is not selective towards one single target but interacts with multiple receptors and therefore could demonstrate a better activity profile – e. g. blocking different pathways of a given disease – brings new interesting possibilities in medicinal chemistry.17, 18 Therefore, we used multiple proteins of the SARS‐CoV‐2 virus as possible targets and developed two different methods in order to discover a potential new multi‐target SARS‐CoV‐2‐inhibitor.
In this study, we pursued two different approaches to identify a possible SARS‐CoV‐2‐Inhibitor: i) Docking Consensus Approach (DCA) and ii) Common Hits Approach (CHA).19 Both approaches are starting from the same hit list obtained by a pharmacophore‐based screening of a large compound library: Here, we used the crystal structure of SARS‐CoV‐2 protease in complex with a peptide inhibitor (PDB code: 6LU7) as a starting point to derive a structure‐based pharmacophore.21 For further investigation, we selected 10 proteins from the SARS‐CoV‐2 proteome. Detailed information about the selection of the proteins and their description are under Methods, Protein Selection and System Preparation (Figure 1).
Figure 1.
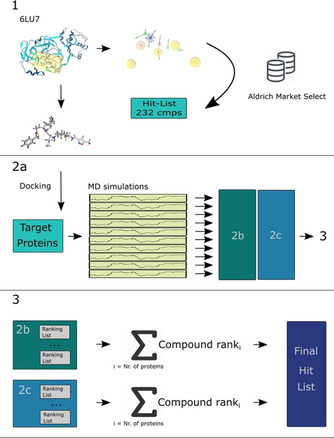
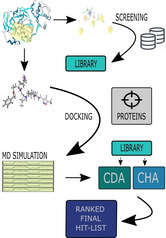
shows the overall performed approach. In the first part (1), a structure‐based pharmacophore model is generated from the structure of SARS‐CoV‐2 protease in complex with a peptide inhibitor (PDB code: 6LU7).21 The screening performed with this pharmacophore model retrieved a hit list of 232 compounds and was converted to the ‘Hit‐List 232 cmps’ library. 2a: In order to find the binding pocket in each of the 10 target proteins, the binding pocket finder of the LigandScout 4.4.3 suite was utilized and the most promising binding pocket was chosen.22 After the MD simulation of every protein‐system the two different methods (DCA and CHA – displayed as 2b and 2c) were applied. With the results of both methods calculations were performed in order to investigate, which compound performed the best over all 10 protein systems (3).
In the field of structure‐based drug‐design, molecular docking is a powerful method used to investigate promising ligands regarding their binding pose as well as scoring their binding affinity. Its reliability highly varies due to two reasons: First, the often‐neglected protein flexibility and second, mostly the enthalpic energy terms are taken into consideration when scoring binding poses. The adverse effect of taking just one conformation into account can be mitigated by either utilizing flexible docking procedures or by performing molecular dynamics simulations (MDs).
Nevertheless, these simulations are normally performed on a nanosecond timescale, so it is hardly possible to thoroughly sample the conformational space in order to accurately calculate the binding affinity. Still, they can be utilized to evaluate if the docked ligands are stable in the binding pocket.24
The Docking Consensus Approach (Figure 2b) is a novel approach, which combines docking with molecular dynamics simulations. In our DCA implementation ‐ this is done by generating a representative set of most dissimilar conformations occurring for each target protein during the MD simulation run by utilizing the MDTraj package.25 Afterwards, for each set‐entry, molecular docking is performed for each ligand and the added score from all clusters is then averaged. Thereby, an average docking score is obtained for each compound for the set of most distinct conformations during the molecular dynamics simulation.
Figure 2.
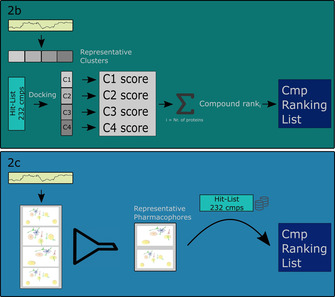
shows the two different methods more detailed. 2b: During the Docking Consensus Approach (DCA) a representative cluster of the most dissimilar conformations of the protein during the MD was generated. Afterwards, every compound of the ‘Hit‐List 232 cmps’ library is docked in each representative cluster and a consensus score of the retrieved docking scores is calculated. In the end a ranking of the compounds according to their consensus score was performed. 2c: In the Common Hits Approach (CHA) a pharmacophore model was generated for each frame retrieved from the MD simulation and ‐ through pooling the pharmacophores with the same pharmacophoric features ‐ the representative pharmacophore models (RPM) are calculated. With every RPM a virtual screening is performed, and the resulting hit lists combined and rescored to a single hit list. Three different calculations were performed to explore the overall performance of the compounds.
The Common Hits Approach (Figure 2c) in contrast focuses on the combination of pharmacophore modeling and molecular dynamics simulations and was first described by Wieder et al. in 2017.19 Herein, they present a novel approach to incorporate the conformational flexibility of the simulated systems during the MD simulation with the feature information of pharmacophore modeling. For each frame generated during the MD simulation a pharmacophore model is created and ‐ through pooling the pharmacophores with the same pharmacophore features ‐ representative pharmacophore models (RPM) are obtained. With every RPM, a virtual screening run is carried out, and the resulting hit lists are combined and rescored to a single hit list. The CHA Score is calculated for every molecule according to the number of matching RPMs.26
2. Methods
2.1. Protein Selection and System Preparation
For this study 11 different proteins were selected – one (PDB code: 6LU7) was used as the starting point and the other 10 were used for further investigation.27 To cope with the fact that the SARS‐CoV‐2 virus is a new form of coronavirus and therefore relatively few protein data are available, we not only used the RSCB PDB database (www.rcsb.org) as a source for our proteins but also performed extensive web search (following databases were searched: PubMed (NCBI), Scopus (Elsevier), SciFinder (CAS), ChemRxiv (CAS)) in order to obtain more data.29, 30, 32 On March 14, 2020, we could identify 46 published proteins concerning the novel coronavirus. Including criteria for the proteins were as follows: reliability of the model (e. g. for homology models a TM‐score above 0.7), size, and availability for research. In addition, multiple published proteins were separated, if necessary. 10 proteins fulfilled all the mentioned criteria and were therefore included to this study: QHD43421_0 (ORF7a); QHD43415_5 (Proteinase 3CL‐PRO); QHD43415_7 (nsp7); QHD43415_9 (nsp9); QHD43415_10 (nsp10); QHD43415_11 (RNA‐directed RNA polymerase – RdRp); QHD43415_12 (Helicase – Hel); QHD43415_13 (Guanine‐N7 methyltransferase – ExoN); QHD43415_14 (Uridylate‐specific endoribonuclease – NendoU); QHD43415_15 (2′‐O‐methyltransferase‐2′ – O‐MT).27
2.2. Protein Binding Pocket
In order to locate the binding pocket in each of the 10 target proteins, the binding pocket finder functionality of the LigandScout 4.4.3 suite was utilized.22 The standard parameters were used for the buriedness calculation and, after visual inspections, the most promising candidate for the binding pocket was chosen.
2.3. Molecular Dynamics Simulations
The protein‐ligand‐ systems were prepared using Maestro (Schrödinger).33 Hereby, a protonation and capping of the termini of every protein‐system was performed. For the creation of the solvation box and the addition of ions (at a concentration of 0.15 M) the CHARMM‐GUI web interface was used.34 More information about each protein‐system is given in the corresponding table in the Supporting Material. Amber 16 has been used to run the simulations and the parameterization of the system has been done using tleap and the general AMBER force field (GAFF).36 The MD simulation protocol was as follows: After an initial equilibration and thermalization phase of 125 ps with a 1 fs time step, each system was simulated for 100 ns using Langevin dynamics at a temperature of 303.15 K; the pressure was kept around 1 atm by a Monte Carlo barostat. The SHAKE algorithm was used to keep all bonds involving hydrogen atoms rigid.37 The time step of the production runs was 2 fs. Plots of the RMSD for the proteins and for their ligand are shown in the Supporting Information.
2.4. Virtual Screening and Library Preparation
The crystal structure of the SARS‐CoV‐2 protease in complex with a peptide inhibitor (PDB code: 6LU7) was retrieved from the protein data bank (RCSB‐PDB, www.rcsb.org).,[21][28] 6LU7 was chosen as the starting point, because as of 14 March 2020 it was the only reliable protein‐ligand structure from SARS‐CoV‐2 available for research. LigandScout 4.4.3 was used to generate a structure‐based pharmacophore model after correction of the ligand structure.22 The default feature constraints defined by LigandScout were used. Utilizing the screening functionality of LigandScout 4.4.3, virtual screening was performed with the generated pharmacophore model and the Aldrich Market Select (AMS) database from ChemNavigator/Sigma‐Aldrich with over 8 million unique chemical structures.38 Including all exclusion volumes spheres of the pharmacophore model and the maximum number of omitted features set to 6, a hit list of 232 molecules was obtained. These 232 unique molecules were then converted into a multi‐conformational compound library for virtual screening using the LigandScout 4.4.3 command line tool idbgen. Conformers were generated using the icon best option in idbgen to create a maximum number of 200 high quality conformers for each molecule. Subsequently, the created library will be referred to as the ‘Hit‐List 232 cmps’ library.
2.5. Docking Consensus Approach
We first performed molecular docking for all 10 target proteins with the ligand extracted from protein 6LU7 (Figure 1.1 and Figure 1.2a).21 Only the conformation with the lowest energy was chosen for the docking. For this, AutodockVina 1.1.2 was used which is integrated in the LigandScout 4.4.3 suite.,[22][39] Standard parameter settings were chosen for all ligand‐protein systems without considering protein flexibility.
For each of the docked systems, a MD simulation was performed as described above. Afterwards, the frames in the trajectories of each of the 10 systems were clustered in order to retrieve the representative clusters (shown in Figure 2.2b).25 For each of these clusters, a molecular docking was performed with all the 232 compounds out of the Hit‐List 232 cmps library. The scores for each cluster were then summed up for each compound individually. Afterwards, they were ranked according to the overall score. This was done for each target protein individually (Figure 2.2b). Then, each compound's rank was summed up over all target proteins in order to get a final ranked compound list (Figure 1.3, Table 1).
Table 1.
Top 10 Ranked Molecules by the Docking Consensus Approach.[a]
|
|
Protein‐ System |
Consensus Score[b] |
Mean Ranking[c] |
QHD 43421 _0[d] |
QHD 43415 _5[d] |
QHD 43415 _7[d] |
QHD 43415 _9[d] |
QHD 43415 _10[d] |
QHD 43415 _11[d] |
QHD 43415 _12[d] |
QHD 43415 _13[d] |
QHD 43415 _14[d] |
QHD 43415 _15[d] |
|---|---|---|---|---|---|---|---|---|---|---|---|---|---|
|
1 |
947305629 |
11 |
1,1 |
1 |
1 |
2 |
1 |
1 |
1 |
1 |
1 |
1 |
1 |
|
2 |
333060097 |
29 |
2,9 |
2 |
2 |
3 |
2 |
2 |
4 |
4 |
3 |
3 |
4 |
|
3 |
470214361 |
53 |
5,3 |
18 |
3 |
6 |
8 |
3 |
2 |
7 |
2 |
2 |
2 |
|
4 |
1064353072 |
72 |
7,2 |
6 |
6 |
8 |
7 |
6 |
7 |
12 |
8 |
5 |
7 |
|
5 |
234051742 |
73 |
7,3 |
3 |
9 |
1 |
6 |
12 |
6 |
9 |
9 |
13 |
5 |
|
6 |
397840857 |
78 |
7,8 |
4 |
13 |
10 |
4 |
8 |
5 |
8 |
10 |
7 |
9 |
|
7 |
1211818976 |
80 |
8 |
20 |
4 |
4 |
13 |
7 |
8 |
6 |
6 |
6 |
6 |
|
8 |
333483566 |
96 |
9,6 |
9 |
10 |
5 |
5 |
9 |
11 |
13 |
16 |
8 |
10 |
|
9 |
1059200906 |
107 |
10,7 |
8 |
22 |
9 |
3 |
5 |
14 |
5 |
5 |
16 |
20 |
|
10 |
27548644 |
112 |
11,2 |
5 |
12 |
7 |
12 |
13 |
17 |
16 |
18 |
9 |
3 |
[a]The best performing molecules according to the Consensus Score. The three best ranks for one protein‐system are colour‐coded red. Out of all 232 compounds compound 947305629 has the best Consensus Score – ranked for on 9 out of 10 proteins as the best compound. [b]The Consensus Score is the overall sum for each molecule over all protein rankings. [c]The Mean Ranking was calculated as the sum of the individual Ranks of one protein‐system divided by the count. [d]The individual ranks of every protein‐system. The ranking of the molecules from one protein‐system was carried out according their overall score.
2.6. Common Hits Approach
Utilizing the KNIME 4.1.2 workbench and the LigandScout Extensions for KNIME Version 1.7.3, a workflow was created to perform the Common Hits Approach combining pharmacophore modeling and molecular dynamics simulations.40 This workflow was executed for all 10 proteins individually, generating 10 hit lists – one for each protein.
First, the MD Pharmacophore Creator node was used to generate structure‐based pharmacophore models for each of the 10 000 frames saved during the MDs. The retrieved pharmacophore models were then processed by the CHA filter node. With the pharmacophore filter set to the minimum frequency of output pharmacophores of 5, the number of representative pharmacophores was reduced not only to a reasonable quantity, but also random artifacts generated during the MD simulations could be excluded. Virtual screening with the remaining pharmacophore models against the prepared Hit‐List 232 cmps library was performed using the Activity Profiling node. The screening was restrained by the maximum number of omitted features set to 0 and by the consideration of pharmacophore exclusion volume spheres. The created hit‐ list was re‐scored using the CHA Re‐Score node, giving the desired CHA Scores.
As already mentioned in the introduction, the goal of this study was to identify a novel multi‐target SARS‐CoV‐2‐inhibitor. Therefore, all molecules, which were retrieved for the 10 different possible targets were chosen for further investigation. Hereby, we calculated the mean outcome of the CHA Score from those molecules to identify which of them performed the best. Knowing that a comparison of this CHA Score on different protein‐systems can be error prone, we additionally ranked all molecules from one protein‐system according to their CHA Score (from one upwards, ranking the molecule with the highest CHA Score of the given system as the first one). With this ranking, we finally calculated the mean ranking score of every molecule over all the systems. To investigate which molecules performed the best across the included protein‐systems, we performed the following calculations to determine a Mean Standardized Ranking: Every CHA Score was divided by the maximum CHA Score of the protein‐ system. Additionally, all compounds which were not retrieved as a hit in that protein‐ system got assigned the lowest possible CHA Score (0.000). The Mean CHA Ranking was calculated using the sum of the individual Standardized Ranks of one protein‐system divided by the count.
3. Results and Discussion
We are aware that the SARS‐CoV‐2 protease 6LU7 is not the best starting point for our study, however as of 14 March 2020 it was the only reliable protein‐ligand structure available for research.
3.1. Docking Consensus Approach
The best ranked 10 compounds for the DCA are listed in Table 1 and Figure 3. Their consensus scores range from 11 to 112. The best ranked molecule is 947305629 with an overall score of 11. This molecule ranked first in all proteins except for protein QHD43415_7. The second highest ranked molecule is 333060097 with a consensus score of 29. It ranks 2nd in QHD43415_0, QHD43415_5, QHD43415_9 as well in QHD43415_10. The 3rd ranked molecule is 470214361 with an overall score of 53. Its worst specific protein ranking appears in QHD43415_0 at position 18. Its best results are in QHD43415_11, QHD43415_13, QHD43415_14 and as QHD43415_15 at the 2nd rank.
Figure 3.
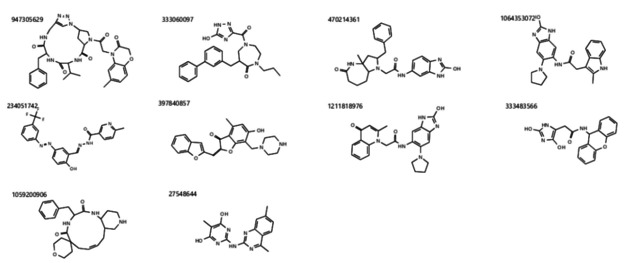
Molecular structures of the Top 10 ranked compounds by the Docking Consensus Approach according the Consensus Score.
3.2. Common Hits Approach
29 molecules of the Hit‐List 232 cmps library got retrieved as hits for the 10 different protein‐systems. In the Mean CHA Score ranking (Table 2) compound 1297875291 with a Mean CHA Score of 44.596 got ranked first and furthermore retrieved the overall highest CHA Score in the QHD43415_11‐ and QHD43415_12‐system. Interestingly, compound 234051742 on the second‐best place, showed a similar good Mean CHA Score (43.656) as well as four out of 10 possible first CHA Score Ranks (on following protein‐systems: QHD43415_9, QHD43415_10, QHD43415_13, and QHD43415_14). The compound structure of the top 10 ranked molecules by the Mean CHA Score are shown in Figure 4a, 4b, and 4d.
Table 2.
Top 10 Ranked Molecules by the Common Hits Approach according to the Mean CHA Score.[a]
|
|
Protein‐ System |
Hit[b] |
Mean CHA Score[c] |
QHD 43421 _0[d] |
QHD 43415 _5[d] |
QHD 43415 _7[d] |
QHD 43415 _9[d] |
QHD 43415 _10[d] |
QHD 43415 _11[d] |
QHD 43415 _12[d] |
QHD 43415 _13[d] |
QHD 43415 _14[d] |
QHD 43415 _15[d] |
|---|---|---|---|---|---|---|---|---|---|---|---|---|---|
|
1 |
1297875291 |
10 |
44.596 |
69.434 |
49.283 |
32.635 |
70.794 |
33.089 |
101.996 |
27.575 |
16.500 |
0.945 |
43.706 |
|
2 |
234051742 |
10 |
43.656 |
43.995 |
56.631 |
35.922 |
82.674 |
47.786 |
91.665 |
16.661 |
26.634 |
8.351 |
26.244 |
|
3 |
947305629 |
10 |
40.142 |
57.429 |
54.967 |
39.566 |
73.759 |
42.977 |
50.495 |
22.414 |
16.336 |
8.222 |
35.257 |
|
4 |
27889059 |
10 |
39.713 |
46.178 |
68.647 |
37.853 |
74.729 |
44.787 |
41.313 |
16.955 |
21.571 |
6.350 |
38.748 |
|
5 |
1046720863 |
10 |
36.494 |
56.496 |
40.348 |
35.272 |
71.577 |
34.062 |
54.999 |
25.406 |
25.897 |
0.898 |
19.988 |
|
6 |
2147483647 |
10 |
35.491 |
78.509 |
39.646 |
40.752 |
68.687 |
43.619 |
9.950 |
9.945 |
12.816 |
0.921 |
50.063 |
|
7 |
61442343 |
10 |
35.489 |
41.565 |
60.535 |
34.243 |
75.649 |
36.901 |
32.313 |
12.662 |
22.509 |
5.469 |
33.042 |
|
8 |
2472594070 |
10 |
34.650 |
76.415 |
34.003 |
38.038 |
66.110 |
37.840 |
12.779 |
11.695 |
10.987 |
2.711 |
55.920 |
|
9 |
298908912 |
10 |
33.929 |
78.746 |
40.754 |
38.540 |
45.002 |
17.374 |
38.328 |
24.244 |
11.832 |
1.794 |
42.677 |
|
10 |
28721359 |
10 |
32.176 |
65.240 |
56.365 |
38.207 |
69.285 |
37.582 |
0.892 |
11.719 |
12.613 |
1.820 |
28.032 |
[a]The best performing molecules according to the CHA Scores. Although 1297875291 is ranked as the best, 234051742 on the second place was 4 out of 10 times the molecule with the highest CHA Score. The highest CHA Scores of one protein‐system are coloured green. Interestingly, the molecules with the highest CHA Scores for protein‐system QHD43415_7 and QHD43415_15 are not under the best 10 molecules with the highest Mean CHA Score shown here. In those cases, the highest CHA Score of the protein‐system shown in this table is highlighted in bold. [b]The number of protein‐systems for which the corresponding molecule was retrieved is given here. The best ranked 10 molecules of this table got retrieved for all 10 protein‐systems. [c]The Mean CHA Score was calculated as the sum of the individual CHA Scores divided by the count. [d]The individual CHA Scores for every protein‐system.
Figure 4.
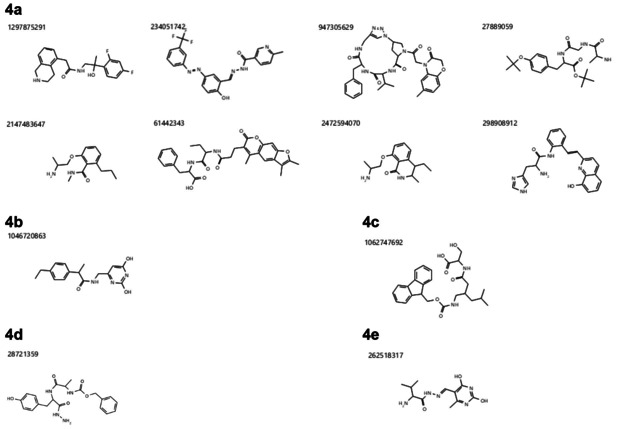
4a: The best performing compounds considering all three calculations in the Common Hits Approach. The shown compounds are – according to the Mean CHA Score, the Mean Ranking and the Mean Standardized Ranking – always under the best 10 out of 232 compounds. 4b: The only compound appearing in the top 10 hit lists of the Mean CHA Score and Mean Standardized Ranking, but not in the Mean Ranking. 4c: The only compound appearing in the top 10 hit lists of the Mean Ranking and Mean Standardized Ranking, but not in the Mean CHA Score. 4d: The only compound appearing in the top 10 hit list of the Mean CHA Score. 4e: The only compound appearing in the top 10 hit list of the Mean Ranking.
Surprisingly, the molecules with the highest CHA Scores for the QHD43415_7‐ and QHD43415_15‐system (compound 371435065 and 187814506, see Figure 5) did not show up under the top 10 compounds, considering the Mean CHA Score.
Figure 5.
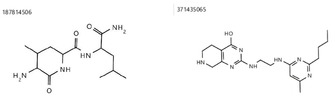
The best performing molecules considering the CHA Score in the protein‐system QHD43415_7 and QHD43415_15. Both never appear in any top 10 hit list.
The results of the second calculation for the Mean Ranking are shown in Table 3, Figure 4a, 4c, and 4d. Hereby, most of the compounds already shown in Table 2 also appear in the top 10 ranking of Table 3. The only two new compounds are 1062747692 on rank 8 and 262518317 on rank 9. Although they weren′t in the top 10 Mean CHA Ranking discussed before, they still got under the best 20 out of 232 compounds, with a Mean CHA Score of 30.890 and 29.071, respectively. Also, 1046720863 and 28721359 ‐ in the Mean CHA Score Ranking on place 5 and 10 – achieved a Mean Ranking of 20.7 and 21.1 after the new Mean Ranking calculation (place 11 and 12 out of 232) and should therefore also be considered for further investigations. The best overall compound in Table 3 is 947305629, followed by 1297875291. Especially the outcome of compound 234051742 (Mean CHA Ranking place 2) gave an interesting insight into the overall performance of this molecule. Even though it obtained the highest and in one the second highest CHA Score for five out of 10 protein‐systems, it performed relatively weak for the QHD43421_0‐ and QHD43415_15‐system (rank 74 and 53).
Table 3.
Top 10 Ranked Molecules by the Common Hits Approach according to the Mean Ranking.[a]
|
|
Protein‐ System |
Hit[b] |
Mean Ranking[c] |
QHD 43421 _0[d] |
QHD 43415 _5[d] |
QHD 43415 _7[d] |
QHD 43415 _9[d] |
QHD 43415 _10[d] |
QHD 43415 _11[d] |
QHD 43415 _12[d] |
QHD 43415 _13[d] |
QHD 43415 _14[d] |
QHD 43415 _15[d] |
|---|---|---|---|---|---|---|---|---|---|---|---|---|---|
|
1 |
947305629 |
10 |
8.7 |
22 |
7 |
6 |
4 |
4 |
6 |
9 |
6 |
2 |
21 |
|
2 |
1297875291 |
10 |
9.5 |
7 |
9 |
22 |
8 |
14 |
1 |
1 |
5 |
23 |
5 |
|
3 |
27889059 |
10 |
13.1 |
66 |
1 |
12 |
3 |
2 |
8 |
19 |
4 |
3 |
13 |
|
4 |
298908912 |
10 |
14.0 |
1 |
16 |
9 |
20 |
36 |
10 |
5 |
18 |
19 |
6 |
|
5 |
2472594070 |
10 |
15.1 |
3 |
25 |
11 |
13 |
6 |
19 |
45 |
19 |
8 |
2 |
|
6 |
234051742 |
10 |
17.2 |
74 |
5 |
14 |
1 |
1 |
2 |
20 |
1 |
1 |
53 |
|
7 |
2147483647 |
10 |
17.3 |
2 |
19 |
2 |
11 |
3 |
40 |
54 |
13 |
26 |
3 |
|
8 |
1062747692 |
10 |
19.5 |
10 |
18 |
5 |
16 |
8 |
52 |
34 |
27 |
5 |
20 |
|
9 |
262518317 |
10 |
19.7 |
18 |
15 |
31 |
17 |
23 |
17 |
15 |
8 |
28 |
25 |
|
10 |
61442343 |
10 |
19.8 |
83 |
3 |
19 |
2 |
9 |
11 |
38 |
3 |
4 |
26 |
[a]The best performing molecules according to the Mean Ranking. The three best ranks for one protein‐system are coloured red. [b]The number of protein‐systems for which the corresponding molecule was retrieved given here. All 10 best ranked molecules of this table got retrieved for all 10 protein‐systems. [c]The Mean CHA Ranking was calculated as the sum of the individual ranks of one protein‐system divided by the count. [d]The individual ranks for every protein‐system. The ranking of all molecules for one protein‐system was carried out according their CHA Score (from one upwards, ranking the molecule with the highest CHA Score for the given system as the first one).
All 10 top ranked compounds of the third calculation (Mean Standardized Ranking) were either already contained in the other two rankings (Mean CHA Score and Mean Ranking) or listed in at least one of them (Table 4, Figure 4a, 4b, and 4c). Also, the compounds with the best outcome (234051742, 947305629, 27889059, and 1297875291) have shown likewise performances utilizing the other two ranking methods.
Table 4.
Top 10 Ranked Molecules by the Common Hits Approach according to the Mean Standardized Ranking.[a]
|
|
Protein‐ System |
Hit[b] |
Mean Strd Ranking[c] |
QHD 43421 _0[d] |
QHD 43415 _5[d] |
QHD 43415 _7[d] |
QHD 43415 _9[d] |
QHD 43415 _10[d] |
QHD 43415 _11[d] |
QHD 43415 _12[d] |
QHD 43415 _13[d] |
QHD 43415 _14[d] |
QHD 43415 _15[d] |
|---|---|---|---|---|---|---|---|---|---|---|---|---|---|
|
1 |
234051742 |
10 |
0.559 |
0.825 |
0.876 |
1.000 |
1.000 |
0.899 |
0.604 |
1.000 |
1.000 |
0.418 |
0.818 |
|
2 |
947305629 |
10 |
0.729 |
0.801 |
0.965 |
0.892 |
0.899 |
0.495 |
0.813 |
0.613 |
0.985 |
0.561 |
0.775 |
|
3 |
27889059 |
10 |
0.586 |
1.000 |
0.923 |
0.904 |
0.937 |
0.405 |
0.615 |
0.810 |
0.760 |
0.617 |
0.756 |
|
4 |
1297875291 |
10 |
0.882 |
0.718 |
0.796 |
0.856 |
0.692 |
1.000 |
1.000 |
0.620 |
0.113 |
0.696 |
0.737 |
|
5 |
61442343 |
10 |
0.528 |
0.882 |
0.835 |
0.915 |
0.772 |
0.317 |
0.459 |
0.845 |
0.655 |
0.526 |
0.673 |
|
6 |
1046720863 |
10 |
0.717 |
0.587 |
0.860 |
0.866 |
0.713 |
0.539 |
0.921 |
0.972 |
0.108 |
0.318 |
0.660 |
|
7 |
2472594070 |
10 |
0.970 |
0.495 |
0.927 |
0.800 |
0.792 |
0.125 |
0.424 |
0.413 |
0.325 |
0.890 |
0.616 |
|
8 |
2147483647 |
10 |
0.997 |
0.578 |
0.994 |
0.831 |
0.913 |
0.098 |
0.361 |
0.481 |
0.110 |
0.797 |
0.616 |
|
9 |
298908912 |
10 |
1.000 |
0.594 |
0.940 |
0.544 |
0.364 |
0.376 |
0.879 |
0.444 |
0.215 |
0.679 |
0.603 |
|
10 |
1062747692 |
10 |
0.802 |
0.577 |
0.966 |
0.742 |
0.782 |
0.034 |
0.491 |
0.372 |
0.537 |
0.576 |
0.588 |
[a] The best performing molecules according to the Mean Standardized Ranking. The best rank for every protein‐system is coloured red. [b] The number of protein‐systems for which the corresponding molecule was retrieved is given here. All 10 of the best ranked molecules in this table got retrieved for at least 9 protein‐systems. [c] The Mean CHA Ranking (higher is better) was calculated as the sum of the individual Standardized Ranks of one protein‐system divided by the count. [d] The individual Standardized Ranks for every protein‐system. The ranking of all molecules for every protein‐system was carried out according to their CHA Score. Hereby, every CHA Score was divided by the maximum CHA Score obtained for the protein‐system. Additionally, all compounds, which weren′t retrieved as a hit for that protein‐system were assigned the lowest possible CHA Score (0.000).
Interestingly, molecules 947305629 and 234051742 were present in the list of the top ranked 10 molecules delivered by both approaches (DCA and CHA).
4. Conclusion
In this study we investigated 10 possible druggable targets of the novel coronavirus SARS‐CoV‐2 to identify potential new inhibitors. For this, we followed two different approaches: the novel Docking Consensus Approach and the already established Common Hits Approach.19 Considering both methods, we identified 10 compounds with high potential to be a starting point for the development of a future coronavirus‐inhibitor drug (see Figure 4).
Authors Contributions
The manuscript was written through contributions of all authors. All authors have given approval to the final version of the manuscript.
Conflict of Interest
None declared.
Supporting information
As a service to our authors and readers, this journal provides supporting information supplied by the authors. Such materials are peer reviewed and may be re‐organized for online delivery, but are not copy‐edited or typeset. Technical support issues arising from supporting information (other than missing files) should be addressed to the authors.
Supplementary
Acknowledgements
The authors thank the University of Vienna for financial support.
V. Battisti, O. Wieder, A. Garon, T. Seidel, E. Urban, T. Langer, Mol. Inf. 2020, 39, 2000090.
References
- 1. Gorbalenya A. E., Baker S. C., Baric R. S., de Groot R. J., Drosten C., Gulyaeva A. A., Haagmans B. L., Lauber C., Leontovich A. M., Neuman B. W., et al., Nat. Microbiol. 2020, 5, 536–544. [DOI] [PMC free article] [PubMed] [Google Scholar]
- 2.“WHO Director-General's opening remarks at the media briefing on COVID-19 – 11 March 2020,” can be found under https://www.who.int/dg/speeches/detail/who-director-general-s-opening-remarks-at-the-media-briefing-on-covid-19–11-march-2020, 2020.
- 3.“WHO|World now at the start of 2009 influenza pandemic,” can be found under https://www.who.int/mediacentre/news/statements/2009/h1n1_pandemic_phase6_20090611/en/, 2009.
- 4. Zhu N., Zhang D., Wang W., Li X., Yang B., Song J., Zhao X., Huang B., Shi W., Lu R., et al., N. Engl. J. Med. 2020, 382, 727–733. [DOI] [PMC free article] [PubMed] [Google Scholar]
- 5.“Coronavirus disease (COVID-19) Situation Dashboard,” can be found under https://experience.arcgis.com/experience/685d0ace521648f8a5beeeee1b9125cd, 2020.
- 6. Wu J. T., Leung K., Leung K., Bushman M., Kishore N., Niehus R., D Salazar P. M., Cowling B. J., Lipsitch M., Leung G. M., Nat. Med. 2020, DOI 10.1038/s41591-020-0822–7. [DOI] [PMC free article] [PubMed] [Google Scholar]
- 7. Wilson N., Kvalsvig A., Barnard L. T., Baker M. G., Emerging Infect. Dis. 2020, 26, DOI 10.3201/eid2606.200320. [DOI] [PMC free article] [PubMed] [Google Scholar]
- 8. Lazzerini M., Putoto G., Lancet Glob. Heal. 2020, DOI 10.1016/S2214-109X(20)30110-8. [DOI] [PMC free article] [PubMed] [Google Scholar]
- 9. Liu C., Zhou Q., Li Y., Garner L. V., Watkins S. P., Carter L. J., Smoot J., Gregg A. C., Daniels A. D., Jervey S., et al., ACS Cent. Sci. 2020, 6, 315–331. [DOI] [PMC free article] [PubMed] [Google Scholar]
- 10. Baldwin R., Weder B., Mauro D., Economics in the Time of COVID-19, CEPR Press, London, 2020. [Google Scholar]
- 11.“Coronavirus disease (COVID-2019) situation reports,” can be found under https://www.who.int/emergencies/diseases/novel-coronavirus-2019/situation-reports, 2020.
- 12. Amanat F., Krammer F., CellPress 2020, DOI 10.1016/j.immuni.2020.03.007. [Google Scholar]
- 13. Colson P., Rolain J.-M., Raoult D., Nat. Rev. Drug Discovery 2012, 11, 505–506.22743966 [Google Scholar]
- 14. Novac N., Trends Pharmacol. Sci. 2013, 34, 267–272. [DOI] [PubMed] [Google Scholar]
- 15. Tobinick E. L., Drug News Perspect. 2009, 22, 119. [DOI] [PubMed] [Google Scholar]
- 16.“Coronavirus (COVID-19) Update: FDA Continues to Facilitate Development of Treatments|FDA,” can be found under https://www.fda.gov/news-events/press-announcements/coronavirus-covid-19-update-fda-continues-facilitate-development-treatments, 2020.
- 17. Espinoza-Fonseca L. M., Bioorg. Med. Chem. 2005, 14, 896–897. [DOI] [PubMed] [Google Scholar]
- 18. Ledford H., Nature 2009, DOI 10.1038/news.2009.353. [Google Scholar]
- 19. Wieder M., Garon A., Perricone U., Boresch S., Seidel T., Almerico A. M., Langer T., J. Chem. Inf. Model. 2017, 57, 365–385. [DOI] [PubMed] [Google Scholar]
- 20. Laggner C., Wolber G., Kirchmair J., Schuster D., Langer T., in Chemoinformatics Approaches to Virtual Screen. (Eds.: A. Tropsha, A. Varnek), Royal Society Of Chemistry, Cambridge, 2009, pp. 76–119. [Google Scholar]
- 21. Jin Z., Du X., Xu Y., Deng Y., Liu M., Zhao Y., Zhang B., Li X., Zhang L., Peng C., et al., Nature 2020, DOI https://doi.org/10.1038/s41586-020-2223-y. [Google Scholar]
- 22. Wolber G., Langer T., J. Chem. Inf. Model. 2005, 45, 160–169. [DOI] [PubMed] [Google Scholar]
- 23. Liu K., Watanabe E., Kokubo H., J. Comput.-Aided Mol. Des. 2017, 31, 201–211. [DOI] [PubMed] [Google Scholar]
- 24. Sakano T., Mahamood M. I., Yamashita T., Fujitani H., Biophys. Physicobiology 2016, 13, 181–194. [DOI] [PMC free article] [PubMed] [Google Scholar]
- 25. Tubiana T., Carvaillo J. C., Boulard Y., Bressanelli S., J. Chem. Inf. Model. 2018, 58, 2178–2182. [DOI] [PubMed] [Google Scholar]
- 26. Wieder M., Perricone U., Boresch S., Seidel T., Langer T., Biochem. Biophys. Res. Commun. 2016, 470, 685–689. [DOI] [PubMed] [Google Scholar]
- 27. Zhang C., Zheng W., Huang X., Bell E. W., Zhou X., Zhang Y., J. Proteome Res. 2020, DOI 10.1021/acs.jproteome.0c00129. [DOI] [PMC free article] [PubMed] [Google Scholar]
- 28. Berman H. M., Westbrook J., Feng Z., Gilliland G., Bhat T. N., Weissig H., Shindyalov I. N., Bourne P. E., Nucleic Acids Res. 2000, 28, 235–242. [DOI] [PMC free article] [PubMed] [Google Scholar]
- 29.NCBI Resource Coordinators, Nucleic Acids Res 2018, 46, D8–D13. [DOI] [PMC free article] [PubMed]
- 30.“Scopus Elsevier,” can be found under https://www.elsevier.com/solutions/scopus, 2020.
- 31.“Scifinder; Chemical Abstracts Service,” can be found under https://scifinder.cas.org, 2020.
- 32.“ChemRxiv: the Preprint Server for Chemistry,” can be found under https://chemrxiv.org/, 2020.
- 33.Schrödinger Release 2019-3: Maestro, Schrödinger, LLC, New York, NY, 2019.
- 34. Jo S., Kim T., Iyer V. G., Im W., J. Comput. Chem. 2008, 29, 1859–1865. [DOI] [PubMed] [Google Scholar]
- 35.D. A. Case, R. M. Betz, D. S. Cerutti, T. E. Cheatham, III, T. A. Darden, R. E. Duke, T. J. Giese, H. Gohlke, A. W. Goetz, N. Homeyer, et al., AMBER 2016, University of California, San Francisco, 2016.
- 36. Wang J., Wolf R. M., Caldwell J. W., Kollman P. A., Case D. A., J. Comput. Chem. 2004, 25, 1157–1174. [DOI] [PubMed] [Google Scholar]
- 37. Ryckaert J., Ryckaert J., Ciccotti G., Berendsen H. J. C., J. Comput. Phys. 1977, 341. [Google Scholar]
- 38.“Aldrich Market Select,” can be found under https://www.aldrichmarketselect.com/, 2020.
- 39. Trott O., Olson A. J., J. Comput. Chem. 2010, 31, 455–461. [DOI] [PMC free article] [PubMed] [Google Scholar]
- 40. Berthold M. R., Cebron N., Dill F., Gabriel T. R., Kötter T., Meinl T., Ohl P., Sieb C., Thiel K., Wiswedel B., in Data Anal. Mach. Learn. Appl. (Eds.: C. Preisach, H. Burkhardt, L. Schmidt-Thieme, R. Decke), Springer, New York, 2008. [Google Scholar]
Associated Data
This section collects any data citations, data availability statements, or supplementary materials included in this article.
Supplementary Materials
As a service to our authors and readers, this journal provides supporting information supplied by the authors. Such materials are peer reviewed and may be re‐organized for online delivery, but are not copy‐edited or typeset. Technical support issues arising from supporting information (other than missing files) should be addressed to the authors.
Supplementary