

Summary
This individual participant data meta‐analysis assessed the effectiveness of workplace health promotion programmes on body mass index (BMI) across socio‐economic groups and whether study and intervention characteristics explained inequalities in effectiveness. Studies were eligible if they assessed the effect of a workplace health promotion programme on BMI in the Netherlands, included workers of at least two different socio‐economic positions (SEPs) and had a study design with premeasurement and postmeasurement and control condition. Data of 13 studies presenting 16 interventions (5183 participants) were harmonized. In a two‐stage meta‐analysis, the interaction between intervention and SEP on BMI was tested with linear mixed models for each study. Subsequently, the interaction terms were pooled. The influence of study and intervention characteristics on the effectiveness of workplace health promotion programmes was evaluated using meta‐regression analyses. Compared with control conditions, workplace health promotion programmes overall showed a statistically non‐significant 0.12 kg/m2 (95% CI: −0.01, 0.25) decrease in BMI, which did not differ across SEP. Interventions evaluated within randomized controlled trials, agentic interventions, those that focused on high‐risk groups, included a counselling component, consisted of more than five sessions, or were offered at the individual level did statistically significantly reduce BMI. No evidence was found for intervention‐generated SEP inequalities.
Keywords: inequity, obesity, socio‐economic inequalities, workplace
Abbreviations
- BMI
body mass index
- IPD
individual participant data
- RCT
randomized controlled trial
- SEP
socio‐economic position
1. INTRODUCTION
Large socio‐economic inequalities in obesity exist among adults in Western countries. 1 This can partly be explained by a more unhealthy diet and lower physical activity levels among low socio‐economic groups than among higher socio‐economic groups. 2 , 3 In the past decades, numerous health promotion programmes have been developed to improve these health behaviours and to prevent obesity. However, there are concerns that health promotion programmes might increase, rather than reduce, inequalities due to a higher reach and/or effectiveness among individuals with a high socio‐economic position (SEP) compared with those with a low SEP. 4
Only limited information is available about the differential effectiveness of public health interventions across socio‐economic groups. 5 , 6 In several reviews, the majority of the included studies did not find differential effects of public health interventions targeting health behaviour across socio‐economic groups. 5 , 6 , 7 , 8 , 9 , 10 According to a framework for the likely impact of obesity prevention strategies on socio‐economic inequalities in body weight, interventions can be categorized based on the degree to which an intervention involves the capacity of individuals to make independent, purposive choices (i.e., individual agency). 11 This framework distinguishes agentic interventions (high individual agency), agento‐structural interventions (some individual agency) and structural interventions (no individual agency). It is hypothesized that higher socio‐economic groups will benefit more from interventions with a higher level of individual agency. 11 Indeed, some studies showed that agentic interventions, such as health education or counselling programmes or mass media campaigns, could widen socio‐economic inequalities in health behaviour or health. 5 , 6 , 9 , 11 This is in contrast with structural interventions, such as removing unhealthy food options or fiscal interventions, which facilitate healthier choices and may contribute to reducing inequalities. 6 , 9 , 11 Agento‐structural interventions do consider the environment, but individual agency is still important, for example, in interventions providing healthier food options in canteens. 11
Health promotion activities can be implemented in different settings. The workplace has been identified as a promising setting for health promotion due to the substantial time adults spent at work and the ability to reach large groups of participants in a natural social network. A recent review has shown positive, but small, effects of workplace health promotion programmes on body mass index (BMI). 12 Because workplace health promotion programmes can vary in the degree of agentic involvement, ranging from entirely agentic (such as health education or counselling programmes) to structural interventions (such as removal of vending machines containing unhealthy food and drink options), understanding the equity impact is highly relevant. However, information on intervention‐generated inequalities for workplace health promotion programmes is scarce. Overall, the majority of studies included in previous reviews on workplace health promotion programmes did not find differential effectiveness across socio‐economic groups. 8 , 13 , 14 , 15 Yet most reviews compared workplace health promotion programmes provided to the general working population with those targeted to blue collar workers or workers with a lower SEP only. 13 , 14 Equity‐specific subgroup analysis within specific interventions can contribute to understanding the differential effectiveness of interventions, which is possible in an individual participant data (IPD) meta‐analysis. An IPD meta‐analysis furthermore provides the opportunity to investigate which type of studies and interventions could contribute to reducing socio‐economic inequalities in BMI. As described above, it is hypothesized that agentic interventions will increase socio‐economic inequalities in BMI.
The current IPD meta‐analysis enables analyses that go beyond those that have been performed in the original studies and conventional meta‐analyses. The current study contributes to the existing literature in two ways. First, more in‐depth insight into the differential effects within and across workplace health promotion programmes can be assessed with equity‐specific subgroup analyses. Second, the influence of study design and intervention characteristics on these differential effects can be studied, which contributes to the understanding of the influence of specific study and intervention components on the effectiveness of workplace health promotion programmes. This IPD meta‐analysis will be performed in the Dutch context, which enables to study the effectiveness of the interventions in heterogeneous populations in a rather homogeneous occupational health and social security context. The study aims to investigate the differential effects of workplace health promotion programmes on BMI between socio‐economic groups and the extent to which study and intervention characteristics explain possible differences in effectiveness across groups.
2. METHODS
2.1. Search strategy and selection of studies
This IPD meta‐analysis was performed according to the earlier published protocol, 16 which was also registered with PROSPERO (CRD42018099878). The PRISMA‐IPD guidelines were used for reporting our findings. As described in detail in the protocol paper, a systematic search was performed to identify relevant studies aimed at promoting healthy behaviour or preventing obesity among workers. The current paper evaluates differential effectiveness of workplace health promotion programmes on BMI. Another paper, using the same generic data set, evaluates differential effectiveness on health behaviours. The search was restricted to Dutch published and unpublished studies, ensuring that all participants are part of the same occupational health and social security system. Search terms included health behaviour, obesity, intervention, evaluation and worker/worksite. The full search strategy can be found in Supplementary file A. The search for published studies was performed in February 2018 in the following electronic databases: Embase, Medline Ovid, Web of Science, Cochrane Central and Google Scholar. In addition, reference lists of relevant systematic reviews were screened. The search for unpublished studies was conducted through screening of trial registers, databases of major Dutch funding agencies, a Dutch database for lifestyle interventions and consultation of experts.
Inclusion criteria for this specific paper were (i) an intervention study aimed at promoting healthy behaviour or preventing obesity, (ii) targeted at workers, (iii) performed in the Netherlands, (iv) from a study design with a reference group and at least one premeasurement and postmeasurement of BMI and (v) having an indicator for SEP (i.e., educational level, job title or income). Interventions on workers from a clinical sample were excluded, as well as interventions with participants from a single socio‐economic group. No restrictions were made concerning the reference group. Two authors (S.R. and P.C.) screened titles, abstracts and if required full texts of all references for eligibility. A third author (K.O.H.) was consulted in case of disagreement.
For each eligible study, the corresponding author was contacted with a request to sign a data sharing agreement and to share their anonymized IPD. The Medical Ethical Committee of Erasmus MC Rotterdam declared that the Medical Research Involving Human Subjects Act does not apply to the current IPD meta‐analysis (MEC‐2018‐1143).
2.2. Data extraction
For each included study, data on study design and intervention characteristics were extracted by one author (S.R., K.O.H. or P.C.) and verified by another author (S.R., K.O.H. or P.C.). Study characteristics included the study design, categorized into randomized controlled trial (RCT), cluster RCT, and CT. Intervention characteristics included the study sample, intervention components, type of intervention delivery, number of sessions and the level of the intervention. For the study sample, a distinction was made between interventions provided to all employees (universal prevention) or interventions targeted to individuals with a high risk, such as individuals with a high BMI or with unhealthy behaviours (selected/indicated prevention). In accordance with the framework for the likely impact of obesity prevention strategies on socio‐economic inequalities in population weight, agentic, agento‐structural and structural interventions were distinguished. Concerning the intervention components, a distinction was made between interventions with or without a counselling component and between interventions with or without an environmental intervention component. The type of delivery was categorized as including a face‐to‐face component versus other (e.g., e/m‐health or environmental changes). The number of sessions was dichotomized into studies with more than five sessions and those with five or less sessions. In addition, interventions focused on the individual level were distinguished from those at group level.
2.3. Methodological quality
Methodological quality was also assessed by one author (S.R., K.O.H. or P.C.) and verified by another author (S.R., K.O.H. or P.C.). As previously used in another systematic review, 17 a combination of a checklist based on the guidelines of the Cochrane Collaboration's tool for assessing risk of bias and the checklist applied by Verweij et al. was used. 18 This consisted of nine criteria regarding randomization, blinding of participants, similarity of groups, compliance, loss to follow‐up, intention‐to‐treat, adjustment for confounders, data collection methods and follow‐up duration. 17 On each item, a study could score positive if the quality criterion was met (1 point), negative if the criterion was not met (0 points) or unclear if the publication and/or an additional information request by authors provided insufficient information to make a judgment (0 points). Summary scores were categorised as poor (0–2 points), fair (3–4 points), good (5–7 points) or excellent (8–9 points). Both the data extraction form and methodological quality scale were sent to the corresponding author of the original study for verification.
2.4. Harmonization
Data from all studies were harmonized. If a study contained more than one intervention arms, these arms were all considered as separate interventions. In case of more than one control arms, these arms were combined into one control group. All information from the included studies, both the harmonized IPD and the data extracted from the original articles, were merged into a single dataset.
2.5. Body mass index
A continuous measure of BMI (kg/m2), obtained from self‐reports or objective measures, was used from pre‐intervention and post‐intervention measurements. The measurements could be assessed directly after the intervention (immediate effects) or after a longer follow‐up period (sustained effects). The timing of these measurements differed between studies.
2.6. Socio‐economic position
Most interventions included education as indicator of SEP, which was divided into low (pre‐primary, primary and lower secondary education), intermediate (upper secondary education) and high (post‐secondary education), based on the 1997 International Standard Classification of Education (ISCED‐97). In one study, where information on educational level was lacking, occupational class was used to define SEP.19 Here, among workers from a construction company, the construction workers were categorised as low SEP and the office workers as intermediate SEP.
2.7. Covariates
As in the original studies, age was used as a continuous variable and gender was dichotomized into male and female.
2.8. Statistical analysis
A two‐stage meta‐analysis approach was performed. In the first stage, IPD data of each study were analysed separately using multilevel linear mixed models. In the second stage, the results per study were pooled in a meta‐analysis. In the first stage, a random intercept for participant was used, and, for studies with a clustered design, a random intercept for cluster was added to take into account the clustering of participants. Overall effects and interaction effects with SEP (intervention * SEP) were analysed, and all models were stratified by SEP. In case a SEP group in an included study consisted of less than 10 participants, no subgroup analysis or interaction analysis was performed for that specific SEP group in that particular study. For the two studies without any workers with a high SEP, 19 , 20 the effects among workers with a low SEP were compared with workers with an intermediate SEP. As no statistically significant intervention * time interaction effects were found, both immediate and sustained effects were added jointly in the mixed model. All models were adjusted for baseline BMI, age and gender.
Meta‐regression analyses were performed to assess the univariable influence of the study and intervention characteristics on the effectiveness and differential effectiveness of workplace health promotion programmes, as well as on the effectiveness stratified by socio‐economic group.
Statistical analyses were conducted using Stata (version 14, mixed command for the linear mixed model, admetan command for the meta‐analyses and metareg command for the meta‐regression). Review Manager (version 5.3.5) was used to draw forest plots, depicting individual study effect sizes. The level of statistical significance was set at p < 0.05.
3. RESULTS
In total, 34 studies with 88 articles out of the 1415 screened articles were considered eligible for the current study of which 21 studies were excluded due to the unavailability of the data (n = 11), the absence of information on BMI as outcome (n = 7), lacking information on SEP (n = 1), no response from the corresponding author or other involved researchers (n = 1) or not considering workers from multiple socio‐economic groups (n = 1). Supplementary file B presents the references of these excluded studies. Data of 5183 participants from 13 studies were analysed in the current IPD meta‐analyses (Figure 1). Two studies evaluated more than one intervention arm, 21 , 22 which resulted in a total of 16 interventions.
FIGURE 1.
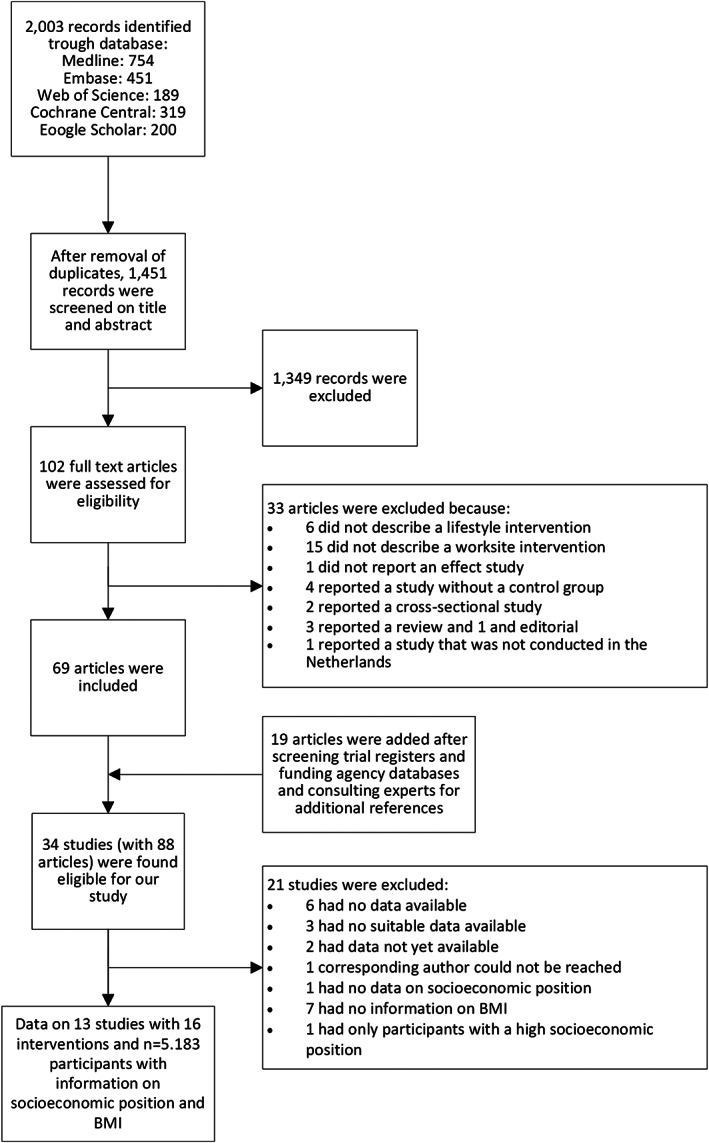
Flow chart of study inclusion process
The methodological quality of all studies, except one, 23 was judged ‘good’ or ‘excellent’ (Table 1). Six studies concerned an RCT, 19 , 20 , 22 , 24 , 25 , 26 four a cluster RCT with, for example, the occupational physician or department as cluster, 21 , 27 , 28 , 29 and three interventions were evaluated in a CTs. 23 , 30 , 31 Most interventions (n = 11) were agentic interventions, five had a combination of agentic and agento‐structural intervention elements, and there were no structural interventions. Twelve interventions included a counselling component, 19 , 20 , 21 , 22 , 23 , 24 , 26 , 27 , 28 , 29 whereas six interventions included (also) a change in the work environment (such as free or healthy food options at work, or signs to promote stair use) 21 , 30 , 31 (Table 1). Ten interventions consisted of universal prevention strategies, 20 , 21 , 23 , 24 , 26 , 28 , 30 , 31 whereas six interventions were offered to high‐risk workers, that is, workers with an unhealthy behaviour, high BMI or high cardiovascular risk. 19 , 22 , 25 , 27 , 29 There was overlap between study and intervention characteristics: interventions focused on a high‐risk group were all individual‐level interventions, while this was the case for only three out of the 10 universal interventions. Moreover, interventions focused on a high‐risk group more often had more than five sessions compared with universal prevention strategies.
TABLE 1.
Main characteristics of studies included in this individual participant data (IPD) meta‐analysis
| First author, year | Design a | Study population characteristics | Intervention characteristics | Control condition | Overall effect | Methodological quality | |||||||||
|---|---|---|---|---|---|---|---|---|---|---|---|---|---|---|---|
| n b | Socio‐economic position (%) | Intervention type c | Indicated prevention | Counselling component | Environmental component | Individual level | >5 sessions | Face‐to‐face contact | |||||||
| Low | Intermediate | High | Β (SE) | Sum score | |||||||||||
| van Berkel, 2014 24 | RCT | 222 | 2 | 17 | 81 | A‐S | ‐ d | X d | X | ‐ | X | X | Generic information | 0.00 (0.12) | 8 (excellent) |
| Coffeng, 2014 21 | cRCT | 310 | 2 | 42 | 56 |
Arm 1: ‐ Arm 2: A‐S Arm 3: A‐S |
Arm 1: ‐ Arm 2: ‐ Arm 3: ‐ |
Arm 1: X Arm 2: ‐ Arm 3: X |
Arm 1: ‐ Arm 2: X Arm 3: X |
Arm 1: ‐ Arm 2: ‐ Arm 3: ‐ |
Arm 1: ‐ Arm 2: ‐ Arm 3: ‐ |
Arm 1: X Arm 2: ‐ Arm 3: X |
No intervention |
Arm 1: −0.05 (0.14) Arm 2: 0.15 (0.14) Arm 3: −0.01 (0.15) |
7 (good) |
| Engbers, 2007 30 | CT | 446 | 3 | 30 | 67 | A | ‐ | ‐ | X | ‐ | ‐ | ‐ | No intervention | 0.12 (0.11) | 6 (good) |
| Groeneveld, 2010 19 | RCT | 713 | 76 | 24 | 0 | A | X | X | ‐ | X | X | X | Generic information | −0.52 (0.09) | 8 (excellent) |
| Houkes, 2011 23 | CT | 126 | 10 | 62 | 27 | A | ‐ | X | ‐ | X | ‐ | X | No intervention | −0.41 (0.25) | 4 (fair) |
| Kouwenhoven‐Pasmooij, 2018 29 | cRCT | 110 | 15 | 57 | 28 | A | X | X | ‐ | X | X | X | Generic information and personalized letter with feedback | −0.83 (0.48) | 7 (good) |
| Robroek, 2012 28 | cRCT | 661 | 22 | 33 | 45 | A | ‐ | X | ‐ | X | X | ‐ | Standard lifestyle intervention programme | 0.03 (0.06) | 6 (good) |
| Slootmaker, 2009 25 | RCT | 87 | 2 | 33 | 65 | A | X | ‐ | ‐ | X | ‐ | ‐ | Generic information | −0.08 (0.18) | 8 (excellent) |
| Strijk, 2012 26 | RCT | 606 | 10 | 29 | 61 | A‐S | ‐ | X | X | ‐ | ‐ | X | No intervention | 0.03 (0.09) | 7 (good) |
| Verweij, 2013 27 | cRCT | 460 | 12 | 35 | 53 | A | X | X | ‐ | X | ‐ | X | Health appraisal and advice | 0.05 (0.10) | 9 (excellent) |
| Viester, 2018 20 | RCT | 278 | 67 | 32 | 1 | A | ‐ | X | ‐ | X | X | X | Usual care | −0.24 (0.12) | 8 (excellent) |
| van Wier, 2011 22 | RCT | 970 | 5 | 35 | 60 | A |
Arm 1: X Arm 2: X |
Arm 1: X Arm 2: X |
‐ |
Arm 1: X Arm 2: X |
Arm 1: X Arm 2: X |
Arm 1: ‐ Arm 2: ‐ |
Generic information |
Arm 1: −0.50 (0.10) Arm 2: −0.37 (0.09) |
6 (good) |
| Wierenga, 2014 31 | CT | 194 | 3 | 17 | 80 | A‐S | ‐ | ‐ | X | ‐ | ‐ | ‐ | Usual care | 0.20 (0.17) | 5 (good) |
| Total | 5183 | 21 | 31 | 48 | 6 | 12 | 4 | 9 | 7 | 9 | |||||
RCT, randomized controlled trial; cRCT, cluster randomized controlled trial; CT, controlled trial.
n concerns the number of participants with BMI information from baseline and follow‐up measurements.
A, agentic; A‐S, agento‐structural.
X, applicable; ‐, not applicable.
In seven studies, sufficient participants of all three socio‐economic groups were represented to estimate the effectiveness of the intervention stratified by SEP. 22 , 23 , 26 , 27 , 28 , 29 , 31 Four studies only had participants in an intermediate and high SEP, 21 , 24 , 25 , 31 and two studies only had participants from low and intermediate SEP (Table 1). 19 , 20 Almost half of the participants had a high SEP (48%), 31% an intermediate SEP and 21% a low SEP. The mean BMI at baseline was 26.75 kg/m2 (SD 4.09 kg m−2). Most participants were male (63%), and the mean age was 45.72 years (SD 9.46 years).
3.1. Overall effects
As shown in Table 2, a small and statistically non‐significant decrease in BMI was found of 0.12 kg/m2 (95% CI: −0.01, 0.25) for the intervention groups compared with the control groups. Four out of the 16 interventions were effective compared with the control condition (data not shown). 19 , 20 , 22
TABLE 2.
Overall intervention effects, intervention * socio‐economic position interaction and effects stratified by socio‐economic position of 16 workplace health promotion interventions in 5183 workers on BMI
| Studies | Participants | Effects on BMI (kg/m2) | |
|---|---|---|---|
| N | n | β (95% CI) | |
| Overall intervention effect | 16 | 5392a | −0.12 (−0.25, 0.01) |
| Intervention * socio‐economic position interaction | |||
| Low vs. intermediate socio‐economic position | 10 | 0.06 (−0.15, 0.27)b | |
| Low vs. high socio‐economic position | 10 | 0.06 (−0.14, 0.27) | |
| Intermediate vs. high socio‐economic position | 14 | 0.10 (−0.12, 0.32) | |
| Stratified by socio‐economic position | |||
| Low socio‐economic position | 10 | 1080 (21%) | −0.16 (−0.38, 0.07) |
| Intermediate socio‐economic position | 16 | 1615 (31%) | −0.12 (−0.29, 0.05) |
| High socio‐economic position | 14 | 2697 (48%) | −0.09 (−0.26, 0.08) |
Abbreviation: BMI, body mass index.
The number of unique participants is n = 5183. Because two studies have more than one intervention arm, the control condition is included multiple times in this analysis, increasing the participant number to 5392.
Interpretation: this interaction term is based on the studies including participants in low socio‐economic position and participants in intermediate socio‐economic position. Compared with participants with an intermediate socio‐economic position, participants in low socio‐economic position had a non‐significant 0.06 lower reduction in BMI after the intervention relative to the control conditions.
3.2. Differential effects and effects within socio‐economic groups
No differential intervention effects were found for participants in the low socio‐economic group compared with those in the intermediate or the high socio‐economic group (low vs. intermediate: β 0.06, 95% CI: −0.15, 0.27; low vs. high: β 0.06, 95% CI: −0.14, 0.27; Table 2). Also, comparing the intermediate socio‐economic group with the high socio‐economic group, no overall interaction effect was found (β 0.10; 95% CI: −0.12, 0.32). Three out of 14 interventions had a differential effect in favour of those with a high SEP compared with those with an intermediate SEP, 21 , 22 and one study had a differential effect in favour of those with an intermediate SEP compared with a high SEP. 25
Larger reductions in BMI were found for those in low SEP (β −0.16, 95% CI: −0.38, 0.07) compared with participants in intermediate (β −0.12, 95% CI: −0.29, 0.05) or high SEP (β −0.09, 95% CI: −0.26, 0.08; Table 2). As shown in Figure 2, in the low socio‐economic group, only one out of 10 interventions showed a statistically significant reduction in BMI. 19 In the intermediate 19 , 25 and high 22 socio‐economic group, two out of 16 and 14, respectively, interventions showed a statistically significant reduction in BMI.
FIGURE 2.
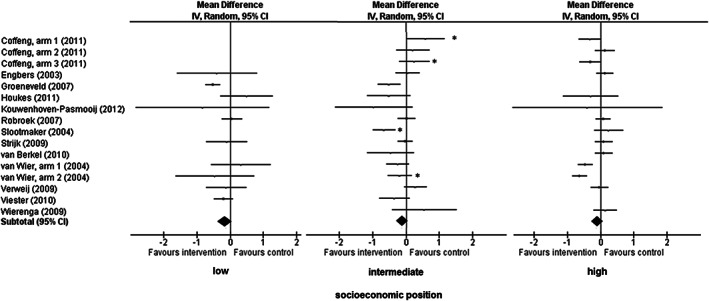
Individual study effects of workplace health promotion programmes on body mass index (BMI), stratified by socio‐economic position (SEP). *intervention * socio‐economic position interaction effects (p<0.05) for those with intermediate socio‐economic position compared with high socio‐economic position
3.3. Associations of study and intervention characteristics with the effectiveness
Interventions evaluated in an RCT overall showed a statistically significant reduction in BMI (β −0.25, 95% CI: −0.43, −0.07), which was not the case for cluster RCTs (β 0.03, 95% CI: −0.25, 0.32) and CTs (β 0.03, 95% CI: −0.25, 0.32) (Table 3). The association between study design and intervention effectiveness did not differ across socio‐economic groups. Overall, the effectiveness of interventions in which BMI was measured through self‐report did not differ from those interventions in which BMI was measured objectively. Although not statistically significant, studies with a subjective measure of BMI were more effective among workers of low or intermediate SEP than studies with objective BMI measurements. In contrast, among workers with a high SEP, interventions with an objective measure of BMI were more effective than subjectively measured BMI. An interaction between measurement type and intervention was only found between workers in the intermediate and high SEP group but not between the workers with a low SEP and workers with an intermediate or high SEP.
TABLE 3.
Influence of study and intervention characteristics on the effectiveness of workplace health promotion programmes on body mass index (BMI)
| Total group | Effects of interventions on BMI | |||||||
|---|---|---|---|---|---|---|---|---|
| Low SEP | Intermediate SEP | High SEP | ||||||
| N studies | β (95% CI) | N studies | β (95% CI) | N studies | β (95% CI) | N studies | β (95% CI) | |
| Design | ||||||||
| RCT | 7 | −0.25 (−0.43, −0.07) | 5 | −0.29 (−0.54, −0.04) | 7 | −0.33 (−0.53, −0.14) | 5 | −0.16 (−0.50, 0.19) |
| cRCT | 6 | 0.03 (−0.06, 0.12) | 3 | 0.00 (−0.26, 0.26) | 6 | 0.17 (−0.05, 0.39) | 6 | −0.07 (−0.24, 0.09) |
| CT | 3 | 0.03 (−0.25, 0.32) | 2 | 0.17 (−0.68, 1.02) | 3 | −0.04 (−0.51, 0.44) | 3 | 0.11 (−0.09, 0.31) |
| Between group difference (RCT vs. cRCT/CT) | −0.28 (−0.51, 0.05) | −0.33 (−0.78, 0.13) | −0.44 (−0.74, −0.14) | −0.13 (−0.50, 0.23) | ||||
| Measurement type | ||||||||
| Objective | 8 | −0.12 (−0.32, 0.08) | 4 | 0.10 (−0.30, 0.50) | 8 | 0.01 (−0.20, 0.21) | 8 | −0.21 (−0.45, 0.03) |
| Subjective | 8 | −0.12 (−0.30, 0.07) | 6 | −0.24 (−0.49, 0.01) | 8 | −0.25 (−0.53, 0.02) | 8 | 0.08 (−0.04, 0.20) |
| Between group difference | 0.00 (−0.28, 0.29) | −0.35 (−0.95, 0.26) | −0.27 (−0.66, 0.12) | 0.30 (−0.02, 0.63) | ||||
| Level of individual agency | ||||||||
| Agento‐structural intervention | 5 | 0.06 (−0.05, 0.17) | 1 | −0.10 (−0.71, 0.52) | 5 | 0.12 (−0.19, 0.43) | 5 | 0.04 (−0.11, 0.19) |
| Agentic intervention | 11 | −0.21 (−0.37, −0.04) | 9 | −0.16 (−0.40, 0.09) | 11 | −0.20 (−0.41, −0.00) | 9 | −0.17 (−0.41, 0.07) |
| Between group difference | 0.27 (0.01, 0.54) | 0.06 (−0.88, 1.00) | 0.33 (−0.10, 0.76) | 0.20 (−0.15, 0.56) | ||||
| High‐risk approach | ||||||||
| Indicated prevention | 6 | −0.32 (−0.54, −0.10) | 5 | −0.38 (−0.65, −0.10) | 6 | −0.32 (−0.62, −0.01) | 5 | −0.26 (−0.60, 0.07) |
| Universal prevention | 10 | 0.01 (−0.07, 0.09) | 5 | −0.06 (−0.24, 0.13) | 10 | 0.01 (−0.16, 0.18) | 9 | 0.01 (−0.10, 0.13) |
| Between group difference | −0.32 (−0.55, −0.10) | −0.34 (−0.75, 0.07) | −0.32 (−0.70, 0.06) | −0.29 (−0.62, 0.01) | ||||
| Type of interventions | ||||||||
| Counselling component | 12 | −0.19 (−0.34, −0.04) | 9 | −0.15 (−0.38, 0.09) | 12 | −0.12 (−0.30, 0.06) | 10 | −0.20 (−0.40, 0.01) |
| Noncounselling component | 4 | 0.11 (−0.02, 0.25) | 1 | −0.40 (−1.59, 0.80) | 4 | −0.05 (−0.56, 0.46) | 4 | 0.15 (−0.01, 0.31) |
| Between group difference | −0.29 (−0.59, 0.00) | 0.25 (−1.27, 1.77) | −0.04 (−0.53, 0.46) | −0.35 (−0.70, −0.00) | ||||
| Type of interventions | ||||||||
| Environmental component | 6 | 0.07 (−0.03, 0.17) | 2 | −0.16 (−0.71, 0.39) | 6 | 0.09 (−0.13, 0.44) | 6 | 0.06 (−0.07, 0.19) |
| Nonenvironmental component | 10 | −0.25 (−0.41, −0.08) | 8 | −0.14 (−0.41, 0.12) | 10 | −0.23 (−0.45, −0.01) | 8 | −0.22 (−0.47, 0.03) |
| Between group difference | 0.32 (0.08, 0.55) | −0.03 (−0.85, 0.80) | 0.34 (−0.05, 0.73) | 0.27 (−0.05, 0.60) | ||||
| Intervention delivery | ||||||||
| Face‐to‐face | 9 | −0.15 (−0.33, 0.02) | 6 | −0.23 (−0.50, 0.04) | 9 | −0.12 (−0.39, 0.14) | 7 | −0.08 (−0.23, 0.07) |
| Other | 7 | −0.07 (−0.29, 0.14) | 4 | 0.03 (−0.24, 0.29) | 7 | −0.12 (−0.36, 0.11) | 7 | −0.07 (−0.35, 0.21) |
| Between group difference | −0.08 (−0.36, 0.21) | −0.24 (−0.77, 0.29) | −0.01 (−0.43, 0.42) | −0.03 (−0.40, 0.35) | ||||
| Number of sessions | ||||||||
| >5 sessions | 6 | −0.30 (−0.54, −0.06) | 5 | −0.21 (−0.62, 0.21) | 6 | −0.27 (−0.49, −0.05) | 5 | −0.24 (−0.60, 0.11) |
| ≤5 sessions | 10 | 0.01 (−0.09, 0.10) | 5 | −0.12 (−0.35, 0.10) | 10 | −0.01 (−0.25, 0.23) | 9 | −0.00 (−0.13, 0.13) |
| Between group difference | −0.29 (−0.52, −0.05) | −0.14 (−0.70, 0.41) | −0.28 (−0.68, 0.11) | −0.24 (−0.59, 0.12) | ||||
| Level of provision | ||||||||
| Individual level | 9 | −0.27 (−0.45, −0.09) | 8 | −0.14 (−0.41, 0.12) | 9 | −0.28 (−0.51, −0.06) | 7 | −0.20 (−0.49, 0.09) |
| Group level | 7 | 0.06 (−0.03, 0.15) | 2 | −0.16 (−0.71, 0.39) | 7 | 0.10 (−0.09, 0.29) | 7 | 0.01 (−0.14, 0.15) |
| Between group difference | −0.32 (−0.55, −0.09) | 0.03 (−0.80, 0.85) | −0.40 (−0.75, −0.05) | −0.21 (−0.55, 0.14) | ||||
Note: Overall effects and stratified by socio‐economic position (SEP) are shown.
For intervention characteristics, agentic interventions, interventions targeted at high‐risk groups, interventions with a counselling component, without an environmental component, more than five sessions and interventions provided at the individual level had a statistically significant reduction in BMI, with betas ranging from −0.19 (95% CI: −0.34, −0.04) (for interventions with a counselling component) to −0.32 kg/m2 (95% CI: −0.54, −0.10) (for indicated prevention strategies; Table 3). The influence of these intervention characteristics on the effectiveness did not differ across socio‐economic groups.
4. DISCUSSION
No differential effects of workplace health promotion across SEP on BMI were found. In all socio‐economic groups, a small, but statistically non‐significant, decrease in BMI was found. This IPD meta‐analysis showed that interventions evaluated within an RCT, agentic interventions, intervention that focused on a high‐risk group, included a counselling component, consisted of more than five sessions, or offered at the individual level did reduce BMI. However, the reduction in BMI was 0.32 kg/m2 or lower.
4.1. No differential effectiveness of workplace health promotion programmes on BMI
Theoretically, public health interventions could generate socio‐economic health inequalities in different ways, for example, by differences in delivery, reach and compliance, or by having greater effects among individuals with a high compared with a low SEP.
Concerning the delivery, it is remarkable that most studies focused on intermediate and high educated workers (79% of the IPD sample). The interventions were either more often provided to workers in high SEP or these workers were more likely to participate in offered interventions. Only two studies targeted workers in the construction industry, 19 , 20 the majority of these participants had a low SEP. Offering effective interventions mainly to workers in high SEP would lead to intervention‐generated inequalities. In this IPD meta‐analysis, information on reach (initial participation) was lacking or not well defined in the individual studies. However, a systematic review investigating reach of workplace health promotion programmes did not find clear inequalities in reach across socio‐economic groups. 32
We hypothesized that workplace health promotion programmes would be less effective among workers in low SEP compared with workers in higher SEP. Following the framework for evaluating the impact of obesity prevention strategies on socio‐economic inequalities in body weight, this was in particular expected for agentic interventions as those interventions focus on cognitive‐behavioural strategies to support making independent choices, for example, health education interventions. Our IPD meta‐analysis, however, showed no differential effects on BMI across socio‐economic groups for workplace health promotion programmes. This is in line with several reviews on public health interventions that showed that the majority of the included studies on the prevention of unhealthy behaviour or obesity did not have differential effects across socio‐economic groups. 5 , 6 , 7 , 9 , 10 , 14 , 15 , 33 However, as unhealthy behaviours and obesity are more prevalent in workers in low SEP, the need for effective interventions for these workers remains of eminent importance. According to Hillier‐Brown et al., 34 implementing effective interventions targeted specifically to individuals in low SEP, for example, blue collar workers, might be effective in reducing the socio‐economic gradient in obesity.
4.2. Associations with study design and intervention characteristics
Overall, the reduction in BMI was small and not statistically significant. This is in line with earlier meta‐analyses, which include studies from different countries. Verweij et al. found a pooled effect of −0.34 kg/m2 (95% CI: −0.46, −0.22) for RCTs evaluating workplace health promotion interventions. 18 The seven RCTs in our meta‐analyses had a pooled effect of −0.25 (95% CI: −0.43, −0.07), in contrast to 0.03 (95% CI: −0.06, 0.12) for cluster RCTs and 0.03 (95% CI: −0.25, 0.32) for controlled trials. This is surprising, because other reviews have found larger effects among studies of lower methodological quality or among non‐randomized controlled studies. 17 , 35 However, this phenomenon could be explained by the difference in intervention types offered in the different study designs. Two specific interventions were effective, of which one also showed statistically significant, positive effects among workers in low SEP. 19 These interventions were offered at the individual level, which may be more suitable to be evaluated using an RCT. The current study showed that regardless of SEP, interventions focused on high‐risk groups, with a counselling component, provided at the individual level or with more than five sessions were in general effective. In addition, we noted some insignificant differences between workers in low SEP and high SEP whether subjective or objective measurement of BMI had any effect. It should be noticed that there was overlap between type of measurement of BMI and intervention characteristics. Due to a lack of statistical power, study or intervention characteristics could only be analysed univariate in the meta‐regression model. Therewith, it was not possible to disentangle the study and interventions characteristics that contribute most to a reduction in BMI, and these results should therefore be interpreted with caution.
4.3. Need for effective interventions among workers in low SEP
As the majority of the included interventions were not more effective in reducing BMI than control conditions, regardless of the SEP of the participants, this raises the question of which interventions are needed to reduce BMI in low socio‐economic groups or to reduce socio‐economic inequalities in BMI. The studies in this IPD meta‐analysis consisted of agentic or agento‐structural interventions, often counselling in combination with health education. All included interventions required individuals to make independent choices (e.g., free fruit at the workplace, healthier food options at the canteen or food steps to promote stair use). It was hypothesized that in particular, workers in higher socio‐economic groups would benefit from these kinds of interventions. None of the included studies were considered to evaluate structural interventions, while it is expected that such interventions are more likely to be effective among persons in low SEP. The current study showed, however, no evidence for an increase in inequalities after agentic or agento‐structural interventions. Although some interventions contained, to some extent, an environmental change, they could not be considered as structural because individuals still needed to make their own choices. According to the framework for the likely impact of obesity prevention strategies on socio‐economic inequalities in population body weight, structural interventions have more potential to reduce inequalities, because the individual choice is largely removed, such as providing only healthy food options at the canteen. 10 , 11 Such interventions would provide a context for healthy behaviour and could be combined with counselling interventions addressing high‐risk groups. However, a first step could be to make a comprehensive analysis of the determinants of the inequalities in health behaviour and BMI and design integrated interventions targeted to workers in low SEP.
4.4. Strengths and limitations
After combining original data from 16 interventions of 13 studies into one dataset, and analysing the results across socio‐economic groups, this IPD made it possible to assess socio‐economic inequalities in the effectiveness of workplace health promotion programmes and to provide insight into the association of study design and intervention characteristics with this effectiveness. Most workplace health promotion programmes did measure an indicator of SEP, but analysing differential effects across sociodemographic groups was mostly not performed.
A limitation is that—in contrast to what has been described in the protocol—the influence of reach and work‐related characteristics on the effectiveness of the studied worksite health promotion programmes could not be investigated. This information was not available in most of the included studies or was too heterogeneous to be harmonized, as a result of which these analyses could not be conducted. We recommend to include relevant process information, such as reach and uptake, and information on work‐related characteristics in publications on the effectiveness of workplace health promotion programmes. Work‐related characteristics have been found to be associated with BMI, for example, a higher BMI among workers with an imbalance between perceived high efforts and low rewards at work, 36 , 37 and among workers with high physical work demands. 38 , 39 The focus of the manuscript is on differential effects of workplace health promotion programmes on BMI across SEP groups. Therefore, only studies with at least multiple SEP groups were included. However, we found one other study that concerned only a single SEP group (high SEP) but met all inclusion criteria. 40 The effectiveness for this study was comparable with the included interventions. Although in the selection process no studies were identified that were restricted to low SEP workers only, providing tailored and effective interventions to workers in low SEP only could reduce socio‐economic inequalities in BMI. For six studies, no data were available. Five of these six studies were more than 10 years old. Although it is a strength that all studies were performed in the Netherlands within a homogeneous occupational health context, generalization to other contexts should be done with caution. It would be relevant to perform a similar analysis in different countries and compare the results across countries.
5. CONCLUSION
In conclusion, small statistically non‐significant intervention effects of workplace health promotion programmes on BMI were found. No evidence was shown for intervention‐generated inequalities in BMI for workplace health promotion programmes. These findings are in line with previous studies showing no differential effectiveness on BMI across socio‐economic groups. Interventions evaluated within an RCT, agentic interventions, interventions focusing on high‐risk groups, with counselling components, more than five sessions or being offered at the individual level did statistically significantly reduce BMI. No evidence was found for intervention‐generated SEP inequalities in BMI.
CONFLICT OF INTEREST
The institutions of the authors received one grant from Netherlands Organisation for Health Research and Development (ZonMw) during the conduct of the study. Prof. Dr. A. J. van der Beek reports personal fees from spin‐off company Evalua Nederland B.V. and grants from Dutch National Social Security Agency outside the submitted work.
Supporting information
Supplementary file A: Search strategy
Supplementary file B: Overview of excluded studies
ACKNOWLEDGEMENTS
We would like to thank all researchers who contributed by sharing their original data. We would like to thank Daan Nieboer for his advice concerning statistics.
This project is made possible by the Netherlands Organisation for Health Research and Development (ZonMw); project number 531001411.
Robroek SJW, Oude Hengel KM, van der Beek AJ, et al. Socio‐economic inequalities in the effectiveness of workplace health promotion programmes on body mass index: An individual participant data meta‐analysis. Obesity Reviews. 2020;21:e13101 10.1111/obr.13101
REFERENCES
- 1. Roskam AJR, Kunst AE, Van Oyen H, et al. Comparative appraisal of educational inequalities in overweight and obesity among adults in 19 European countries. Int J Epidemiol. 2010;39(2):392‐404. [DOI] [PubMed] [Google Scholar]
- 2. Giskes K, Avendano M, Brug J, Kunst AE. A systematic review of studies on socioeconomic inequalities in dietary intakes associated with weight. Obes Rev. 2010;11(6):413‐429. [DOI] [PubMed] [Google Scholar]
- 3. Beenackers MA, Kamphuis CB, Giskes K, et al. Socioeconomic inequalities in occupational, leisure‐time, and transport related physical activity among European adults: a systematic review. Int J Behav Nutr Phys Act. 2012;9(1):1‐23. [DOI] [PMC free article] [PubMed] [Google Scholar]
- 4. O'Neill J, Tabish H, Welch V, et al. Applying an equity lens to interventions: using PROGRESS ensures consideration of socially stratifying factors to illuminate inequities in health. J Clin Epidemiol. 2014;67(1):56‐64. [DOI] [PubMed] [Google Scholar]
- 5. Beauchamp A, Backholer K, Magliano D, Peeters A. The effect of obesity prevention interventions according to socioeconomic position: a systematic review. Obes Rev. 2014;15(7):541‐554. [DOI] [PubMed] [Google Scholar]
- 6. Lorenc T, Petticrew M, Welch V, Tugwell P. What types of interventions generate inequalities? Evidence from systematic reviews. J Epidemiol Community Health. 2013;67(2):190‐193. [DOI] [PubMed] [Google Scholar]
- 7. Boelsen‐Robinson T, Peeters A, Beauchamp A, Chung A, Gearon E, Backholer K. A systematic review of the effectiveness of whole‐of‐community interventions by socioeconomic position. Obes Rev. 2015;16(9):806‐816. [DOI] [PubMed] [Google Scholar]
- 8. Magnée T, Burdorf A, Brug J, et al. Equity‐specific effects of 26 Dutch obesity‐related lifestyle interventions. Am J Prev Med. 2013;44(6):e61‐e70. [DOI] [PubMed] [Google Scholar]
- 9. McGill R, Anwar E, Orton L, et al. Are interventions to promote healthy eating equally effective for all? Systematic review of socioeconomic inequalities in impact. BMC Public Health. 2015;15(1):1‐15. [DOI] [PMC free article] [PubMed] [Google Scholar]
- 10. Olstad DL, Teychenne M, Minaker LM, et al. Can policy ameliorate socioeconomic inequities in obesity and obesity‐related behaviours? A systematic review of the impact of universal policies on adults and children. Obes Rev. 2016;17(12):1198‐1217. [DOI] [PubMed] [Google Scholar]
- 11. Backholer K, Beauchamp A, Ball K, et al. A framework for evaluating the impact of obesity prevention strategies on socioeconomic inequalities in weight. Am J Public Health. 2014;104(10):e43‐e50. [DOI] [PMC free article] [PubMed] [Google Scholar]
- 12. Proper KI, van Oostrom SH. The effectiveness of workplace health promotion interventions on physical and mental health outcomes—a systematic review of reviews. Scand J Work Environ Health. 2019;45(6):546‐559. [DOI] [PubMed] [Google Scholar]
- 13. Montano D, Hoven H, Siegrist J. A meta‐analysis of health effects of randomized controlled worksite interventions: does social stratification matter? Scand J Work Environ Health. 2014;40(3):230‐234. [DOI] [PubMed] [Google Scholar]
- 14. Cairns JM, Bambra C, Hillier‐Brown FC, Moore HJ, Summerbell CD. Weighing up the evidence: a systematic review of the effectiveness of workplace interventions to tackle socio‐economic inequalities in obesity. J Public Health. 2015;37(4):659‐670. [DOI] [PMC free article] [PubMed] [Google Scholar]
- 15. Van de Ven D, Robroek SJW, Burdorf A. Are workplace health promotion programmes effective for all socioeconomic groups? Occup Environ Med. 2020. [Epub ahead of print] [DOI] [PMC free article] [PubMed] [Google Scholar]
- 16. Oude Hengel KM, Coenen P, Robroek SJW, et al. Socioeconomic inequalities in reach, compliance and effectiveness of lifestyle interventions among workers: protocol for an individual participant data meta‐analysis and equity‐specific reanalysis. BMJ Open. 2019;9(2):e025463. [DOI] [PMC free article] [PubMed] [Google Scholar]
- 17. Rongen A, Robroek SJW, Van Lenthe FJ, Burdorf A. Workplace health promotion: a meta‐analysis of effectiveness. Am J Prev Med. 2013;44(4):406‐415. [DOI] [PubMed] [Google Scholar]
- 18. Verweij LM, Coffeng J, van Mechelen W, Proper KI. Meta‐analyses of workplace physical activity and dietary behaviour interventions on weight outcomes. Obes Rev. 2011;12(6):406‐429. [DOI] [PubMed] [Google Scholar]
- 19. Groeneveld IF, Proper KI, van der Beek AJ, van Mechelen W. Sustained body weight reduction by an individual‐based lifestyle intervention for workers in the construction industry at risk for cardiovascular disease: results of a randomized controlled trial. Prev Med. 2010;51(3‐4):240‐246. [DOI] [PubMed] [Google Scholar]
- 20. Viester L, Verhagen EALM, Bongers PM, van der Beek AJ. Effectiveness of a worksite intervention for male construction workers on dietary and physical activity Behaviors, body mass index, and health outcomes: results of a randomized controlled trial. Am J Health Promot. 2018;32(3):795‐805. [DOI] [PubMed] [Google Scholar]
- 21. Coffeng JK, Boot CR, Duijts SF, Twisk JW, van Mechelen W, Hendriksen IJ. Effectiveness of a worksite social & physical environment intervention on need for recovery, physical activity and relaxation; results of a randomized controlled trial. PLoS One. 2014;9(12):e114860. [DOI] [PMC free article] [PubMed] [Google Scholar]
- 22. van Wier MF, Dekkers JC, Hendriksen IJ, et al. Effectiveness of phone and e‐mail lifestyle counseling for long term weight control among overweight employees. J Occup Environ Med. 2011;53(6):680‐686. [DOI] [PubMed] [Google Scholar]
- 23. Houkes I, de Rijk A, Rooijackers B, Mulder M, Koster A, Horstman K. Naar een sociale ecologie van duurzame inzetbaarheid. Maastricht: Maastricht University; 2015. [Google Scholar]
- 24. van Berkel J, Boot CR, Proper KI, Bongers PM, van der Beek AJ. Effectiveness of a worksite mindfulness‐based multi‐component intervention on lifestyle behaviors. Int J Behav Nutr Phys Act. 2014;11(1):9. [DOI] [PMC free article] [PubMed] [Google Scholar]
- 25. Slootmaker SM, Chinapaw MJ, Schuit AJ, Seidell JC, Van Mechelen W. Feasibility and effectiveness of online physical activity advice based on a personal activity monitor: randomized controlled trial. J Med Internet Res. 2009;11(3):e27. [DOI] [PMC free article] [PubMed] [Google Scholar]
- 26. Strijk JE, Proper KI, van der Beek AJ, van Mechelen W. A worksite vitality intervention to improve older workers' lifestyle and vitality‐related outcomes: results of a randomised controlled trial. J Epidemiol Community Health. 2012;66(11):1071‐1078. [DOI] [PMC free article] [PubMed] [Google Scholar]
- 27. Verweij LM, Proper KI, Weel AN, Hulshof CT, van Mechelen W. Long‐term effects of an occupational health guideline on employees' body weight‐related outcomes, cardiovascular disease risk factors, and quality of life: results from a randomized controlled trial. Scand J Work Environ Health. 2013;39(3):284‐294. [DOI] [PubMed] [Google Scholar]
- 28. Robroek SJ, Polinder S, Bredt FJ, Burdorf A. Cost‐effectiveness of a long‐term Internet‐delivered worksite health promotion programme on physical activity and nutrition: a cluster randomized controlled trial. Health Educ Res. 2012;27(3):399‐410. [DOI] [PMC free article] [PubMed] [Google Scholar]
- 29. Kouwenhoven‐Pasmooij TA, Robroek SJW, Kraaijenhagen RA, et al. Effectiveness of the blended‐care lifestyle intervention 'PerfectFit': a cluster randomised trial in employees at risk for cardiovascular diseases. BMC Public Health. 2018;18(1):766. [DOI] [PMC free article] [PubMed] [Google Scholar]
- 30. Engbers LH, van Poppel MN, van Mechelen W. Modest effects of a controlled worksite environmental intervention on cardiovascular risk in office workers. Prev Med. 2007;44(4):356‐362. [DOI] [PubMed] [Google Scholar]
- 31. Wierenga D, Engbers LH, van Empelen P, et al. The implementation of multiple lifestyle interventions in two organizations: a process evaluation. J Occup Environ Med. 2014;56(11):1195‐1206. [DOI] [PMC free article] [PubMed] [Google Scholar]
- 32. Robroek SJ, van Lenthe FJ, van Empelen P, Burdorf A. Determinants of participation in worksite health promotion programmes: a systematic review. Int J Behav Nutr Phys Act. 2009;20(6):26. [DOI] [PMC free article] [PubMed] [Google Scholar]
- 33. Hayba N, Partridge SR, Nour MM, Grech A, Allman FM. Effectiveness of lifestyle interventions for preventing harmful weight gain among young adults from lower socioeconomic status and ethnically diverse backgrounds. Obes Rev. 2018;19(3):333‐346. [DOI] [PubMed] [Google Scholar]
- 34. Hillier‐Brown FC, Bambra CL, Cairns JM, Kasim A, Moore HJ, Summerbell CD. A systematic review of the effectiveness of individual, community and societal‐level interventions at reducing socio‐economic inequalities in obesity among adults. Int J Obes (Lond). 2014;38(12):1483‐1490. [DOI] [PMC free article] [PubMed] [Google Scholar]
- 35. van Dongen JM, Proper KI, van Wier MF, et al. Systematic review on the financial return of worksite health promotion programmes aimed at improving nutrition and/or increasing physical activity. Obes Rev. 2011;12(12):1031‐1049. [DOI] [PubMed] [Google Scholar]
- 36. Magnusson Hanson LL, Westerlund H, Goldberg M, et al. Work stress, anthropometry, lung function, blood pressure, and blood‐based biomarkers: a cross‐sectional study of 43,593 French men and women. Sci Rep. 2017;7(1):9282. [DOI] [PMC free article] [PubMed] [Google Scholar]
- 37. Nyberg ST, Heikkilä K, Fransson EI, et al. Job strain in relation to body mass index: pooled analysis of 160 000 adults from 13 cohort studies. J Intern Med. 2012;272(1):65‐73. [DOI] [PMC free article] [PubMed] [Google Scholar]
- 38. Böckerman P, Johansson E, Jousilahti P, Uutela A. The physical strenuousness of work is slightly associated with an upward trend in the BMI. Soc Sci Med. 2008;66(6):1346‐1355. [DOI] [PubMed] [Google Scholar]
- 39. Viester L, Verhagen EALM, Oude Hengel KM, Koppes LLJ, van der Beek AJ, Bongers PM. The relation between body mass index and musculoskeletal symptoms in the working population. BMC Musculoskelet Disord. 2013;14:238. [DOI] [PMC free article] [PubMed] [Google Scholar]
- 40. van Drongelen A, Boot CR, Hlobil H, Twisk JW, Smid T, van der Beek AJ. Evaluation of an mHealth intervention aiming to improve health‐related behavior and sleep and reduce fatigue among airline pilots. Scand J Work Environ Health. 2014;40(6):557‐568. [DOI] [PubMed] [Google Scholar]
Associated Data
This section collects any data citations, data availability statements, or supplementary materials included in this article.
Supplementary Materials
Supplementary file A: Search strategy
Supplementary file B: Overview of excluded studies