

Abstract
Cellular senescence is characterized by stable cell cycle arrest and a secretory program that modulates the tissue microenvironment1,2. Physiologically, senescence serves as a tumor suppressive mechanism that prevents the expansion of premalignant cells3,4 and plays a beneficial role in wound healing responses5,6. Pathologically, the aberrant accumulation of senescent cells generates an inflammatory milieu that leads to chronic tissue damage and contributes to diseases such as liver and lung fibrosis, atherosclerosis, diabetes, and osteoarthritis1,7. Accordingly, elimination of senescent cells from damaged tissues in mice ameliorates symptoms of these pathologies and even promotes longevity1,2,8–10. Here we test the therapeutic concept that chimeric antigen receptor (CAR) T cells targeting senescent cells can be effective senolytics. We identify the urokinase plasminogen activator receptor (uPAR)11 as a cell surface protein broadly induced during senescence and demonstrate that uPAR-specific CAR T cells efficiently ablate senescent cells in vitro and in vivo. uPAR-directed CAR T cells extend the survival of mice harboring lung adenocarcinoma treated with a senescence-inducing drug combination, and restore tissue homeostasis in chemical- or diet-induced liver fibrosis. These results establish the therapeutic potential of senolytic CAR T cells for senescence-associated diseases.
Given the contribution of senescence to tissue damage, there is growing interest in the development of ‘senolytic’ agents that selectively eliminate senescent cells12. Several small molecules display such activity, but most lack potency and produce substantial side effects1,12,13. An alternative approach could involve CAR T cells directed against senescence-specific surface antigens. CARs are synthetic receptors that redirect T cell specificity, effector potential and other functions14. CAR T cells targeting CD19 have shown remarkable efficacy in patients with refractory B-cell malignancies15 and other cell-surface antigens show promise as targets for CAR therapy in other indications16–18. Here we investigate whether CAR T cells could serve as senolytic agents.
To identify cell surface proteins that are broadly and specifically upregulated in senescent cells, we compared RNAseq datasets derived from three independent and robust models of senescence: 1) Therapy-induced senescence (TIS) in murine lung adenocarcinoma KrasG12D;p53−/− (KP) cells triggered to senesce by the combination of MEK and CDK4/6 inhibitors19; 2) Oncogene-induced senescence (OIS) in murine hepatocytes mediated by in vivo delivery of NRASG12V through hydrodynamic tail vein injection (HTVI)4; and 3) Culture-induced senescence of murine hepatic stellate cells (HSCs) (Extended Data Fig. 1a). We focused on transcripts encoding molecules located in the plasma membrane as determined by UniProtKB that were upregulated in all datasets (Extended Data Fig. 1b, c). 8 transcripts were identified, each encoding proteins linked to extracellular matrix remodeling or the coagulation cascade (Extended Data Fig. 1 d).
Given that ideal antigens for CAR T cell engagement should be highly expressed on target cells but not vital tissues, we ranked each transcript according to its magnitude of upregulation (log2 fold change), and then excluded those highly expressed in vital tissues as determined by the Human Protein Atlas (HPA) and Human Proteome Map (HPM)20. This process identified PLAUR, which encodes the urokinase plasminogen activator receptor (uPAR), as a suitable candidate (Extended Data Fig. 1e). Accordingly, PLAUR was also upregulated in public datasets of senescent human cells19,21 and immunohistochemistry confirmed that uPAR protein was absent in many vital organs (Extended Data Fig. 1g, f). Consistent with previous reports, low uPAR expression was detected in the brochial epithelium. Other cell types that express uPAR include subsets of monocytes, macrophages and neutrophils11,22.
uPAR is the receptor for urokinase-type plasminogen activator (uPA), which promotes the degradation of the extracellular matrix during fibrinolysis, wound healing or tumorigenesis11. uPAR also functions as a signaling receptor that promotes motility, invasion and survival of tumor cells11. Nonetheless, mice lacking uPAR are viable and fertile23. A portion of uPAR is proteolytically cleaved upon ligand binding, generating soluble uPAR (suPAR). Interestingly, suPAR is secreted by senescent cells as part of the senescence-associated secretory phenotype (SASP)24 and serves as a serum biomarker for kidney disease and diabetes25, two chronic pathologies linked to senescence25.
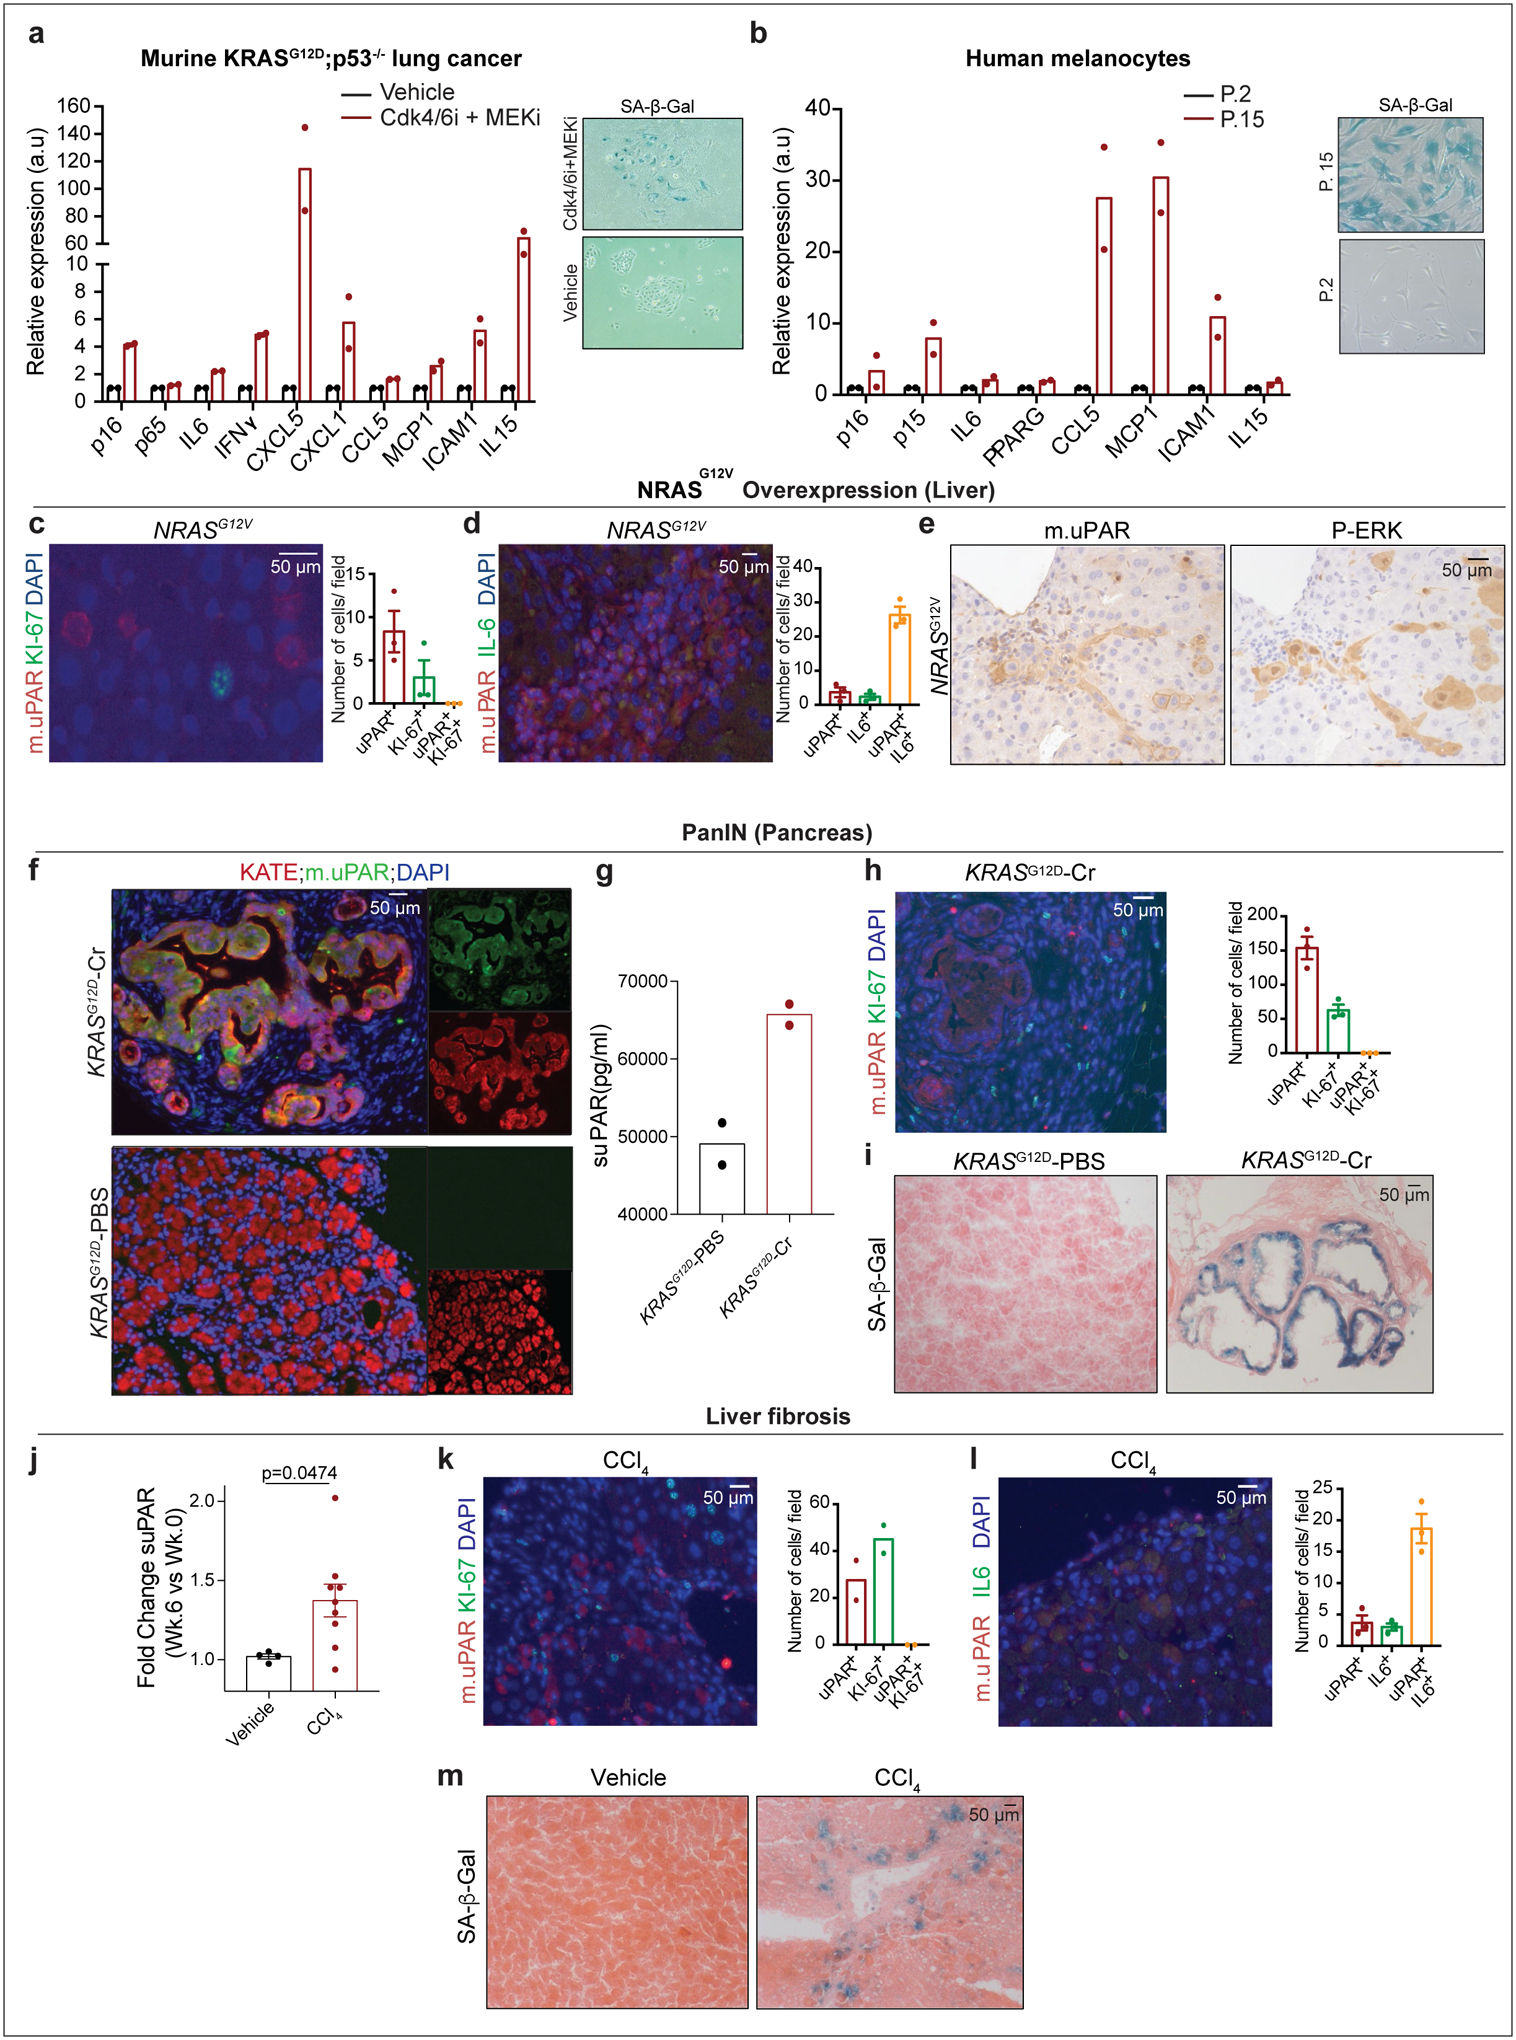
We next confirmed that uPAR was induced on the surface of senescent cells in vitro and in vivo. First, we evaluated therapy-induced senescence in KP lung cancer cells treated with combined MEK and CDK4/6 inhibition and replication-induced senescence in human primary melanocytes (Fig. 1a, b, Extended Data Fig. 2a, b). In both models, cell surface uPAR expression and suPAR were markedly increased upon senescence induction (Fig. 1 a, b). Second, we examined a patient-derived xenograft (PDX) model of non-small cell lung cancer (NSCLC), in which mice were treated with combined MEK and CDK4/6 inhibitors19 (Fig. 1c) and two different models of oncogene-induced senescence triggered either by overexpression of NrasG12V in murine hepatocytes transfected via hydrodynamic tail vein injection (Fig. 1d, Extended Data Fig. 2c–e) or by endogenous KrasG12D expression in a murine model of senescent pancreatic intraepithelial neoplasia (PanIN) (Extended Data Fig. 2f–i). Finally, we included a mouse model of carbon tetrachloride (CCl4)-induced liver fibrosis, in which senescent HSCs contribute to the pathophysiology (Fig. 1e, Extended Data Fig. 2j–m)6. In each system, the senescence-inducing treatment increased the amount of uPAR-positive cells and serum suPAR levels. Notably, uPAR-positive cells did not express the proliferation marker Ki67, but co-expressed IL6, an established SASP component1,2.
Figure 1|. uPAR is a cell surface and secreted biomarker of senescence.
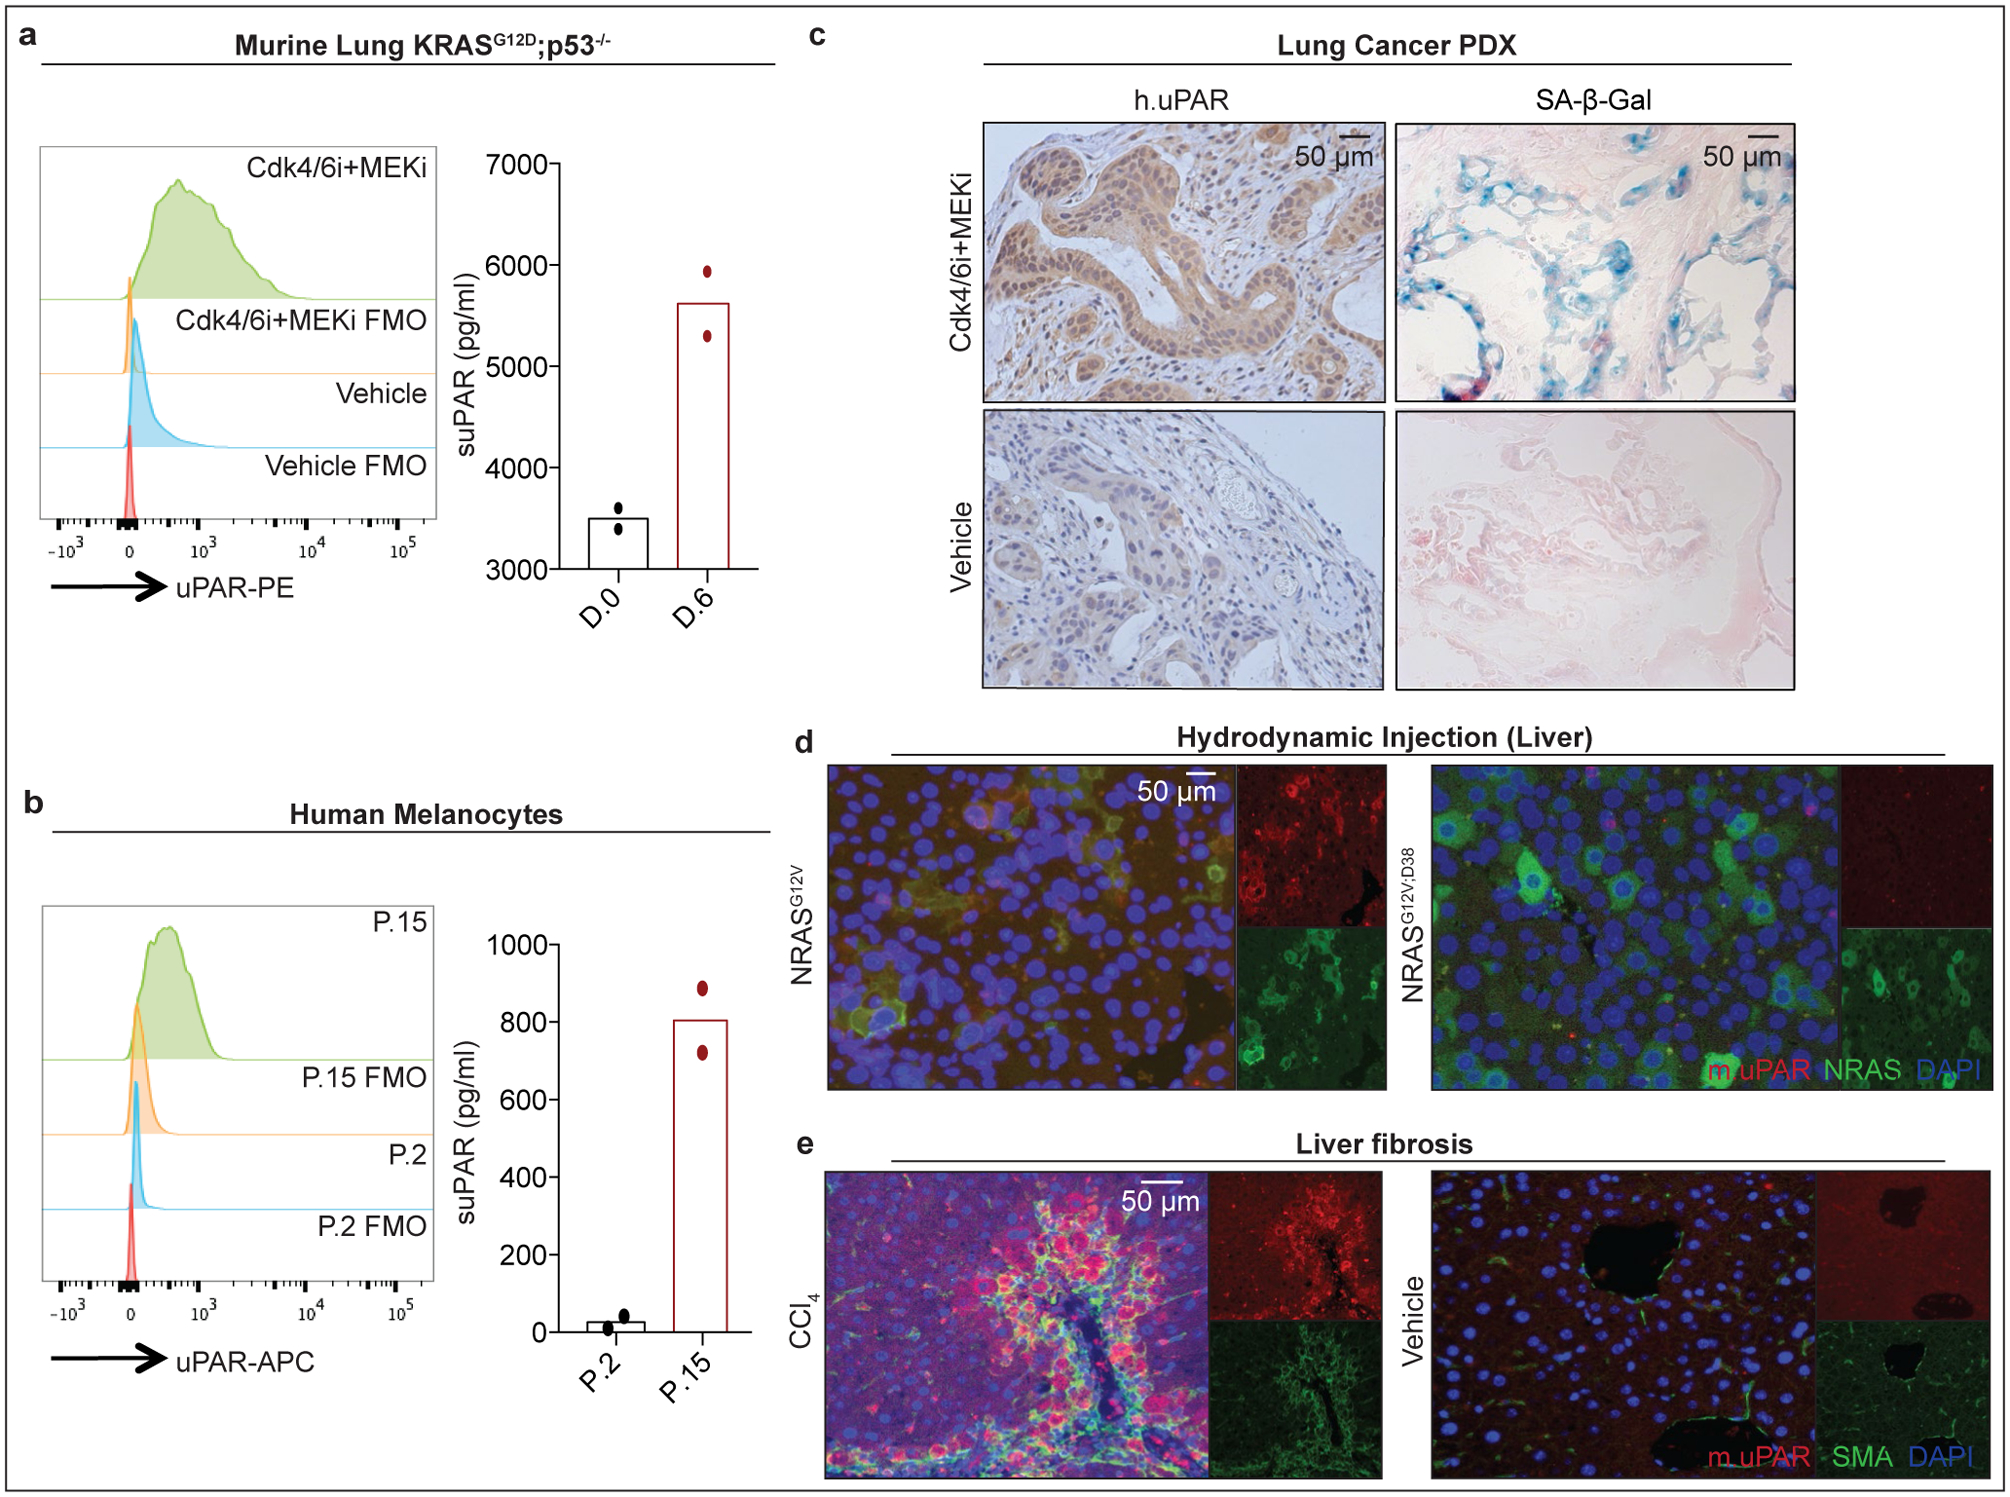
(a) Flow cytometric analysis of mouse uPAR (m.uPAR) expression on KrasG12D;p53−/− murine lung adenocarcinoma cells (KP) induced to senesce by treatment with MEK and CDK4/6 inhibitors as compared to controls. Representative results of n=3 independent experiments. Levels of soluble uPAR (suPAR) as determined by ELISA in the supernatant of senescent or proliferating KP cells. Representative results of n=2 independent experiments. (b) Flow cytometric analysis comparing human uPAR (h.uPAR) expression on primary human melanocytes induced to senesce by continuous passage with proliferating controls. Representative results of n=2 independent experiments. Levels of suPAR in the supernatant of senescent (Passage 15 = P.15) or proliferating (Passage 2 = P.2) primary human melanocytes. Representative results of n=2 independent experiments. (c) Immunohistochemical stainings of h.uPAR and SA-β-Gal of a patient-derived xenograft (PDX) from human lung adenocarcinoma orthotopically injected into NSG mice after treatment with vehicle or combined MEK and CDK4/6 inhibitors; representative of n=2 independent experiments (n=3 mice per group). (d) Co-immunofluorescence (IF) staining of m.uPAR (red) and NRAS (green) in the livers of mice 6 days after hydrodynamic tail vein injection of a plasmid encoding NRASG12V or NRASG12V;D38A. Representative results of n=3 independent experiments (n=5 mice per group). (e) Co-IF staining of m.uPAR (red) and smooth muscle actin (green) in the livers of mice 6 weeks after semi-weekly i.p. treatment with CCl4 (n=7 mice) or vehicle (n=4 mice). Representative results of n=3 independent experiments.
We next confirmed that uPAR is highly expressed in tissues from patients affected by senescence-associated disorders. High uPAR expression was observed in liver fibrosis specimens from different etiologies. uPAR positive cells showed the same histological presentation as SA-β-gal positive cells and co-expressed the senescence-associated markers p16 and IL6 (Extended Data Fig. 3a, b). uPAR was also highly expressed in atherosclerotic plaques from human carotid endarterectomy specimens and in PanIN lesions (Extended Data Fig. 3c, d). Increased uPAR and/ or suPAR levels have furthermore been noted in patients with other senescence-associated diseases including osteoarthritis, diabetes or idiopathic pulmonary fibrosis26–28. Collectively, these results nominate uPAR as a candidate target for senolytic CAR T cells.
We constructed a uPAR-specific CAR comprising an anti murine uPAR (m.uPAR) single chain variable fragment linked to human CD28 costimulatory and CD3ζ (h.28z) signaling domains (m.uPAR-h.28z), transduced human T cells, and performed cytotoxicity assays using target cells expressing a murine uPAR cDNA (Extended Data Fig. 4a–d). To enable comparisons to well-characterized CAR T cells directed against CD1929, murine uPAR was introduced into the human CD19+ pre-B acute lymphoblastic leukemia cell line (B-ALL) NALM6 (Extended Data Fig. 4c). m.uPAR-h.28z CAR T cells showed no cytotoxicity towards uPAR negative NALM6 cells, but comparable activity to CD19 CAR (h.19-h.28z) T cells when targeting uPAR-expressing NALM6 cells (Fig. 2a, Extended Data Fig. 4d). m.uPAR-h.28z, but not h.19-h.28z, CAR T cells efficiently eliminated senescent KP cells expressing endogenous uPAR, which was accompanied by antigen-specific granzyme B and IFNγ secretion (Fig. 2b, Extended Data Fig. 4e). Hence, m.uPAR-h.28z CAR T cells can selectively and efficiently target senescent cells.
Figure 2|. uPAR-CAR T cells are bona fide senolytics.
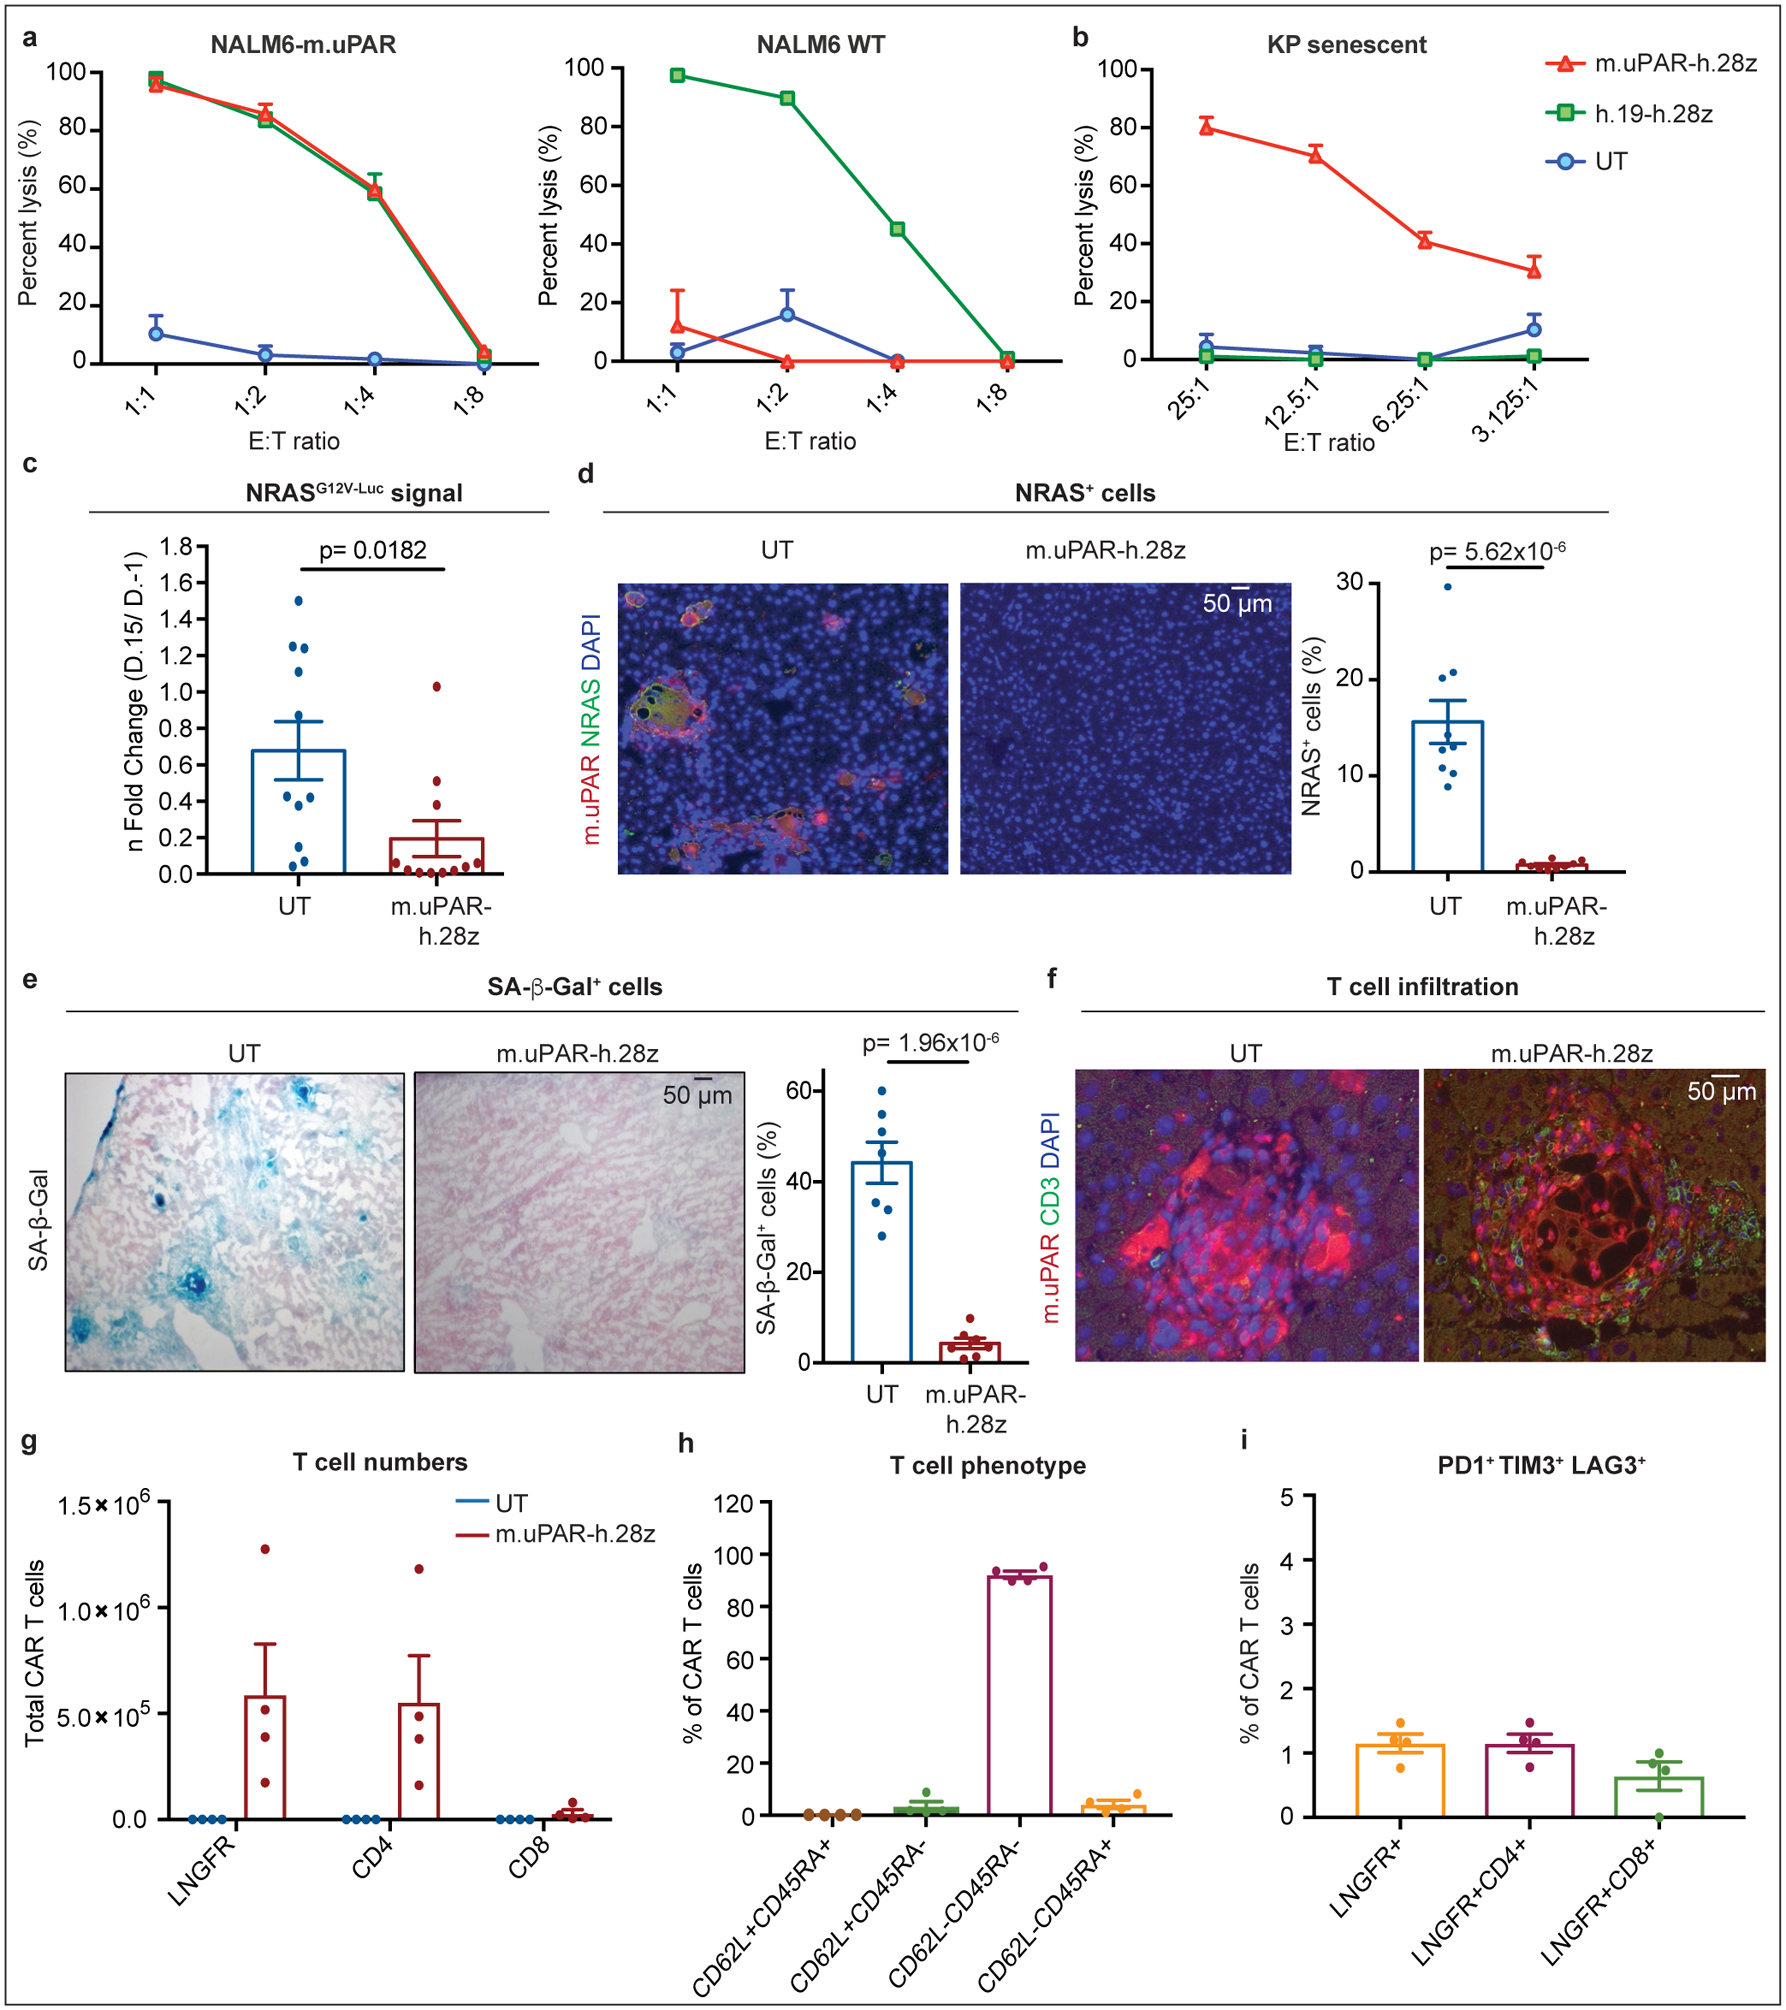
(a) Cytotoxic T cell activity as determined by a 18hr-bioluminescence assay with luciferase-expressing NALM6 wild type (WT) or NALM6 overexpressing m.uPAR (NALM6-m.uPAR) as targets. Data representative of n=3 independent experiments, each performed in triplicates. (b) Cytotoxic T cell activity as determined by a 4hr-bioluminescence assay with MEK/Cdk4/6 inhibitor-induced senescent KP cells as targets; representative of n=2 independent experiments, each performed in triplicates. (c-i) NSG mice were injected with a plasmid encoding NRASG12V-GFP-Luciferase and treated with 0.5×10⁶ m.uPAR-h.28z CAR T cells or untransduced (UT) T cells 10 days after injection. Mice were euthanized 15 days later and livers were analyzed. (c) n fold change in luciferase signal in mice (calculated as average radiance on day 15 divided by average radiance on day −1) (n=11 mice per group). (d) Co-immunofluorescence (IF) staining of m.uPAR (red) and NRAS (green) and quantification of NRAS-positive cells (n=9 mice per group). (e) Representative stainings and quantification of SA-β-Gal positive cells (n=7 mice per group). (f) Co-IF staining of m.uPAR (red) and human CD3 (green) (n=5 mice per group). (g-i) Number of liver infiltrating T cells (g), expression of CD62L/CD45RA (h) and PD1+TIM3+LAG3+ (i) on m.uPAR-h.28z CAR T cells as determined by flow cytometry (n=4 mice per group). (c-e) Representative results of n=2 independent experiments. Data are mean± SEM. Two-tailed unpaired Student’s t-test.
To study whether m.uPAR-h.28z CAR T cells could function as a bona fide senolytics in vivo, we took advantage of the well-characterized model of oncogene-induced senescence triggered by hepatic overexpression of NRASG12V-Luciferase used above4. While these senescent cells normally undergo SASP-mediated immune clearance4, they are retained in livers of immunodeficient NOD-Scid-gamma (NSG) mice4. Successful transfection of murine hepatocytes in NSG mice was confirmed by bioluminescence imaging and followed by administration of 0.5×10⁶ m.uPAR-h.28z CAR+ T cells or untransduced (UT) T cells as controls (Extended Data Fig. 4f).
Treatment with m.uPAR-h.28z CARs led to a profound decrease in bioluminescence signal within 10 days (Fig. 2c), suggesting effective clearance of senescent hepatocytes. Histological analyses confirmed that livers from m.uPAR-h.28z CAR T cell treated mice had significantly reduced numbers of NRAS (p<0.01) and SA-β-gal positive cells (p<0.001) compared to controls (Fig. 2d, e). Furthermore, m.uPAR-h.28z CAR T cells (but not UT T cells) accumulated around senescent hepatocytes within 7 days of infusion (Fig. 2f) and displayed an effector memory phenotype (CD62L−CD45RA−) with little evidence of T cell exhaustion (<2% PD1+TIM3+LAG3+ CAR T cells) 15 days after their administration (Fig. 2g, h). Therefore, uPAR-28z CAR T cells can eliminate senescent cells in vivo.
To evaluate the senolytic capacity of uPAR CAR T cells in immunocompetent settings, we transduced T cells derived from C57BL/6 mice with a fully murinized CAR (m.uPAR-m.28z). We confirmed CAR expression, excluded uPAR expression on transduced T cells, and showed that they displayed a similar cytolytic profile to m.uPAR-h.28z when targeting the mouse CD19+ B-ALL cell line Eμ-ALL01 expressing exogenous uPAR or senescent KP cells (Fig. 3a, b, Extended Data Fig. 4g, h).
Figure 3|. Senolytic CAR T cells show therapeutic efficacy in CCl4-induced liver fibrosis.
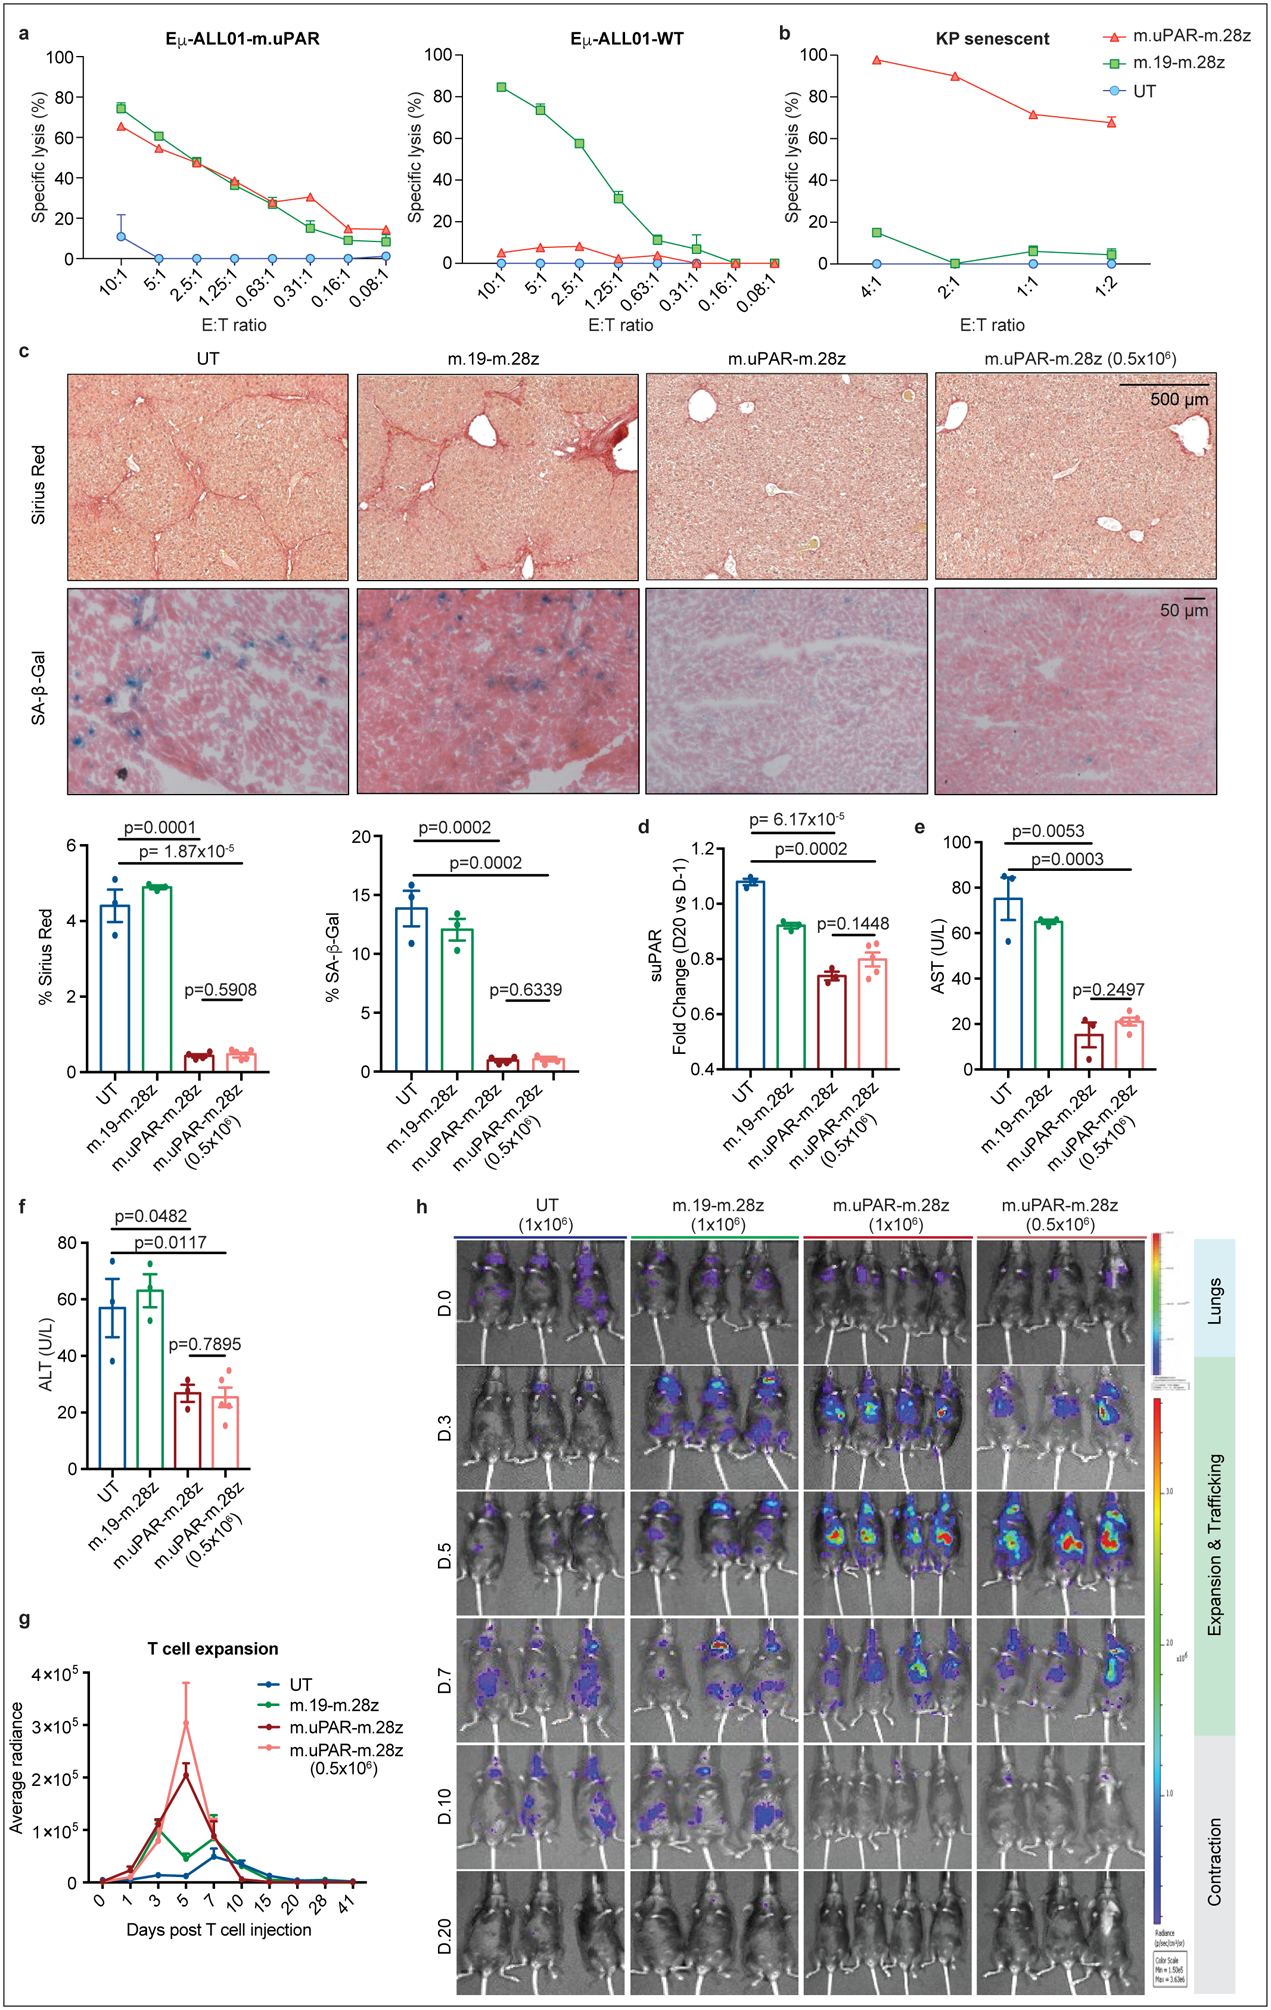
(a) Cytotoxicity of murine CAR T cells as determined by a 18hr-bioluminescence assay with luciferase-expressing Eμ-ALL01 WT or Eμ-ALL01-m.uPAR as targets. Representative results of n=3 independent experiments, each performed in triplicates. (b) Cytotoxic activity as determined by a 18hr-bioluminescence assay using MEKi/CDK4/6i–treated KP cells as targets. Results of n=2 independent experiments, each performed in triplicates. (c-f) Mice with CCl4-induced liver fibrosis were treated with 0.5×10⁶ or 1×10⁶ m.uPAR-m.28z, 1×10⁶ m.19-m.28z or untransduced (UT) T cells and euthanized 20 days after. Livers were used for further analyses. (c) Representative levels of fibrosis as evaluated by Sirius red staining, SA-β-Gal expression and respective quantifications (UT and m.19-m.28z: n=3, m.uPAR-m.28z: n=4, m.uPAR-m.28z at 0.5×10⁶: n=5). (d-f) Fold change differences in serum levels of suPAR (d), AST (e) and ALT (f) 20 days after T cell infusion (UT, m.19-m.28z and m.uPAR-m.28z: n=3; m.uPAR-m.28z at 0.5×10⁶: n=5). (g)-(h) Mice with CCl4-induced liver fibrosis were injected with 0.5×10⁶ or 1×10⁶ click beetle red luciferase-expressing CAR T cells or UT T cells. (g) Luciferase signal (average radiance) of treated mice after T cell administration (UT and m.19-m.28z: n=3, m.uPAR-m.28z: n=4, m.uPAR-m.28z at 0.5×10⁶: n=3). (h) Representative bioluminescence images of mice at different time points after injection. Signal in control mice at day 10 indicates abdominal peritonitis induced by CCl4 injections as confirmed by pathology. (c-h) Results of n=1 independent experiment. Data are mean± SEM. Two-tailed unpaired Student’s t-test.
Prior studies suggest that the combination of a senescence-inducing cancer therapy together with a senolytic agent can improve treatment outcome in mouse models30. We thus treated mice harboring orthotopic KP lung adenocarcionomas with combined MEK and CDK4/6 inihibitors19 followed by administration of either uPAR- or CD19-specific CAR T cells or UT T cells (Extended Data Fig. 5a). Treatment with uPAR-targeted CAR T cells significantly prolonged survival without eliciting signs of toxicity (Extended Data Fig. 5b–d). Lungs harvested from these mice showed a substantial decrease in senescent tumor cells accompanied by enhanced infiltration of adoptively transferred CD4+ and CD8+ T cells expressing activation markers (Extended Data Fig. 5e, f). In addition to confirming the senolytic properties of uPAR-directed CAR T cells, these results point towards combinatorial strategies using senolytic CAR T cells for the treatment of solid tumors.
Besides cancer, senescence contributes to a range of chronic tissue pathologies including liver fibrosis, a condition that can evolve into cirrhosis and produces a microenvironment that favors hepatocellular carcinoma development1,2. Since genetic ablation of senescent cells ameliorates liver fibrosis31,32, we performed dose-escalation studies using m.uPAR-m.28z CAR T cells in the well-defined model involving CCl4 exposure, which leads to the accumulation of senescent HSCs, fibrosis, and liver damage within 6 weeks6. m.uPAR-m.28z, m.19-m.28z CARs or UT T cells were infused at either the previously effective dose of 0.5–1×10⁶ CAR T cells or higher dosage (2–3×10⁶) into mice with established liver fibrosis33 (Extended Data Fig. 6a). In some experiments, mice were treated with either m.uPAR-m.28z, m.19.-m.28z or control T cells expressing click-beetle red luciferase to track T cells in vivo using bioluminescence34 (Extended Data Fig. 6b).
At either dosage, m.uPAR-m.28z CAR T cells produced a striking reduction in liver fibrosis. Hence, liver samples obtained 20 days after treatment with m.uPAR-m.28z CAR T cells displayed fewer senescent cells and less fibrosis as assessed by SA-β-Gal and Sirius red staining compared to controls (p<0.001), which was associated with an accumulation of adoptively transferred T cells (Fig. 3c, Extended Data Fig. 6c,d). Consistent with on-target activity and a therapeutic benefit, mice treated with m.uPAR-m.28z CAR T cells displayed reduced serum levels of suPAR and of the liver enzymes ALT and AST (Fig. 3d–f, Extended Data Fig. 6e–g), indicating efficient elimination of pro-inflammatory senescent HSCs31,32 and a reduction in liver damage, respectively. Bioluminescence imaging revealed that transferred T cells initially transited through the lungs as expected. Eventually, m.uPAR-specific, but not m.CD19-directed CARs or UT T cells, accumulated in the livers of CCl4-treated mice, showing expansion over a few days followed by rapid contraction (Fig. 3g, h). The high senolytic activity of uPAR CAR T cells was corroborated by efficient reduction of fibrosis under aggravated conditions produced by prolonged CCl4 exposure as well as sustained fibrosis resolution in long-term follow up studies (Extended Data Fig. 6h, i).
Mice treated at the lower effective dose remained highly active and did not display observable signs of morbidity, changes in temperature or weight, or relevant alterations in cell blood counts (Extended Data Fig. 7a–c, e). Moderate macrophage infiltration was noted in the lungs after 20 days, which also occurred in mice treated with m.19-m.28z or UT T cells (Extended Data Fig. 7d). Mice treated at the supratherapeutic dose presented with hypothermia and weight loss, which was accompanied by a rise in serum cytokines including IL6, GM-CSF, G-CSF and IFNy (Extended Data Fig. 8a–e). Similar to CAR T cell-associated cytokine release syndrome (CRS)35,36, this early toxicity was transient, associated with local accumulation and activation of macrophages and could be mitigated by lower CAR T cell doses or CRS-prevention using IL6R and IL1R inhibitors (Extended Data Fig. 8f–i, Extended Data Fig. 9). Altogether, these findings indicate that appropriately-dosed uPAR-directed CAR T cells can deplete senescent cells without precipitating severe CRS-like symptoms and highlight the potential of short acting CD28/CD3z-based CAR T cells37 in senescence-associated indications.
We also tested whether uPAR-targeting CAR T cells could be effective against fibrosis induced by non-alcoholic steatohepatitis (NASH), a condition of growing incidence in which effective therapeutic options are lacking38. Although the contribution of cellular senescence to NASH pathology is poorly understood, its role in other fibrosis settings prompted us to test for the presence of senescent cells in two well-established murine NASH models. Indeed, senescent cells were prevalent around the fibrotic areas (Fig. 4a, Extended Data Fig. 10a) and co-expressed uPAR and either markers of HSCs (uPAR+ and desmin+) or macrophages (uPAR+ and F4/80+) (Fig. 4b). Accordingly, treatment of mice with diet-induced NASH using 0.5×10⁶ m.uPAR-m.28z CAR T cells (but not UT controls) efficiently eliminated senescent cells, reduced fibrosis and improved liver function (as assessed by serum albumin levels) without eliciting detectable toxicity (Fig. 4c, d, Extended Data Fig. 10b–f). Thus, senolytic CAR T cells are effective against liver fibrosis of different etiologies.
Figure 4|. Senolytic CAR T cells are therapeutic in NASH-induced liver fibrosis.
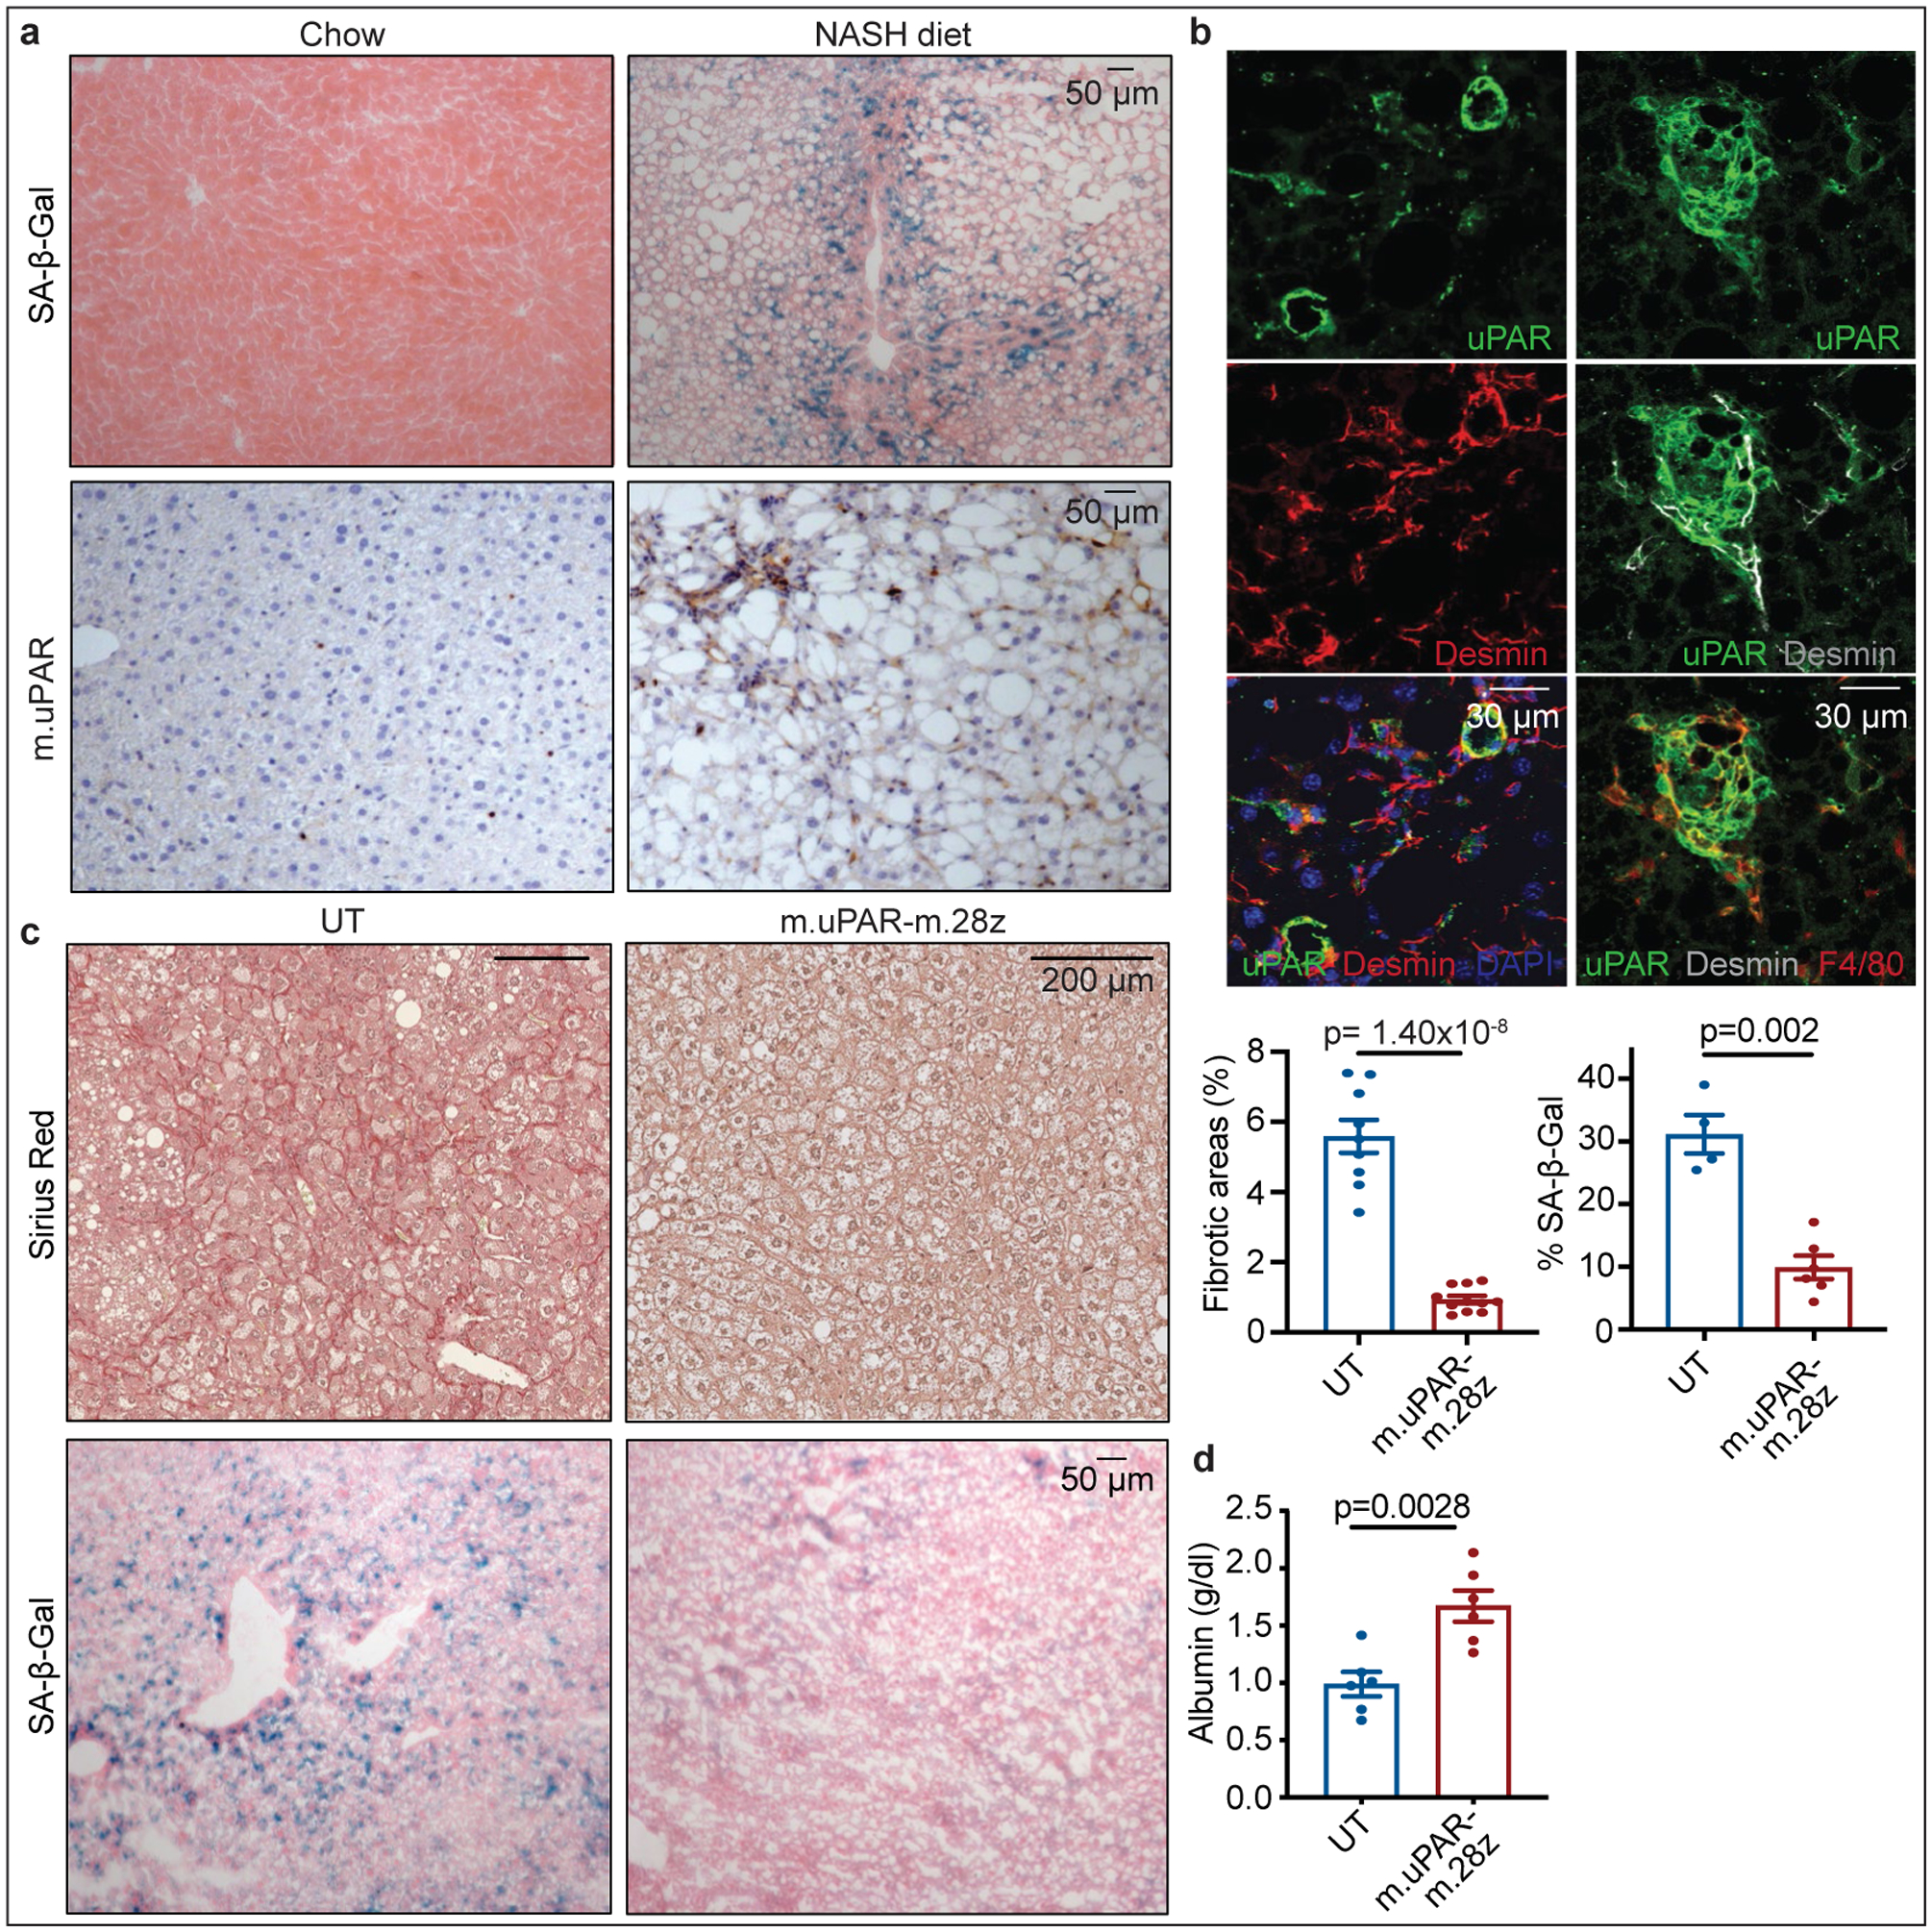
(a,b) Representative stainings in the livers of mice treated with chow or NASH diet for 3–4 months. (a) Immunohistochemical staining of m.uPAR and SA-β-Gal (n=3 mice per group) (b) Co-immunofluorescence staining of m.uPAR (green), desmin (red in left panel, gray in right panel) and F4/80 (red). Representative results of n=2 independent experiments (n=3 mice per group). (c-d) Mice treated with NASH diet for 3 months were injected with 0.5×10⁶ m.uPAR-m.28z CAR T cells or untransduced (UT) T cells. Liver and serum analyses were performed 20 days later. (c) Representative Sirius red staining, SA-β-Gal expression and quantifications (Sirius red: UT: n=9 mice, m.uPAR-m.28z: n=11. SA-β-Gal: UT: n= 4 mice, m.uPAR-m.28z: n=6). (d) Serum albumin levels (UT and m.uPAR-m.28z: n=6). (c-d) Results of n=2 independent experiments. Data are mean± SEM. Two-tailed unpaired Student’s t-test.
Herein we identify uPAR as a protein broadly induced on the surface of senescent cells and show that uPAR CAR T cells can eliminate senescent cells in vitro and in vivo. Owing to its secretion, suPAR serves as a plasma biomarker to assess CAR T cell senolytic activity in vivo. In contrast to a previous report investigating uPAR as a target for CAR T cells in ovarian cancer39, our results provide proof-of-principle of the therapeutic potential of senolytic CAR T cells in senescence-associated pathologies. While further work is needed to determine whether uPAR-targeting CAR T cells have the required safety profile to be developed clinically, appropriately dosed senolytic CAR T cells can infiltrate the areas of senescence, efficiently target senescent cells, and produce a therapeutic benefit without notable toxicities in mice. Future iterations of this approach could target other cell surface molecules specific to particular senescence contexts, incorporate ‘safety switches40,41 or combinatorial strategies to maximize efficacy while minimizing side-effects14,41.
Unlike tumor cells, senescent cells do not divide or create an immunosuppressive microenvironment, and may present lesser barriers to the development of therapeutically efficacious CAR T cells18,42. Furthermore, the rapid waning of senolytic CAR T cells used in our studies soon after their therapeutic action may prove an attractive feature in reducing prolonged interference with beneficial aspects of senescence in normal tissue homeostasis while enabling readministration at later times. Beyond fibrosis, senescence has been linked to many disorders of chronic tissue damage associated with aging such as severe atherosclerosis, diabetes, or osteoarthritis10. Consequently, senolytic CAR T cells may have broad therapeutic potential.
METHODS
RNA-seq analysis
RNA extraction, RNA-seq library preparation and sequencing:
total RNA was isolated from: 1) KrasG12D; p53−/− cells after 8 days of treatment with vehicle (DMSO) or combined treatment with MEK inhibitor trametinib (25nM) and and CDK4/6 inhibitor palbociclib (500nM). 2) Oncogene-induced senescent hepatocytes were generated in C57BL/6 mice via hydrodynamic tail vein injection (HTVI). For each mouse, 25μg of pT3-Caggs-NRasG12V-IRES-GFP plasmids (or pT3-Caggs-NRasG12V;D38A-IRES-GFP plasmids as control) and 5μg CMV-SB13 were suspended in saline solution at the volume of 10% of the animal’s body weight for administration. Six days after HTVI, mice were anesthetized and placed on the platform for liver perfusion. Sequential perfusions of HBSS containing EGTA and HBSS containing Collagenase IV were performed, followed by passing the dissociated liver cells through a 100 μM cell strainer. The hepatocytes were further washed by low glucose DMEM and low speed centrifugation. DAPI-negative/GFP-positive hepatocytes, indicating successful transduction of mutant Nras expression, were isolated through low pressure fluorescence-activated cell sorting. 3) The datasets from senescent or proliferating hepatic stellate cells were obtained from a previous study. The datasets from proliferating, quiescent or senescent IMR-90 were obtained from a previous study21. Sequencing and library preparation were performed at the Integrated Genomics Operation (IGO) at MSKCC. RNA-seq libraries were prepared from total RNA. After RiboGreen quantification and quality control by Agilent BioAnalyzer, 100–500ng of total RNA underwent polyA selection and TruSeq library preparation according to instructions provided by Illumina (TruSeq Stranded mRNA LT Kit, RS-122–2102), with 8 cycles of PCR. Samples were barcoded and run on a HiSeq 4000 or HiSeq 2500 in a 50bp/50bp paired end run, using the HiSeq 3000/4000 SBS Kit or TruSeq SBS Kit v4 (Illumina) at MSKCC’s IGO core facility.
RNA-seq read mapping, differential gene expression analysis and heatmap visualization:
Resulting RNA-Seq data was analyzed by removing adaptor sequences using Trimmomatic43. RNA-Seq reads were then aligned to GRCm38.91 (mm10) with STAR44 and transcript count was quantified using featureCounts45 to generate raw count matrix. Differential gene expression analysis and adjustment for multiple comparisons were performed using DESeq2 package46 between experimental conditions, using 2 independent biological replicates per condition, implemented in R (http://cran.r-project.org/). Differentially expressed genes (DEGs) were determined by > 2-fold change in gene expression with adjusted P-value < 0.05. For heatmap visualization of DEGs, samples were z-score normalized and plotted using pheatmap package in R. Transcripts encoding molecules defined to be located in the plasma membrane with a confidence score higher than 3 (range 0–5) as determined by UniProtKB were considered as cell suface molecules.
Functional annotations of gene clusters:
Pathway enrichment analysis was performed in the resulting gene clusters with the Reactome database using enrichR47. Significance of the tests was assessed using combined score, described as c = log(p) * z, where c is the combined score, p is Fisher exact test p-value, and z is z-score for deviation from expected rank.
Cell lines and compounds
The following cell lines were used in this study: murine KRASG12D/+; Trp53−/− (KP) lung cancer cells (kindly provided by Tyler Jacks and expressing luciferase (Luc)-green fluorescent protein (GFP) as described19), NALM6 and Eμ-ALL01 cells expressing firefly luciferase (FFLuc)-GFP37. Cells were maintained in a humidified incubator at 37C with 5%CO2. KP cells were grown in DMEM supplemented with 10% FBS and 100IU/ml penicillin/streptomycin. NALM6 and Eμ-ALL01 cells were grown in complete medium composed of RPMI supplemented with 10% FBS, 1% L-glutamine, 1% MEM non-essential amino acids, 1% HEPES buffer, 1% sodium pyruvate, 0.1% beta-mercapto-ethanol and 100UI/ml penicillin/streptomycin. Human primary melanocytes were grown in dermal cell basal medium (ATCC, 200–030) supplemented with the adult melanocyte growth kit (ATCC, 200–042), 10% FBS and 100IU/ml penicillin/streptomycin. All cell lines used were negative for mycoplasma.
For drug-induced senescence experiments in vitro, trametinib (S2673) and palbociclib (S1116) were purchased from Selleck Chemicals and dissolved in DMSO to yield 10mM stock solutions, which were stored at −80C19. Cells were treated with MEK inhibitor (25nM) and CDK4/6 inhibitor (500nM). Growth medium was changed every 2 days. For in vivo experiments trametinib was dissolved in a 5% hydroxypropyl methylcellulose and 2% Tween-80 solution (Sigma) and palbociclib was dissolved in sodium lactate buffer (pH 4) (as published in19). Mice were treated with 1 mg per kg body weight of trametinib and 150mg per kg body weight of palbociclib as previously described19. Cerulein was purchased from Bachem. Anakinra was purchased from Sobi and administered intraperitoneally at a dose of 30mg per kg twice per day for 8 days starting 24h before CAR T cell transfer. Anti-m.IL-6R (clone MP5–20F3) was purchased from BioXcell and administered intraperitoneally once per day at 25 mg per kg body weight for the first dose and 12.5mg per kg body weight for subsequent doses for 8 days starting 24h before CAR T cell transfer as previously described35.
Senescence-associated beta galactosidase (SA-β-gal) staining
SA-β-Gal staining was performed as previously described19 at pH 6.0 for human cells and tissue and at pH 5.5 for mouse cells and tissue. Fresh frozen tissue sections or adherent cells plated in 6-well plates were fixed with 0.5% glutaraldehyde in PBS for 15 minutes, washed with PBS supplemented with 1mM MgCl2 and stained for 5–8 hours in PBS containing 1mM MgCl2, 1mg/ml X-Gal, 5mM potassium ferricyanide and 5mM potassium ferrocyanide. Tissue sections were counterstained with eosin. 5 high power fields per well/ section were counted and averaged to quantify the percentage of SA-β-Gal+ cells.
qRT-PCR
Total RNA was isolated using the RNeasy Mini Kit (Qiagen) and complementary DNA (cDNA) was obtained using TaqMan reverse transcription reagents (Applied Biosystems). Real-time PCR was performed in triplicates using SYBR green PCR master mix (Applied Biosystems) on the ViiA 7 Real-Time PCR System (Invitrogen). GAPDH or B-actin served as endogenous normalization controls for mouse and human samples.
Mice
All mouse experiments were approved by the Memorial Sloan Kettering Cancer Center (MSKCC) Internal Animal Care and Use Committee. All relevant animal use guidelines and ethical regulations were followed. Mice were maintained under specific pathogen-free conditions, and food and water were provided ad libitum. The following mice were used: C57BL/6N background, NOD-scid IL2Rgnull (NSG) mice (purchased from The Jackson laboratory) and B6.SJL-Ptrca/BoyAiTac (CD45.1 mice) (purchased from Taconic). Mice were female and/or male and were used at 8–12 weeks of age (5–7 weeks old for the xenograft experiments and 6–10 weeks old for T cell isolation) and were kept in group housing. Mice were randomly assigned to the experimental groups.
Transposon-mediated intrahepatic gene transfer
Transposon-mediated intrahepatic gene transfer was performed as previously described4. In short, 8–12 week-old C57BL/6J mice received a saline solution at a final volume of 10% of their body weight containing 30ug of total DNA composed of a 5:1 molar ratio of transposon-encoding vector (containing either the sequence for NrasG12V or the sequence for the GTPase dead form NrasG12V;D38A) to transposase encoding vector (Sleeping Beauty 13) through hydrodynamic tail vein injection (HTVI). For CAR T cell studies, NSG mice were intravenously injected with 0.5×10⁶ human CAR+ T cells or untransduced T cells 10 days after HTVI and monitored by bioluminescence imaging usinig the IVIS Imaging System (PerkinElmer) with the Living Image software (PerkinElmer). At day 15 post CAR injection, mice were euthanized, livers were removed and used for further analysis.
Generation of murine Pancreatic Intraepithelial Neoplasias (PanIn)
The mice strain has been previously described48. To induce PanIn generation, KC;RIK (p48-Cre;RIK;LSLKrasG12D) male mice were treated with 8 hourly intraperitoneal injections of 80 μg/kg caerulein (Bachem) for 2 consecutive days. Mice were then harvested 21 weeks later and their pancreas used for further analysis. Age matched C;RIK mice injected with PBS were used as controls for normal pancreas.
In vivo induction of CCl4-induced liver fibrosis
C57BL/6N mice were treated twice a week with 12 consecutive intraperitoneal (i.p.) injections of 1ml/kg tetrachloride (CCl4) to induce liver fibrosis6,49. For murine CAR T cell studies, cyclophosphamide (200mg/kg) was administered 16–24 hours before T cell injection. Mice received 0.5–1 or 2–3×10⁶ CAR+ T cells or untransduced T cells (same total T cell numbers) and CCl4 was continuously administered at the same dose and interval after T cell injection until day 20 post CAR injection, when animals were sacrificed 48–72h after the last CCl4 injection. Blood was collected by facial vein puncture or cardiac puncture.
In vivo induction of NASH-induced liver fibrosis.
C57BL/6N mice were fed with NASH diet (Teklad. TD.160785 which contains 10.2% kcal from protein, 37.3% kcal from carbohydrate and 52.6% kcal from fat) and fructose containing drinking water (23.1g of fructose and 18.9 g of glucose dissolved in 1 liter of water and then filter sterilized) at 8–10 weeks of age50,51. Body weight was measured weekly. For murine CAR T cell studies, cyclophosphamide (200mg/kg) was administered 16 hours before T cell injection. Mice received 0.5 CAR+ T cells or untransduced T cells (same total T cell numbers) and they received the same NASH diet until day 20 post CAR injection when they were euthanized. Blood was collected by facial vein puncture or cardiac puncture.
For the STAM model52, liver tissue samples (unstained slides for immunohistochemistry) were purchased from SMC laboratories.
Patient-derived xenografts
Experiments with patient-derived xenografts were performed as described19, using 5–7 week-old female NSG mice. MSK-LX27 was derived from a lung adenocarcinoma harboring KRASG12D and p53 mutations and a deletion in CDKN2A and was cut into pieces and inserted in the subcutaneous space. Mice were monitored daily, weighed twice weekly and caliper measurements begun when tumors became visible. Tumors were measured using the formula: tumor volume = (D × d2)/2 and when they reached a size of 100–200 mm3, mice were randomized based on starting tumor volume and treated with vehicle or trametinib (3 mg/kg body weight) and palbociclib (150mg/kg body weight) per os for 4 consecutive days followed by 3 days off treatment. Experimental endpoints were achieved when tumors reached a size of 2000mm3 or became ulcerated. Tumors were harvested at the experimental endpoint and tissue was divided evenly for 10% formalin fixation and OCT frozen blocks.
Patient samples
De-identified human samples from liver biopsies of patients with liver fibrosis from viral (HBV or HCV), alcoholic and non-alcoholic fatty liver disease were obtained through the Department of Pathology at Mount Sinai Hospital, New York, NY. Human pancreatic intraepithelial neoplasia samples (PanINs) were obtained through the Department of Pathology at Memorial Sloan-Kettering. Human atherosclerosis samples were obtained through the Department of Pathology, Weill Medical College of Cornell University, New York, NY. All human studies comply with all relevant guidelines and ethical regulations and were approved by Mount Sinai, or Weill Medical College of Cornell University or Memorial Sloan-Kettering Institutional Review Board.
Histological analysis
Tissues were fixed overnight in 10% formalin, embedded in paraffin, and cut into 5μm sections. Sections were subjected to hematoxylin and eosin staining, and to Sirius red staining for fibrosis detection. For fibrosis quantification, at least three whole sections from each animal were scanned and the images were quantified using NIH ImageJ software. The amount of fibrotic tissue was calculated relative to the total analyzed liver area as previously described. Immunohistochemical and immunofluorescence stainings were performed following standard protocols. The following primary antibodies were used:), huPAR (R&D. AF807 Lot.BBS0318071. 1:50), muPAR (R&D. AF534 Lot.DCL0418021. 1:50), mNRAS (Santa Cruz. SC-31 Lot.A1020. 1:50), mSMA (abcam. Ab5694 Lot.GR283004–16. 1:50), mKATE (Evrogen. ab233 Lot.23301201267. 1:1000), hCD3 (abcam. ab5690 Lot.GR3220039–4. 1:100), myc-tag (Cell Signaling. 2276S Lot.24. 1:50), mKi-67 (abcam, ab16667 Lot.GR3305281–1. 1:200), mIL-6 (abcam. ab6672 Lot.GR3195128–19. 1:50), p16-INK4A (Proteintech. 10883–1-AP Lot.00057396. 1:50), mP-ERKT202/Y204 (Cell Signaling.4370 Lot.15. 1:800), desmin (ThermoFisher Scientific . RB-9014 Lot.9014p1806Q. 1:200), AF488 donkey anti-rabbbit (Invitrogen. A21206 Lot.1874771. 1:500), AF488 donkey anti-mouse (Invitrogen. A21202 Lot.1820538. 1:500), AF594 donkey anti-rabbit (Invitrogen. A21207 Lot.1602780. 1:500), AF594 donkey anti-mouse (Invitrogen A21203 Lot.1163390. 1:500), AF594 donkey anti-goat (Invitrogen. A11058 Lot.2045324. 1:500), AF594 goat anti-rat (Invitrogen A11007 Lot.1903506. 1:500).
Flow cytometry
For analysis of uPAR expression in cell lines upon induction of senescence, KP cells were treated with trametinib (25nM) and palbociclib (500nM) or with vehicle (DMSO), and human primary melanocytes were continuously passaged for 15 passages and then trypsinized, resuspended in PBS supplemented with 2%FBS and stained with the following antibodies for 30 minutes on ice: PE-conjugated anti-mouse uPAR antibody (R&D. FAB531P) or APC-conjugated anti-human uPAR antibody (Thermo Fisher S.17–3879-42). The following fluorophore-conjugated antibodies were used for in vitro and in vivo experiments in the indicated dilutions (‘h’ prefix denotes anti-human, ‘m’ prefix denotes anti-mouse): hCD45 APC-Cy7 (clone 2D1, BD, #557833, Lot: 9081815, 1:100), hCD4 BUV395 (clone SK3, BD, #563550, Lot: 6252529, 1:100), hCD4 BV480 (clone SK3, BD, #566104, Lot: 8092993, 1:50), hCD62L BV421 (clone DREG-56, BD, #563862, Lot: 8194954, 1:100), hCD45RA BV650 (clone HI100, BD, #563963, Lot: 9057952, 1:100), hPD1 BV480 (clone EH12.1, BD, #566112, Lot: 8235507, 1:100), hCD19 BUV737 (clone SJ25C1, BD, #564303, Lot: 8130572, 1:100), hCD271 PE (clone C40–1457, BD, #557196, Lot: 7068641, 1:100), hIL2 PE-Cy7 (clone MQ1–17H12, Invitrogen, #25–7029-42, Lot: 4336863, 1:50), hTNFa BV650 (clone Mab11, BD, #563418, Lot: 7082880, 1:50), hIFNg BUV395 (clone B27, BD, #563563, Lot: 6320836, 1:50) hTIM3 BV785 (clone F38–2E2, Biolegend, #345032, Lot: B265346, 1:100), hCD8 PE-Cy7 (clone SK1, eBioscience, #25–0087-42, Lot: 2066348, 1:100), hCD8 APC-Cy7 (clone SK1, BD, #557834, Lot: 7110951, 1:50), hCD223 PerCP-eFluor710 (clone 3DS223H, eBioscience, #46–2239-42, Lot: 4321735, 1:100), hGrB APC (clone GB12, Invitrogen, #MHGB05, Lot: 1884625, 1:67), hMyc-tag AF647 (clone 9B11, Cell Signaling Technology, #2233S, Lot: 23, 1:50), hCD19 PB (clone SJ25-C1, Invitrogen, #MHCD1928, 1:100), hCD87 APC (clone VIM5, eBioscience, #17–3879-42, Lot: 17–3879-42, 1:50), hCD87 PerCp-eFluor710 (clone VIM5, eBioscience, #46–3879-42, Lot: 46–2239-42, 1:50), muPAR PE (R&D Systems, FAB531P, Lot: ABLH0419081, 1:50), muPAR AF700 (R&D Systems, FAB531N, Lot: 1552229, 1:50), mCD45.1 APC-Cy7 (clone A20, Biolegend, #110716, Lot: B285685, 1:200), m.CD45.1 BV785 (clone A20, Biolegend, #110743, Lot: B270183, 1:100), mCD45.2 PE (clone 104, Biolegend, #109808, Lot: B271929, 1:100), mCD45.2 AF700 (clone 104, Biolegend, #109822, Lot: B252126, 1:200), mSiglec-F PerCP-Cy5.5 (clone E50–2440, BD, #565526, Lot: 8232650, 1:200), mI-A/I-E BV605 (clone M5/114.15.2, Biolegend, #107639, Lot: B293222, 1:50), mF4/80 BV421 (clone: T45–2342, BD, #565411, Lot: 8330526, 1:200), mCD11b BUV395 (clone: M1/70, BD, #563553, Lot: 8339988, 1:200), mCD11c BV650 (clone: N418, Biolegend, #117339, Lot: B253523, 1:200), mLY6G BV510 (clone: 1A8, Biolegend, #127633, Lot: B266675, 1:200), mLY6G APC/Fire750 (clone: 1A8, Biolegend, #127652, Lot: B274284, 1:100), miNOS PE-Cy7 (clone: CXNFT, eBioscience, #25–5920-82, Lot: 2127491, 1:200), mCD19 PE (clone 1D3/CD19, Biolegend, #152408, Lot: B260181, 1:100), mCD25 BV605 (clone: PC61, Biolegend, #102035, Lot: B291215, 1:50), mCD69 PerCpCy5.5 (clone: H1.2F3, Biolegend, #104522, Lot: B244018, 1:100), mCD3 AF488 (clone: 17A2, Biolegend, #100210, Lot: B284975, 1:100), mCD4 BUV395 (clone: GK1.5, BD, #563790, Lot: 9101822, 1:50), mCD4 FITC (clone: GK1.5, BD, #553729, Lot: 9204449, 1:50), mCD8 PE-Cy7 (Clone: 53–6.7, Biolegend, #100722, Lot: B282418, 1:50), 7-AAD (BD, #559925, Lot: 9031655, 1:40), DAPI (Life technologies D1306), Fixable Viability Dye eFluor 506 (65–0866-14, eBioscience, Lot: 2095423, 1:200) and LIVE/DEAD Fixable Violet (L34963, Invitrogen, Lot: 1985351, 1:100) were used as a viability dyes.
CAR staining was performed with Alexa Fluor 647 AffiniPure F(ab)2 Fragment Goat Anti-Rat IgG (Jackson ImmunoResearch, #112–6606-072). For cell counting, CountBright Absolute Counting Beads were added (Invitrogen) according to the manufacturer’s instructions. For in vivo experiments, Fc receptors were blocked using FcR Blocking Reagent, mouse (Miltenyi Biotec). For intracellular cytokine secretion assay, cells were fixed and permeabilized using Cytofix/Cytoperm Fixation/Permeabilization Solution Kit (BD Biosciences) or Intracelllar Fixation & Permeabilization Buffer Set Kit (eBioscience, #88–8824-00) according to the manufacturer’s instructions.
Flow cytometry was performed on a LSRFortessa instrument (BD Biosciences) or Cytek Aurora (CYTEK) and data were analyzed using FlowJo (TreeStar).
For in vivo sample preparation, livers were dissociated using MACS Miltenyi Biotec liver dissociation kit (130–1-5–807), filtered through a 100μm strainer, washed with PBS, and red blood cell lysis was achieved with an ACK (Ammonium-Chloride-Potassium) lysing buffer (Lonza). Cells were washed with PBS, resuspended in FACS buffer and used for subsequent analysis. Lungs were minced and digested with 1mg/ml collagenase type IV and DNase type IV in RPMI at 37C and 200rpm for 45 minutes, filtered through 100μm strainer, washed with PBS, and red blood cell lysis was achieved with an ACK lysing buffer (Lonza). Cells were washed with PBS, resuspended in FACS buffer and used for subsequent analysis. For bone marrow samples, tibia and femurs were mechanically disrupted with a mortar in PBS/2mM EDTA, filtered through 40μm strainer, washed with PBS/2mM EDTA and red blood cell lysis was achieved with an ACK lysing buffer (Lonza). Cells were washed with PBS/2mM EDTA, resuspended in FACS buffer and used for subsequent analysis. Spleens were mechanically disrupted with the back of a 5-ml syringe, filtered through 40μm strainer, washed with PBS/2mM EDTA and red blood cell lysis was achieved with an ACK lysing buffer (Lonza). Cells were washed with PBS/2mM EDTA, resuspended in FACS buffer and used for subsequent analysis.
Cytokine measurements
Serum cytokines were measured using cytometric bead arrays (BD) as per the manufacturer’s instructions.
Detection of suPAR levels
suPAR levels from cell culture supernatant or murine plasma were evaluated by enzyme-linked immunosorbent assay (ELISA) according to the manufacturer’s protocol (R&D systems, DY531 (mouse) or DY807 (human)).
Liver function tests
Serum alanine aminotransferase (ALT), aspartate aminotransferase (AST) and albumin levels in murine serum were measured according to the manufacturer’s protocol, using the EALT-100 (ALT), EASTR-100 (AST) and DIAG-250 (albumin) kits from BioAssay systems.
Isolation, expansion and transduction of human T cells
All blood samples were handled following the required ethical and safety procedures. Peripheral blood was obtained from healthy volunteers and buffy coats from anonymous healthy donors were purchased from the New York Blood Center. Peripheral blood mononuclear cells were isolated by density gradient centrifugation. T cells were purified using the human Pan T Cell Isolation Kit (Miltenyi Biotec), stimulated with CD3/CD28 T cell activator Dynabeads (Invitrogen) as described37 and cultured in X-VIVO 15 (Lonza) supplemented with 5% human serum (Gemini Bio-Products), 5ng/ml interleukin-7 and 5ng/ml interleukin-15 (PeproTech). T cells were enumerated using an automated cell counter (Nexcelom Bioscience).
48 hours after initiating T cell activation, T cells were transduced with retroviral supernatants by centrifugation on RetroNectin-coated plates (Takara). Transduction efficiencies were determined 4 days later by flow cytometry and CAR T cells were adoptively transferred into mice or used for in vitro experiments.
Isolation, expansion and transduction of mouse T cells
B6.SJL-Ptrca/BoyAiTac mice (CD45.1 mice) were euthanized and spleens were harvested. Following tissue dissection and red blood lysis, primary mouse T cells were purified using the mouse Pan T cell Isolation Kit (Miltenyi Biotec). Purified T cells were cultured in RPMI-1640 (Invitrogen) supplemented with 10% fetal bovine serum (FBS; HyClone), 10 mM HEPES (Invitrogen), 2 mM L-glutamine (Invitrogen), MEM nonessential amino acids 1× (Invitrogen), 55 uM β-mercaptoethanol, 1 mM sodium pyruvate (Invitrogen), 100 IU/ mL of recombinant human IL-2 (Proleukin; Novartis) and mouse anti-CD3/28 Dynabeads (Gibco) at a bead:cell ratio of 1:2. T cells were spinoculated with retroviral supernatant collected from Phoenix-ECO cells 24 hours after initial T cell expansion as described33,53 and used for functional analysis 3–4 days later.
Genetic modification of T cells
The human and murine SFG γ-retroviral m.uPAR-28ζ plasmids were constructed by stepwise Gibson Assembly (New England BioLabs) using the SFG-1928ζ backbone as previously described29,54–56. The amino acid sequence for the single-chain variable fragment (scFv) specific for mouse uPAR was obtained from the heavy and light chain variable regions of a selective monoclonal antibody against mouse uPAR (R&D.MAB531–100) through Mass Spectometry performed by Bioinformatics Solutions,Inc. In the human SFG-m.uPAR-h28z CARs, the m.uPAR scFv is thus preceded by a human CD8a leader peptide and followed by CD28 hinge-transmembrane-intracellular regions, and CD3ζ intracellular domains linked to a P2A sequence to induce coexpression of truncated low-affinity nerve growth factor receptor (LNGFR). In the mouse SFG-m.uPAR-m28z CARs, the m.uPAR scFv is preceded by a murine CD8a leader peptide and followed by the Myc-tag sequence (EQKLISEEDL), murine CD28 transmembrane and intracellular domain and murine CD3ζ intracellular domain33.
Plasmids encoding the SFGγ retroviral vectors were used to transfect gpg29 fibroblasts (H29) in order to generate VSV-G pseudotyped retroviral supernatants, which were used to construct stable retroviral-producing cell lines as described29,33. For T cell imaging studies, murine T cells were transduced with retroviral supernatants encoding SFG-green fluorescent protein (GFP)/ click beetle red luciferase (CBRluc)57.
Cytotoxicity assays
The cytotoxicity of CAR T cells was determined by standard luciferase-based assays or by calcein-AM based cytotoxicity assays. For luciferase-based assays, target cells expressing firefly luciferase (FFLuc-GFP) were co-cultured with T cells in triplicates at the indicated effector:target ratios using black-walled 96 well plates with 5×10⁴ (for NALM6 and Eμ-ALL01) or 1.5×10⁴ (for KP) target cells in a total volume of 100ul per well in RPMI or DMEM media, respectively. Target cells alone were plated at the same cell density to determine the maximal luciferase expression (relative light units (RLU)) and maximum release was determined by addition of 0.2% Triton-X100 (Sigma). 4 or 18 hours later, 100μl luciferase substrate (Bright-Glo; Promega) was directly added to each well. Emitted light was detected in a luminescence plate reader. Lysis was determined as (1-(RLUsample)/(RLUmax))×100. For calcein-AM based assays, target cells (NALM6) were loaded with 20μM calcein-AM (Thermo Fisher Scientific) for 30 minutes at 37C, washed twiced, and co-incubated with T cells in triplicates at the indicated effector:target ratios in 96 well-round-bottomed plates with 5×10³ target cells in a total volume of 200ul per well in complete medium. Target cells alone were plated at the same cell density to determine spontaneous release and maximum release was determined by incubating the targets with 0.2% Triton-X100 (Sigma). After a 4-hours coculture, supernatants were harvested and free calcein was quantitated using a Spark plate reader (Tecan). Lysis was calculated as: ((experimental release – spontaneous release)/(maximum release – spontaneous release))x100.
Statistical analysis and figure preparation
Data are presented as means±s.e.m. or means±s.d. Statistical analysis was performed by Student’s t-test using GraphPad Prism 6.0 or 7.0 (GraphPad Software). P-values <0.05 were considered to be statistically significant. Survival was determined using the Kaplan-Meier method. No statistical method was used to predetermine sample size in animal studies. Animals were allocated at random to treatment groups. Figures were prepared using Biorender.com for scientific illustrations and Illustrator CC 2019 (Adobe).
Extended Data
Extended Data Fig.1|. Genes coding for surface molecules commonly upregulated in senescence.
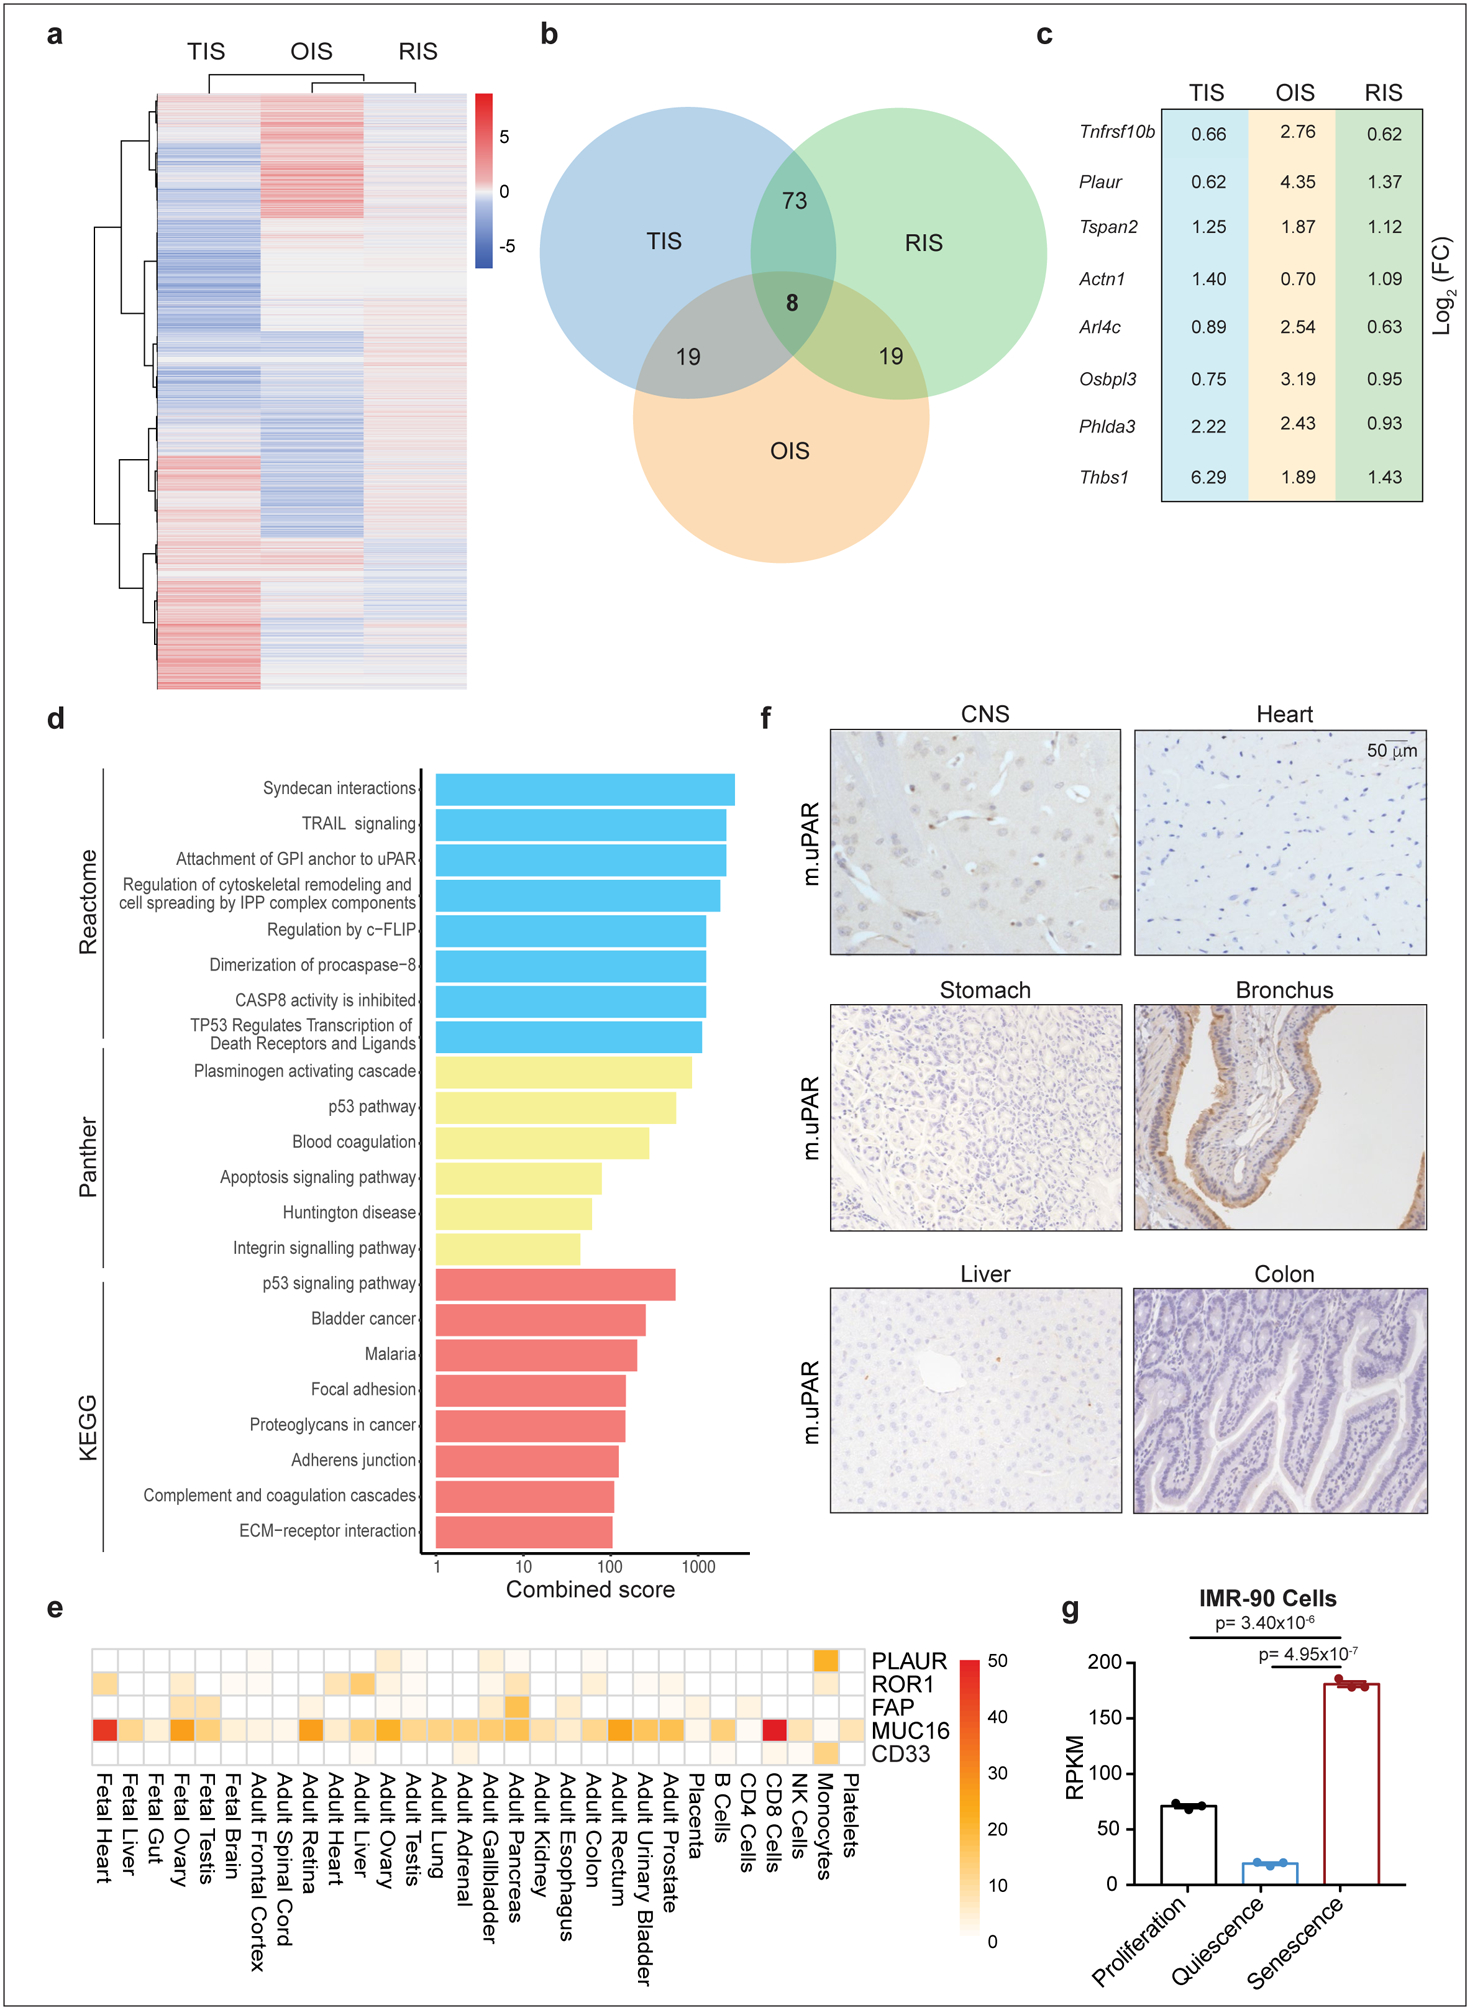
(a) Heatmap of genes upregulated upon therapy-induced senescence (TIS), oncogene-induced senescence (OIS) or p-53 induced senescence in hepatic stellate cells (HSCs). (b) Venn diagram displaying the number of common genes upregulated in the three databases shown in (a). (c) Log2 fold change of the eight commonly upregulated genes in the three different datasets shown in (a). (d) Combined enrichment score of significantly enriched gene sets among the 8 commonly upregulated genes in senescence. (e) Heatmap showing the expression profile of human uPAR (PLAUR) in human vital tissues as determined by the Human Proteome Map (HPM) compared to the expression profiles of other targets of CAR T cells in current clinical trials. (f) Immunohistochemical staining of murine uPAR (m.uPAR) in vital tissues of C57BL/6J mice. Representative results of 2 independent experiments. (g) Reads Per Kilobase (RPKM) of PLAUR mRNA in proliferating, quiescent (induced by serum starvation) or senescent (triggered by HRASG12V overexpression) human fibroblasts IMR-90. Results of 1 independent experiment with n=3 replicates for proliferating, quiescent and senescent conditions. Data represent mean± SEM. Two-tailed unpaired Student’s t-test.
Extended Data Fig.2|. uPAR is a cell surface and secreted biomarker of senescence.
(a-b) qRT-PCR of SASP gene expression in senescent versus proliferating (a) KRASG12D;p53−/− (KP) tumor cells or (b) human primary melanocytes and representative SA-β-Gal stainings. (c-e) Co-immunofluorescence stainings and quantifications of (c) m.uPAR (red) and ki-67 (green) or (d) m.uPAR (red) and IL6 (green) and (e) immunohistochemical staining of m.uPAR or P-ERK in serial sections in murine livers 6 days after hydrodynamic tail vein injection (HTVI) with a plasmid encoding NRASG12V. Representative results of 2 independent experiments (n=3 mice per group). (f-i) Mice expressing endogenous KRASG12D in pancreatic epithelial cells were treated with cerulean (Cr) and harvested 21 weeks afterwards when they had developed PanINs. Mice with normal pancreas (KRAS WT PBS) were used as controls. (f) Co-immunofluorescence staining of KATE (red) and m.uPAR (green). Representative results of 2 independent experiments (n=3 mice per group). (g) Levels of soluble uPAR (suPAR) in the mice shown in (f). Representative results of 2 independent experiments (n=2 mice per group). (h) Co-immunofluorescence stainings and quantifications of m.uPAR (red) and ki-67 (green). Representative results of 2 independent experiments (n=3 mice per group). (i) Representative SA-β-Gal staining. Representative results of 1 independent experiment (n=3 mice per group). (j-m) Mice were treated with either vehicle or CCl4 semiweekly for 6 weeks to induce liver fibrosis. (j) Fold change in the serum levels of suPAR. Representative results of 2 independent experiments (Vehicle: n=4, CCl4: n=9 mice per group). (k) Co-immunofluorescence staining and quantification of m.uPAR (red) and ki-67 (green). Representative results of 2 independent experiments (n=2 mice per group). (l) Co-immunofluorescence staining and quantification of m.uPAR (red) and IL-6 (green). Representative results of 2 independent experiments (n=3 mice per group). (m) Representative SA-β-Gal staining. Representative results of 2 independent experiments (n=3 mice per group). (j) Two-tailed unpaired Student’s t-test. Data represent mean± SEM (c,d,h,j,l).
Extended Data Fig.3|. uPAR is a marker of senescence in senescence-associated human pathologies.
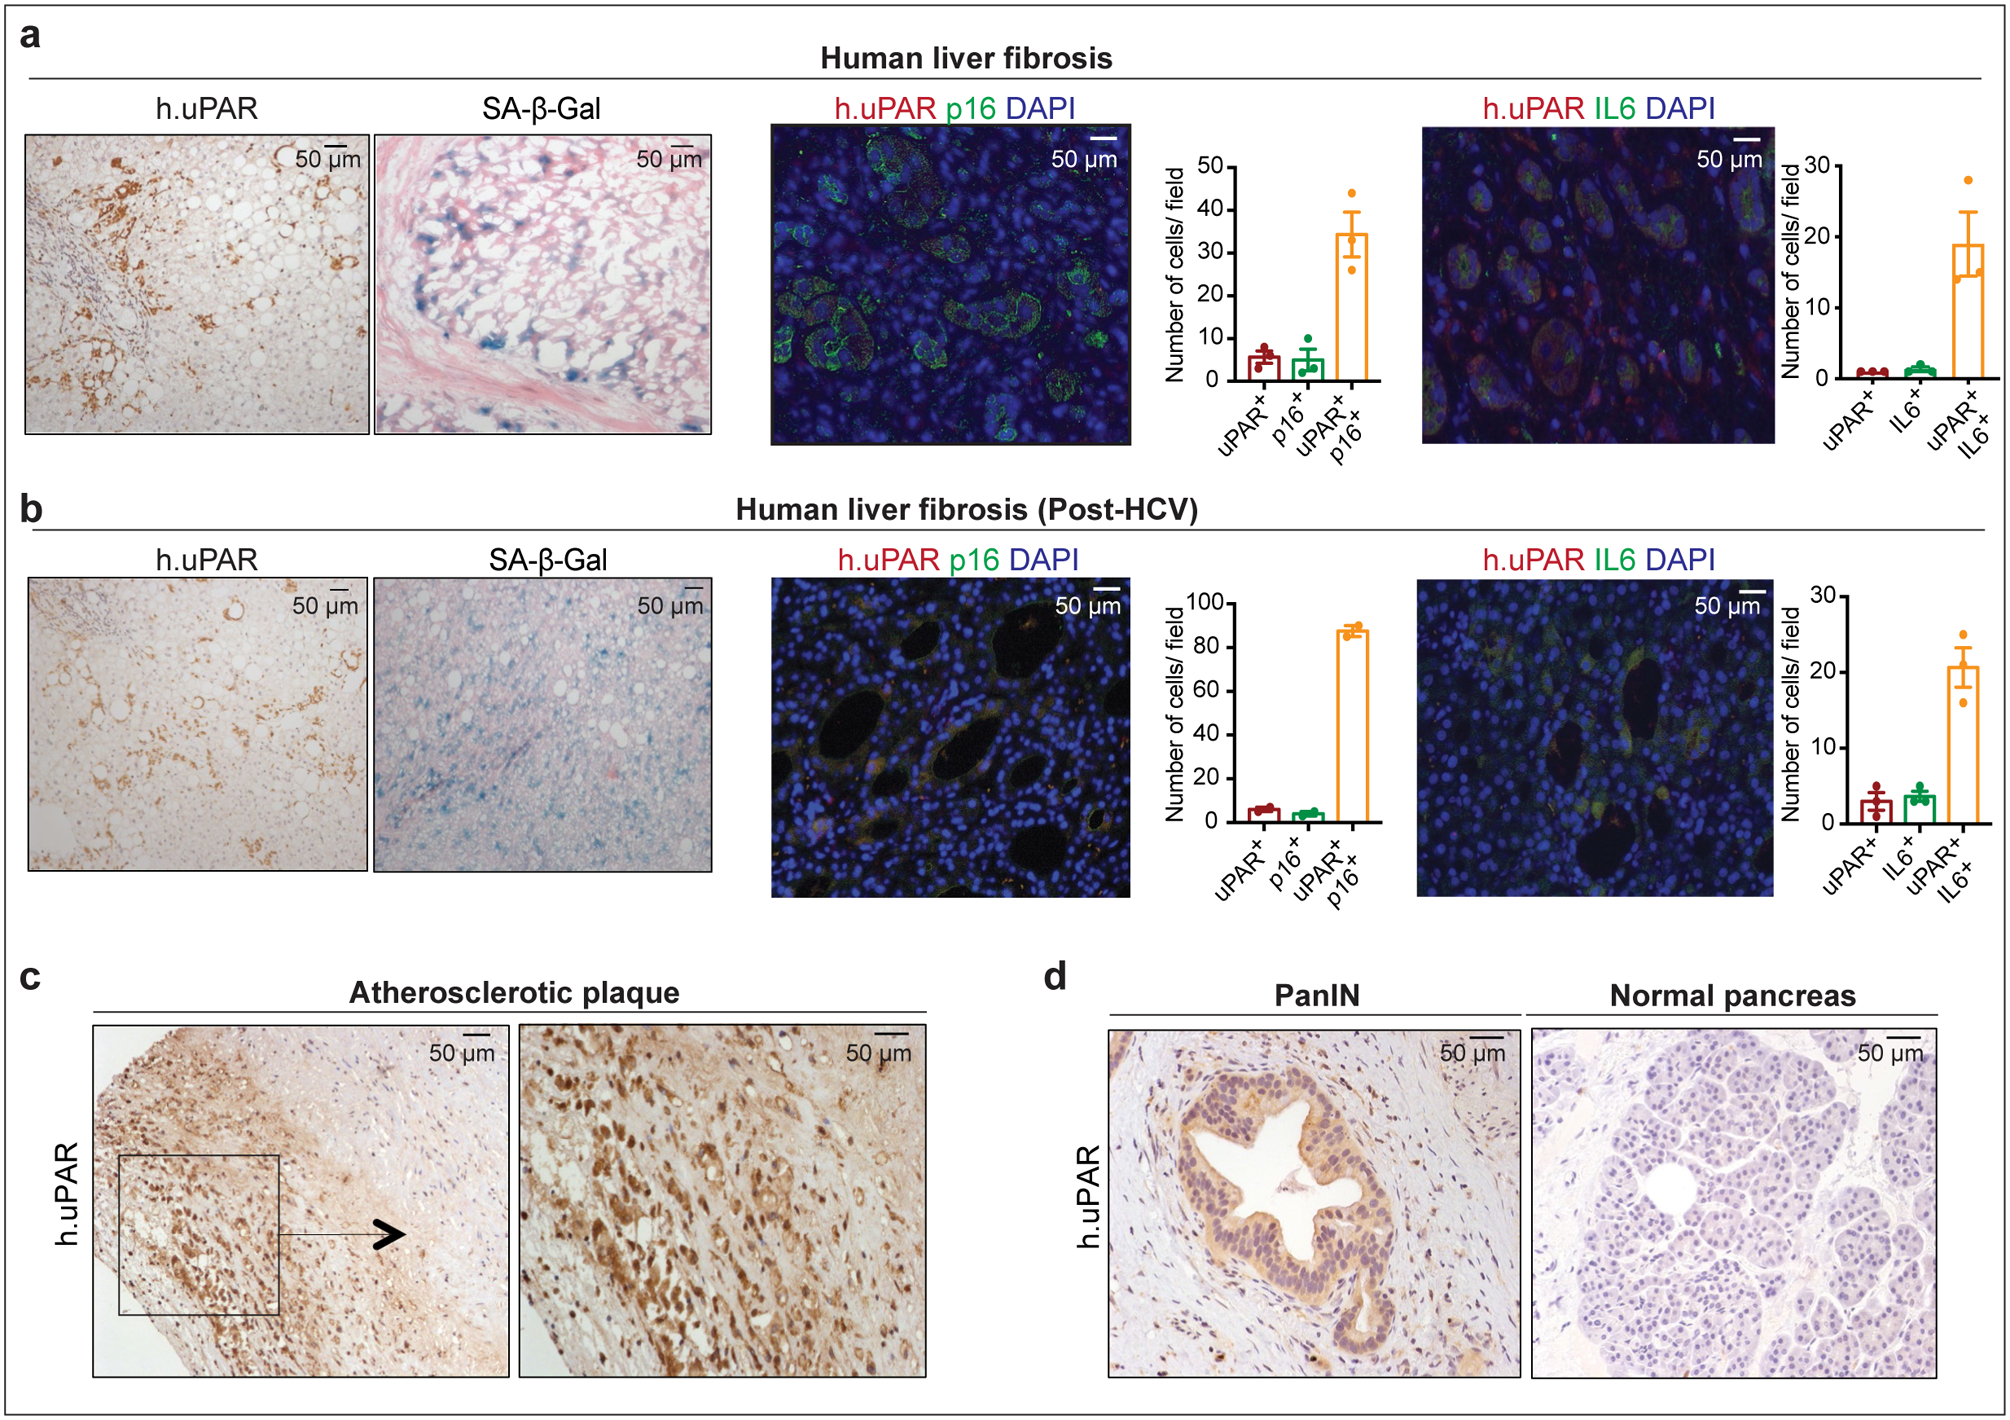
(a) Immunohistochemical expression of human uPAR (h.uPAR) and SA-β-Gal in human samples of hepatitis-induced liver fibrosis (n=7 patients). Co-immunofluorescence staining and quantification of human uPAR (red) and p16 (green) or human uPAR (red) and IL6 (green) in human samples of hepatitis-induced liver fibrosis (n=3). (b) Immunohistchemical expression of human uPAR (h.uPAR) and SA-β-Gal in human samples from patients with eradicated hepatitis C virus (HCV) and residual liver fibrosis (n=7 patients). Co-immunofluorescence staining and quantification of human uPAR (red) and p16 (green) or human uPAR (red) and IL6 (green) in human samples of HCV-induced liver fibrosis (n=3). (c) Immunohistochemical stainings of human uPAR (h.uPAR) in human carotid endarterectomy samples (n= 5 patients). (d) Immunohistochemical stainings of human uPAR (h.uPAR) in human pancreas bearing pancreatic intraepithelial neoplasia (PanINs) compared to normal pancreas controls (n= 3 patients). (a,b) Data represent mean± SEM.
Extended Data Fig.4|. uPAR-28z CAR T cells selectively target uPAR positive cells.
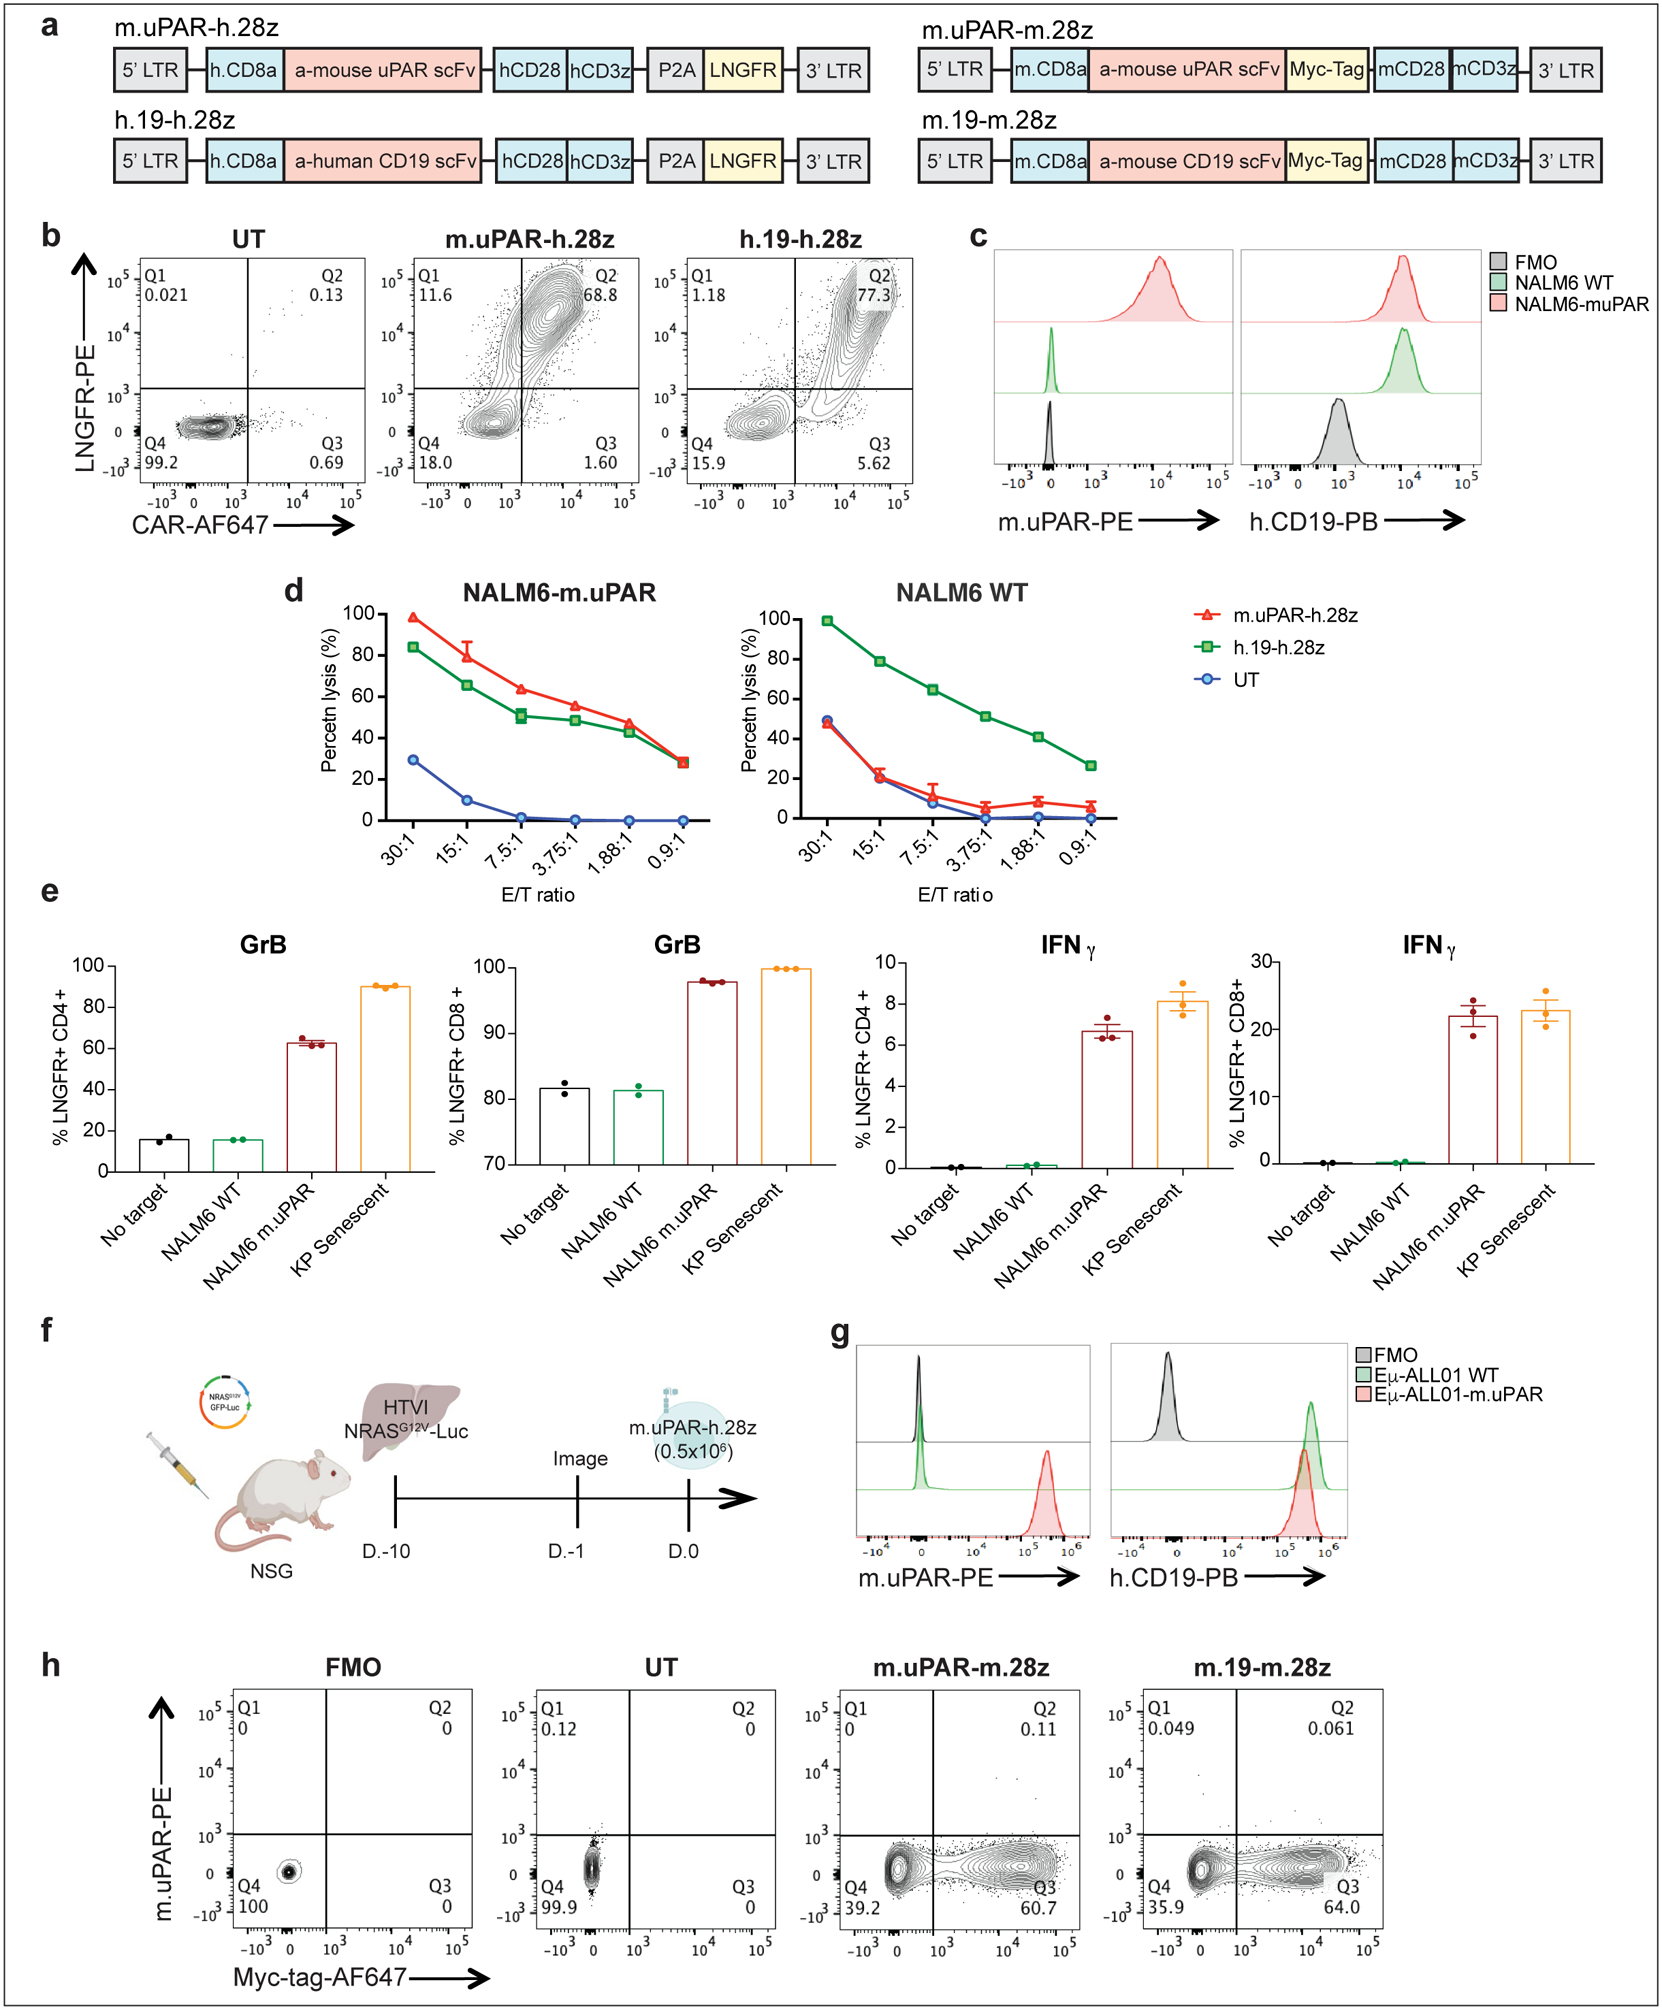
(a) Construct maps encoding human m.uPAR-h.28z and h.CD19-h.28z CAR T cells or murine m.uPAR-m.28z and m.CD19-m.28z CARs. (b) Flow cytometric analysis showing expression levels of CAR and LNGFR for m.uPAR-h.28z and h.19-h.28z CAR T cells compared to untransduced (UT) T cells. Representative results of 4 independent experiments. (c) Flow cytometric analysis of murine uPAR and human CD19 expression on wild type NALM6 cells and on NALM6 cells overexpressing murine uPAR (NALM6-m.uPAR). Representative results of 3 independent experiments. (d) Cytotoxic activity of m.uPAR-h.28z, h.19-h.28z and untransduced (UT) T cells as determined by 4hr-Calcein assay with firefly luciferase (FFL)-expressing NALM6 WT or NALM6-m.uPAR as targets. Representative results of n=3 independent experiments performed in triplicates. Data are mean± SEM. (e) Granzyme B (GrB) and Interferon γ (IFNγ) expression on CD4+ and CD8+ m.uPAR-h.28z or h.19-h.28z CAR T cells 18 hours after co-culture with NALM6 WT, NALM6-m.uPAR or senescent KrasG12D;p53−/− (KP) cells as determined by intracellular cytokine staining. Results of n=1 independent experiment (no target: n=2, NALM6 WT: n=2, NALM6-m.uPAR: n=3 and KP senescent: n=3 replicates). Data are mean± SEM. (f) Experimental layout for Fig.2 (c-i): mice were injected with a plasmid encoding NRASG12V-GFP-Luciferase and treated with 0.5×10⁶ m.uPAR-h.28z CAR T cells or untransduced (UT) T cells 10 days after injection. Mice were euthanized 15 days after CAR administration and livers were used for further analysis. Images were created with Biorender.com. (g) Flow cytometric analysis of murine uPAR and CD19 on wild type (WT) Eμ-ALL01 cells and on Eμ-ALL01 cells overexpressing m.uPAR (Eμ-ALL01-m.uPAR). Representative results of 3 independent experiments. (h) Flow cytometric staining of Myc-tag and m.uPAR on m.uPAR-m.28z, m.CD19-m.28z and UT T cells as compared to FMO control. Representative results of 2 independent experiments.
Extended Data Fig.5|. Senolytic CAR T cells target senescent cells in a KrasG12D -driven model of lung cancer.
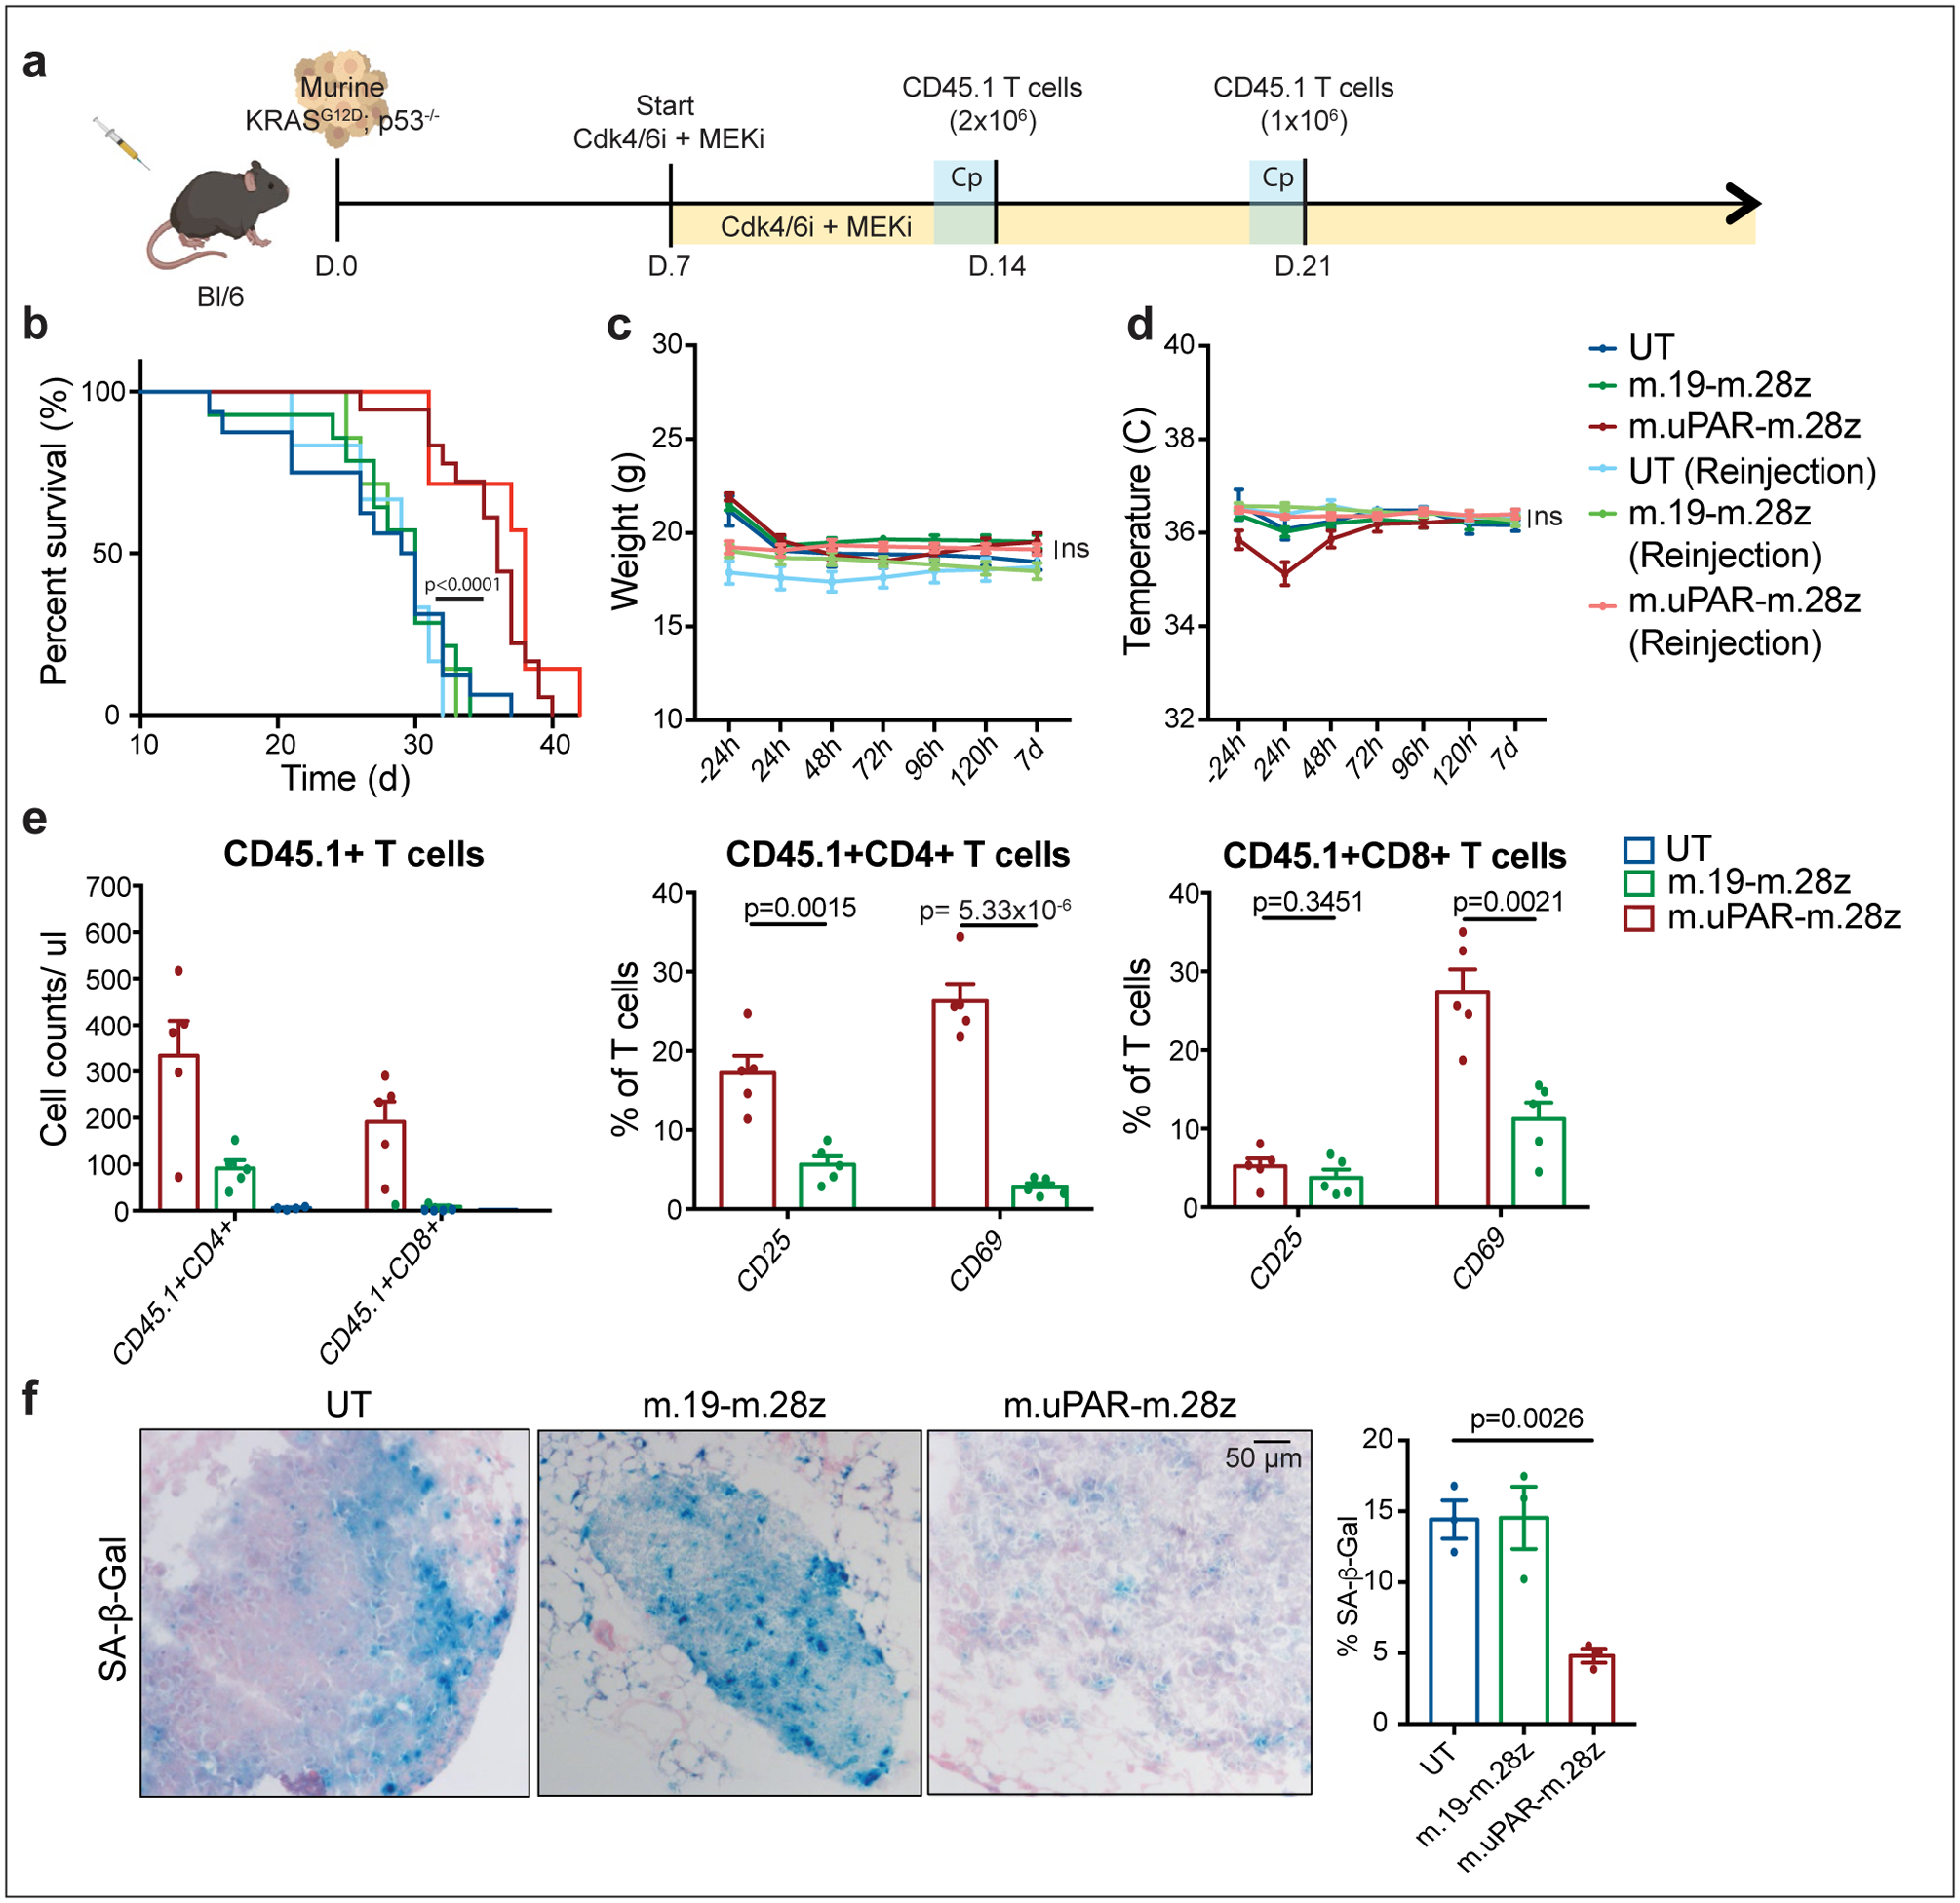
(a) Experimental layout: C57BL/6N mice were tail vein injected with 10.000 KrasG12D;p53−/− cells. Treatment with combined MEK (1mg/kg body weight) and Cdk4/6 inhibitors (100 mg/kg body weight) was initiated 7 days later, followed by adoptive transfer of 2×10⁶ CD45.1+ T cells (m.uPAR-m.28z CAR T cells, m.19-m.28z CAR T cells or untransduced (UT) T cells) one week later. A subset of mice received a second infusion of either 1×10⁶ m.uPAR-m.28z CAR T cells, m.19-m.28z CAR T cells or UT T cells 7 days after the first T cell injection. Images of the mouse, tumor cells and CAR T cells were created with Biorender.com. (b) Kaplan-Meier curve showing survival of mice and log-rank (Mantel Cox) test. Results of 2 independent experiments (UT: n=16, m.19-m.28z: n=14, m.uPAR-m.28z: n=18, UT reinjection: n=6, m.19-m.28z reinjection: n=7 and m.uPAR-m.28z reinjection: n=7 mice). (c-d) Weight (g) (c) and temperature (C) (d) as measured 24h before and at different time points after CAR T cell infusion. P values refer to the comparison between UT and m.uPAR-m.28z injected mice at 48h (weight: p=0.9329; temperature: p=0.1534). Results of 1 independent experiment (UT: n=5, m.19-m.28z: n=5, m.uPAR-m.28z: n=8, UT reinjection: n=5, m.19-m.28z reinjection: n=7 and m.uPAR-m.28z reinjection: n=7 mice). (e) Cell counts of CD45.1+ T cells and expression of activation markers CD25 or CD69 (UT: n=4, m.19-m.28z: n=5, m.uPAR-m.28z: n=5 mice) on CD45.1+ T cells in the lungs of mice 7 days after administration of m.uPAR-m.28z, m.19-m.28z or UT T cells. (f) Representative SA-β-Gal staining and quantification in the lungs of mice 7 days after treatment with m.uPAR-m.28z CAR T cells compared to mice treated with m.19-m.28z CAR T cells or UT T cells (n=3 mice per group). (b) Log-rank (Mantel Cox) test one-sided. (c-g) Data represent mean± SEM. Two-tailed unpaired Student’s t-test.
Extended Data Fig.6|. Senolytic CAR T cells show therapeutic activity in CCl4-induced liver fibrosis.
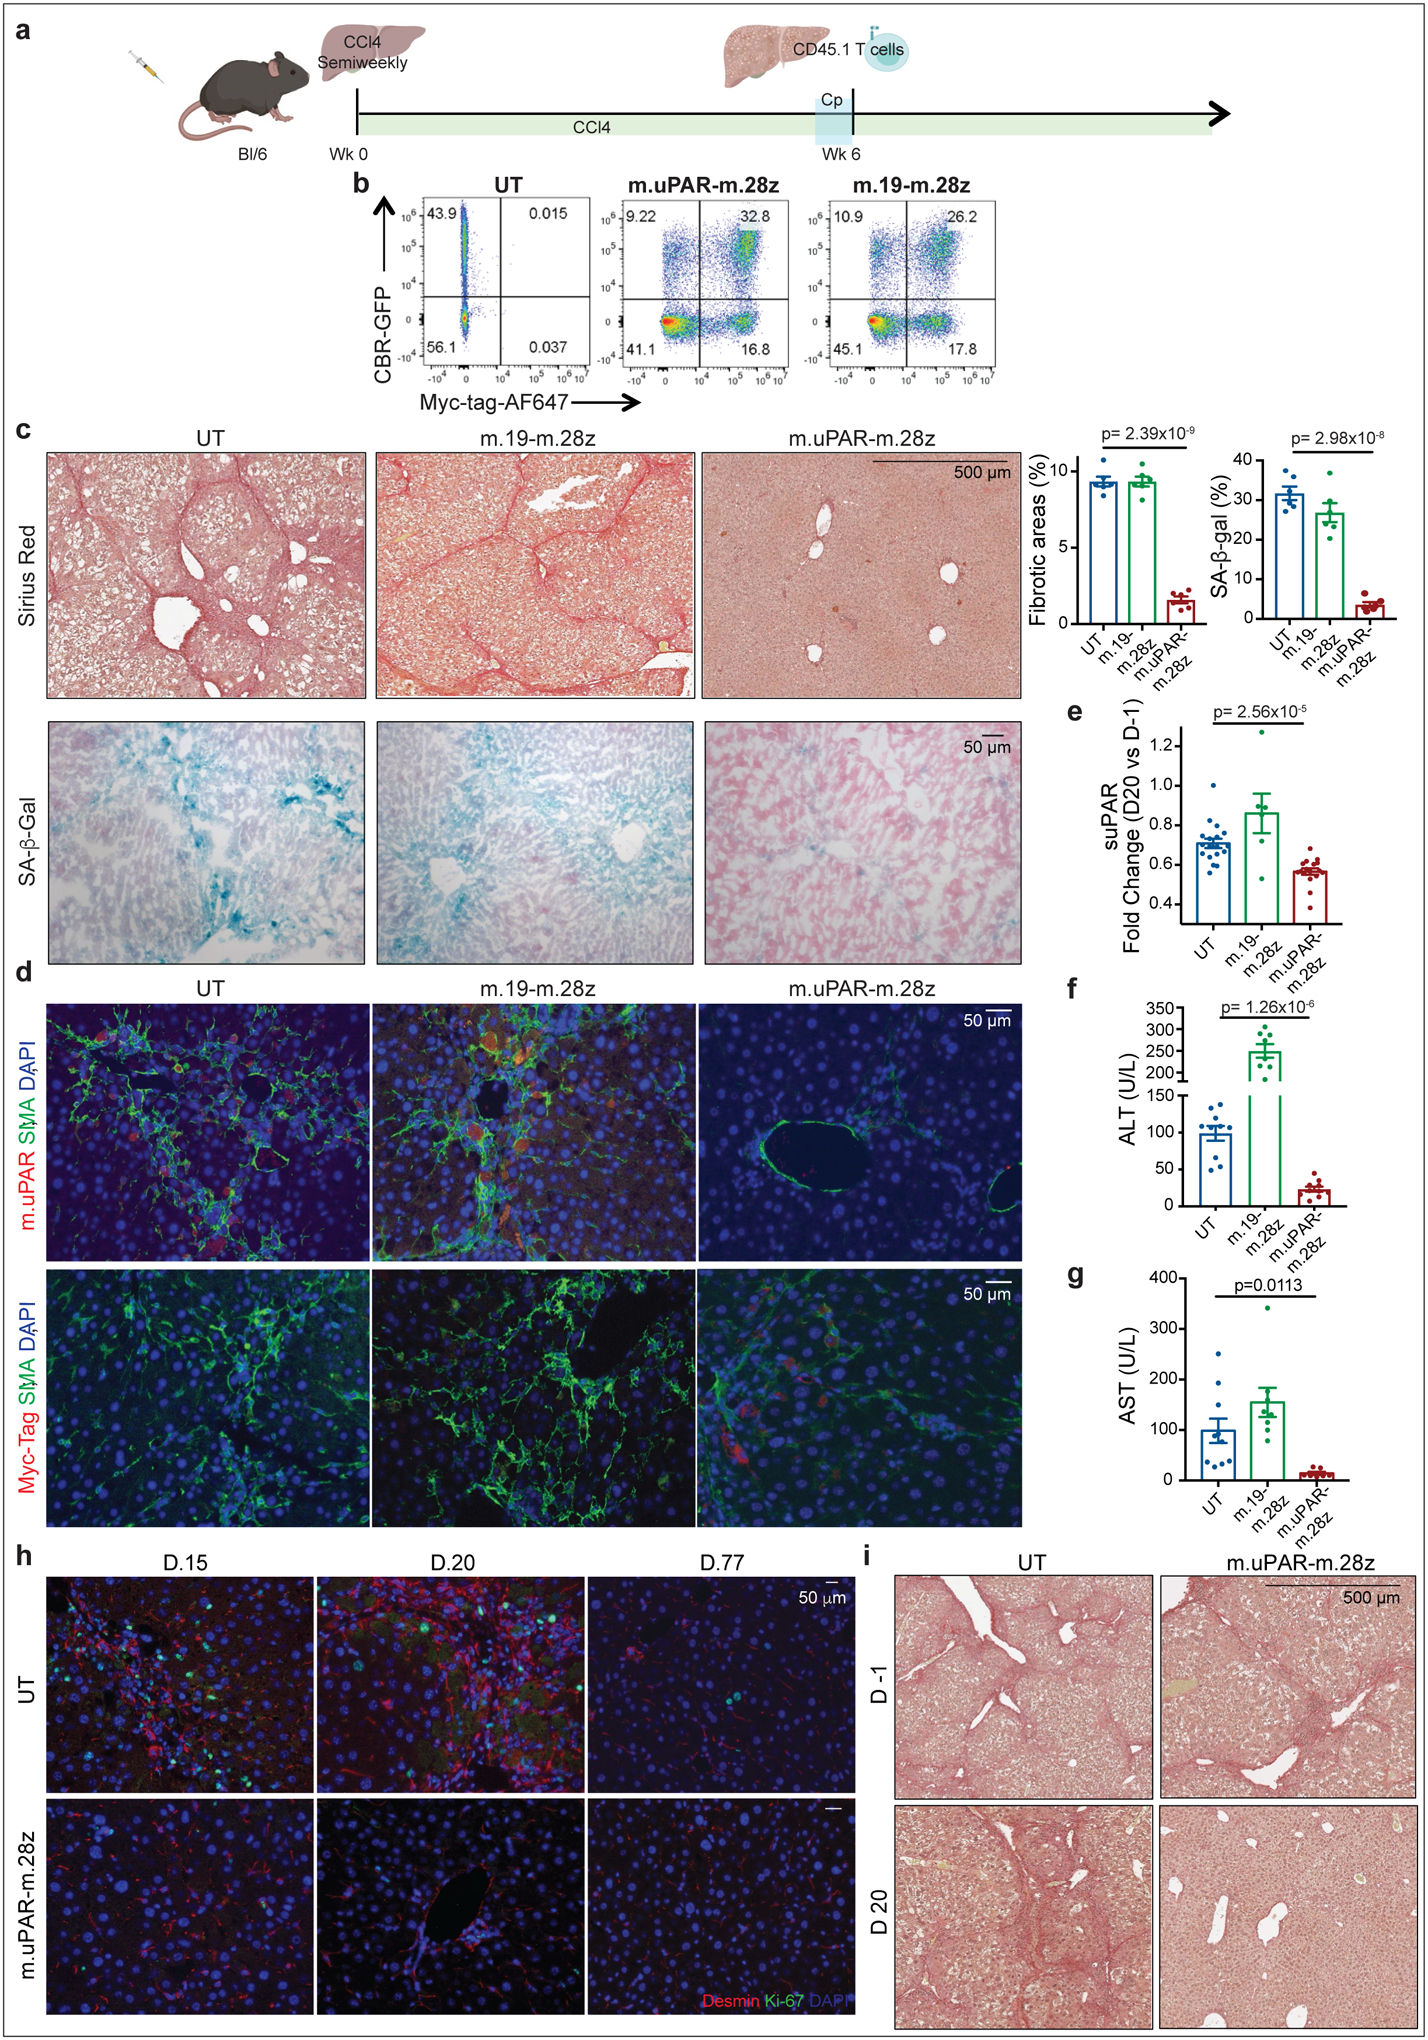
(a) Layout for experiments performed using the CCl4-induced liver fibrosis model: C57BL/6N mice received semiweekly intraperitoneal infusions of CCl4 for 6 weeks and were intravenously infused with 0.5–1×10⁶ (Fig. 3) or 2–3×10⁶ (Extended Data Fig. 6c-i) murine m.uPAR-m.28z CAR T cells, m.19-m.28z CAR T cells or untransduced (UT) T cells 16–24hr after cyclophosphamide (200mg/kg) administration. Mice were euthanized 20 days after CAR infusion to assess liver fibrosis. Images were created with Biorender.com. (b) Expression of GFP/click beetle red (CBR) luciferase and Myc-tag for m.uPAR-m.28z and m.19-m.28z CAR T cells used for T cell imaging experiments (Fig. 3g-h) as compared to control T cells. Representative results of 2 independent experiments. (c) Sirius red and SA-β-Gal staining and quantifications of livers from treated mice (n=6 mice per group). (d) Co-immunofluorescence of m.uPAR (red) and smooth muscle actin (green) or Myc-tag (red) and smooth muscle actin (green) in the livers of treated mice. (e) Fold change difference in serum levels of soluble (suPAR) 20 days after CAR T cell treatment as compared to day −1 before CAR T cell injection (UT: n=18 mice, m.19-m.28z: n=6, m.uPAR-m.28z: n=17). (f-g) Levels of serum alanine aminotransferase (ALT) (U/L) (f) and levels of serum aspartate aminotransferase (AST) (U/L) (g) 20 days after CAR treatment (UT: n=10 mice, m.19-m.28z: n=8, m.uPAR-m.28z: n=10). (h) Co-immunofluorescence staining of desmin (red) and ki-67 (green) in the livers of mice 15, 20 and 77 days after CAR T cell treatment. CCl4 treatment was stopped 20 days after T cell infusion (n=3 mice per group). (i) Mice were treated with CCl4 for 10 weeks. Sirius red staining of the livers of mice before (d.−1) and 20 days after T cell administration (UT: n=4 mice, m.uPAR-m.28z: n=2). (c-g) Representative results of 2 independent experiments. All data represent mean± SEM. (c, e-g) Two-tailed unpaired Student’s t-test.
Extended Data Fig.7|. Safety profile of m.uPAR-m.28z CAR T cells at therapeutic T cell doses.
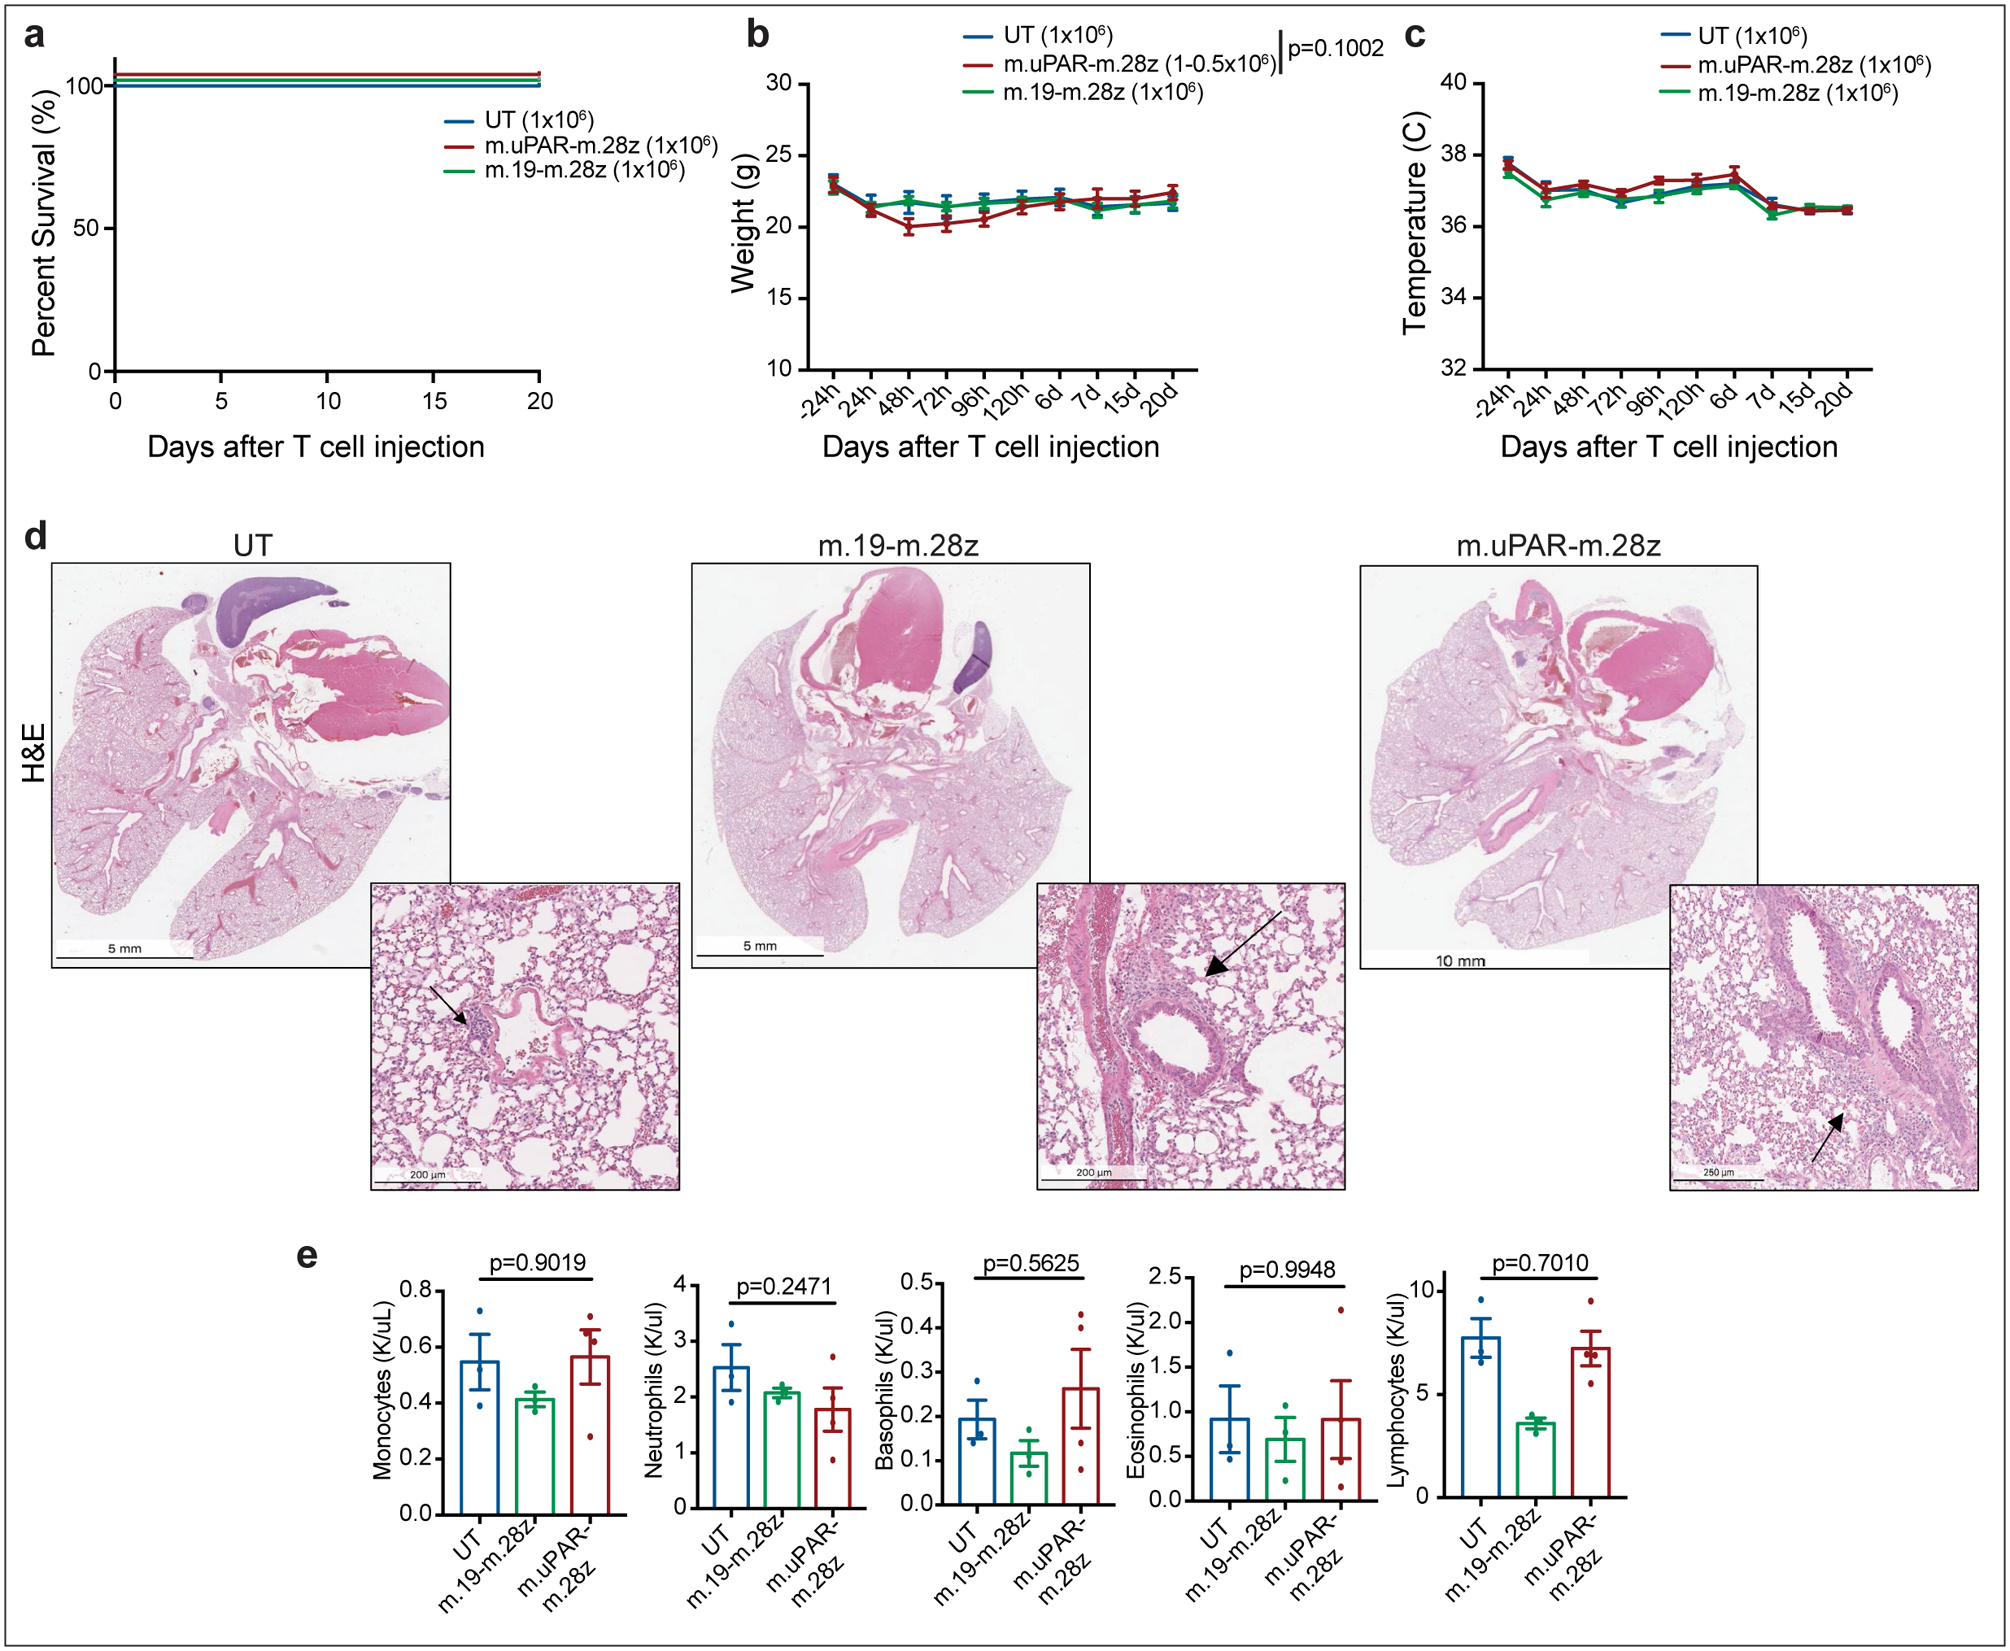
(a)-(e) C57BL/6N mice received semiweekly intraperitoneal (ip) infusions of CCl4 for 6 weeks and were intravenously (iv) injected with 0.5–1×10⁶ murine m.uPAR-m.28z CAR T cells, 1×10⁶ murine m.19-m.28z CAR T cells or untransduced (UT) T cells 16hr after cyclophosphamide (200mg/kg) administration. Mice were euthanized 20 days after T cell administration to assess potential toxicities and lung histopathology. (a) Kaplan-Meier curve showing survival of mice after treatment with either m.uPAR-m.28z (n=16 mice), m.19-m.28z CAR T cells (n=6) or UT T cells (n=6). (b-c) Weight (g) shown in (b) and temperature (C) shown in (c) of mice as measured before and at different time points after T cell infusion (UT and m.19-m.28z: n=6 mice; m.uPAR-m28z: n=7). P value in (b) refers to differences in weight at 48h. (d-e) Representative hematoxylin and eosin (H&E) stainings of lungs (d) and complete blood counts (e) of treated mice 20 days after T cell infusion (UT and m.19-m.28z: n=3–4 mice; m.uPAR-m28z: n=4). Increased macrophage accumulation was observed in the immunodeficient setting. (a-e) Representative results of 1 independent experiment. All data represent mean± SEM. (b, e) Two-tailed unpaired Student’s t-test.
Extended Data Fig.8|. Safety profile of m.uPAR-m.28z CAR T cells at supratherapeutic T cell doses.
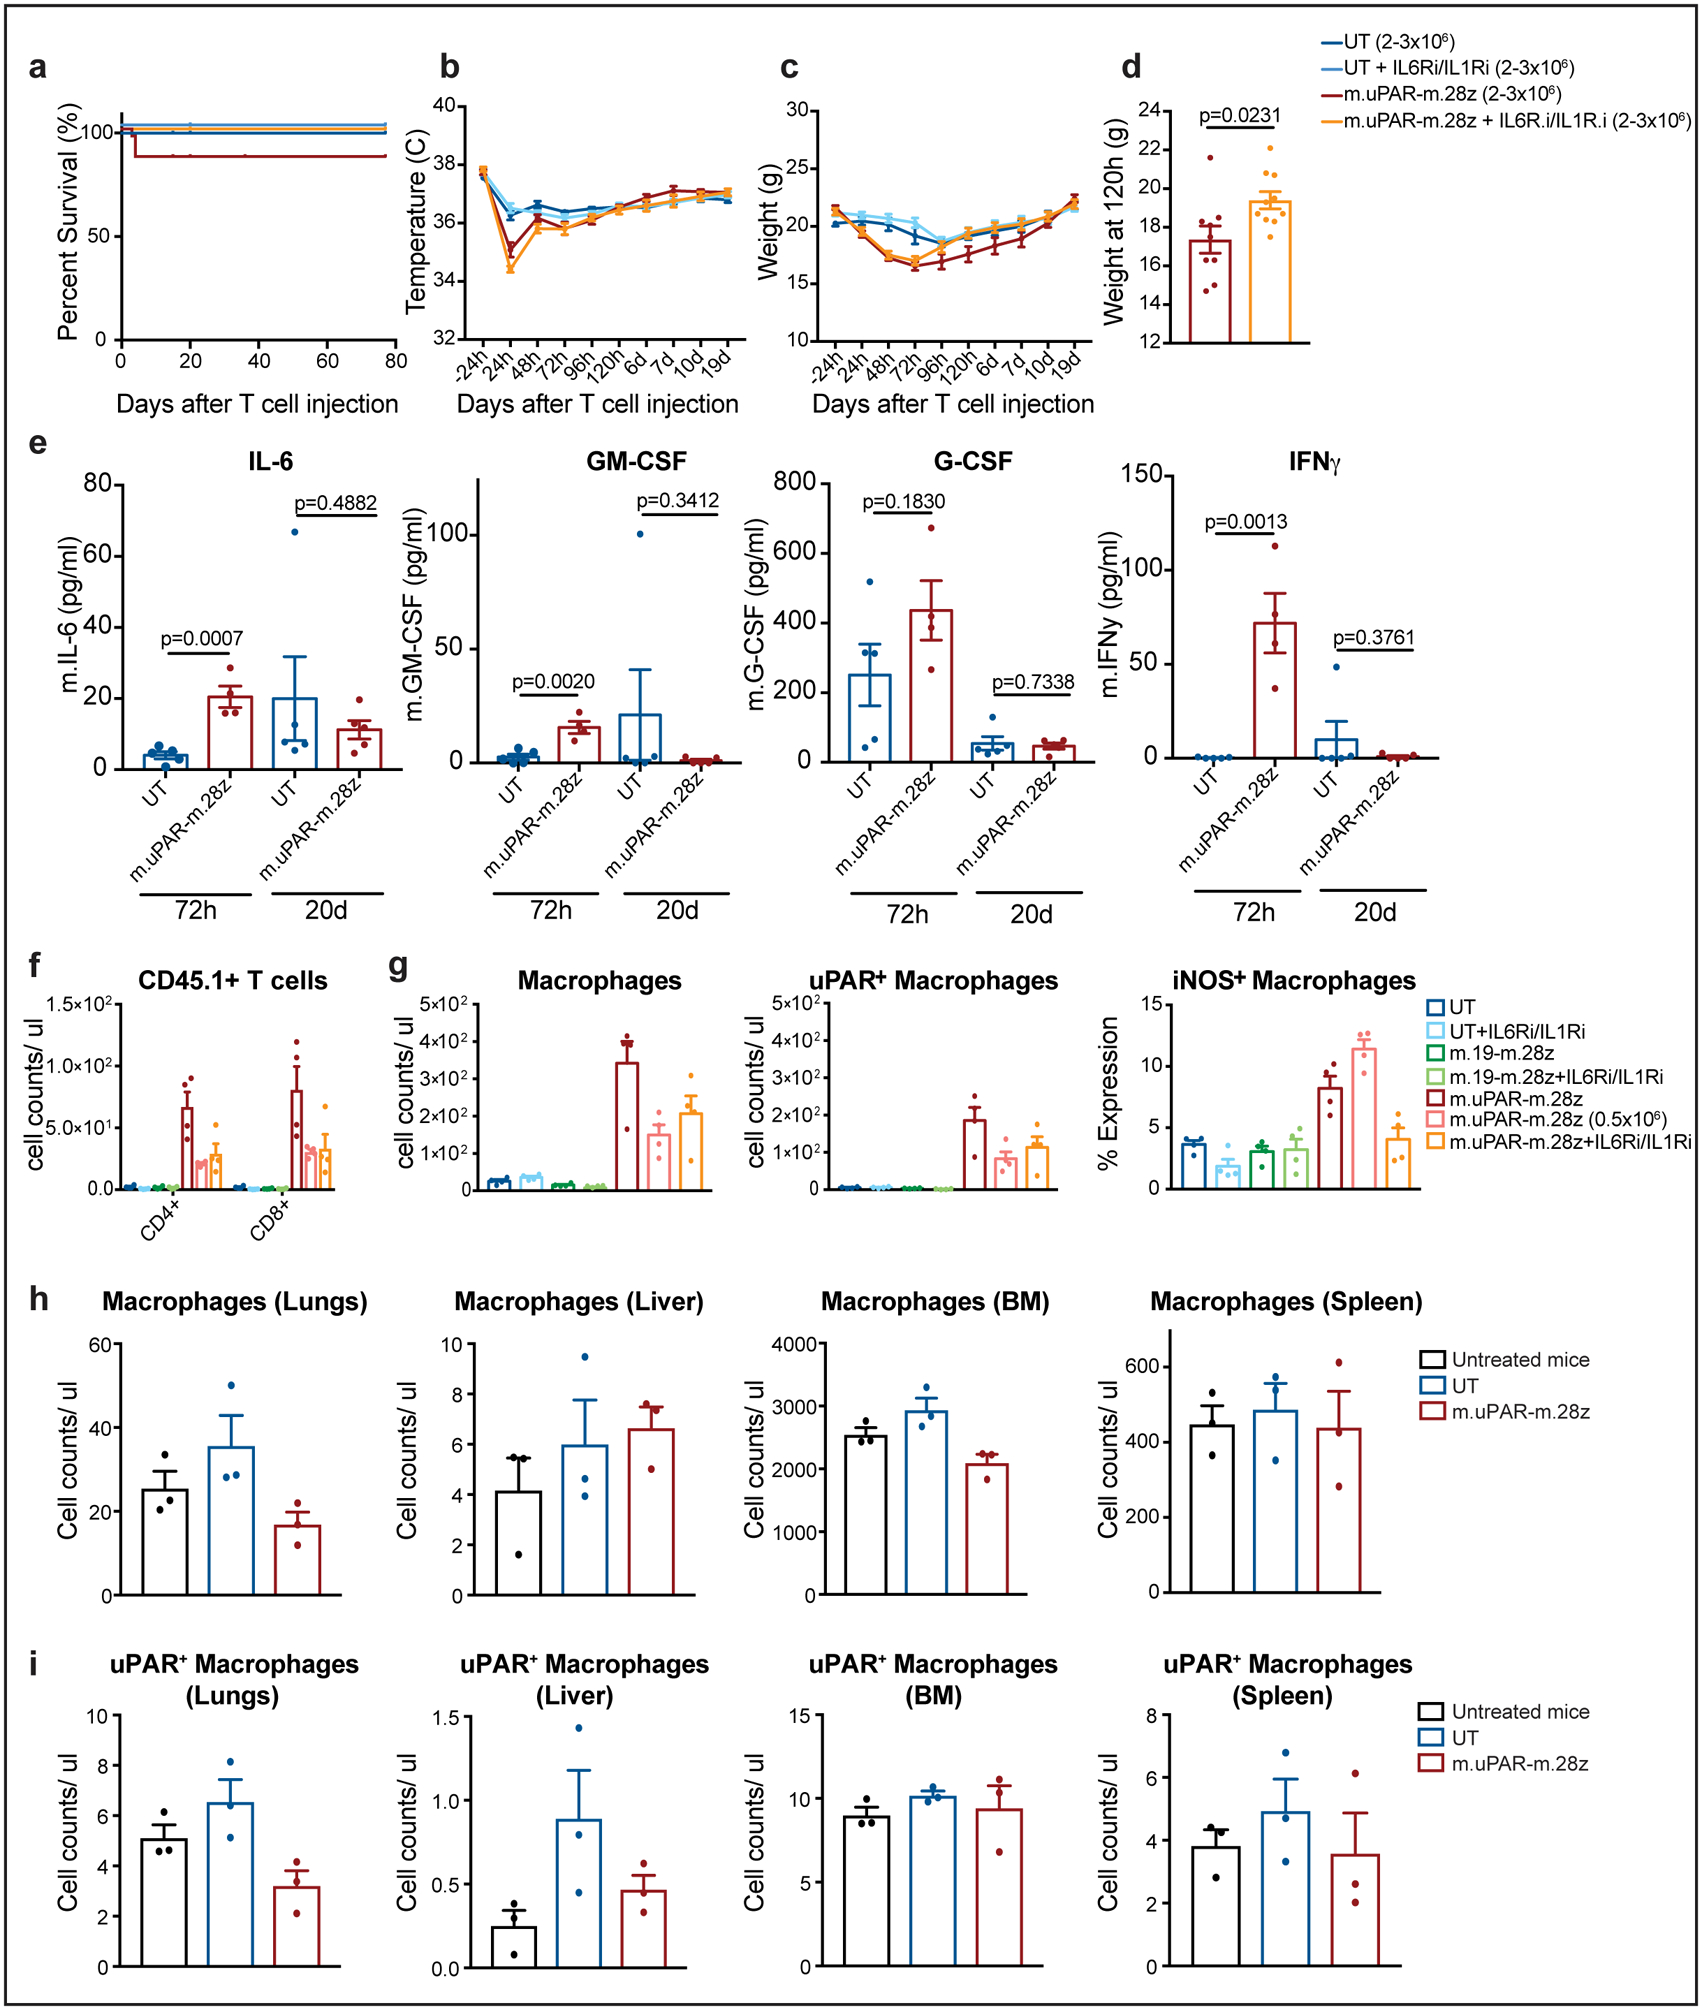
C57BL/6N mice received semiweekly intraperitoneal (ip) infusions of CCl4 for 6 weeks followed by intravenous (iv) infusion of 2–3×10⁶ murine m.uPAR-m.28z CAR T cells or untransduced (UT) T cells 16–24hr after cyclophosphamide (200mg/kg) administration. A subset of mice (as specified in the figures) received additional treatment with IL6R blocking antibodies (IL6Ri) and Anakinra (IL1Ri), starting 24h before T cell infusion and continued daily until 6 days after T cell infusion. Mice were euthanized 12 weeks after CAR infusion to assess potential toxicities. (a) Kaplan-Meier curve showing survival of mice after CAR T cell injection (UT: n=19 mice, UT + IL6Ri/IL1Ri: n=7, m.uPAR-m.28z: n=30, m.uPAR-m.28z + IL6Ri/IL1Ri: n=19). (b-c) Temperature (b) and weight (c) of treated mice (UT: n=7 mice, UT + IL6Ri/IL1Ri: n=8, m.uPAR-m.28z: n=11, m.uPAR-m.28z + IL6Ri/IL1Ri: n=10). (d) Weight (g) of mice 120h after infusion with either m.uPAR-m.28z or m.uPAR-m.28z and additional treatment with IL6Ri and IL1Ri (m.uPAR-m.28z: n=11, m.uPAR-m.28z + IL6Ri/IL1Ri: n=10). (e) Serum levels of murine IL-6, GM-CSF, G-CSF and IFNy in mice treated with either m.uPAR-m.28z or UT T cells 72h or 20 days after T cell infusion (UT: n=5, m.uPAR-m.28z: n=4 at 72h and n=5 at 20d). (f-g) Number of adoptively transferred CD45.1 positive T cells (f), macrophages, uPAR-positive and iNOS-positive macrophages (g) in the lungs of mice treated with m.uPAR-m.28z, m.19-m.28z or UT T cells alone or in combination with combined IL6Ri and ILR1i 3 days after T cell infusion (n=4 mice per group). (h-i) Numbers of macrophages (h) and uPAR positive macrophages (i) in lungs, liver, bone marrow (BM) and spleen of untreated mice or mice treated with either m.uPAR-m.28z or UT T cells 12 weeks after T cell infusion (n=3 mice per group). (a-e) Representative results of 3 independent experiments. All data represent mean± SEM. Two-tailed unpaired Student’s t-test. (f-i) Representative results of 1 independent experiment. All data represent mean± SEM. Two-tailed unpaired Student’s t-test.
Extended Data Fig.9|. Therapeutic intervention with IL6R and IL1R inhibitors does not decrease therapeutic efficacy of senolytic CAR T cells in CCl4-induced liver fibrosis.
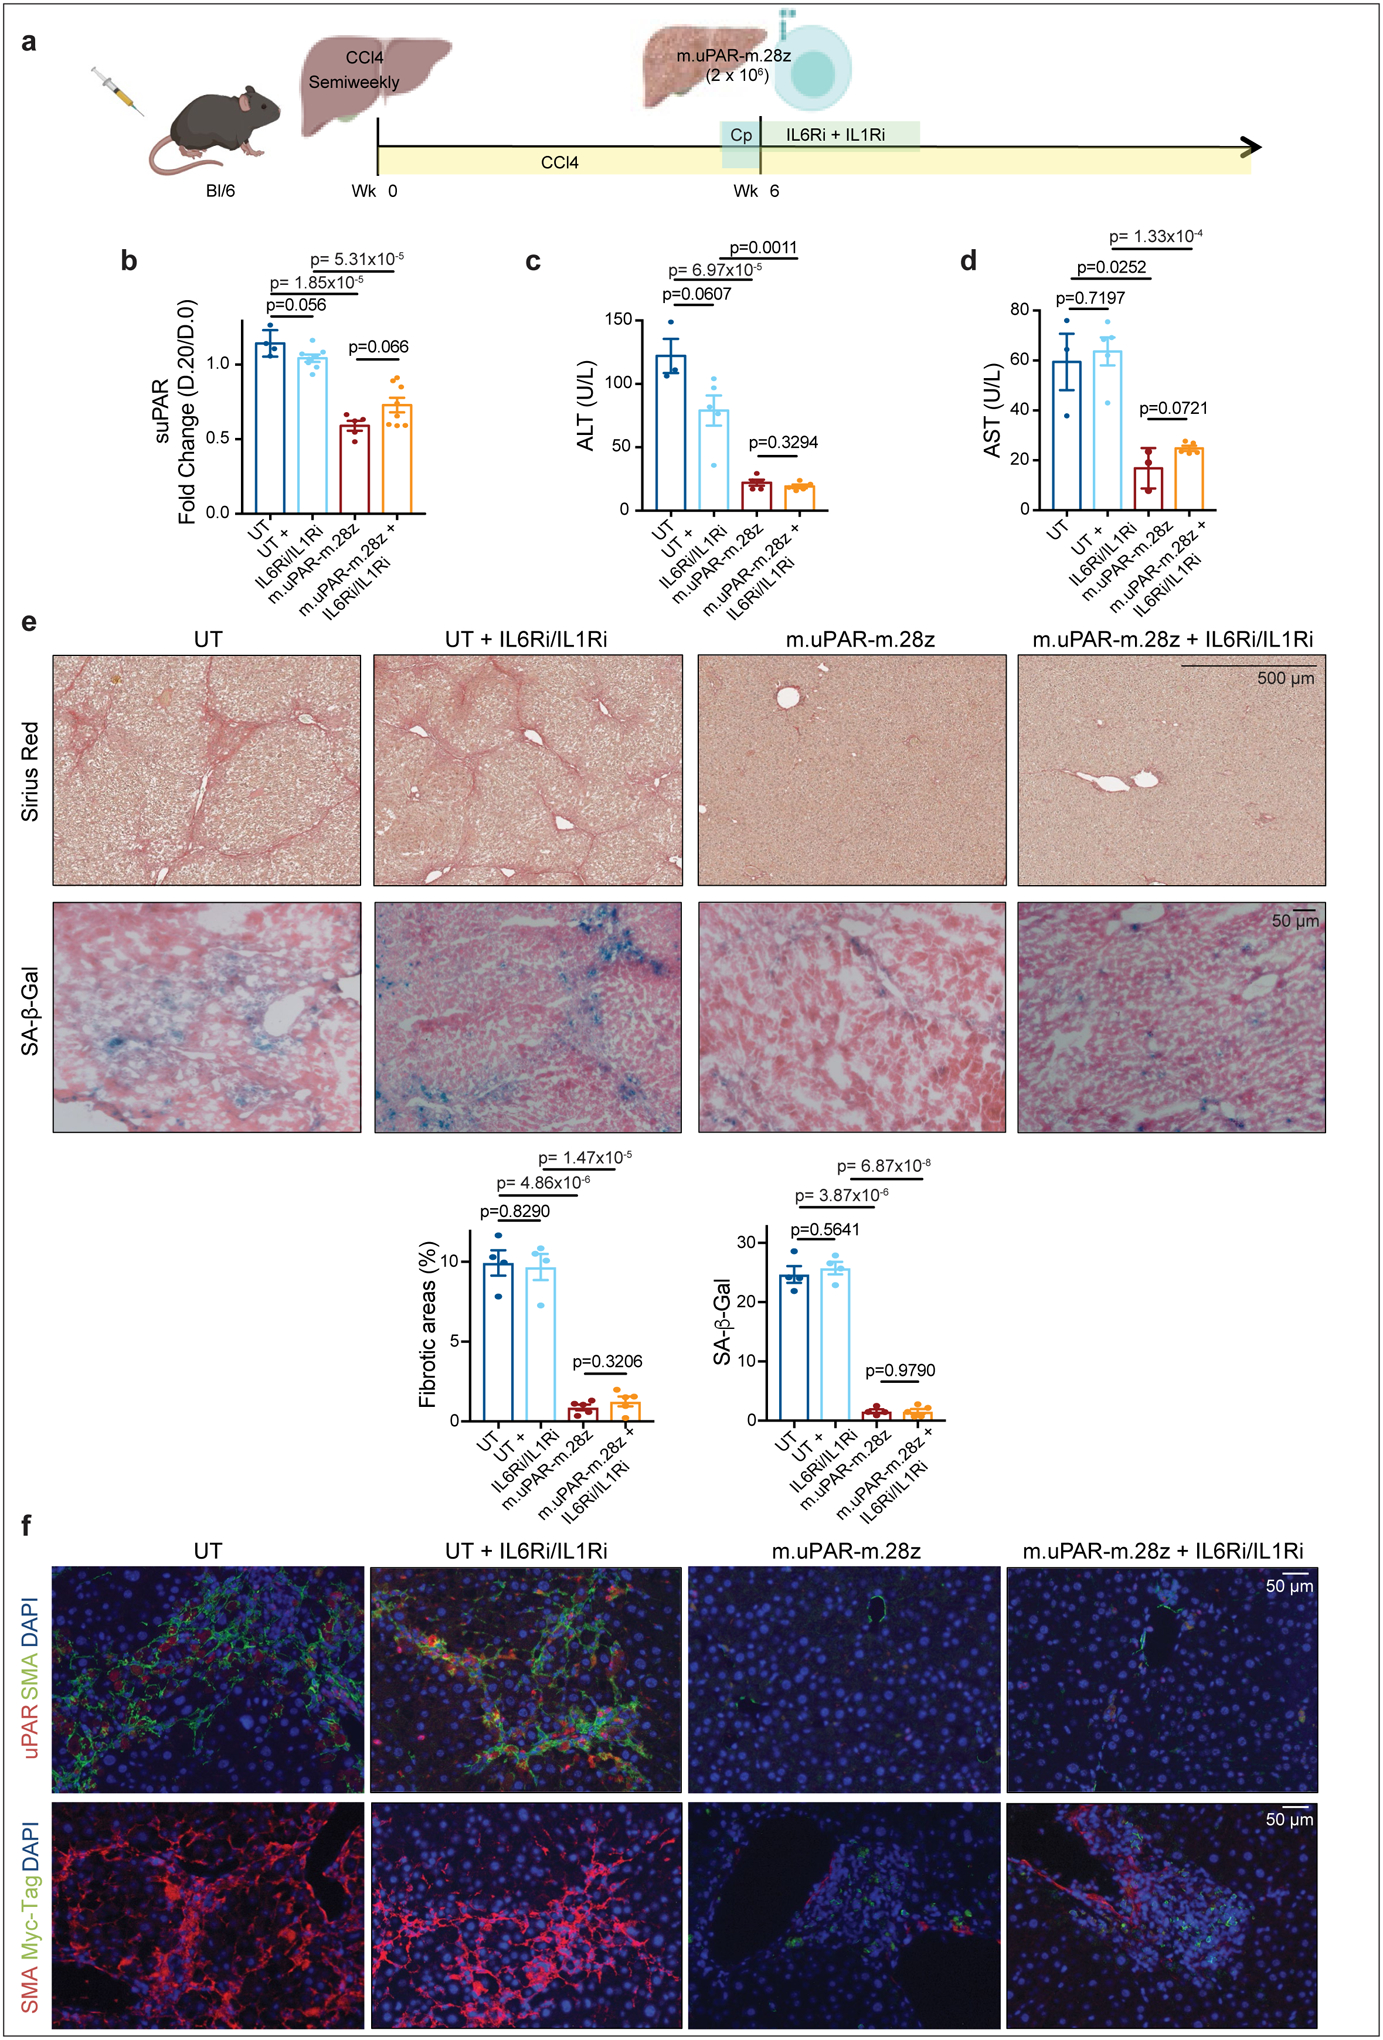
(a) Experimental layout: C57BL/6N mice received semiweekly intraperitoneal (ip) infusions of CCl4 for 6 weeks and were intravenously (iv) infused with 2–3×10⁶ murine m.uPAR-m.28z CAR T cells or UT T cells 24hr after cyclophosphamide (200mg/kg) administration. IL6R blocking antibodies (IL6Ri) and Anakinra (ILRi) were first administered 24h before T cell infusion followed by daily (IIL6Ri) or twice a day (Anakinra) injections for the first 6 days until treatment was stopped. Mice were euthanized 20 days after T cell infusion to assess liver fibrosis. Images were created with Biorender.com. (b) Fold change difference in serum levels of soluble (suPAR) 20 days after CAR T cell treatment as compared to day −1 before CAR T cell injection (UT: n=4 mice, UT+IL6Ri/IL1Ri: n=8, m.uPAR: n=5, m.uPAR+IIL6Ri/IL1Ri: n=8). (c-d) Levels of serum alanine aminotransferase (ALT) (U/L) (c) and of serum aspartate aminotransferase (AST) (U/L) (d) in treated mice 20 days after T cell infusion (UT: n=3 mice, UT+IL6Ri/IL1Ri: n=5, m.uPAR-m.28z: n=5 (ALT) and n=3 (AST), m.uPAR-m.28z+IIL6Ri/IL1Ri: n=5). (e) Representative levels of fibrosis evaluated by Sirius red staining and SA-β-Gal staining of livers from treated mice and quantification of liver fibrosis and SA-β-Gal+ cells in the respective livers 20 days after treatment (UT: n=4 mice, UT+IL6Ri/IL1Ri: n=4, m.uPAR-m.28z: n=4, m.uPAR-m.28z+IIL6Ri/IL1Ri: n=5). (f) Co-immunofluorescence staining of either murine uPAR (red) and smooth muscle actin (green) or Myc-tag (red) and smooth muscle actin (green) in the livers of treated mice. (b,c,d,e,f) Representative results of 1 independent experiment. All data represent mean± SEM. Two-tailed unpaired Student’s t-test.
Extended Data Fig.10|. Safety profile of senolytic CAR T cells at therapeutic doses in a murine NASH-induced liver fibrosis model.
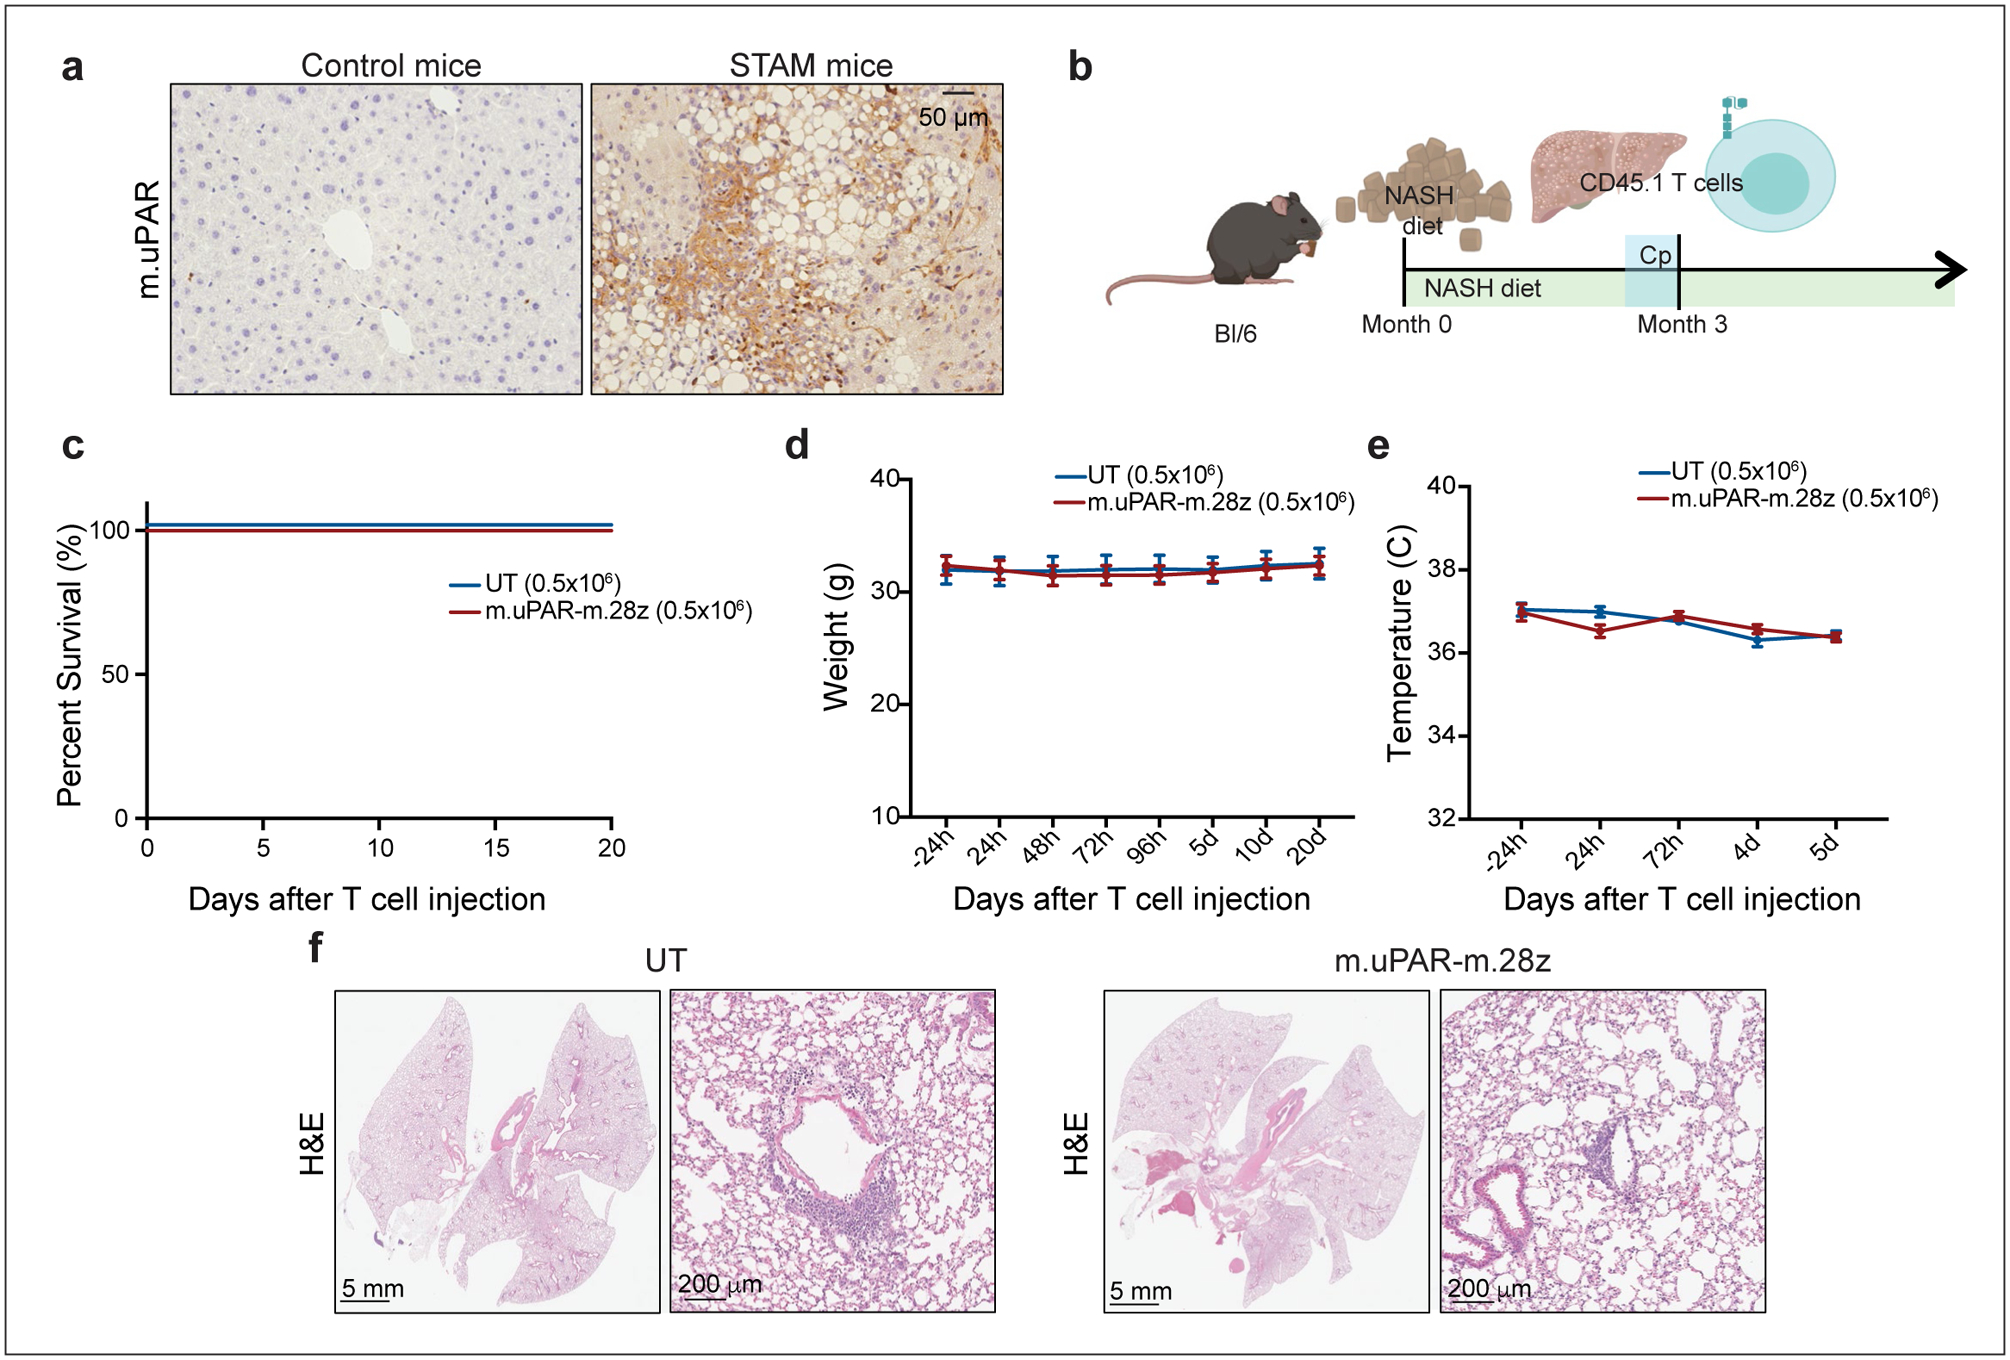
Immunohistochemical expression of murine uPAR in samples from the “STAM™” model52,58 (n=3 mice). (b) Experimental layout for experiments performed using the model of diet-induced NASH (Fig. 4, Extended Data Fig. 10): C57BL/6N mice received normal chow or NASH diet50 for 3 months, followed by intravenous (iv) infusion with 0.5×10⁶ murine m.uPAR-m.28z CAR T cells or UT T cells 16 hours after cyclophosphamide (200mg/kg) administration. Mice were euthanized 20 days after CAR infusion to assess liver fibrosis. Images were created with Biorender.com. (c) Kaplan-Meier curve showing survival of mice after treatment with either m.uPAR-m.28z or UT T cells (m.uPAR-m.28z: n=16 mice and UT: n=10). (d-e) Weight (d) and temperature (e) of mice before and at different time points after T cell infusion (m.uPAR-m.28z: n=11 mice and UT: n=9). Data represent mean± SEM. (f) Representative H&E stainings of the lungs of treated mice (m.uPAR-m.28z: n=6 mice and UT: n=4). (c-f) Representative results of 2 independent experiments.
Extended Data Fig.11|. Gating strategies, summary and potential applications of senolytic CAR T cells.
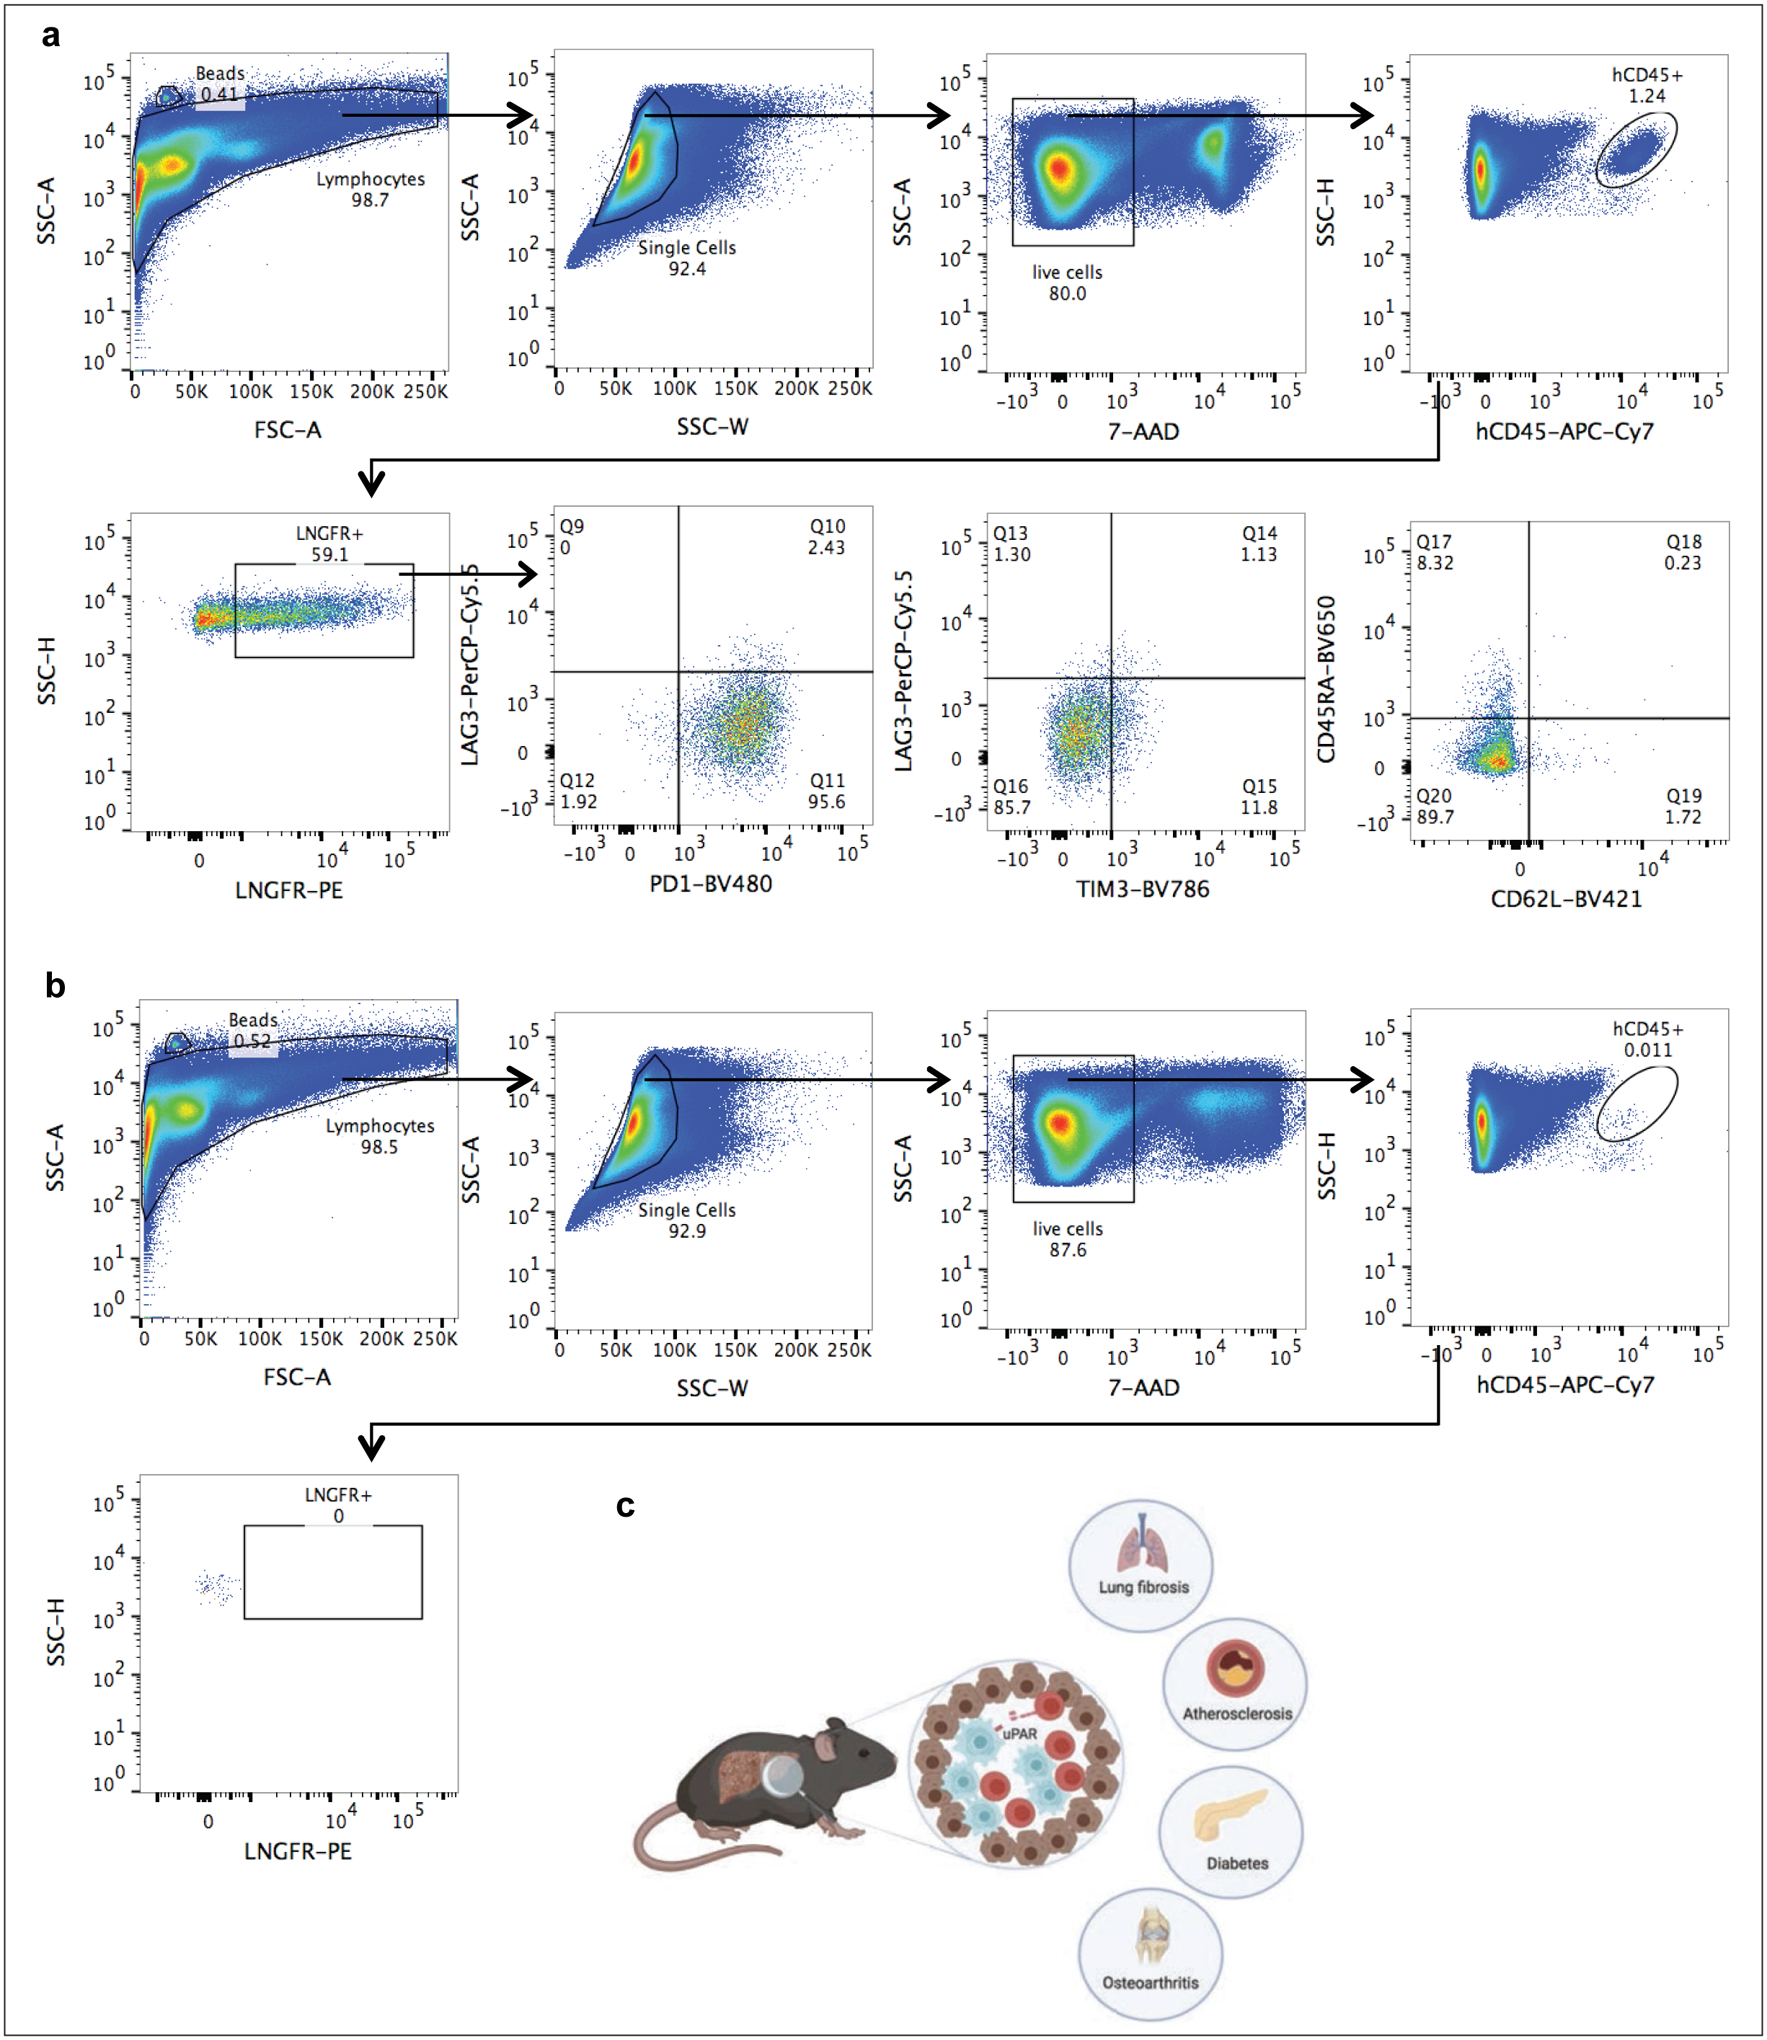
(a)-(b) Representative flow cytometric staining of m.uPAR-h.28z CAR T cells (a) or untransduced T cells (b) obtained from the livers of mice that had undergone hydrodynamic tail vein injections (HTVI) (as depicted in Fig.2). Representative results of 1 independet experiment (n=4 mice per group). (c) Illustration summarizing key points of our findings. uPAR-28z CAR T cells (depicted in red) infiltrate fibrotic livers containing senescent cells (here depicted in blue) and efficiently eliminate them, leading to fibrosis resolution and improved liver function. The therapeutic action of senolytic uPAR-28z CAR T cells might be extended to other senescence-associated diseases such as lung fibrosis, atherosclerosis, diabetes or osteoarthritis. Images were created with Biorender.com.
ACKNOWLEDGEMENTS
We thank A.Lujambio and R.Brody and the Biorepository and Pathology CoRE, Icahn School of Medicine at Mount Sinai for tissue samples, Gokce Askan and Olca Basturk at the Department of Pathology at Memorial Sloan Kettering Cancer Center for tissue samples, L. Zender and H. Chen for sharing plasmids, N. Salgado, H. Chen, T. Baslan, S. Tian, A. Wuest, W. Luan and G. Gunset for technical assistance, C.J. Sherr, E. de Stanchina, N. Kuhn, A. Dobrin, M.L. Sjöstrand and other members of the Lowe and Sadelain laboratories for insightful discussions. This work was supported by a grant for the National Institute of Aging (AG016379) to S.W.L. and the Pasteur-Weizmann/Servier award to M.S. as well as the Memorial Sloan Kettering Cancer Center Support grant (P30 CA008748) to both S.W.L. and M.S. laboratories. S.L.F. was supported by a grant from the National Institute of Diabetes and Digestive and Kidney diseases (RO156621); a grant from the Department of Defense (CA150272) and the P30 grant (CA165979). C.A. was supported by a postgraduate fellowship from La Caixa foundation and is the recipient of the Harold E. Varmus graduate student fellowship by the Gerstner Sloan Kettering graduate school. J.F. was supported by the Care-for-Rare Foundation and the German Research Foundation (DFG). J.L. was supported by a fellowship of the German Research Foundation (DFG) and a Shulamit Katzman Endowed Postdoctoral Research Fellowship. J.F. and J.L. are part of the Experimental Medicine Program at the University of Tuebingen. D.A.C. was supported by a postdoctoral fellowship from Fundacion Ramon Areces. J.B. was supported by the Grayer postgraduate fellowship and the Geoffrey Been graduate student fellowship from the Gerstner Sloan Kettering graduate school. A.K was supported by a grant from the National Cancer Institute (U54 0D020355-01). S.W.L. is the Geoffrey Been Chair of Cancer Biology and a Howard Hughes Medical Institute Investigator. We thank the following Memorial Sloan Kettering Cancer Center (MSKCC) core facilities for the excellent support: SKI Flow cytometry core facility, animal facility, antitumor assessment core, laboratory for comparative biology, bioinformatics core and integrated genomics operation core.
Footnotes
DATA AVAILABILITY
The RNA-seq data has been deposited in the Gene Expression Omnibus under the accession number GSE145642. All other data supporting the findings of this study will be made available upon reasonable request to the corresponding author.
COMPETING INTERESTS
A patent application has been submitted based in part on results presented in this manuscript. C.A, J.F, J.L, M.S, S.W.L are listed as the inventors. J.F and M.S hold other unrelated patents on CAR technologies.
REFERENCES
- 1.He S & Sharpless NE Senescence in Health and Disease. Cell 169, 1000–1011, doi: 10.1016/j.cell.2017.05.015 (2017). [DOI] [PMC free article] [PubMed] [Google Scholar]
- 2.Sharpless NE & Sherr CJ Forging a signature of in vivo senescence. Nat Rev Cancer 15, 397–408, doi: 10.1038/nrc3960 (2015). [DOI] [PubMed] [Google Scholar]
- 3.Serrano M, Lin AW, McCurrach ME, Beach D & Lowe SW Oncogenic ras provokes premature cell senescence associated with accumulation of p53 and p16INK4a. Cell 88, 593–602 (1997). [DOI] [PubMed] [Google Scholar]
- 4.Kang TW et al. Senescence surveillance of pre-malignant hepatocytes limits liver cancer development. Nature 479, 547–551, doi: 10.1038/nature10599 (2011). [DOI] [PubMed] [Google Scholar]
- 5.Demaria M et al. An essential role for senescent cells in optimal wound healing through secretion of PDGF-AA. Dev Cell 31, 722–733, doi: 10.1016/j.devcel.2014.11.012 (2014). [DOI] [PMC free article] [PubMed] [Google Scholar]
- 6.Krizhanovsky V et al. Senescence of activated stellate cells limits liver fibrosis. Cell 134, 657–667, doi: 10.1016/j.cell.2008.06.049 (2008). [DOI] [PMC free article] [PubMed] [Google Scholar]
- 7.Collado M, Blasco MA & Serrano M Cellular senescence in cancer and aging. Cell 130, 223–233, doi: 10.1016/j.cell.2007.07.003 (2007). [DOI] [PubMed] [Google Scholar]
- 8.Baker DJ et al. Clearance of p16Ink4a-positive senescent cells delays ageing-associated disorders. Nature 479, 232–236, doi: 10.1038/nature10600 (2011). [DOI] [PMC free article] [PubMed] [Google Scholar]
- 9.Baar MP et al. Targeted Apoptosis of Senescent Cells Restores Tissue Homeostasis in Response to Chemotoxicity and Aging. Cell 169, 132–147 e116, doi: 10.1016/j.cell.2017.02.031 (2017). [DOI] [PMC free article] [PubMed] [Google Scholar]
- 10.Childs BG et al. Senescent intimal foam cells are deleterious at all stages of atherosclerosis. Science 354, 472–477, doi: 10.1126/science.aaf6659 (2016). [DOI] [PMC free article] [PubMed] [Google Scholar]
- 11.Smith HW & Marshall CJ Regulation of cell signalling by uPAR. Nat Rev Mol Cell Biol 11, 23–36, doi: 10.1038/nrm2821 (2010). [DOI] [PubMed] [Google Scholar]
- 12.Kirkland JL & Tchkonia T Cellular Senescence: A Translational Perspective. EBioMedicine 21, 21–28, doi: 10.1016/j.ebiom.2017.04.013 (2017). [DOI] [PMC free article] [PubMed] [Google Scholar]
- 13.Xu M et al. Senolytics improve physical function and increase lifespan in old age. Nat Med 24, 1246–1256, doi: 10.1038/s41591-018-0092-9 (2018). [DOI] [PMC free article] [PubMed] [Google Scholar]
- 14.Sadelain M, Riviere I & Riddell S Therapeutic T cell engineering. Nature 545, 423–431, doi: 10.1038/nature22395 (2017). [DOI] [PMC free article] [PubMed] [Google Scholar]
- 15.Park JH et al. Long-Term Follow-up of CD19 CAR Therapy in Acute Lymphoblastic Leukemia. N Engl J Med 378, 449–459, doi: 10.1056/NEJMoa1709919 (2018). [DOI] [PMC free article] [PubMed] [Google Scholar]
- 16.Aghajanian H et al. Targeting cardiac fibrosis with engineered T cells. Nature, doi: 10.1038/s41586-019-1546-z (2019). [DOI] [PMC free article] [PubMed] [Google Scholar]
- 17.Du H et al. Antitumor Responses in the Absence of Toxicity in Solid Tumors by Targeting B7–H3 via Chimeric Antigen Receptor T Cells. Cancer Cell 35, 221–237 e228, doi: 10.1016/j.ccell.2019.01.002 (2019). [DOI] [PMC free article] [PubMed] [Google Scholar]
- 18.Pellegatta S et al. Constitutive and TNFalpha-inducible expression of chondroitin sulfate proteoglycan 4 in glioblastoma and neurospheres: Implications for CAR-T cell therapy. Sci Transl Med 10, doi: 10.1126/scitranslmed.aao2731 (2018). [DOI] [PMC free article] [PubMed] [Google Scholar]
- 19.Ruscetti M et al. NK cell-mediated cytotoxicity contributes to tumor control by a cytostatic drug combination. Science 362, 1416–1422, doi: 10.1126/science.aas9090 (2018). [DOI] [PMC free article] [PubMed] [Google Scholar]
- 20.Perna F et al. Integrating Proteomics and Transcriptomics for Systematic Combinatorial Chimeric Antigen Receptor Therapy of AML. Cancer Cell 32, 506–519 e505, doi: 10.1016/j.ccell.2017.09.004 (2017). [DOI] [PMC free article] [PubMed] [Google Scholar]
- 21.Tasdemir N et al. BRD4 Connects Enhancer Remodeling to Senescence Immune Surveillance. Cancer Discov 6, 612–629, doi: 10.1158/2159-8290.CD-16-0217 (2016). [DOI] [PMC free article] [PubMed] [Google Scholar]
- 22.Simon DI et al. Mac-1 (CD11b/CD18) and the urokinase receptor (CD87) form a functional unit on monocytic cells. Blood 88, 3185–3194 (1996). [PubMed] [Google Scholar]
- 23.Bugge TH et al. The receptor for urokinase-type plasminogen activator is not essential for mouse development or fertility. J Biol Chem 270, 16886–16894, doi: 10.1074/jbc.270.28.16886 (1995). [DOI] [PubMed] [Google Scholar]
- 24.Coppe JP et al. Senescence-associated secretory phenotypes reveal cell-nonautonomous functions of oncogenic RAS and the p53 tumor suppressor. PLoS Biol 6, 2853–2868, doi: 10.1371/journal.pbio.0060301 (2008). [DOI] [PMC free article] [PubMed] [Google Scholar]
- 25.Hayek SS et al. Soluble Urokinase Receptor and Chronic Kidney Disease. N Engl J Med 373, 1916–1925, doi: 10.1056/NEJMoa1506362 (2015). [DOI] [PMC free article] [PubMed] [Google Scholar]
- 26.Belcher C, Fawthrop F, Bunning R & Doherty M Plasminogen activators and their inhibitors in synovial fluids from normal, osteoarthritis, and rheumatoid arthritis knees. Ann Rheum Dis 55, 230–236, doi: 10.1136/ard.55.4.230 (1996). [DOI] [PMC free article] [PubMed] [Google Scholar]
- 27.Guthoff M et al. Soluble urokinase receptor (suPAR) predicts microalbuminuria in patients at risk for type 2 diabetes mellitus. Sci Rep 7, 40627, doi: 10.1038/srep40627 (2017). [DOI] [PMC free article] [PubMed] [Google Scholar]
- 28.Schuliga M et al. The fibrogenic actions of lung fibroblast-derived urokinase: a potential drug target in IPF. Sci Rep 7, 41770, doi: 10.1038/srep41770 (2017). [DOI] [PMC free article] [PubMed] [Google Scholar]
- 29.Brentjens RJ et al. Eradication of systemic B-cell tumors by genetically targeted human T lymphocytes co-stimulated by CD80 and interleukin-15. Nat Med 9, 279–286, doi: 10.1038/nm827 (2003). [DOI] [PubMed] [Google Scholar]
- 30.Wang C et al. Inducing and exploiting vulnerabilities for the treatment of liver cancer. Nature 574, 268–272, doi: 10.1038/s41586-019-1607-3 (2019). [DOI] [PMC free article] [PubMed] [Google Scholar]
- 31.Schnabl B, Purbeck CA, Choi YH, Hagedorn CH & Brenner D Replicative senescence of activated human hepatic stellate cells is accompanied by a pronounced inflammatory but less fibrogenic phenotype. Hepatology 37, 653–664, doi: 10.1053/jhep.2003.50097 (2003). [DOI] [PubMed] [Google Scholar]
- 32.Puche JE et al. A novel murine model to deplete hepatic stellate cells uncovers their role in amplifying liver damage in mice. Hepatology 57, 339–350, doi: 10.1002/hep.26053 (2013). [DOI] [PMC free article] [PubMed] [Google Scholar]
- 33.Kuhn NF et al. CD40 Ligand-Modified Chimeric Antigen Receptor T Cells Enhance Antitumor Function by Eliciting an Endogenous Antitumor Response. Cancer Cell 35, 473–488 e476, doi: 10.1016/j.ccell.2019.02.006 (2019). [DOI] [PMC free article] [PubMed] [Google Scholar]
- 34.Dobrenkov K et al. Monitoring the efficacy of adoptively transferred prostate cancer-targeted human T lymphocytes with PET and bioluminescence imaging. J Nucl Med 49, 1162–1170, doi: 10.2967/jnumed.107.047324 (2008). [DOI] [PMC free article] [PubMed] [Google Scholar]
- 35.Giavridis T et al. CAR T cell-induced cytokine release syndrome is mediated by macrophages and abated by IL-1 blockade. Nat Med 24, 731–738, doi: 10.1038/s41591-018-0041-7 (2018). [DOI] [PMC free article] [PubMed] [Google Scholar]
- 36.Norelli M et al. Monocyte-derived IL-1 and IL-6 are differentially required for cytokine-release syndrome and neurotoxicity due to CAR T cells. Nat Med 24, 739–748, doi: 10.1038/s41591-018-0036-4 (2018). [DOI] [PubMed] [Google Scholar]
- 37.Feucht J et al. Calibration of CAR activation potential directs alternative T cell fates and therapeutic potency. Nat Med 25, 82–88, doi: 10.1038/s41591-018-0290-5 (2019). [DOI] [PMC free article] [PubMed] [Google Scholar]
- 38.Brunt EM et al. Nonalcoholic fatty liver disease. Nat Rev Dis Primers 1, 15080, doi: 10.1038/nrdp.2015.80 (2015). [DOI] [PubMed] [Google Scholar]
- 39.Wang L et al. Basing on uPAR-binding fragment to design chimeric antigen receptors triggers antitumor efficacy against uPAR expressing ovarian cancer cells. Biomed Pharmacother 117, 109173, doi: 10.1016/j.biopha.2019.109173 (2019). [DOI] [PubMed] [Google Scholar]
- 40.Paszkiewicz PJ et al. Targeted antibody-mediated depletion of murine CD19 CAR T cells permanently reverses B cell aplasia. J Clin Invest 126, 4262–4272, doi: 10.1172/JCI84813 (2016). [DOI] [PMC free article] [PubMed] [Google Scholar]
- 41.Gargett T & Brown MP The inducible caspase-9 suicide gene system as a “safety switch” to limit on-target, off-tumor toxicities of chimeric antigen receptor T cells. Front Pharmacol 5, 235, doi: 10.3389/fphar.2014.00235 (2014). [DOI] [PMC free article] [PubMed] [Google Scholar]
- 42.Anderson KG, Stromnes IM & Greenberg PD Obstacles Posed by the Tumor Microenvironment to T cell Activity: A Case for Synergistic Therapies. Cancer Cell 31, 311–325, doi: 10.1016/j.ccell.2017.02.008 (2017). [DOI] [PMC free article] [PubMed] [Google Scholar]
- 43.Bolger AM, Lohse M & Usadel B Trimmomatic: a flexible trimmer for Illumina sequence data. Bioinformatics 30, 2114–2120, doi: 10.1093/bioinformatics/btu170 (2014). [DOI] [PMC free article] [PubMed] [Google Scholar]
- 44.Dobin A et al. STAR: ultrafast universal RNA-seq aligner. Bioinformatics 29, 15–21, doi: 10.1093/bioinformatics/bts635 (2013). [DOI] [PMC free article] [PubMed] [Google Scholar]
- 45.Liao Y, Smyth GK & Shi W featureCounts: an efficient general purpose program for assigning sequence reads to genomic features. Bioinformatics 30, 923–930, doi: 10.1093/bioinformatics/btt656 (2014). [DOI] [PubMed] [Google Scholar]
- 46.Love MI, Huber W & Anders S Moderated estimation of fold change and dispersion for RNA-seq data with DESeq2. Genome Biol 15, 550, doi: 10.1186/s13059-014-0550-8 (2014). [DOI] [PMC free article] [PubMed] [Google Scholar]
- 47.Chen EY et al. Enrichr: interactive and collaborative HTML5 gene list enrichment analysis tool. BMC Bioinformatics 14, 128, doi: 10.1186/1471-2105-14-128 (2013). [DOI] [PMC free article] [PubMed] [Google Scholar]
- 48.Livshits G et al. Arid1a restrains Kras-dependent changes in acinar cell identity. Elife 7, doi: 10.7554/eLife.35216 (2018). [DOI] [PMC free article] [PubMed] [Google Scholar]
- 49.Lujambio A et al. Non-cell-autonomous tumor suppression by p53. Cell 153, 449–460, doi: 10.1016/j.cell.2013.03.020 (2013). [DOI] [PMC free article] [PubMed] [Google Scholar]
- 50.Zhu C et al. Hepatocyte Notch activation induces liver fibrosis in nonalcoholic steatohepatitis. Sci Transl Med 10, doi: 10.1126/scitranslmed.aat0344 (2018). [DOI] [PMC free article] [PubMed] [Google Scholar]
- 51.Wang X et al. Hepatocyte TAZ/WWTR1 Promotes Inflammation and Fibrosis in Nonalcoholic Steatohepatitis. Cell Metab 24, 848–862, doi: 10.1016/j.cmet.2016.09.016 (2016). [DOI] [PMC free article] [PubMed] [Google Scholar]
- 52.Van der Schueren B et al. Low cytochrome oxidase 4I1 links mitochondrial dysfunction to obesity and type 2 diabetes in humans and mice. Int J Obes (Lond) 39, 1254–1263, doi: 10.1038/ijo.2015.58 (2015). [DOI] [PubMed] [Google Scholar]
- 53.Davila ML, Kloss CC, Gunset G & Sadelain M CD19 CAR-targeted T cells induce long-term remission and B Cell Aplasia in an immunocompetent mouse model of B cell acute lymphoblastic leukemia. PLoS One 8, e61338, doi: 10.1371/journal.pone.0061338 (2013). [DOI] [PMC free article] [PubMed] [Google Scholar]
- 54.Maher J, Brentjens RJ, Gunset G, Riviere I & Sadelain M Human T-lymphocyte cytotoxicity and proliferation directed by a single chimeric TCRzeta /CD28 receptor. Nat Biotechnol 20, 70–75, doi: 10.1038/nbt0102-70 (2002). [DOI] [PubMed] [Google Scholar]
- 55.Brentjens RJ et al. Genetically targeted T cells eradicate systemic acute lymphoblastic leukemia xenografts. Clin Cancer Res 13, 5426–5435, doi: 10.1158/1078-0432.CCR-07-0674 (2007). [DOI] [PubMed] [Google Scholar]
- 56.Hagani AB, Riviere I, Tan C, Krause A & Sadelain M Activation conditions determine susceptibility of murine primary T-lymphocytes to retroviral infection. J Gene Med 1, 341–351, doi: 10.1002/(SICI)1521-2254(199909/10)1:5<341::AID-JGM58>3.0.CO;2-J (1999). [DOI] [PubMed] [Google Scholar]
- 57.Santos EB et al. Sensitive in vivo imaging of T cells using a membrane-bound Gaussia princeps luciferase. Nat Med 15, 338–344, doi: 10.1038/nm.1930 (2009). [DOI] [PMC free article] [PubMed] [Google Scholar]
- 58.Fujii M et al. A murine model for non-alcoholic steatohepatitis showing evidence of association between diabetes and hepatocellular carcinoma. Med Mol Morphol 46, 141–152, doi: 10.1007/s00795-013-0016-1 (2013). [DOI] [PubMed] [Google Scholar]