

SUMMARY
Comprehensive evaluation of single T cell functions such as cytokine secretion and cytolysis of target cells is greatly needed in adoptive cell therapy (ACT) but has never been fully fulfilled by current approaches. Herein, we develop a hierarchical loading microwell chip (HL-Chip) that aligns multiple cells and functionalized beads in a high-throughput microwell array with single-cell/bead precision based on size differences. We demonstrate the potential of the HL-Chip in evaluating single T cell functions by three applications: high-throughput longitudinal secretory profiling of single T cells, large-scale evaluation of cytolytic activity of single T cells, and integrated T cell-tumor cell interactions. The HL-Chip is a simple and robust technology that constructs arrays of defined cell/object combinations for multiple measurements and material retrieval.
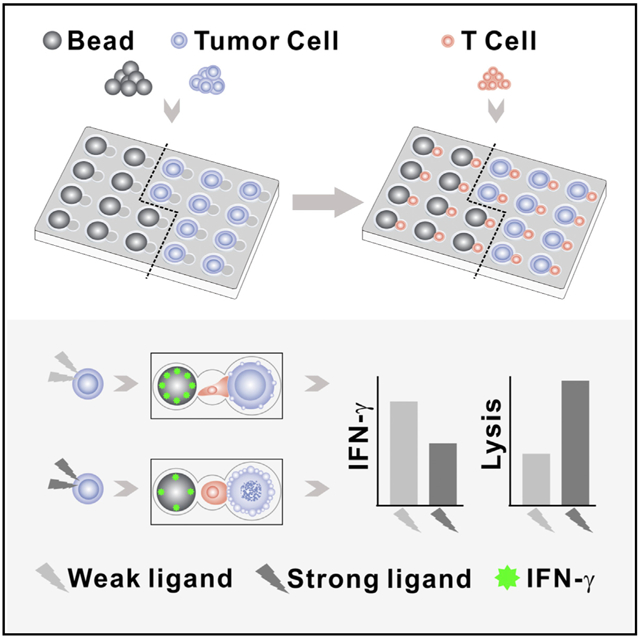
Graphical Abstract
In Brief
Zhou et al. describe the hierarchical loading microwell chip, which enables cell/bead pairing with high efficiency in a high-throughput manner. They conduct coupled measurements of cytotoxicity and cytokine secretion from single lymphocytes and uncover the linkage of lymphocytes’ functions together with the cell behavior.
INTRODUCTION
Immunotherapy has revolutionized cancer treatment in recent years. As an important branch of cancer immunotherapy, adoptive cell transfer (ACT) has shown impressive clinical response rate in the treatment of melanoma, breast cancer, colon cancer, B cell leukemias, and lymphomas (Rosenberg and Restifo, 2015; Rosenberg et al., 2008; Wang and Wang, 2017). In ACT treatment setting, tumor-reactive T cells are isolated from the patient’s own tumor tissues or blood, expanded in large numbers ex vivo with or without receptor engineering, and then infused back to the patient to mediate durable cancer regression. Growing evidence reveals that different T cells from the same patient can be functionally distinct and result in different outcomes in patients (Linnemann et al., 2015; Zacharakis et al., 2018). Therefore, it is necessary to evaluate and characterize the functionality and antigen specificity of single T cells prior to the infusion. However, the traditional population-wide measurements could disguise single-cell behaviors and some important functional heterogeneity. For example, only a small fraction of the T cells in tumor-infiltrating lymphocytes (TILs) population has tumor reactivity (June et al., 2018; Rapoport et al., 2015). The functional heterogeneity within a T cell population highlights the importance of multi-parameter analysis of the T cells with single-cell resolution.
Cytokine secretion, cytotoxicity, and antigen specificity are the primary measures of the function of T lymphocytes. Cytokine secretion of single T cells is commonly determined by enzyme-linked immunospot (ELISpot) or intracellular cytokine staining (ICS), because both approaches offer a combination of simplicity, repeatability, and sensitivity (Lamoreaux et al., 2006; Saletti et al., 2013). However, both approaches provide only static, mono-parametric, endpoint measurements. Moreover, cells used in these assays are irretrievable. In contrast, microwell arrays are easy to design, require no specialized peripherals to perform experiments, and are an attractive alternative for studying single T cell function for antigen recognition (Chattopadhyay et al., 2014; Prakadan et al., 2017; Rissin et al., 2010; Shao and Qin, 2018). The open architecture of the top of the microwell also allows easy access for cell sedimentation, surface modifications, and cell retrieval. Several microwell array-based methods have been developed to study T cell responses at a single-cell level, including microengraving (Love et al., 2006; Varadarajan et al., 2012), single-cell barcode chip (SCBC) (Lu et al., 2015; Ma et al., 2011), and immunospot array assay on a chip (ISAAC) (Jin et al., 2009). Both microengraving and the SCBC suffer from uncontrolled object sedimentation, which leads to empty units or units with more than one cell and a substantial waste of materials and assay units. Furthermore, microengraving confines lymphocytes to extremely small volumes, potentially altering cell metabolism and function. The ISAAC demonstrates high single-cell occupancy in cylinder microwells; however, it is apt to trap cell-secreted proteins on the bottom and inner wall of the microwells. This may decrease the detection sensitivity and promote cross-contamination, because the ISAAC only detects proteins trapped on the top surface of the microwells.
Evaluation of cytotoxicity of single T cells relies on pairing of single T cells with the target cells, which is currently enabled by microwell arrays (Varadarajan et al., 2012), microfluidic traps (Dura et al., 2015; Li et al., 2017), and droplet microfluidics (Segaliny et al., 2018; Sinha et al., 2018). Unfortunately, traditional microwell arrays and droplet microfluidics suffer from uncontrolled object sedimentation, which even exaggerates when try to combine two or more cells together. The single T cell-target cell pairing efficiency can be lower than 10%. Micro-fluidic traps can capture and controllably pair hundreds of cells to study immune cell-target cell interaction. However, microfluidic chips require peripheral equipment for accurate fluidic control, as well as professional skills for performing the assays. Furthermore, the throughputs of the microfluidic traps are limited for studying large-scale immune cell-target cell interactions or samples with low reaction rates.
In addition, either cytokine secretion or cytotoxicity only reveals T cell functions in single aspects. Combining measurements of cytokine secretion and cytotoxicity with detailed characterization of T cell behavior could provide a more comprehensive evaluation of the antigen specificity of T cells; however, this combination remains a primary challenge to the current available methodologies (Vanherberghen et al., 2013; Varadarajan et al., 2011). Thus, there is a critical need of a simple platform that efficiently isolates single T cells and comprehensively evaluates single-cell anti-tumor responses for effective ACT.
Therefore, we developed a hierarchical loading microwell chip (HL-Chip) that is capable of efficiently aligning multiple cells of different types and/or microbeads as desired in a high-throughput manner. We demonstrated the potential of the HL-Chip in evaluating single T cell functions by three applications: high-throughput longitudinal secretory profiling of single lymphocytes, large-scale evaluation of cytolytic activity and antigen specificity of single T cells, and integrated T cell-tumor cell interactions.
RESULTS
Working Principle of the HL-Chip
Typically, one chip consists of 100 blocks, with each block arrayed with 100 well units in 10 by 10 arrangements. The blocks were also arranged into 10 rows and 10 columns. The effective surface areas with wells were from 25 to 64 mm2, depending on designated well-to-well distance. Figure 1A depicts the working principle of a dual-well HL-Chip. A single unit with a dual-well structure was composed of one large and one small circular well aligned to form a cucurbit shape. Briefly, an excess of large objects (6–12 times the amount of the wells) was introduced onto the array. Then, iterative brief centrifugations were performed until the desirable well occupancy was achieved. Due to the geometric limitation, the large objects only occupied the large wells, leaving the small wells empty. After rinsing off all unsettled large objects, small objects were pipetted onto the array in excess (4–10 times the amount of the wells), centrifuged, and rinsed. Unsettled objects, which were rinsed off, could be recycled and used for next array. As the large wells had already been filled, the small objects were physically excluded from entering the large wells and were naturally captured in the small wells. From a careful summary of more than ten experimental repeats, we confirmed that the diameter of the large wells could be adjusted 2–4 mm in excess to the mean size of large beads, or 1/6–1/3 larger than the mean size of large cells to facilitate large objects loading and to prevent the trapping of an extra small object. Similarly, the small wells could be modified 1–2 μm in excess for beads or 1/8–1/4 larger for cells and into an ellipse shape to benefit pairing. Additionally, the maximum size of small wells was restricted by the mean – SD of large objects to prevent large objects from occupying small wells. A 2–3 μm difference between large-well and small-well diameter was necessary for hierarchical trapping of two objects in comparable size. The center-to-center distance was adjusted to 2 μm shorter than the sum radius of the two wells, resulting in an overlapping intersection, narrowing the nearest boundary from the intersection, and bringing wells into closer proximity. Moreover, the integration of multiple wells with different sizes into a single unit allows for the design of additional variations of HL-Chips. Objects can then be precisely positioned by loading, centrifuging, and rinsing in size order from largest to smallest. Examples of possible HL-Chip designs are depicted (Figure S1A). Figures 1B and 1C show representative scanning electron microscope (SEM) images of the hierarchical loading of dual-well and tri-well units, respectively. Hierarchical loading of two sizes of microbeads with two ratios (4:1 and 1:4) is shown in Figures S1B and S1C and Figures S1D and S1E, respectively. Figure 1D shows representative SEM images of three different types of dual-well units with different small well to large well ratios (i.e., 2:1, 3:1, and 4:1). A large-area image of two-beads pairing in dual-well wells is shown in Figure 1E and demonstrates 100% pairing efficiency. Microscopic images of 2:1 small well-clustered and 3:1 large well-centered two-beads positioning are shown in Figures S1F and S1G, respectively.
Figure 1. Fundamental Working Principles of the Hierarchical Loading Microwell Chip.
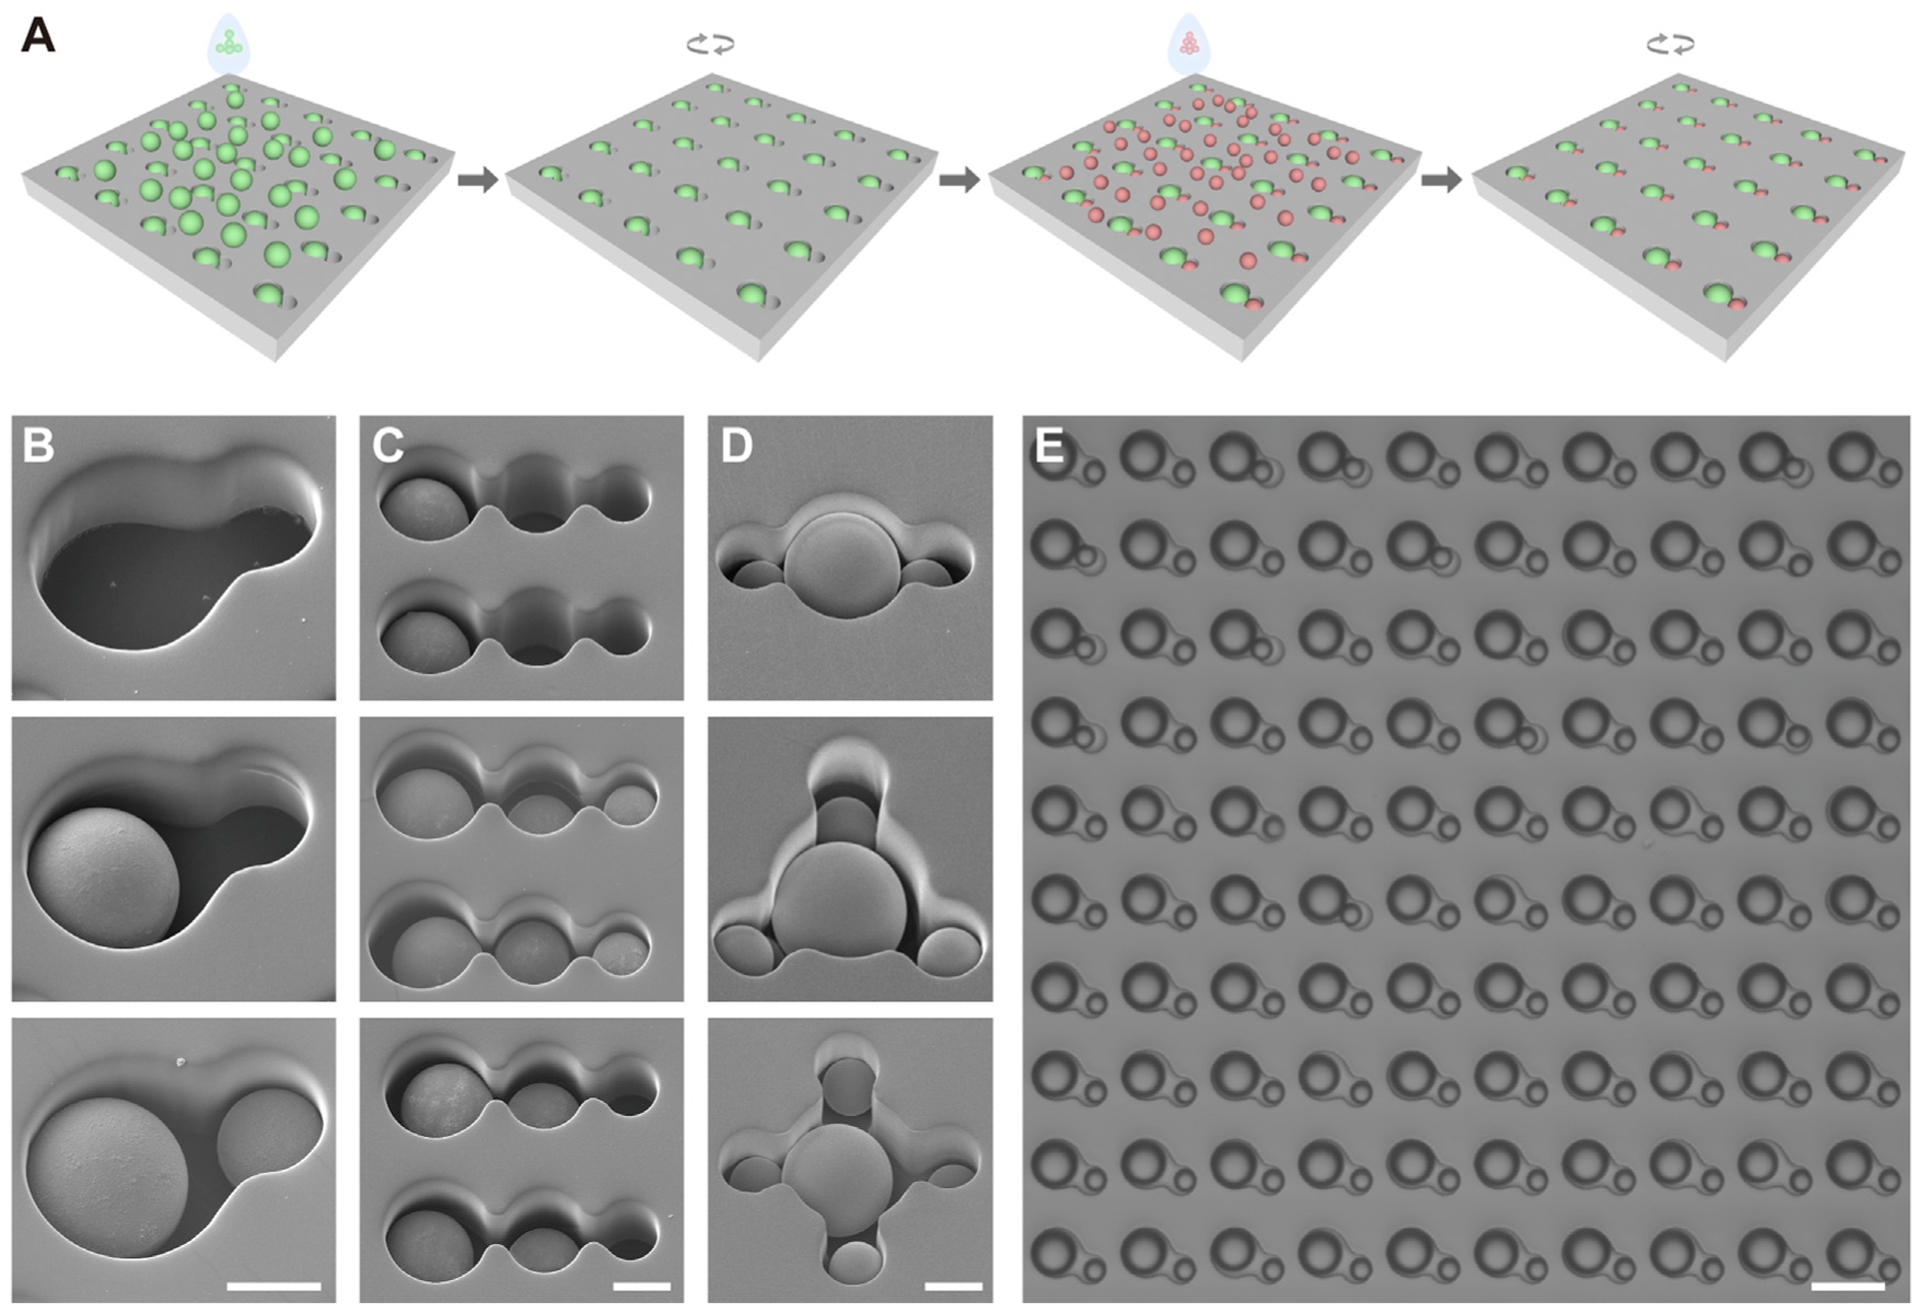
(A) Schematic loading processes of a dual-well HL-Chip.
(B) Representative scanning electron microscope (SEM) images of a dual-well HL-Chip unit with graded loading of beads.
(C) Representative SEM images of tri-well HL-Chip units with graded loading of beads.
(D) Representative SEM images of large well-centered HL-Chip units loaded with beads.
(E) A representative microscopic image of a block of a dual-well HL-Chip loaded with beads.
Scale bars for (B)–(D) are 10 and 30 mm for (E). See also Figure S1.
Evaluation of the HL-Chip
To test the efficiency of the HL-Chip, the fraction of wells occupied by a single bead or cell was calculated. We found the trapping efficiency of large beads to be 99.1% ± 0.3%. Successful pairing was also evaluated by loading of both the large wells and the small wells with any combination of beads and cells. The bead-bead pairing efficiency was 98.1% ± 0.4%, and the bead-cell pairing efficiency was 91.8% ± 3.2% (Figures 2A and 2B). The remarkable performance of the bead-bead pairing may be due to the size exclusion of the wells or to the uniformity and rigidity of the beads. To demonstrate cell-bead or cell-cell-bead pairing, HeLa cells were stained with Calcein AM to distinguish and indicate cell viability. After loading and rinsing, beads and/or T cells (stained with Calcein Red-Orange) were sequentially loaded. We compared the pairing efficiencies of chips with different well diameters and found that restricting the diameter of the large wells by 4 -μm reduced occupancy rates in the first and second rounds of centrifugations, but the occupancy rate could be nearly restored with a third round of centrifugation when compared to a 2 μm deduction or no deduction (Figure S2B). Interestingly, 4 mm deduction improved cell-cell pairing efficiency by reducing the possibility of capturing a second small cell within the dual-well unit, suggesting that large well diameter is a primary concern when cells are loaded first (Figure S2C). The occupancy rate of HeLa cells was96.7% ± 1.9% and overall pairing efficiency was 75.5% ± 4.9% for cell-cell pairs (Figures 2C, 2D, and S2E) and 70.7% ± 7 9% for cell-cell-bead pairs (Figures 2E–2G). To demonstrate the correlation between pairing efficiency and overlapped cell size distribution, we evaluated the performance of HL-Chip for three cell lines with varied size overlapping: Raji (12.37 ± 2.35 μm), PC-3 (14.64 ± 2.10 μm), HeLa (15.60 ± 2.18 μm) using dual-well HL-Chips of multiple diameters (Figures S2A and S2D). The more the cell sizes overlapped, the lower the pairing efficiencies were observed. The pairing efficiencies are also influenced by the size difference between two wells. The best pairing efficiencies and corresponding diameters of dual-well for HeLa-Raji, PC-3-Raji, and HeLa-PC-3 were 77.0% (19/ 14 μm), 75.0% (18/12 μm), and 49.8% (19/17 μm), respectively (Figure S2D). Importantly, the HL-Chip can also generate cell-cell combinational pairs in a high-throughput, deterministic manner (2:1, 3;1, 4:1, 1:2, 1:3) (Figures S1H–S1M). These results demonstrate that the HL-Chip is capable of trapping and pairing beads and cells with high efficiency and control.
Figure 2. Optimized Performance of the HL-Chip for Trapping Bead-Cell Pairs, Cell-Cell Pairs, and Cell-Cell-Bead Pairs.
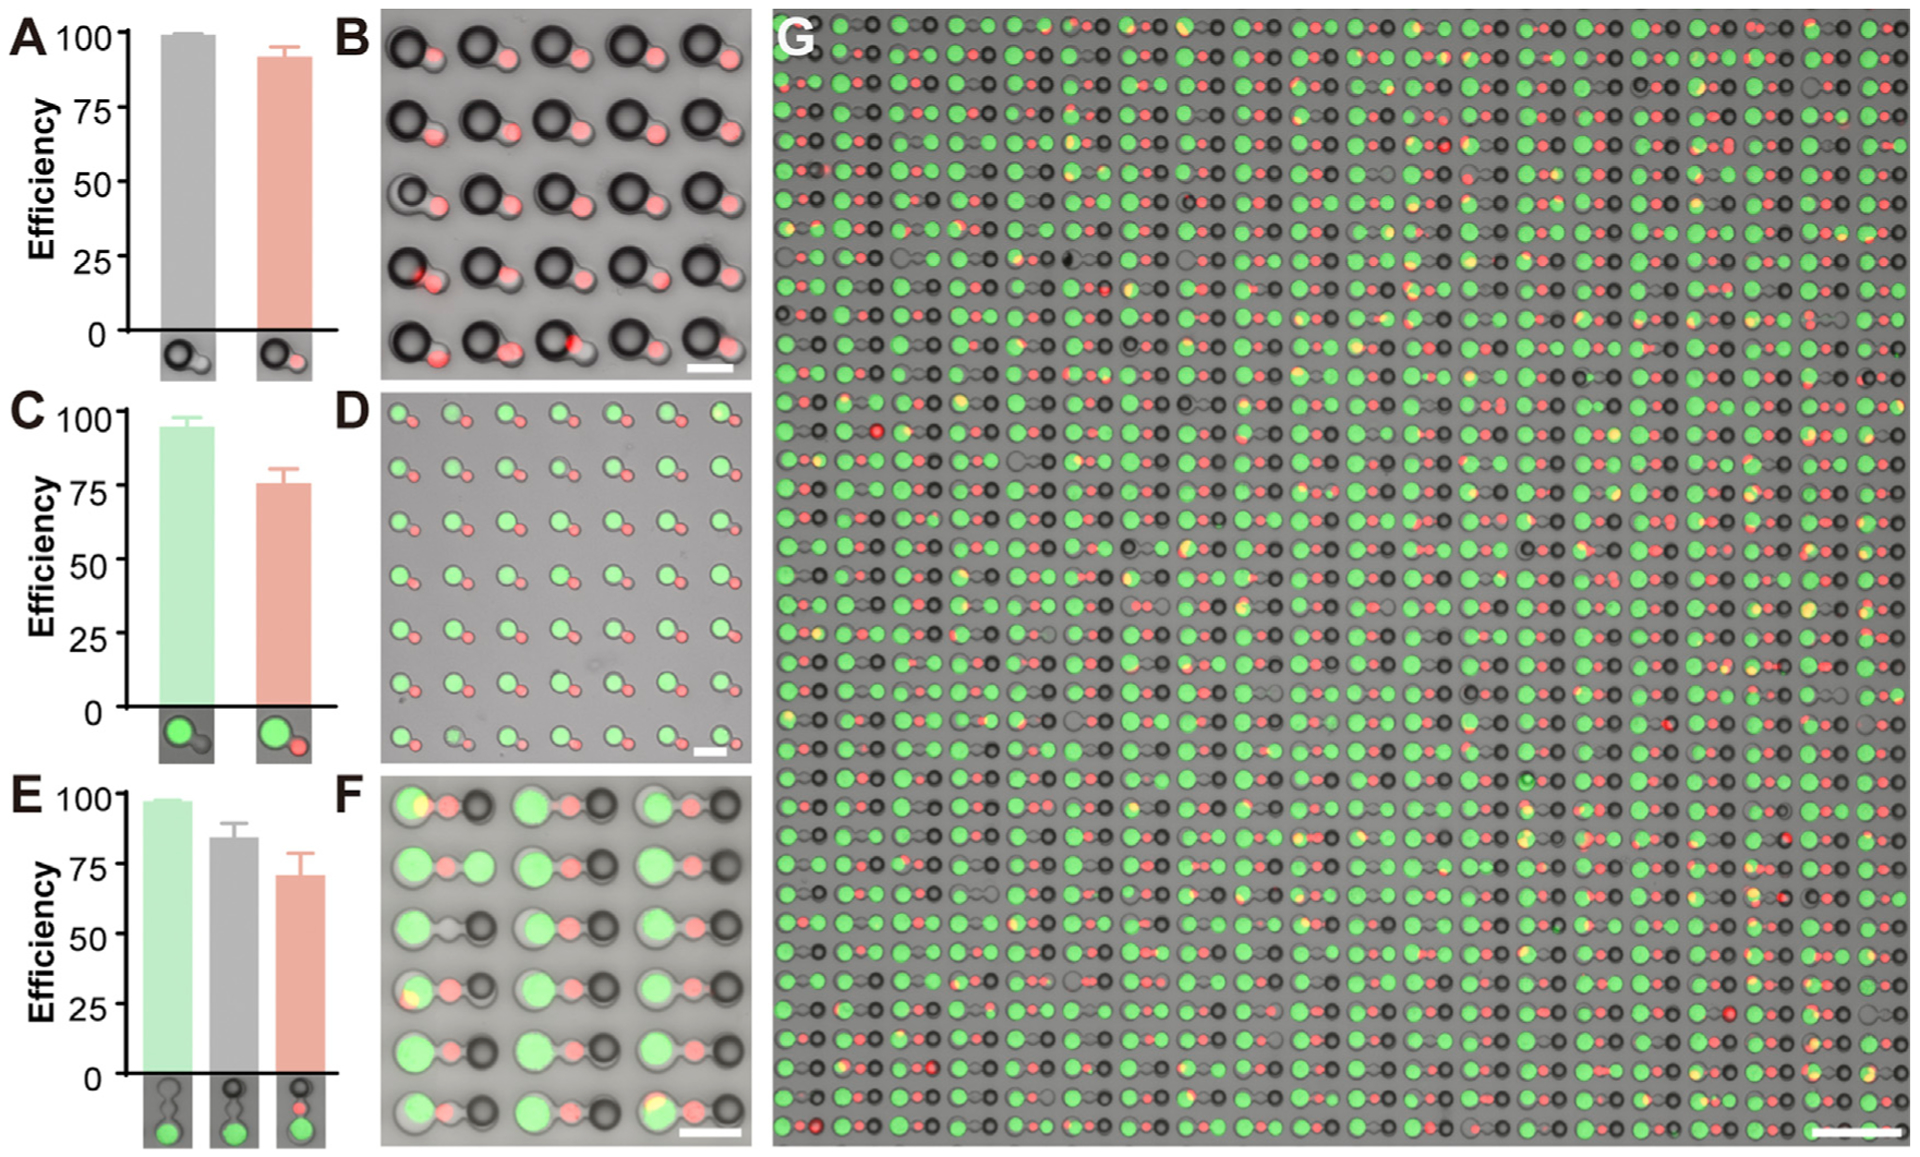
(A and B) Loading efficiency (A) and representative (B) bright-field image overlaid with fluorescent image of bead-cell (red) pairing.
(C and D) Loading efficiency (C) and representative (D) overlaid image of cell-cell pairing.
(E) Loading efficiency and (F) representative overlaid image of cell-cell-bead pairing.
(G) A representative overlaid image depicting cell-cell-bead pairing. Loading and pairing efficiency (Well occupied/Well total) was calculated from three randomly selected microscopic fields (>400 well units) from at least three independent loading experiments.
Scale bars for (B), (D), and (F) are 30 mm and for (G) 100 μm.
See also Figures S1 and S2.
HL-Chip-Based Immunoassay to Detect Cytokine Secretions from Single Lymphocytes
Given the precision and efficiency of the HL-Chip in aligning bead-cell pairs in close proximity, we developed a microbeads-based cytokine detection chip (CD-Chip) to detect secretions of single lymphocytes. Figure 3A depicts the working principle of the CD-Chip. Antibody-coated beads and lymphocytes were sequentially deposited, resulting in their shared bath of 28.4 pL of medium. Proteins secreted by single lymphocytes were then captured by a lawn of high-affinity antibodies that were immobilized on the oversized bead surface prior to diffusion into the bulk medium. The center-to-center distance between units was adjusted to 80 μm so that minor diffused proteins were impeded from binding to neighboring beads. By measuring the fluorescence of beads in wells co-seeded with cells and adjacent wells without cells after 8-h phorbol 12-myristate 13-acetate (PMA)/ionomycin stimulation, our results indicate that there is no significant cross-contamination from the neighboring wells (Figure S4I). To further reduce protein diffusion and to prevent T cells from drifting out of the microwells, we set the microwell depth to 50 μm. Previous studies have shown that T cells secrete interferon (IFN)-γ at rates ranging from 0 to 120 molecules/s, and low secretion rates dramatically compromise capture efficiency (Han et al., 2010; Torres et al., 2014). Thus, assuming T cells secrete proteins at 10 molecules/s, we sought to evaluate the analyte capture efficiency by modeling five simplified microwell configurations over 8 h periods: closed cucurbit well of 30 μm depth, open cucurbit well of 30 μm depth, open cucurbit well of 50 μm depth, open cubic well of 50 μm depth, and open tri-well of 50 μm depth. Finite element simulation suggested that analyte concentration on the bead surface synchronously increased with the concentration in the bulk medium in the open 30 μm depth cucurbit well configuration (Figures S3A, S3D, and S3E). Simulation also suggested that increasing the microwell depth from 30 to 50 μm improved the overall capture efficiency by 8%–9% in open configuration, whereas, switching from a cucurbit to a cubic well design reduced capture efficiency to one-third in first 4 h and to one-half by 8 h (Figure S3F). To investigate the effect of the T cell position on cytokine capture, we simulated capture efficiency where the T cell was placed on two extreme position in tri-well structure (far and near). The simulation (Figures S3B, S3C, and S3F) showed that capture efficiency was 18.6% at 2 h and 23.1% at 8 h for far position while 39.7% at 2 h and 29.8% at 8 h for near position. For 2-h cytokine detection, the position of the T cell affect capture but, for 8-h detection, the position of T cells probably would not significantly affect capture since T cell will not sitting still at far position all the time. We used two methods for detection: (1) To preserve cell viability, tetrafluorophenyl-ester-labeled antibodies were employed for in situ detection in a sandwich format. (2) To enhance detection sensitivity, tyramide signal amplification (TSA) technology was incorporated in the detection steps. Detection sensitivities were tested by directly incubating functionalized beads in microwells with serially diluted extrinsic IFN-γ. Figures S3G–S3L show that the low limit of detection (LoD) reached 0.16 ng/mL using the TSA method, which was a 10-fold improvement in sensitivity. This detection limit still has room to improve (Rissin et al., 2010), but we found that the 0.16 ng/mL was sufficient for the system to detect IFN-γ and IL-2 secreted from single cells. The small volume of the microwells had a capability to concentrate cytokines produced from even one cell. To verify the predicted performance, we used a CD4+ TIL clone (2B2), which specifically recognizes a mutated peptide (a 25-mer PCDHB16 peptide with a specific mutation; unpublished data) but not the wild-type peptide, as a model. First, we directly applied PMA and ionomycin to the loaded microwell arrays to stimulate IFN-γ release. Figures 3B and 3C demonstrate that the CD-Chip is capable of detecting partial IFN-γ release (mean fluorescence intensity [MFI] >102 a.u.) from 80.6%, 98.5%, and 99.4% of total T cells and abundant IFN-γ release (MFI >102.9 a.u.) from 48.4%, 85.3%, and 94.7% of total T cells after 2, 4, and 8 h, respectively.
Figure 3. CD-Chip for High-Throughput Detection of Cytokine Secretion from Single Lymphocytes.
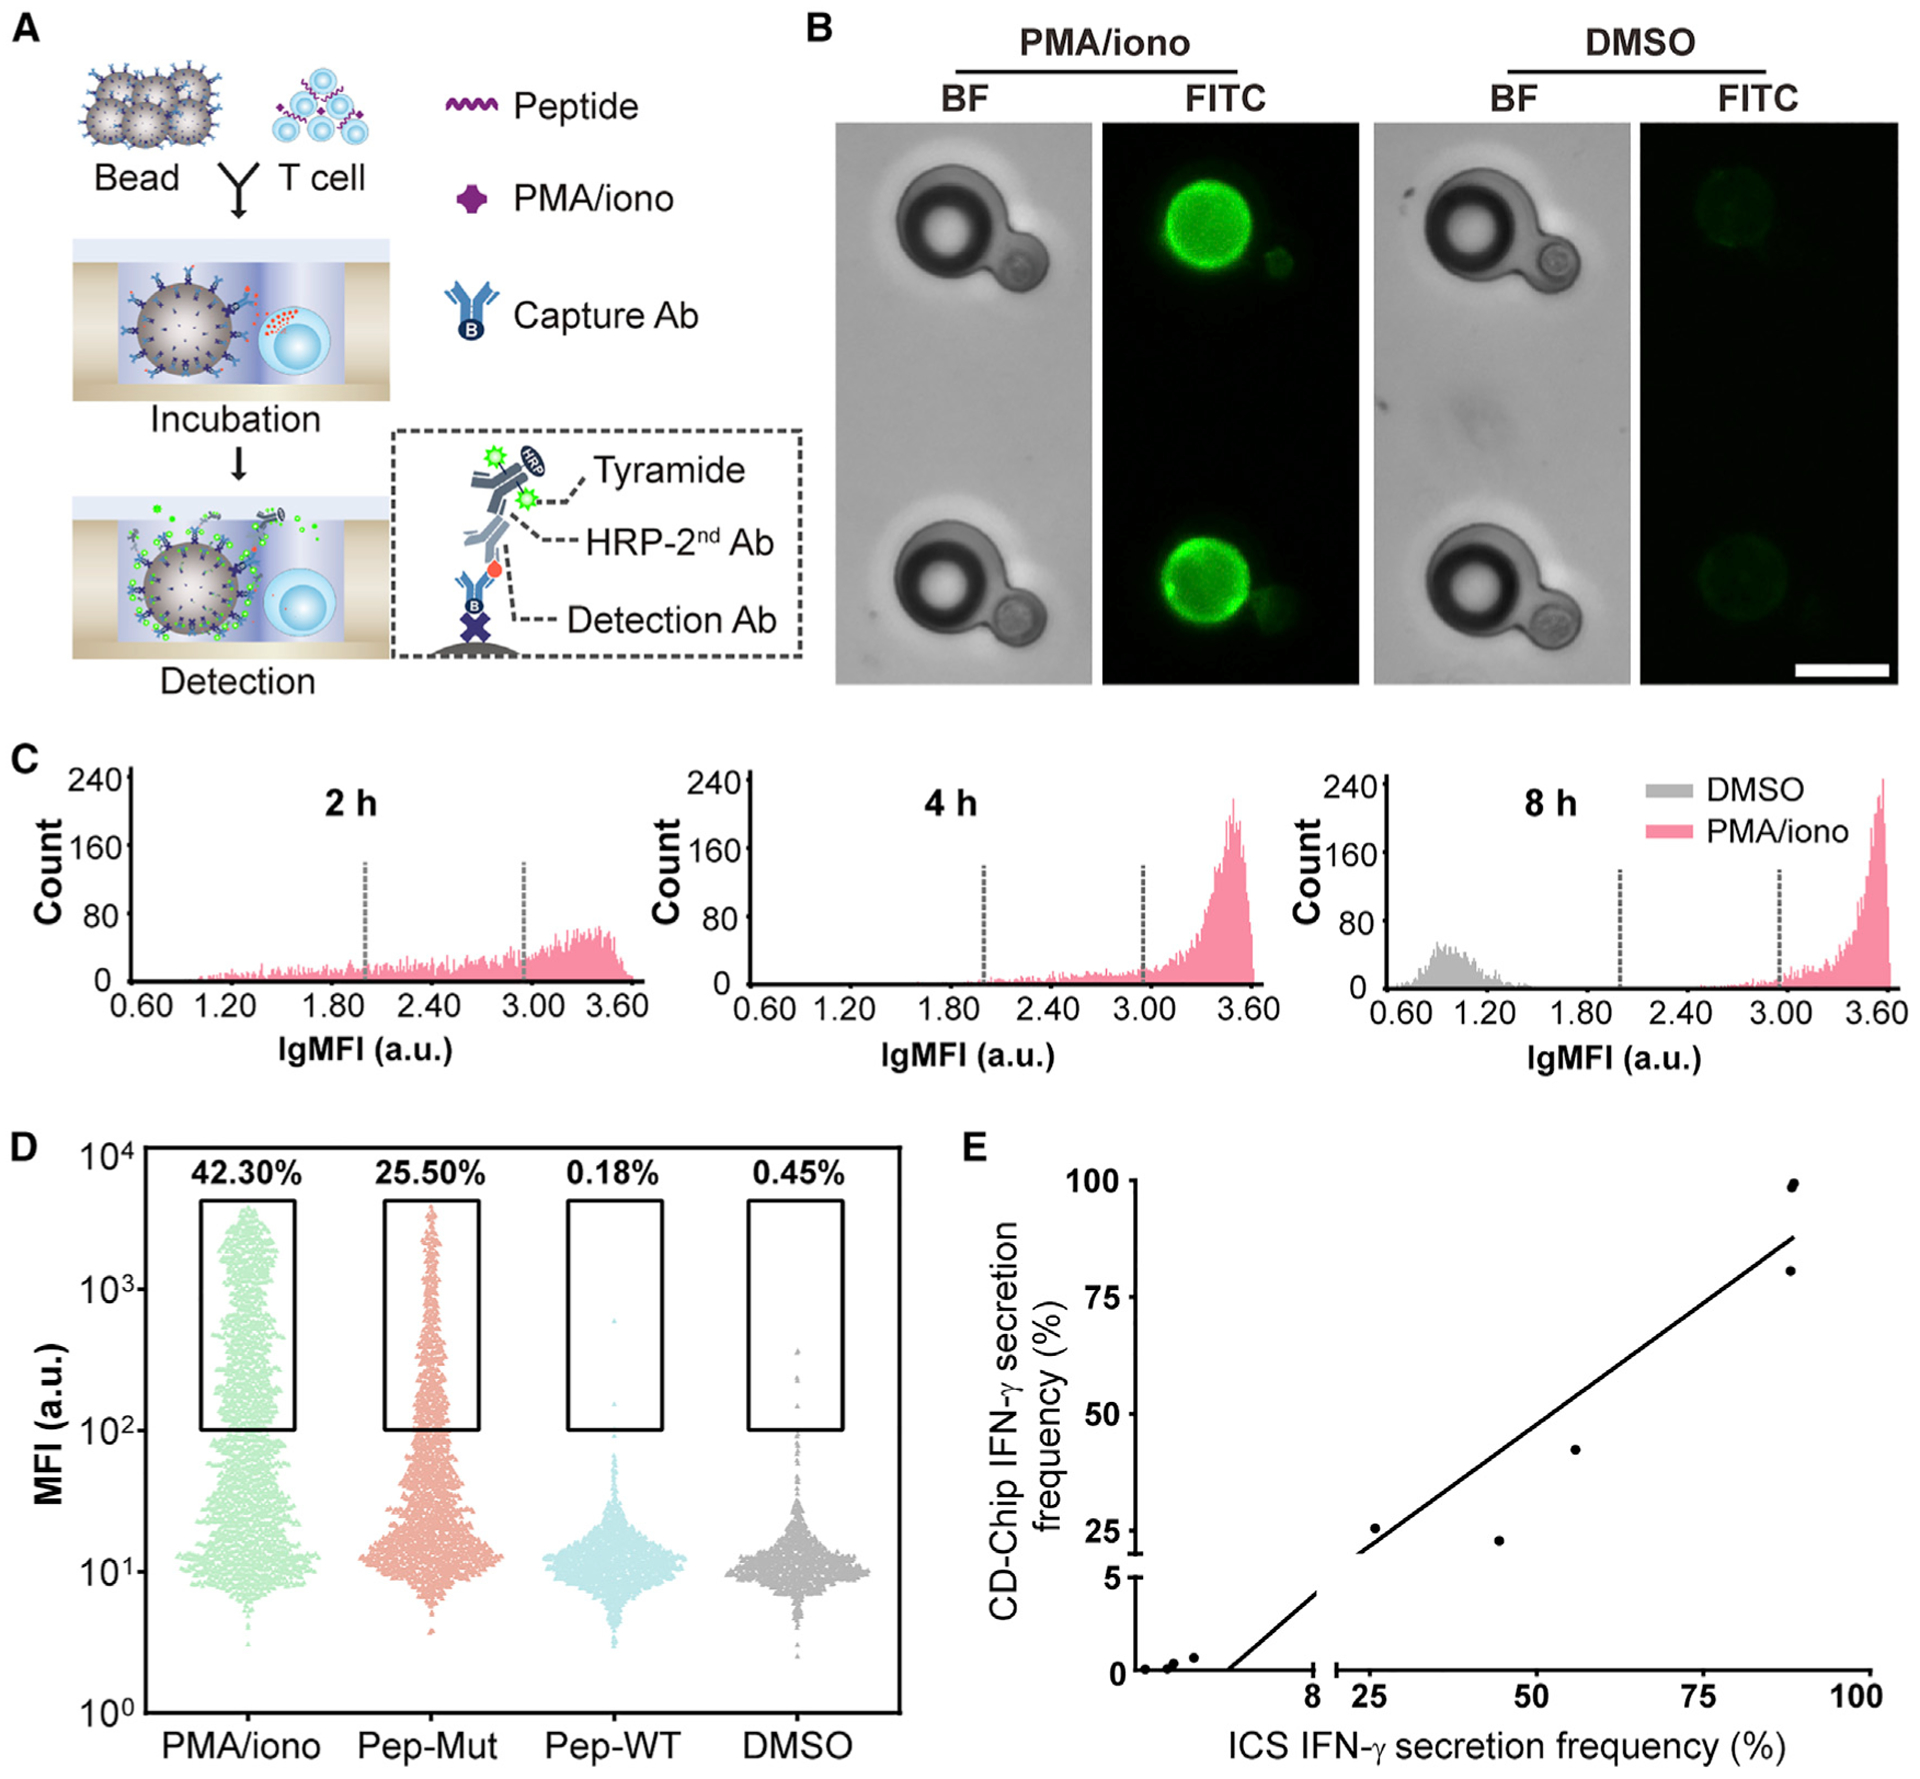
(A) Scheme of the CD-chip. Antibody-bearing beads in proximity to T cells inside microwells were co-incubated briefly in open configuration, followed by in situ dye-labeled antibody or TSA detection.
(B) Bright-field and green fluorescent images of IFN-γ detection 4 h after on-chip stimulation with PMA/ionomycin (left) or DMSO as a control (right). Scale bar, 20 μm.
(C) Mean fluorescence intensity (MFI) distribution of individual beads 2, 4, or 8 h after on-chip stimulation of clonal TILs with PMA/ionomycin or DMSO. Dotted lines indicate threshold for partial (MFI >102) and abundant (MFI >102.9) release.
(D) Actively secreting clonal TILs were enumerated 8 h after on-chip incubation. The TIL clone, which specifically recognizes a mutated peptide, was pre-treated for 8 h off-chip, as indicated. Each data point represents MFI for one bead paired with one cell for >1,000 pairs from n = 3 independent experiments.
(E) Correlation analysis between ICS and the CD-Chip.
See also Figures S3 and S4.
To determine the correlation between the CD-Chip assay and ICS, the frequencies of actively secreting clonal T cells were enumerated in four additional experiments with off-chip stimulation for 8 h, followed by on-chip detection for another 8h. The stimulation settings of the four experiments were as follows: (1) PMA/ionomycin; (2) recognizable mutated peptide pulse or (3) non-recognizable wild-type peptide pulse; and (4) DMSO. By analyzing an average of 2,000 microwells containing single beads paired with single cells, the frequency of T cells actively secreting IFN-γ was determined to be 42.3%, 25.5%,0.18%, and 0.45% (Figure 3D; Figures S4A–S4E) in each group. The magnitude of the responses was similar to those recorded by ICS (55.8%, 25.8%, 1.53%, and 1.80%) (Figures S4J and S4K). Additionally, the magnitude of peripheral blood lymphocytes (PBLs) responses to PMA/ionomycin, PP65 peptide, or DMSO was also compared (Figures S4F–S4H and S4L). Importantly, the results of both assays were significantly correlated (R2 = 0.9452) (Figure 3E). Additionally, by using tri-well HL-Chips to trapping two different antibody-functionalized beads in each side of T cells, we were able to concurrently detect IFN-γ and IL-2 secretion from single T cells (Figures S4M and S4N), demonstrating that the CD-Chip assay is capable of detecting multiple cytokine secretion from single lymphocytes with high sensitivity and specificity.
To demonstrate the feasibility of single-cell retrieval with preserved viability, we performed CD-Chip assays using PBLs pulsed with PP65 peptide and then used a micromanipulator combined with a microinjector device to manually retrieve single abundantly secreting cells (Figures S4O–S4Q). Retrieved single T cells were seeded with irradiated PBLs in 96-well plates individually. After 3 weeks, single T cells seeded in the wells successfully grew into clones while no clone was observed in unseeded wells (Figure S4R), indicating that T cells after CD-Chip assays are still viable enough to proliferate.
Single-Cell On-Chip Cytotoxicity Assay Using Dual-Well HL-Chips
Immune cells must coordinate their motility to make transient or prolonged contacts for optimum signal integration and to elicit appropriate immune responses. To survey large areas, T cells migrate at high speeds and persistent trajectories. After binding to antigen-bearing target cells, T cells undergo velocity decrease, synapse formation, cytoskeleton reorientation, and polarized secretion (de la Roche et al., 2016; de Saint Basile et al., 2010). To understand how immune cells conform motility with cytotoxicity, we also employed dual-well HL-Chips to investigate immune cell-tumor cell interactions. Compare with conventional microwell or micro-fluidic platforms, HL-Chip offers better controllability and higher pairing efficiency than the former, easier manipulation, and minor restriction to cell movements than the latter. We used in vitro-transduced NY-ESO-1-specific TCR-T cell receptor (TCR)-T cells (Figure S5A) and peptide-pulsed PC-3/ HLA-A2 cells (a prostate cell line transfected with a full-length HLA-A2 gene to promote uniform antigen presentation, Figure S5B) as a model for studying immune cell-tumor cell interactions at single-cell resolution (Figures 4A and 4B). NY-ESO-1 TCR-T cell-based immunotherapy is the most successful TCR-based immunotherapy for solid tumors (Wang and Wang, 2017). Therefore, a detailed characterization of NYESO-1 T cell interactions would add to our understanding of the underlying mechanisms of immunity as well as help to identify correlates of immunological intervention. Before loading, PC3/HLA-A2 cells were either pulsed with a high dose of the NY-ESO-1157–165 peptide or NY-ESO-V157–165 peptide for 1.5 h and then stained with Calcein Red-Orange to indicate cell viability. NY-ESO-1 T cells were stained with carbocyanine dye DiO for better visualization of cell contract and extension. Treated target cells and T cells were sequentially loaded and imaged at 2.5-min intervals for 4 h (Videos S1 and S2). T cell-mediated cytotoxicity was determined by distinct decreases in fluorescence and morphology alterations of target cells, such as membrane blebbing or cell explosion. For single target cell paired with single T cell, 29.76% and 50.02% lysis events occurred for NY-ESO-1157–165 peptide-pulsed target cells and NY-ESO-V157–165 peptide-pulsed target cells, respectively (Figure 4C). In the absence of target cells, T cells circuited within microwells at high velocities. In the presence of target cells, T cells bounded to the target cells and moved at low velocities. Deceleration was more obviously observed when target cells were pulsed with the NY-ESOV157–165 peptide (Figures 4D and 4E). Regardless of lytic events, T cells showed no statistical differences in velocities when target cells were pulsed with the NY-ESO-1157–165 peptide. On the contrary, T cells underwent tremendous retardation when NY-EOS-V157–165 peptide-pulsed target cells were lysed (Figure 4F). After lysis of target cells, T cells restored their velocities (Figure 4G). Compare with the NY-ESO-V157–165 peptide, T cells tend to alter to more elongated shapes when interacted with NY-ESO-1157–165 peptide-pulsed target cells (Figure 4H).
Figure 4. Single-Cell On-Chip Cytotoxicity Assay Using Dual-Well HL-Chips.
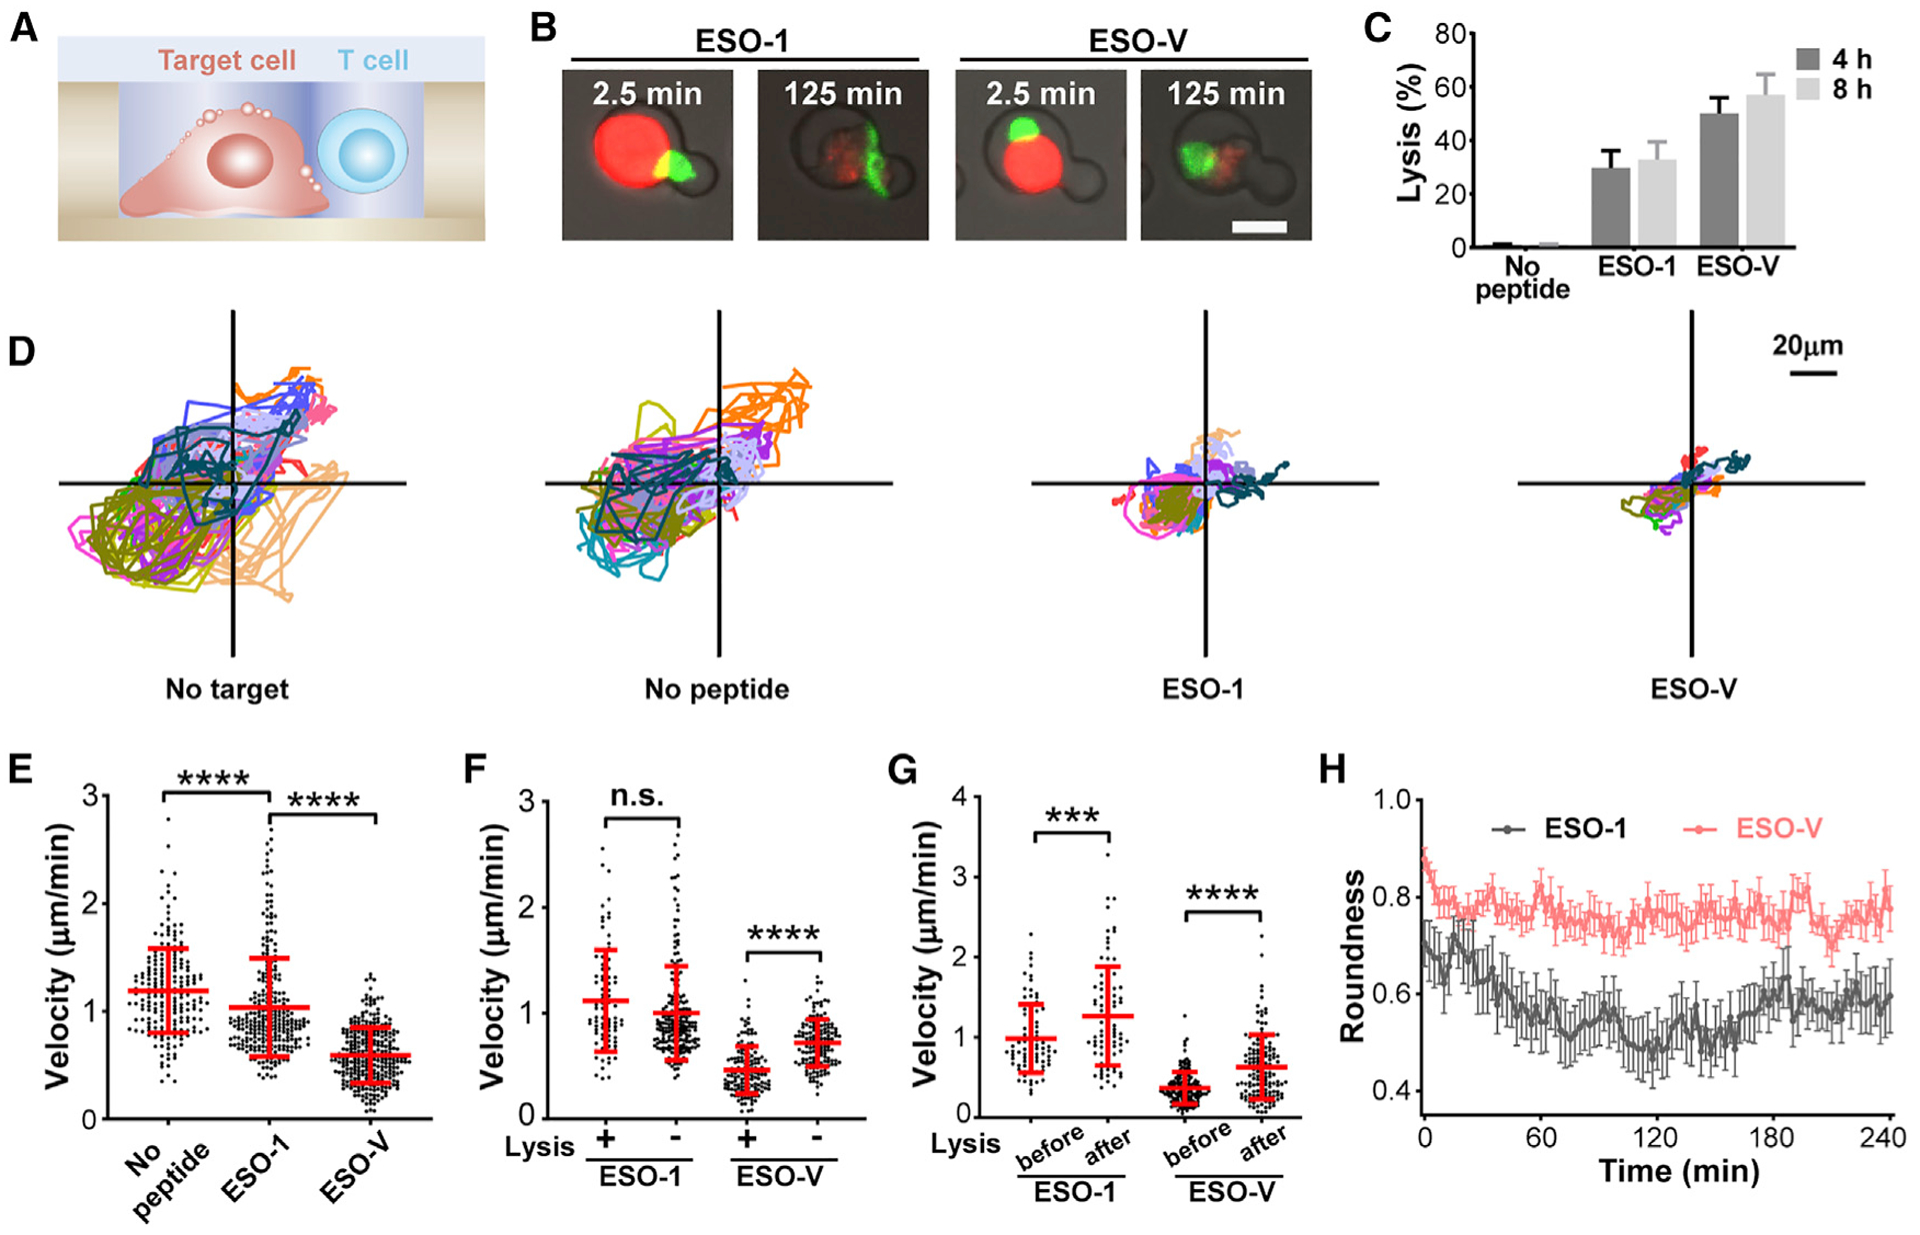
(A and B) Illustration (A) and microscopic images (B) of the cytotoxicity mediated by NY-ESO-1 TCR-T cells against peptide-pulsed PC3/HLA-A2 cells. Scale bar, 20 μm.
(C) Lysis rates of single NY-ESO-1 TCR-T cells paired with single target cells without pulsing or pulsed with the NY-ESO-1157–165 peptide or the NY-ESO-V157–165 peptide for 4 or 8 h. Results are from n = 4 independent experiments. (D) Tracks of NY-ESO-1 TCR-T cells in the absence of target cells, paired with target cells without pulsing or pulsed with indicated peptides. Each plot displays n = 15 randomly selected tracks.
(E) Mean velocities of NY-ESO-1 TCR-T cells in microwells paired with target cells without pulsing (n = 211) or pulsed with the NY-ESO-1157–165 peptide (n = 282) or the NY-ESO-V157–165 peptide (n = 285).
(F) Mean velocities of lytic and non-lytic NY-ESO-1 TCR-T cells paired with target cells pulsed with indicated peptides.
(G) Mean velocities of NY-ESO-1 T cells before and after lysis of target cells pulsed with indicated peptides. Data represent mean ± SD. Each data point represents mean velocity for one cell from n = 4 independent experiments for (E)–(G). **p < 0.01, ***p < 0.001, ****p < 0.0001, by two-tailed Student’s t test.(H) Roundness of 20 randomly selected NY-ESO-1 T cells paired with target cells pulsed with indicated peptides. Data represent mean ± SEM.
Compared with the NY-ESO-V157–165 peptide, the NY-ESO-1157–165 peptide shows less antigenicity and immunogenicity due to a lower binding affinity to HLA-A2 molecules and TCR (Chen et al., 2000). Our findings are in line with the previous published data concluded from bulk population and extend it by showing that the quality of TCR ligand control lytic efficiency at single-cell resolution. Smaller elevations in intracellular calcium and inability to recruit lytic granules to synaptic cleft triggered by weaker stimuli have been reported to be the causes for inefficient cytotoxicity trigging (Beal et al., 2009; Jenkins et al., 2009). Apart from cellular intrinsic mechanisms, our results further indicate that killing efficiency is also a consequence of contact stability influenced by TCR ligand quality.
Integrated Single-Cell Analysis of Immediate Cytotoxicity and Short-Term Cytokine Secretion
Cytolysis and secretion are the primary functions of T cells but remain a challenge to study in direct interrogation with target cells. Although several molecular parameters, such as antigen dose, adhesion molecule, TCR affinity, and major histocompatibility complex (MHC) occupancy, have been shown to influence intercellular contacts, the impact of cellular context on the magnitude and dynamics of downstream effector functions remains incompletely understood (Davis, 2009). Here, we exploited tri-well HL-Chips to simultaneously investigate the dynamic interactions and functional consequences of NY-ESO-1 TCR-T cells interacting with PC-3/HLA-A2 target cells (Figures 5A and 5B). We pulsed target cells with peptides of different affinity and investigated detailed behaviors of individual −1 TCR-T cells to coordinate TCR engagement. The treated PC-3/HLA-A2 cells, antibody-functionalized beads and NY-ESO-1 TCR-T cells were sequentially loaded and time-lapse imaging was performed at 5-min intervals for 8 h (Videos S3 and S4). T cell-mediated cytotoxicity was determined from time-lapse images and IFN-γ secretion was evaluated by TSA detection after the imaging. Statically, 28.20% NY-ESO-1 TCR-T cells lysed the target cells, 37.04% released IFN-γ, and 18.36% exhibited both lytic and secretory activities for the NY-ESO-1157–165 peptide-pulsed target cells. For NY-ESO-V157–165 peptide-pulsed target cells, 54.41% NY-ESO-1 TCR-T cells lysed target cells, 28.88% released IFN-γ and 21.88% exhibited both activities (Figure 5C). A stronger NY-ESO-V ligand lead to higher lytic proportion and lower IFN-γ secreting proportion and secreting rate than the NY-ESO-1 ligand (Figure S5F). Lytic T cells still showed higher IFN-γ secreting proportion (72/179, 40.2%) than non-lytic T cells (23/150, 15.3%) for the strong NY-ESO-V ligand, but the difference became smaller when compared with lytic T cell (56/86,65.1%) and non-lytic T cells (157/219, 26.0%) against the NY-ESO-1 ligand. To determine whether the presence of the antibody detection beads affect cytolysis, we performed 8-h dual-well lysis experiments for the NY-ESO-1157–165 peptide and NY-ESO-V157–165 peptide. Our results indicated that there was a small negative effect on cytolysis, probably originated from inevitably contacts between T cells and beads in tri-well chips (Figure 4C). Since this effect was all or none when we compare the NY-ESO-1 ligand with the NY-ESO-V ligand, this effect didn’t impact our conclusion. If target cells were not pulsed with peptides, IFN-γ secretions were not detectable, and effector-mediated lysis was less than 2%, confirming the specificity of T cell-mediated functions to the cognate epitope (Figure S5C). Cytolytic T cells showed more abundant IFN-γ secretion than the non-cytolytic group, indicating that the mechanisms that promote cytotoxicity could be interwoven with those that control IFN-γ secretion. For 2-h interrogation, IFN-γ secretion was similar in non-lytic T cells for both ligands. However, lytic T cells still released more IFN-γ than non-lytic T cells against both ligands (Figures S5D and S5E). Besides, we plotted the timing of lysis with IFN-γ secretion level in both ligands for 8-h interrogation and found there was no correlation between them, indicating that the timing of lysis does not interrupt IFN-γ secretion (Figures S5G and S5H).
Figure 5. Integrated Single-Cell Analysis of Immediate Cytotoxicity and Short-Term Cytokine Secretion along with Interaction Patterns.
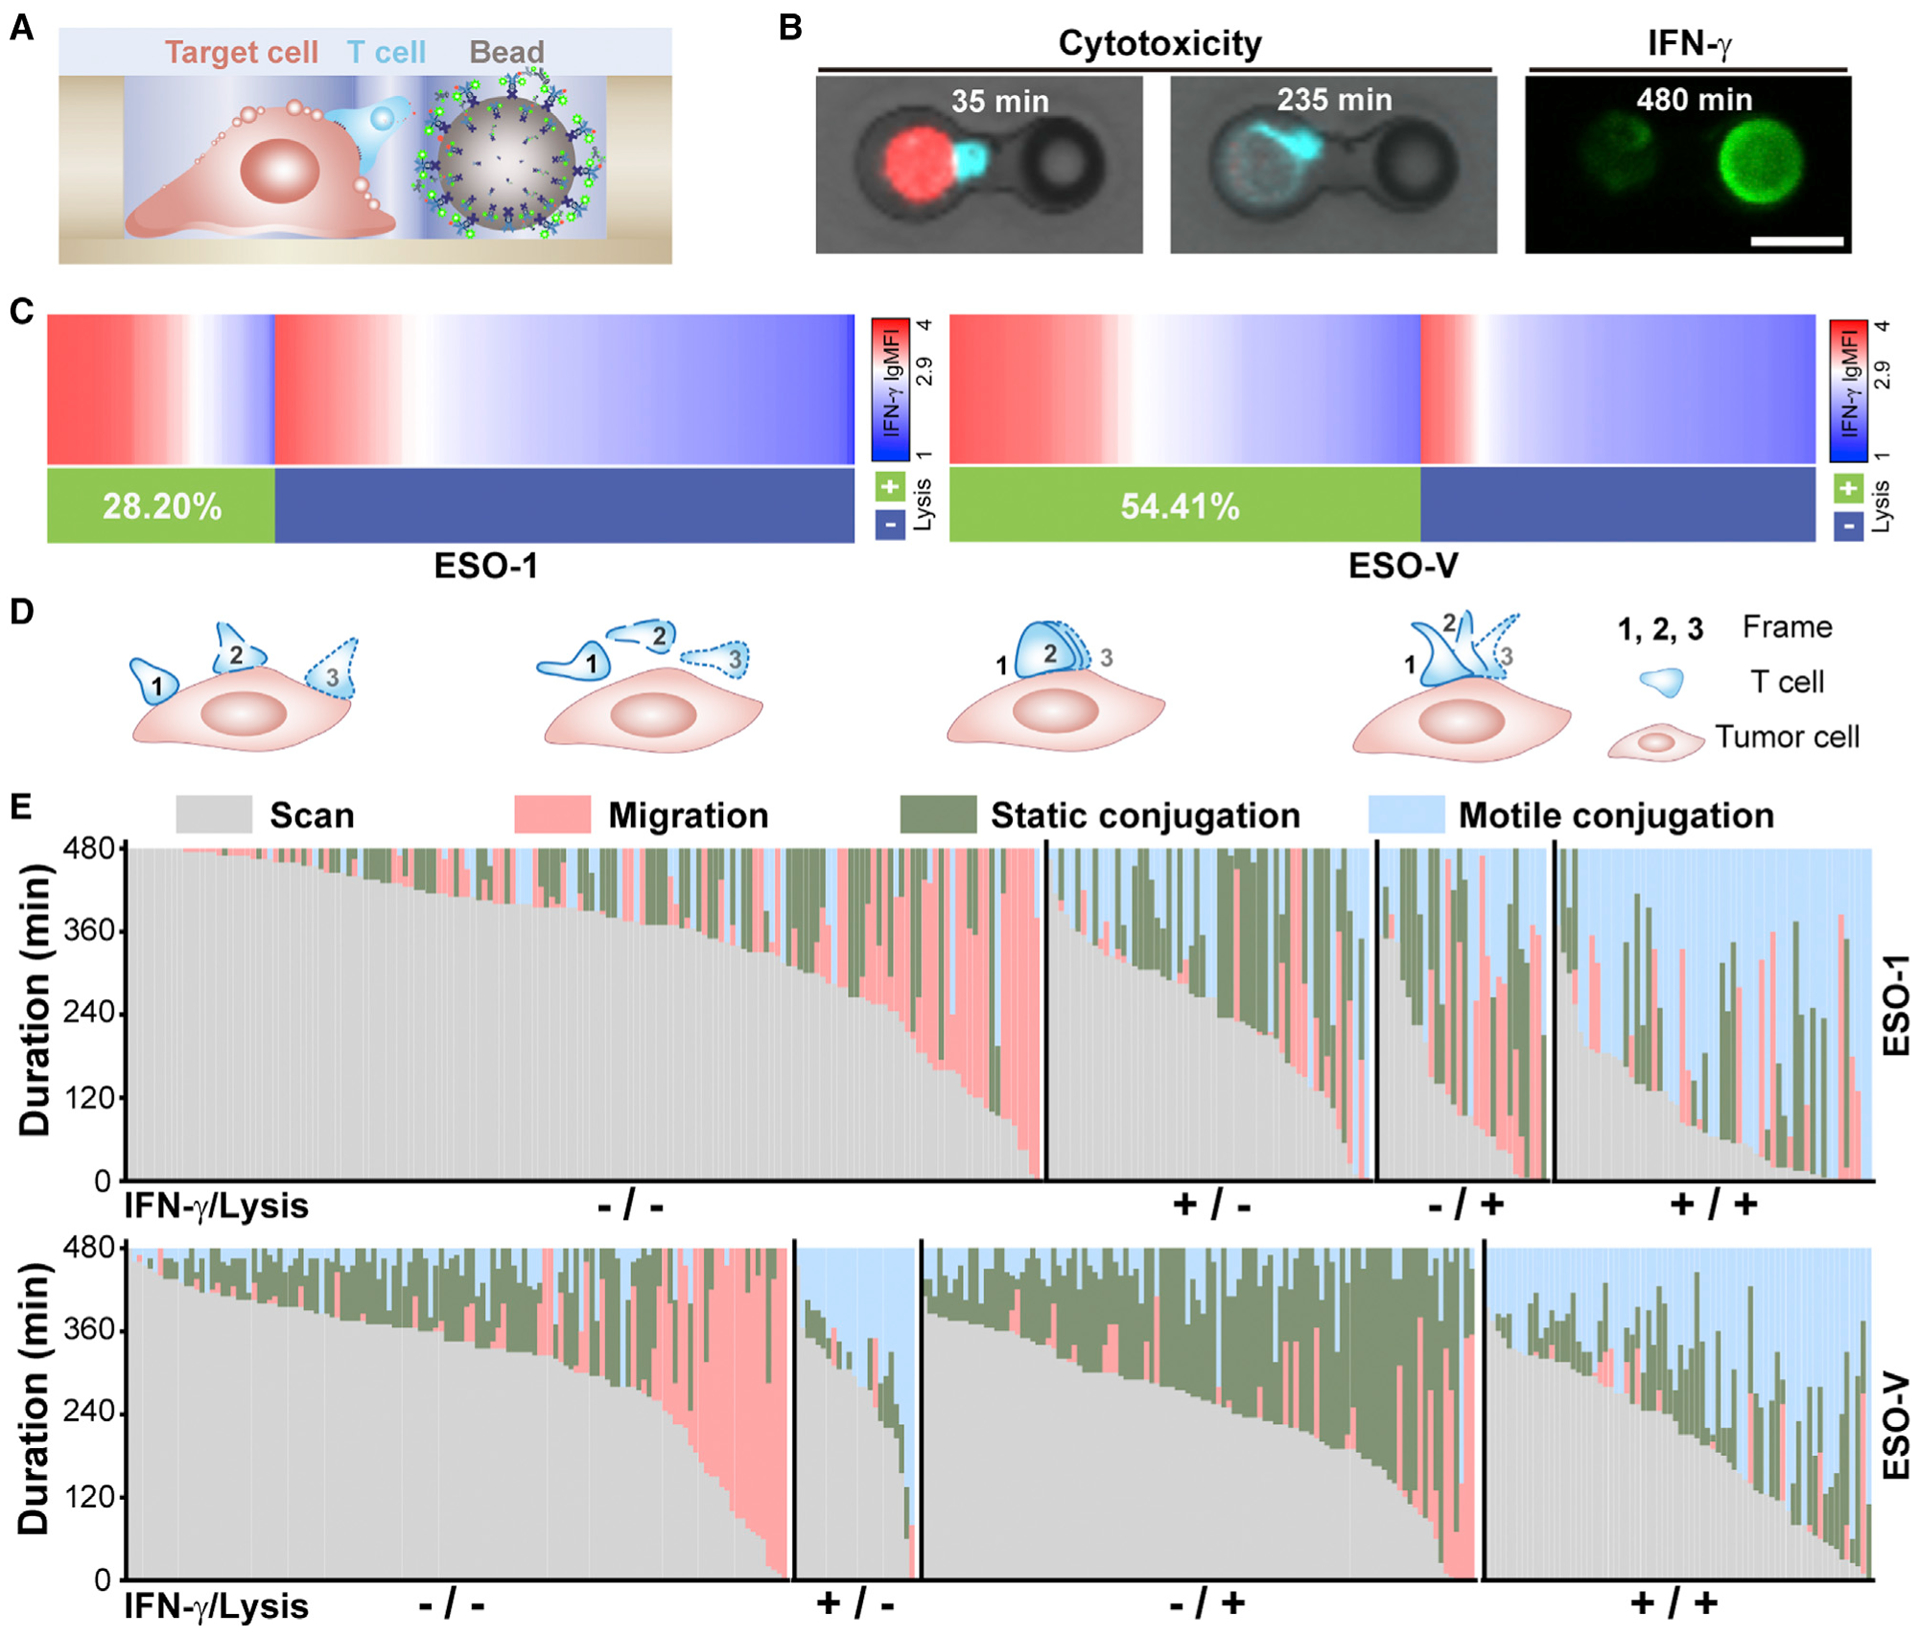
(A and B) Illustration (A) and microscopic images (B) of the assay used for concurrent detection of cytotoxicity and cytokine secretion. NY-ESO-1 TCR-T cells (cyan) mediated cytolysis of peptide-pulsed PC-3/HLA-A2 (red) cells was monitored by distinct decreases in fluorescence and morphology alterations. IFN-γ was detected 8 h after incubation. Scale bar, 20 μm.
(C) Heatmap for IFN-γ secretion is aligned from maximum to minimum with the cytolytic activity for NY-ESO-1 TCR-T cells against target cells pulsed with the NYESO-1157–165 peptide (left, n = 305) or the NY-ESO-V157–165 peptide (right, n = 329).
(D) Phases classification of NY-ESO-1 TCR-T cell-PC-3/HLA-A2 cell interactions (left to right: scan, migration, static conjugation, and motile conjugation).
(E) Comparison of phase duration among different functional groups. Each column represents a single target cell-T cell-bead triplet (top, n = 305 for the NY-ESO-1157–165 peptide pulsing; bottom, n = 329 for the NY-ESO-V157–165 peptide pulsing) with the corresponding phase duration proportionally mapped to the column.
LgMFI >2.9 was defined as IFN-γ+. Data are from four independent experiments for (C) and (E).
See also Figure S5.
To further investigate the relationship between IFN-γ secretion, target cell lysis, and the interaction patterns between T cells and target cells, we divided NY-ESO-1 T cells into four functional groups: IFN-γ−/lysis−, IFN-γ+/lysis−, IFN-γ−/lysis+, and IFN-γ+/lysis+. We then analyzed the entire contact history of each NY-ESO-1 T cell recorded. Instead of measuring the absolute velocities, we deciphered the relative movement of T cells over target cells frame by frame, since target cells tend to shuttle back and forth in tri-well units compare with dual-well units. In general, T cell-target cell interactions could be classified into four different phases: migration, scanning, static conjugation, and motile conjugation (Figure 5D). During migration, T cells moved freely within the microwell without physical contact with target cells. After reaching target cells, T cells either scanned the target cells at high velocities or conjugated with target cells. Static conjugation was characterized by a tight “bite” exerted by typically rounded T cells on target cells with no displacement. In contrast, motile conjugation involved the elongation of T cells into irregular shapes, continuous probing of small surface zones, and subtle displacements from targets between frames. We defined two criteria to distinguish motile conjugation from static conjugation: (1) roundness <0.5 (Olofsson et al., 2014) or (2) relative displacement >1/4 target cell’s body between juxtaposed frames (Figures S5I and S5J). The total phases duration of target cell-T cell-bead triplets was quantified within the four functional groups. Importantly, T cells in the IFN-γ–/lysis– group had longer migration and scanning phases than all other groups, which is consistent with the case for target cells that were not pulsed with peptide (Figure 5E; Figures S5M and S5N). It is of note that the migratory phase differences between lysed and non-lysed cells cannot reflect differences in cell absolute velocities (Figure 4F) but are more representative of T cells’ relative motility. Longer static or motile conjugation in lytic T cells means T cells exhibit more “still”; phases, but afterward T cells may experience more active scan or migration phase (Figure 4G).
As T cells in the IFN-γ−/lysis− group constituted 53.1% for the NY-ESO-1 ligand and 38.6% for the NY-ESO-V ligand, while only 28.4% of T cells in the whole population didn’t present NY-ESO-1 TCR, it is highly unlikely that all non-responses were a consequence of unmatched TCR-pMHC (peptides displayed by MHC proteins) interactions (Figure S5A). Instead, this result may indicate that some NYESO-1 TCR-T cells didn’t come into productive contact or transduce potential contacts into functional responses during the 8-h experimental period. For the NY-ESO-1 peptide, lytic NY-ESO-1 TCR-T cells showed slightly more static conjugation and significantly more motile conjugation than non-lytic T cells. While for the NY-ESO-V peptide, lytic NY-ESO-1 TCR-T cells showed significantly more static and motile conjugation (Figure 5E; Figure S5K). Meanwhile, for the NYESO-1 peptide, secretory T cells showed moderately more static conjugation and significantly more motile conjugation, while, for the NY-ESO-V peptide, secretory T cells showed significantly less static conjugation and significantly more motile conjugation (Figure 5E; Figure S5L).
Previous studies only demonstrated the capacity of the NYESO-1;157–165 peptides to simultaneously elicit humoral and cellular responses at the bulk population level (Jäger et al., 2000). Our results further confirmed the dual function of NYESO-1 TCR-T cells at the single-cell level and extended that cytolysis and IFN-γ secretion are linked. Moreover, the stronger NY-ESO-V ligand displayed lesser linkage than the NY-ESO-1 ligand. Previous studies using microengraving showed that for natural killer (NK) cells or CD8+ T cells interacting with KK10 (HIV-1 p24 Gag epitope) peptide-pulsed B cells, cytolysis and IFN-γ secretion act independently (Varadarajan et al., 2011; Yamanaka et al., 2012), but the experiment conditions are significantly different, including epitopes, antigen-presenting cells, well architectures, and detecting methods. It has been reported that dual activation thresholds exist for T cells interacting with target cells (Wiedemann et al., 2006). Cytotoxicity is a rapid and low-threshold response while IFN-γ production requires prolong and sustained antigenic stimulation (Faroudi et al., 2003). When recognizing NY-ESO-1157–165 or NY-ESO-V157–165 peptide-pulsed target cells, NY-ESO-1 TCR-T cells exhibited a mixture of static and motile conjugation, which has also been previously reported with OT-1 T cells in recognition of Q4 peptide (Moreau et al., 2012). NY-ESO-1 TCR-T cells showed more static conjugation along with more lysis and less IFN-γ secretion for the NY-ESO-V ligand than the NY-ESO-1 ligand. Static conjugation was positively correlated to lysis for both ligands and was also positively correlated to IFN-γ secretion for the NY-ESO-1 ligand but not for the NY-ESO-V ligand. Motile conjugation was positively correlated to both lysis and IFN-γ for both ligands (Figures S5K and S5L). Although static conjugation increases cytotoxicity, our results on the NY-ESO-V ligand further indicate that it could potentially affect IFN-γ production. By pulsing target cells with peptides of different affinities, we actually shed light on the strategies that T cells adopted to overcome threshold for IFN-γ secretion. In fact, static and motile conjugation may be respectively related to “synapse” and “kinapse” that have been described for T cells (Dustin, 2008, 2009). Our results show consistency with the established views that weak TCR signals favor kinapse formation, whereas strong TCR signals preferentially lead to synapse formation (Dustin and Long, 2010). Our results further suggest that kinapse sustain stimulation for IFN-γ secretion, while synapse favor cytotoxicity execution.
DISCUSSION
Adoptive transfer of natural tumor-reactive or receptor-engineered T cells to cancer patients has shown impressive results in the treatment of specific types of cancers and could broaden to other types of cancers. Comprehensive evaluation of the T cells for infusion could contribute to predicting treatment outcomes and developing more effective ACT. However, current evaluation methodologies cannot fully fulfill this requirement due to several technical challenges, such as single-cell resolution, high-throughput, sensitivity, and combinatory detecting ability. Emerging microtools have the potential to address these technical challenges. HL-Chip technology is one successful example of these microtools and offers four advantages over traditional evaluation methods. First, our CD-chip approach based on the HL-Chip enables quantitative detection of cytokine secretion of single T cells in a polyclonal mixture of TILs or PBMCs. A head-to-head comparison of the CD-chip and the two standard screening methods, ELISpot and ICS, is presented in Table S1. Second, retrieval of desired single cells can be envisioned due to the open architecture of the HL-Chip, which offers an opportunity to integrate on-chip measurements with off-chip follow-up analyses including genetic and/or transcriptional analyses of specific single cells, for example, to identify T cell receptor sequences of specific tumor-reactive T cells. Third, the HL-Chip offers high-throughput and single-cell loading efficiency while preserving the ease of handling. Fourth, the HL-Chip allows the simultaneous detection of single T cell secretions, cytotoxicity, and cell behavior, which provides a more comprehensive assessment of T cells.
Beyond evaluating T cells functions, HL-Chip technology may serve as a universal approach for spatial positioning of two or more objects in a precise and high-throughput manner. This universal approach could be broadly applied to monitor single-cell secretions (Han et al., 2012), study cell-cell communications (Dura et al., 2015) and immunological synapse formation (Jang et al., 2015), barcode bead-based single-cell RNA sequencing (Macosko et al., 2015), generate hybridomas (Skelley et al., 2009), and others (Figure S1N). Several microfluidic systems allow researchers to capture and align single cells in a well-ordered format using specialized structures, such as hooks (Zhang et al., 2014, 2019), weirs (Dura et al., 2015, 2016), dock chambers (Li et al., 2017), or by enclosing cells into droplets (Chokkalingam et al., 2013; Shembekar et al., 2018). However, most microfluidic systems are currently limited to research labs due to sophisticated and labor-intensive fabrication and assembling (especially for multi-layer microfluidic chips) as well as the requirement for peripheral instruments and skills to perform experiments. In contrast, HL-Chips are easy to fabricate, straightforward to handle, and user friendly. In fact, a researcher with no training in microfluidics can handle the loading and cleaning of HL-Chip-based experiments without any difficulty. Furthermore, recovering desirable target cells is straightforward in HL-Chip assays due to the open architecture but is restricted in enclosed microfluidic chips. Compared with conventional microwell chips that suffer from uncontrolled object sedimentation, the HL-Chip demonstrated higher efficiency in the deterministic generation of bead-bead pairs, bead-cell pairs, and multiple other combinations. In addition, the commercial availability of uniform microparticles of many sizes and the ability to combine relative size ratios within a single HL-Chip well makes the HL-Chip a versatile toolbox for trapping different types of cells and beads. By applying microparticles with different sizes to multi-well HL-Chips (e.g., bottom-left structure in Figure S1A), it is possible to simultaneously detect multiple cytokines from single cells in a single assay. Moreover, the HL-Chip could also be used in studying other types of cell-cell interactions, such as NK cell-tumor cell interaction, lymphocyte-antigen-presenting cell interaction, and cellular interactions between more than two cells (e.g., T cells, antigen-presenting cell, and regulatory T cells) with precise and high-throughput cell-cell colocation. Finally, given the modifiable surface attributes of the beads, it is reasonable to envision that the HL-Chip could be applied to single-cell sequencing to maximize the utilization of rare precious primary samples, minimize sample input bias, and consequently produce more accurate results.
In conclusion, we have developed a microwell platform characterized by its simplicity, scalability, versatility, and precision. We demonstrated that the HL-Chip platform can be used in high-throughput longitudinal secretory profiling of single lymphocytes, large-scale evaluation of cytolytic activity of single lymphocytes, and integrated lymphocyte-tumor cell interactions. We envision that the HL-Chip will be valuable for predicting ACT treatment outcomes and developing more effective therapies. The HL-Chip would also be useful in single-cell genomics, transcriptomics, proteomics, as well as cell-cell interaction applications by pairing the parallel capturing and positioning efficiency with combinations of other techniques, such as multiplexed bead barcoding.
STAR★METHODS
RESOURCE AVAILABILITY
Lead Contact
Further information and requests for resources and reagents should be directed to and will be fulfilled by the Lead Contact, Lidong Qin (lqin@houstonmethodist.org). This study did not generate new unique reagents.
Materials Availability
The TILs clone (2B2) from patients with melanoma used in this study is available from the Lead Contact, Lidong Qin (lqin@houstonmethodist.org), upon completion of a materials transfer agreement.
Data and Code Availability
This study did not generate any datasets.
EXPERIMENTAL MODEL AND SUBJECT DETAILS
Cell Lines
PC-3/HLA-A2 and HeLa (ATCC® CCL-2) were cultured in D10 medium (high-glucose DEME supplemented with 10% fetal bovine serum, 100 U/mL Penicillin and 100 μg/mL Streptomycin. Raji cells (ATCC® CCL-86) were cultured in RPMI 1640 medium supplemented with 10% FBS and 100 U/mL Penicillin and 100 μg/mL Streptomycin. HeLa cells and Raji cells were obtained from the American Type Culture Collection (Manassas, VA). The cell lines have not been authenticated. All cells were cultured at 37°C with 5% CO2.
METHOD DETAILS
Device Development
The microwell array pattern of the HL-Chip was drawn with AutoCAD software and printed out as glass photomask by Photo Sciences. Mold bearing microwell arrays were fabricated by modified soft photolithography. Briefly, negative photoresists (SU-8 3025, MicroChem) were spin-coated (500 rpm for 10 s and 1,000 rpm–3,000 rpm for 60 s) onto a clean silicon wafer (Silicon Quest International) to form a uniform 20–50 μm film. After baking at 65°C for 3 min and then 95°C for 5 min, the wafer was cooled and exposed to UV light through the glass photomask for 4–10 s. Next, the wafer was baked at 65°C for 3–5 min and then again at 95°C for 8–14 min. The wafer was developed in a SU-8 developer for 4 min and flushed with fresh developer three to four times. The patterned wafer was thoroughly solidified by baking at 135°C for 30 min. Then, the wafer was treated with trimethylchlorosilane (Sigma-Aldrich) for 30 min. A 10:1 (w/w) mixture of PDMS and curing agent (Sylgard 184, Dow Corning) was poured onto the wafer and heated at 70 C for 1 h. Finally, the cured PDMS sheet was cut and peeled off the wafer.
Generation of PC3/A2 Cell Line and Transduction of NY-ESO-1 T Cells
The PC-3/HLA-A2 cell line was generated by transduction of the PC3 cell line with the HLA-A2 lentivirus plasmid. Lentiviruses were generated by co-transfecting HEK293T cells with pFU3W-A2 plasmid, two packaging plasmids (psPAX2, pMD2.g) using lipofectamine 2,000 (Invitrogen). Viruses were harvested and filtered through a 0.45 μm filter (Millipore) 48 h after transfection. Then, 1 × 10⁵ PC-3 cells were transduced with viral supernatant in the presence of 8 μg/mL Polybrene. HLA-A2 positive cells were sorted. The expression of HLA-A2 was verified with flow cytometry by staining with anti-human phycoerythrin (PE) conjugated HLA-A2 antibody (BD Biosciences, 558570). NY-ESO-1-specific T cell receptor (TCR)-transduced T cells (NY-ESO-1 TCR-T cells) were generated according to previously published protocols (Feldman et al., 2011). Briefly, Phoenix ECO cells were transfected with plasmid DNA (pMSGV1-TCR) using lipofectamine 2,000. Supernatant was harvested for transducing retroviral packaging cell line PG13. PG13 packaging clones were generated by limiting dilution and the clone conferring the highest transduction efficiency was selected for producing virus supernatant. Peripheral blood lymphocytes (PBLs) (Gulf Coast Regional Blood Center, Houston, TX, USA) were isolated with CD8+ Dynabead (Thermo Fisher, 11348D) and stimulated with interleukin-2 (300 IU/mL, Bio-Rad) and OKT3 (50 ng/mL, Thermo Fisher) on day 0. PBLs were then transduced with virus supernatant in non-tissue culture-treated 6-well plate coated with RetroNectin (Takara Bio) on day 2. NY-ESO-1 TCR expression was confirmed by flow cytometry. Staining was performed with FITC conjugated anti-human TCR Vβ 13.1 (eBioscience, 11–5792-41).
Bead–Cell Pairing and Cell–Cell Pairing
Before loading beads or cells, HL-Chips were either coated with human collagen I (0.1 mg/mL, R&D System) or blocked with 1.5% BSA at 37°C for 1 h. For the first round of loading, 20 μL beads or single-cell suspension (3–6 × 10⁶/mL), which conformed to the size of the largest wells, were added on the upper surface of the chips. Iterative brief centrifugations were performed (30 g, 3 s) to facilitate trapping of beads or cells into the largest wells until the desirable capture efficiency was achieved. Unsettled beads or cells were gently rinsed off with PBS, recycled, centrifuged and used for next chips. Then, the second round of loading was performed with 20 μL of a second type of beads or single-cell suspension (2–3 × 10⁶/mL), which matched the size of the second largest wells. Finally, loading a third type of beads or cells suspension (2–3 × 10⁶/mL) into the smallest wells was performed in the same way in tri-well arrays. To remove the stacked cells or beads, 40 μL of PBS was added onto the array. Filter paper strips were put in contact with one corner of the array to swiftly suck the PBS away. Upper layer of the stacked beads and cells will be sucked along with PBS. The array was checked under a microscope to see the removal of upper layer of stacked beads or cells. Such a washing procedure was repeated for three to five times until over washing is seen at the time when as much as 2%–5% wells become empty. Overall, loading of a dual-well array or a tri-well array could be accomplished in 5 min or 10 min, respectively.
On-chip Cytokines Calibration and Detection
To prepare functionalized beads to detect IFN-γ or IL-2, a biotinylated antibody against human IFN-γ (Thermo Fisher, M701B) or a biotinylated antibody against human IL-2 (R&D Systems, BAF202) was conjugated to streptavidin polystyrene beads (mean size: 18.4 μm, Spherotech, SVP-200–4) or streptavidin magnetic beads (mean size: 21.7 μm, Spherotech, SVM-200–4) by shaking beads in 50 μg/mL IFN-γ antibody or IL-2 antibody solution at 4°C overnight in PBS, respectively. After conjugation, beads were washed three time with PBS and stored in 1.5% BSA (w/v) solution. Recombinant human IFN-γ (Thermo Fisher, PHC4031) or IL-2 (Bio-Rad, PHP042) was aliquoted in PBS containing 1% BSA. Next, 0.5–1 3 103 polystyrene beads or magnetic beads were loaded into BSA-blocked chips and incubated with serially diluted human IFN-γ (0, 1.56, 3.12, 6.25, 12.5, 25, 50 and 100 ng/mL for detection using tetrafluorophenyl ester-labeled detection antibody; 0, 0.16, 0.31, 0.62, 1.25, 2.5, 5, and 10 ng/mL for detection using TSA method) or IL-2 (0, 0.16, 0.31, 0.62, 1.25, 2.5, 5, and 10 ng/mL for detection using TSA method) for 2 h at room temperature. The detection antibody was obtained from Thermo Fisher (M700A), labeled with Alexa Fluor-488 according to the manufacturer’s protocol (Thermo Fisher, A20181), and used at a concentration of 4 μg/mL. Between assay steps, the chips were extensively washed with 1.5% BSA. For the TSA method, beads were first incubated with primary rabbit anti-human IFN-γ antibody (Abcam, Ab9657) or rabbit anti-human IL-2 antibody (Abcam, ab92381) at 2 μg/mL at room temperature for 1 h. Afterward, beads were incubated with poly-HRP-conjugated goat anti-rabbit IgG antibody for 1h. A tyramide working solution was prepared according to the manufacturer’s protocol (Thermo Fisher, B40943) and added to the reaction. The reaction was stopped after 4 min of incubation, followed by imaging with a Nikon A1 confocal microscope. Extensive washing with PBST (0.05%) was performed between TSA assay steps.
Computational Modeling of Analyte Capture
To analyze the capture kinetics of cell-secreted analytes in one microwell, we used the Transport of Diluted Species Interface and the Surface Reaction module in COMSOL Multiphysics 5.4 for computational modeling. For simplicity, cells were assumed to secrete at a constant speed, and microwell walls were considered to be impermeable to analytes, convection transport, absorption of analytes onto microwell walls, and surface diffusion of analytes from the bead surface were not considered. The total number of analytes (Ntotal) increased with time:
where κ is the rate of secretion. Although the section rate of live cells may fluctuate over time, this fluctuation depends on cells’ intrinsic status and environment quality. Nevertheless, the constant secretion assumption provides information regarding how analyte concentrations change over time in a liquid solution, on the bead surface, and in different configurations (sealed or open, depth variation of dual-well or tri-well microwell, or conventional cubic microwell).
The bulk concentration of the analyte in liquid solution (C) can be described by Fick’s 2nd law:
where D is the diffusion coefficient of the analyte. The binding of analyte to antibody functionalized beads is a reversible equilibrium process that can be described with the following:
We assume that secreted analyte binding to functionalized antibodies on the bead surface occurs at a 1:1 stoichiometry. The initial concentration in liquid solution and on the bead surface was negligible. The mass balance that describes the dynamics of absorption and desorption of the secreted analyte is determined with the following equation:
where CS is the concentration of the analyte binding on the bead surface, DS is the diffusivity of analyte binding on the beads surface (nearly equal to zero), θ0 is the total number of binding sites on the bead surface, κon is the association constant, and κoff is the disassociation constant. The parameters for simulation in this model, including the rate of secretion, diffusion coefficient (D), (dis)association constant (κ), and total binding sites (θ0), were determined based on values reported from the literatures (An et al., 2017; Han et al., 2010; Torres et al., 2014) or vendors’ technical data sheets (antibody binding affinity). Diameters of the cell and the bead were fixed at 10 μm and 24 μm, respectively. The configurations of wells that were evaluated included 30 μm open and closed dual-well microwell, 50 μm open dual-well microwell, 50 μm open tri-well microwell (cell/bead near-positioned and cell/bead far-positioned) and conventional open cubic microwell (50 × 50 × 50 μm).
Single Cell Cytokine Detection Chip (CD-Chip) Assay
The center-to-center distance between wells was adjusted to 80 mm to reduce possible cross-contamination caused by diffusion. To conduct on-chip assays, HL-Chips were first blocked by immersion in 1.5% BSA at 37°C for 1 h. Functionalized polystyrene beads were then introduced into the chips by brief centrifugation to facilitate trapping. Unsettled beads were rinsed off with PBS, and iterative bead loadings were performed to achieve optimal occupancy. PBLs isolated from a cytomegalovirus seropositive donor (Gulf Coast Regional Blood Center, Houston, TX, USA) or a lab-derived T cell clone (2B2), which specifically recognizes a 25-mer PCDHB16 peptide (with a specific mutation, data not published) from melanoma-reactive tumor-infiltrating lymphocytes (TILs), were thawed two days in advance and cultured in RPMI 1640 medium supplemented with 2 mM Glutamax, 100 IU/mL penicillin, 100 μg/mL streptomycin, 20 mM HEPES, 1% nonessential amino acids, 1 mM sodium pyruvate, 55 μM β-mercaptoethanol, 50 IU IL-2, and 10% human AB serum (TCRPMI). Before experiments, PBLs or TILs were incubated in AIM-V medium (GIBCO) for 16 h. Then, 2–5 × 10⁴ T cells were washed twice with PBS and resuspended in 20 μL AIM-V medium. The single-cell suspension was loaded onto the HL-Chip arrays. For kinetic assessment of IFN-γ capture, 5 mL AIM-V containing phorbol 12-myristate 13-acetate (PMA) (50 ng/mL) and ionomycin (1 μg/mL) or 5 mL AIM-V medium containing dimethyl sulfoxide (DMSO) were added to experimental chips and control chips, respectively. Images were taken at the time of stimulation with PMA and ionomycin (t = 0 h) to record the initial beads and cells occupancy. After incubation at 37°C with 5% CO2 for 2, 4, or 8 h, the chips were imaged for a second time and processed for TSA detection method. For peptide stimulation, clonal TILs (2B2) were treated with the mutated peptide, a wild-type peptide or DMSO for 8 h. PBLs were treated with PP65-peptide (NLVPMVATV, GenScript) or DMSO for 8 h. Stimulated TILs or PBLs were loaded into chips and incubated in 5 mL AIM-V medium for 8 h. IFN-γ secretions were then assessed. Partial secretion and abundant secretion were defined as MFI > 102 and 102.9, respectively. For concurrent detection of IFN-γ and IL-2, functionalized magnetic beads (mean size: 21.7 μm), polystyrene beads (mean size: 18.4 μm) and TILs were sequentially loaded into tri-well chips (25–12-21 μm). Loaded chips were incubated in 5 mL AIM-V containing PMA/ionomycin or DMSO. Fluorescence from consistently positioned, single-cell matched beads was included for manual measurement using ImageJ software (National Institutes of Health). The cell retrieval system included a micromanipulator (MS314, WPI) at a step resolution of 0.5 mm and a microinjector (FemtoJet 4i, Eppendorf) that was previously reported by our lab (Ma et al., 2018) and others (Varadarajan et al., 2012). Transfer tips (Eppendorf) were loaded with 5 μL PBS with a micro-loader (Eppendorf) and then positioned on the top of the chip arrays. By reducing compensation pressure, cells paired with fluorescent beads were brought up into transfer tips and then injected into 96-well plates seeded with irradiated feeder PBLs for clonal expansion.
ICS
Intracellular cytokine staining was performed as previously described (Lamoreaux et al., 2006). Briefly, TILs or PBLs were activated with 50 ng/mL PMA, 1 μg/mL ionomycin (EMD Chemicals) or DMSO for 2, 4, 8 h, or with peptide (10 ug/mL) or 8 h, and monensin (BD Biosciences) was added for the last 2–8 h of incubation. Treated cells were then fixed and permeabilized according to manufacturer’s protocol (BD Biosciences, 554715). Staining was performed with FITC anti-human IFN-γ antibody (Biolegend, 502507).
Dynamics of Immune Cell–Target Cell Interaction and Cytolysis
To maximize unit density, the center-to-center distance between units in dual-well arrays was adjusted to 40 mm, yielding approximately 700 units per mm2 area. PC-3/HLA-A2 cells (PC-3 cell line overexpressing HLA-A2) were either not pulsed, or pulsed with NY-ESO-1157–165 peptide (SLLMWITQC, GenScript) or NY-ESO-V157–165 peptide (SLLMWITQV, GenScript) at a concentration of 10 μg/mL at 37μC for 1.5 h. PC-3/HLA-A2 cells were then stained with 2 μM CellTrace™ Calcein Red-Orange (Thermo Fisher) for 15 min. Additionally, 5–10 3 104 NY-ESO-1 TCR-T cells were stained with 1 μM Vybrant™ DiO (Thermo Fisher) at 37°C for 5 min. Chips were pretreated with 1 μg/mL human collagen I at 37°C for 30 min. Then, the treated tumor cells and T cells were sequentially loaded onto the chips and time-lapse imaging from up to four positions over a whole chip were recorded at2.5 min intervals for 4 h with a Nikon confocal microscope equipped with an environmental chamber, a 20x objective, and an automated stage. NY-ESO-1 TCR-T cells were tracked at each time point manually with ImageJ (n = 211 for T cells interacting with non-pulsed target cells, n = 282 for T cells interacting with NY-ESO-1157–165 peptide pulsed target cells and n = 285 with NY-ESO-V157–165 peptide pulsed target cells). Roundness index (short axis/long axis from green fluorescence channel) of 40 NY-ESO-1 TCR-T cells randomly selected from experiments of interacting with NY-ESO-1157–165 peptide and NY-ESO-V157–165 peptide pulsed-target cells was measured manually at each time point with ImageJ. Fluorescence of target cells was quantified in red fluorescence channel. Distinct decreases of target cells’ fluorescence and morphological signs of death (i.e., blebbing or swelling) was visualized in bright-field channel to determine cell death.
Integrated Single-Cell Analysis of Cytotoxicity and Cytokine Secretion
PC-3/HLA-A2 cells were pulsed with NY-ESO-1157–165 peptide or NY-ESO-V157–165 peptide at a concentration of 10 μg/mL at 37°C for 2 h, followed by staining with 2 μM CellTrace™ Calcein Red-Orange (Thermo Fisher) for 15 min. Additionally, 5 × 10⁴ NY-ESO-1 TCRT cells were stained with 1 μM Vybrant ™ DiD (Thermo Fisher) at 37°C for 5 min. Tri-well chips (24.5–12-21 mm in well diameters, 50 μm in depth, 60 μm in well center-to-center distance) were first treated with human collagen I at 1 μg/mL at 37 °C for 30 min, followed by blocking with 1.5% BSA at 37 °C for 1 h. Treated PC-3/HLA-A2 cells, functionalized beads, and NY-ESO-1 TCR-T cells were sequentially loaded onto the chips, centrifuged to facilitate loading, and flushed with PBS to rinse off unsettled cells or beads. Time-lapse imaging from up to three positions on a chip was recorded at 5 min intervals for 2 or 8 h with a Nikon confocal microscope equipped with an environmental chamber, a 10 × objective, and an automated stage. Quantitative evaluation of target cells’ fluorescence, beads’ fluorescence and cells’ movements was performed with ImageJ. Data visualization as heatmaps were performed using Morpheus (https://software.broadinstitute.org/morpheus/).
QUANTIFICATION AND STATISTICAL ANALYSIS
Statistics Analysis
All statistical details of experiments and the number of experimental replicates can be found in the figure legends. Statistical analysis was performed using GraphPad Prism 8.0. Datasets with Gaussian distributions were compared using unpaired Student’s t tests. Significance was defined as p < 0.05. All error bars in figures indicate the SD from biological replicates unless otherwise stated in the corresponding figure legends.
Supplementary Material
KEY RESOURCES TABLE
| REAGENT or RESOURCE | SOURCE | IDENTIFIER |
|---|---|---|
| Antibodies | ||
| TCR V beta 13.1 monoclonal antibody, FITC | Thermo Fisher Scientific | Cat#11–5792-41; RRID: AB_1944415 |
| PE anti-human HLA-A2 antibody | BD Biosciences | Cat#558570; RRID: AB_647220 |
| IFN gamma monoclonal antibody | Thermo Fisher Scientific | Cat#M700A; RRID: AB_223578 |
| IFN gamma monoclonal antibody, Biotin | Thermo Fisher Scientific | Cat#M701B; RRID: AB_223580 |
| Rabbit anti-human IFN gamma antibody | Abcam | Cat#ab9657; RRID: AB_2123314 |
| Human IL-2 biotinylated antibody | R&D Systems | Cat#BAF202; RRID: AB_356218 |
| Recombinant Rabbit anti-human IL-2 antibody | Abcam | Cat#ab92381; RRID: AB_10564139 |
| CD3 monoclonal antibody | Thermo Fisher Scientific | Cat#14–0037-82; RRID: AB_467057 |
| Biological Samples | ||
| Fetal bovine serum | Thermo Fisher Scientific | Cat#26140079 |
| Human AB serum | Millipore Sigma | Cat#H3667 |
| TILs clone (2B2) from patients with melanoma | This paper | N/A |
| Chemicals, Peptides, and Recombinant Proteins | ||
| NY-ESO-1157–165 (SLLMWITQC), synthetic | GenScript | N/A |
| NY-ESO-V157–165 (SLLMWITQV), synthetic | GenScript | N/A |
| Recombinant human IFN-γ Protein | Thermo Fisher Scientific | Cat#PHC4031 |
| Recombinant human Interleukin-2 | BIO-RAD | Cat#PHP042 |
| DMEM medium | GE Healthcare | Cat#SH30022.01 |
| RPMI 1640 medium | GE Healthcare | Cat#SH30027.01 |
| AIM V medium | Thermo Fisher Scientific | Cat#12055083 |
| Penicillin-Streptomycin | Thermo Fisher Scientific | Cat#15-140-122 |
| GlutaMAX | Thermo Fisher Scientific | Cat#35050061 |
| Dynabead untouched human CD8 T cells | Thermo Fisher Scientific | Cat#11348D |
| Vybrant cell-labeling Kit (DiO, DiL, DiD) | Thermo Fisher Scientific | Cat#V22889 |
| Calcein, AM | Thermo Fisher Scientific | Cat#C3100MP |
| CellTrace Calcein Red-Orange, AM | Thermo Fisher Scientific | Cat#C34851 |
| Critical Commercial Assays | ||
| Alexa Fluor 488 Tyramide SuperBoost Kit | Thermo Fisher Scientific | Cat#B40943 |
| Alexa Fluor 488 Protein Labeling Kit | Thermo Fisher Scientific | Cat#A20181 |
| Experimental Models: Cell Lines | ||
| Human: HeLa cells | ATCC | CCL-2 |
| Human: Raji | ATCC | CCL-86 |
| Software and Algorithms | ||
| Prism 8.0 | GraphPad Software | https://www.graphpad.com/scientific-software/prism/ |
| COMSOL Multiphysics 5.4 | COMSOL | https://cn.comsol.com/comsol-multiphysics/ |
| ImageJ | NIH | https://imagej.nih.gov/ij/ |
| Microsoft Excel | Microsoft | Microsoft Office Suite 2016 |
Highlights.
A hierarchical loading microwell chip (HL-Chip) pairs objects with high efficiency
A high-throughput assay enables single-cell cytokine detection and cell retrieval
The assay system enables simultaneous detection of cytotoxicity and cytokine
The high-throughput HL-Chip enables screening of functional T cells
ACKNOWLEDGMENTS
This work is in part supported by the National Institutes of Health through grants R01 DA035868, R01 AG052507, and R01 AI127704 to L.Q. and by grants (R01CA101795 and 1U54CA210181) from the National Cancer Institute (NCI), the National Institutes of Health (NIH), and Department of Defense (DOD) (W81XWH-16-1-0417) to R.-F.W. Y.Z. was also supported by Xiangya Exchange Scholars Program. We would like to thank Dr. Bingnan Yin and Dr. Chen Qian (Houston Methodist Research Institute, Houston, TX, USA) for PC3/HLA-A2 cell line and the T cell clone.
Footnotes
SUPPLEMENTAL INFORMATION
Supplemental Information can be found online at https://doi.org/10.1016/j.celrep.2020.107574.
DECLARATION OF INTERESTS
The authors declare no competing interests.
REFERENCES
- An X, Sendra VG, Liadi I, Ramesh B, Romain G, Haymaker C, Martinez-Paniagua M, Lu Y, Radvanyi LG, Roysam B, and Varadarajan N (2017). Single-cell profiling of dynamic cytokine secretion and the phenotype of immune cells. PLoS ONE 12, e0181904. [DOI] [PMC free article] [PubMed] [Google Scholar]
- Beal AM, Anikeeva N, Varma R, Cameron TO, Vasiliver-Shamis G, Norris PJ, Dustin ML, and Sykulev Y (2009). Kinetics of early T cell receptor signaling regulate the pathway of lytic granule delivery to the secretory domain. Immunity 31, 632–642. [DOI] [PMC free article] [PubMed] [Google Scholar]
- Chattopadhyay PK, Gierahn TM, Roederer M, and Love JC (2014). Single-cell technologies for monitoring immune systems. Nat. Immunol 15, 128–135. [DOI] [PMC free article] [PubMed] [Google Scholar]
- Chen JL, Dunbar PR, Gileadi U, Jäger E, Gnjatic S, Nagata Y, Stock-ert E, Panicali DL, Chen YT, Knuth A, et al. (2000). Identification of NYESO-1 peptide analogues capable of improved stimulation of tumor-reactive CTL. J. Immunol 165, 948–955. [DOI] [PubMed] [Google Scholar]
- Chokkalingam V, Tel J, Wimmers F, Liu X, Semenov S, Thiele J, Figdor CG, and Huck WT (2013). Probing cellular heterogeneity in cytokine-secreting immune cells using droplet-based microfluidics. Lab Chip 13, 4740–4744. [DOI] [PubMed] [Google Scholar]
- Davis DM (2009). Mechanisms and functions for the duration of intercellular contacts made by lymphocytes. Nat. Rev. Immunol 9, 543–555. [DOI] [PubMed] [Google Scholar]
- de la Roche M, Asano Y, and Griffiths GM (2016). Origins of the cytolytic synapse. Nat. Rev. Immunol 16, 421–432. [DOI] [PubMed] [Google Scholar]
- de Saint Basile G, Ménasché G, and Fischer A (2010). Molecular mechanisms of biogenesis and exocytosis of cytotoxic granules. Nat. Rev. Immunol 10, 568–579. [DOI] [PubMed] [Google Scholar]
- Dura B, Dougan SK, Barisa M, Hoehl MM, Lo CT, Ploegh HL, and Voldman J (2015). Profiling lymphocyte interactions at the single-cell level by microfluidic cell pairing. Nat. Commun 6, 5940. [DOI] [PubMed] [Google Scholar]
- Dura B, Servos MM, Barry RM, Ploegh HL, Dougan SK, and Voldman J (2016). Longitudinal multiparameter assay of lymphocyte interactions from onset by microfluidic cell pairing and culture. Proc. Natl. Acad. Sci. USA 113, E3599–E3608. [DOI] [PMC free article] [PubMed] [Google Scholar]
- Dustin ML (2008). Hunter to gatherer and back: immunological synapses and kinapses as variations on the theme of amoeboid locomotion. Annu. Rev. Cell Dev. Biol 24, 577–596. [DOI] [PubMed] [Google Scholar]
- Dustin ML (2009). The cellular context of T cell signaling. Immunity 30, 482–492. [DOI] [PMC free article] [PubMed] [Google Scholar]
- Dustin ML, and Long EO (2010). Cytotoxic immunological synapses. Immunol. Rev 235, 24–34. [DOI] [PMC free article] [PubMed] [Google Scholar]
- Faroudi M, Utzny C, Salio M, Cerundolo V, Guiraud M, Müller S, and Valitutti S (2003). Lytic versus stimulatory synapse in cytotoxic T lymphocyte/target cell interaction: manifestation of a dual activation threshold. Proc. Natl. Acad. Sci. USA 100, 14145–14150. [DOI] [PMC free article] [PubMed] [Google Scholar]
- Feldman SA, Goff SL, Xu H, Black MA, Kochenderfer JN, Johnson LA, Yang JC, Wang Q, Parkhurst MR, Cross S, et al. (2011). Rapid production of clinical-grade gammaretroviral vectors in expanded surface roller bottles using a “modified” step-filtration process for clearance of packaging cells. Hum. Gene Ther 22, 107–115. [DOI] [PMC free article] [PubMed] [Google Scholar]
- Han Q, Bradshaw EM, Nilsson B, Hafler DA, and Love JC (2010). Multidimensional analysis of the frequencies and rates of cytokine secretion from single cells by quantitative microengraving. Lab Chip 10, 1391–1400. [DOI] [PMC free article] [PubMed] [Google Scholar]
- Han Q, Bagheri N, Bradshaw EM, Hafler DA, Lauffenburger DA, and Love JC (2012). Polyfunctional responses by human T cells result from sequential release of cytokines. Proc. Natl. Acad. Sci. USA 109, 1607–1612. [DOI] [PMC free article] [PubMed] [Google Scholar]
- Jäger E, Nagata Y, Gnjatic S, Wada H, Stockert E, Karbach J, Dunbar PR, Lee SY, Jungbluth A, Jäger D, et al. (2000). Monitoring CD8 T cell responses to NY-ESO-1: correlation of humoral and cellular immune responses. Proc. Natl. Acad. Sci. USA 97, 4760–4765. [DOI] [PMC free article] [PubMed] [Google Scholar]
- Jang JH, Huang Y, Zheng P, Jo MC, Bertolet G, Zhu MX, Qin L, and Liu D (2015). Imaging of Cell-Cell Communication in a Vertical Orientation Reveals High-Resolution Structure of Immunological Synapse and Novel PD-1 Dynamics. J. Immunol 195, 1320–1330. [DOI] [PMC free article] [PubMed] [Google Scholar]
- Jenkins MR, Tsun A, Stinchcombe JC, and Griffiths GM (2009). The strength of T cell receptor signal controls the polarization of cytotoxic machinery to the immunological synapse. Immunity 31, 621–631. [DOI] [PMC free article] [PubMed] [Google Scholar]
- Jin A, Ozawa T, Tajiri K, Obata T, Kondo S, Kinoshita K, Kadowaki S, Takahashi K, Sugiyama T, Kishi H, and Muraguchi A (2009). A rapid and efficient single-cell manipulation method for screening antigen-specific antibody-secreting cells from human peripheral blood. Nat. Med 15, 1088–1092. [DOI] [PubMed] [Google Scholar]
- June CH, O’Connor RS, Kawalekar OU, Ghassemi S, and Milone MC (2018). CAR T cell immunotherapy for human cancer. Science 359, 1361–1365. [DOI] [PubMed] [Google Scholar]
- Lamoreaux L, Roederer M, and Koup R (2006). Intracellular cytokine optimization and standard operating procedure. Nat. Protoc 1, 1507–1516. [DOI] [PubMed] [Google Scholar]
- Li Y, Jang JH, Wang C, He B, Zhang K, Zhang P, Vu T, and Qin LJAB (2017). Microfluidics Cell Loading-Dock System. Ordered Cellular Array for Dynamic Lymphocyte-Communication Study. 1, 1700085. [DOI] [PubMed] [Google Scholar]
- Linnemann C, van Buuren MM, Bies L, Verdegaal EM, Schotte R, Calis JJ, Behjati S, Velds A, Hilkmann H, Atmioui DE, et al. (2015). High-throughput epitope discovery reveals frequent recognition of neo-antigens by CD4+ T cells in human melanoma. Nat. Med 21, 81–85. [DOI] [PubMed] [Google Scholar]
- Love JC, Ronan JL, Grotenbreg GM, van der Veen AG, and Ploegh HL (2006). A microengraving method for rapid selection of single cells producing antigen-specific antibodies. Nat. Biotechnol 24, 703–707. [DOI] [PubMed] [Google Scholar]
- Lu Y, Xue Q, Eisele MR, Sulistijo ES, Brower K, Han L, Amir AD, Pe’er D, Miller-Jensen K, and Fan R (2015). Highly multiplexed profiling of single-cell effector functions reveals deep functional heterogeneity in response to pathogenic ligands. Proc. Natl. Acad. Sci. USA 112, E607–E615. [DOI] [PMC free article] [PubMed] [Google Scholar]
- Ma C, Fan R, Ahmad H, Shi Q, Comin-Anduix B, Chodon T, Koya RC, Liu CC, Kwong GA, Radu CG, et al. (2011). A clinical microchip for evaluation of single immune cells reveals high functional heterogeneity in pheno-typically similar T cells. Nat. Med 17, 738–743. [DOI] [PMC free article] [PubMed] [Google Scholar]
- Ma Y, Han X, de Castro RB, Zhang P, Zhang K, Hu Z, and Qin L (2018). Analysis of the bystander effect in cone photoreceptors via a guided neural network platform . Sci. Adv 4, eaas9274. [DOI] [PMC free article] [PubMed] [Google Scholar]
- Macosko EZ, Basu A, Satija R, Nemesh J, Shekhar K, Goldman M, Tirosh I, Bialas AR, Kamitaki N, Martersteck EM, et al. (2015). Highly Parallel Genome-wide Expression Profiling of Individual Cells Using Nanoliter Droplets. Cell 161, 1202–1214. [DOI] [PMC free article] [PubMed] [Google Scholar]
- Moreau HD, Lemaître F, Terriac E, Azar G, Piel M, Lennon-Dumenil AM, and Bousso P. (2012). Dynamic in situ cytometry uncovers T cell receptor signaling during immunological synapses and kinapses in vivo. Immunity 37, 351–363. [DOI] [PubMed] [Google Scholar]
- Olofsson PE, Forslund E, Vanherberghen B, Chechet K, Mickelin O, Ahlin AR, Everhorn T, and Onfelt B (2014). Distinct Migration and Contact Dynamics of Resting and IL-2-Activated Human Natural Killer Cells. Front. Immunol 5, 80. [DOI] [PMC free article] [PubMed] [Google Scholar]
- Prakadan SM, Shalek AK, and Weitz DA (2017). Scaling by shrinking: empowering single-cell ‘omics’ with microfluidic devices. Nat. Rev. Genet 18, 345–361. [DOI] [PMC free article] [PubMed] [Google Scholar]
- Rapoport AP, Stadtmauer EA, Binder-Scholl GK, Goloubeva O, Vogl DT, Lacey SF, Badros AZ, Garfall A, Weiss B, Finklestein J, et al. (2015). NY-ESO-1-specific TCR-engineered T cells mediate sustained antigen-specific antitumor effects in myeloma. Nat. Med 21, 914–921. [DOI] [PMC free article] [PubMed] [Google Scholar]
- Rissin DM, Kan CW, Campbell TG, Howes SC, Fournier DR, Song L, Piech T, Patel PP, Chang L, Rivnak AJ, et al. (2010). Single-molecule enzyme-linked immunosorbent assay detects serum proteins at subfemtomolar concentrations. Nat. Biotechnol 28, 595–599. [DOI] [PMC free article] [PubMed] [Google Scholar]
- Rosenberg SA, and Restifo NP (2015). Adoptive cell transfer as personalized immunotherapy for human cancer. Science 348, 62–68. [DOI] [PMC free article] [PubMed] [Google Scholar]
- Rosenberg SA, Restifo NP, Yang JC, Morgan RA, and Dudley ME (2008). Adoptive cell transfer: a clinical path to effective cancer immuno-therapy. Nat. Rev. Cancer 8, 299–308. [DOI] [PMC free article] [PubMed] [Google Scholar]
- Saletti G, Çuburu N, Yang JS, Dey A, and Czerkinsky C (2013). Enzyme-linked immunospot assays for direct ex vivo measurement of vaccine-induced human humoral immune responses in blood. Nat. Protoc 8, 1073–1087. [DOI] [PubMed] [Google Scholar]
- Segaliny AI, Li G, Kong L, Ren C, Chen X, Wang JK, Baltimore D, Wu G, and Zhao W (2018). Functional TCR T cell screening using single-cell droplet microfluidics. Lab Chip 18, 3733–3749. [DOI] [PMC free article] [PubMed] [Google Scholar]
- Shao N, and Qin L (2018). Biochips—New Platforms for Cell-Based Immunological Assays. Small Methods 2, 1700254. [Google Scholar]
- Shembekar N, Hu H, Eustace D, and Merten CA (2018). Single-Cell Droplet Microfluidic Screening for Antibodies Specifically Binding to Target Cells. Cell Rep. 22, 2206–2215. [DOI] [PMC free article] [PubMed] [Google Scholar]
- Sinha N, Subedi N, and Tel J (2018). Integrating Immunology and Microfluidics for Single Immune Cell Analysis. Front. Immunol 9, 2373. [DOI] [PMC free article] [PubMed] [Google Scholar]
- Skelley AM, Kirak O, Suh H, Jaenisch R, and Voldman J (2009). Micro-fluidic control of cell pairing and fusion. Nat. Methods 6, 147–152. [DOI] [PMC free article] [PubMed] [Google Scholar]
- Torres AJ, Hill AS, and Love JC (2014). Nanowell-based immunoassays for measuring single-cell secretion: characterization of transport and surface binding. Anal. Chem 86, 11562–11569. [DOI] [PMC free article] [PubMed] [Google Scholar]
- Vanherberghen B, Olofsson PE, Forslund E, Sternberg-Simon M, Khorshidi MA, Pacouret S, Guldevall K, Enqvist M, Malmberg KJ, Mehr R, andÖnfelt B (2013). Classification of human natural killer cells based on migration behavior and cytotoxic response. Blood 121, 1326–1334. [DOI] [PubMed] [Google Scholar]
- Varadarajan N, Julg B, Yamanaka YJ, Chen H, Ogunniyi AO, McAndrew E, Porter LC, Piechocka-Trocha A, Hill BJ, Douek DC, et al. (2011). A high-throughput single-cell analysis of human CD8+ T cell functions reveals discordance for cytokine secretion and cytolysis. J. Clin. Invest 121, 4322–4331. [DOI] [PMC free article] [PubMed] [Google Scholar]
- Varadarajan N, Kwon DS, Law KM, Ogunniyi AO, Anahtar MN, Richter JM, Walker BD, and Love JC (2012). Rapid, efficient functional characterization and recovery of HIV-specific human CD8+ T cells using micro-engraving. Proc. Natl. Acad. Sci. USA 109, 3885–3890. [DOI] [PMC free article] [PubMed] [Google Scholar]
- Wang RF, and Wang HY (2017). Immune targets and neoantigens for cancer immunotherapy and precision medicine. Cell Res. 27, 11–37. [DOI] [PMC free article] [PubMed] [Google Scholar]
- Wiedemann A, Depoil D, Faroudi M, and Valitutti S (2006). Cytotoxic T lymphocytes kill multiple targets simultaneously via spatiotemporal uncoupling of lytic and stimulatory synapses. Proc. Natl. Acad. Sci. USA 103, 10985–10990. [DOI] [PMC free article] [PubMed] [Google Scholar]
- Yamanaka YJ, Berger CT, Sips M, Cheney PC, Alter G, and Love JC (2012). Single-cell analysis of the dynamics and functional outcomes of interactions between human natural killer cells and target cells. Integr. Biol 4, 1175–1184. [DOI] [PubMed] [Google Scholar]
- Zacharakis N, Chinnasamy H, Black M, Xu H, Lu YC, Zheng Z, Pasetto A, Langhan M, Shelton T, Prickett T, et al. (2018). Immune recognition of somatic mutations leading to complete durable regression in metastatic breast cancer. Nat. Med 24, 724–730. [DOI] [PMC free article] [PubMed] [Google Scholar]
- Zhang K, Chou CK, Xia X, Hung MC, and Qin L (2014). Block-Cell-Printing for live single-cell printing. Proc. Natl. Acad. Sci. USA 111, 2948–2953. [DOI] [PMC free article] [PubMed] [Google Scholar]
- Zhang P, Han X, Yao J, Shao N, Zhang K, Zhou Y, Zu Y, Wang B, and Qin L (2019). High-Throughput Isolation of Cell Protrusions with Single-Cell Precision for Profiling Subcellular Gene Expression. Angew. Chem. Int. Ed. Engl 58, 13700–13705. [DOI] [PMC free article] [PubMed] [Google Scholar]
Associated Data
This section collects any data citations, data availability statements, or supplementary materials included in this article.
Supplementary Materials
Data Availability Statement
This study did not generate any datasets.