Dear Editor
The majority of COVID-19 public health and media messaging in the USA has focused on major outbreaks in densely populated urban areas, including New York City, New Orleans and Seattle. This attention is indeed warranted, as the number of deaths is an important indicator of outbreak severity and informs public health, medical and government responses. In addition to case rates and the number of deaths, the case fatality rate is another epidemiologic tool used in disease surveillance and is helpful in illuminating disparities between urban and rural populations. Case fatality rates account for the number of deaths (numerator) and the number of reported cases (denominator), allowing for direct comparisons of the mortality burden of a disease between areas where the reported case rates may differ.
This analysis used data from the New York Times’ ongoing COVID-19 data repository1 to calculate case fatality rates (%) by US county (21 January 2020 – 28 April 2020). Data from the COVID-19 data repository were combined with the US Census Bureau’s American Community Survey2 to calculate case rates (per 100 000 county residents). Waldorf and Kim’s Index of Relative Rurality (IRR; 0=very urban, 1=very rural)3,4 was used to generate an IRR score for each county, which was then merged with the COVID-19 repository data by county. The final sample included 2542 US counties. Univariate linear regression was used to predict case rates and case fatality rates from IRR score. Predicted values were plotted to illustrate differences in case rates and case fatality rates by IRR score.
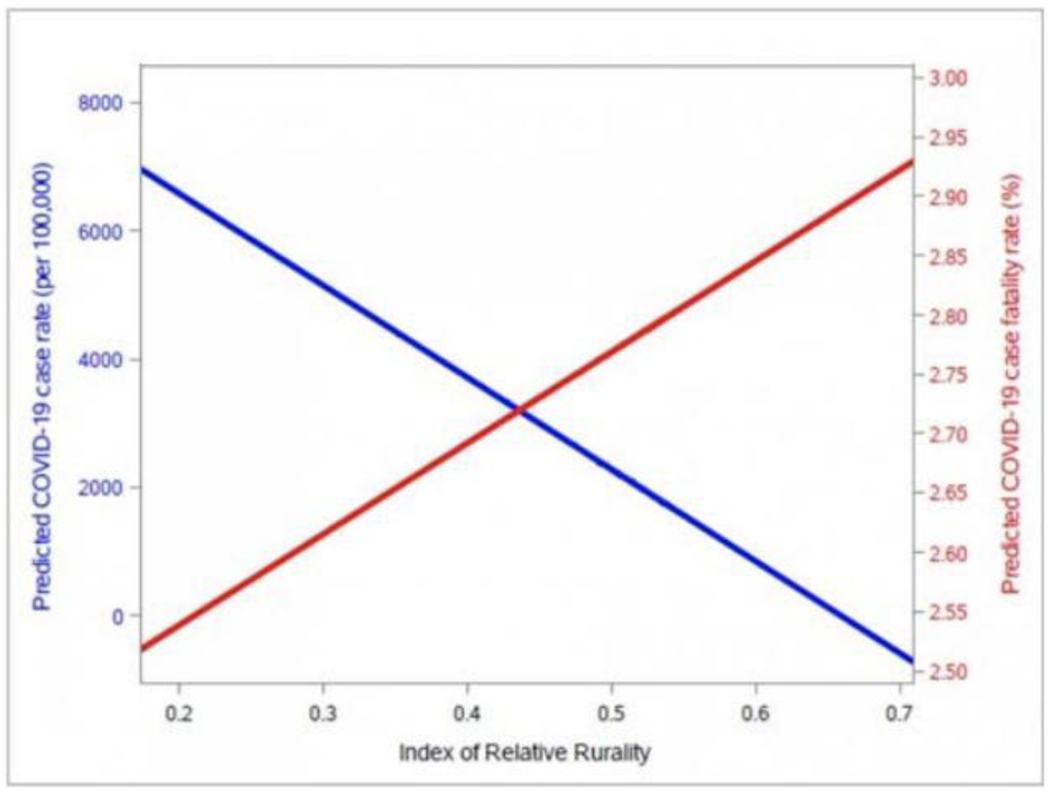
The mean IRR score was 0.47. The mean predicted case rate was 2397 (per 100 000 county residents), and the mean predicted case fatality rate was 2.7%. The predicted COVID-19 case rate decreased as counties became more rural (β= −1431.08; 95% confidence interval (CI)= −1617.77, −1244.39; p<0.0001) (Fig1). However, the predicted case fatality rate increased as counties became more rural (β=0.08; 95%CI=0.03, 0.13; p<0.0001), from roughly 2.5% in very urban areas to 2.9% in very rural areas.
Figure 1.

US COVID-19 case rates and case fatality rates by rurality.
The mortality burden of COVID-19 is exceptionally high in rural areas in the USA, despite the country’s overall lower rate of cases. These findings highlight the need to concentrate resources in not only areas where case rates and crude numbers of deaths are high, but also underserved rural areas where the case fatality rate is disproportionately high. Many rural areas face substantial challenges in disease surveillance, testing and treatment. Challenges range from hospital capacity, long distances between residences and testing sites, access to life-saving treatment such as ventilators, and underlying health and socioeconomic conditions that may exacerbate the severity of COVID-19 infections.
Each county’s testing capacity influences its case fatality rate, but county-level testing data are not yet publicly available. Importantly, case fatality rates may be overestimated in counties with limited testing, where asymptomatic or milder cases are less likely to be screened and are not included in the denominator. The exclusion of testing rates as a confounder is a limitation of this study.
The US and international responses to the COVID-19 pandemic must include plans for strengthening rural health systems, most notably in the form of improving access to treatment for severe cases. Future studies are needed to identify leverage points for increased and sustained funding for pandemic and emergency preparedness. In addition, county-level data on daily testing prevalence is an important factor in epidemiologic surveillance and should be made publicly available. Finally, public health interventions responding to the pandemic should target vulnerable and underserved populations.
Footnotes
Ethics Approval
The analyses for this research letter were based on secondary, county-level aggregate data on COVID-19 case rates. No individual-level data was accessed or used. All data and results are on the US county level, and used publicly available national data.
Contributor Information
George Pro, Assistant Professor, Department of Health Behavior and Health Education, Fay W. Boozman College of Public Health, University of Arkansas for Medical Sciences, Little Rock, AR.
Randolph Hubach, Center for Rural Health, Oklahoma State University, Tulsa, OK.
Denna Wheeler, Center for Rural Health, Oklahoma State University, Tulsa, OK.
Ricky Camplain, Assistant Professor, Department of Health Sciences, Southwest Health Equity Research Collaborative, Northern Arizona University, Flagstaff, AZ.
Shane Haberstroh, Professor, Department of Educational Psychology, Northern Arizona University, Flagstaff, AZ.
Zach Giano, Center for Rural Health, Oklahoma State University, Tulsa, OK.
Carolyn Camplain, Center for Health Equity Research, Northern Arizona University, Flagstaff, AZ.
Julie A Baldwin, Regents’ Professor, Department of Health Sciences, Director, Center for Health Equity Research, Northern Arizona University, Flagstaff, AZ.
References
- 1.New York Times. COVID-19 data. 2020. Available: https://github.com/nytimes/covid-19-data (Accessed 13 August 2020).
- 2.United States Census Bureau. American Community Survey data. 2019. Available: https://www.census.gov/programs-surveys/acs/data.html (Accessed 13 August 2020).
- 3.Waldorf BS. A continuous multi-dimensional measure of rurality: moving beyond threshold measures. Paper presented at the Annual Meetings of the Association of Agricultural Economics, Long Beach, CA, 2006. Available: http://ageconsearch.umn.edu/record/21383/files/sp06wa02.pdf (Accessed 13 August 2020). [Google Scholar]
- 4.Waldorf BS, Kim A. Defining and measuring rurality in the US: from typologies to continuous indices. Paper presented at the Workshop on Rationalizing Rural Area Classifications, Washington, DC, 2015. Available: http://sites.nationalacademies.org/cs/groups/dbassesite/documents/webpage/dbasse_167036.pdf (Accessed 13 August 2020). [Google Scholar]


